Programmed genome editing of the omega-1 ribonuclease of the blood fluke, Schistosoma mansoni
- George Washington University, United States
- Wellcome Sanger Institute, Wellcome Genome Campus, United Kingdom
- Khon Kaen University, Thailand
- University of Maryland, United States
- National Heart, Lungs and Blood Institute, National Institutes of Health, United States
- Mahidol University, Thailand
- Biomedical Research Institute, United States
- Leiden University Medical Center, Netherlands
- Aberystwyth University, United Kingdom
Figures
Figure 1 with 1 supplement
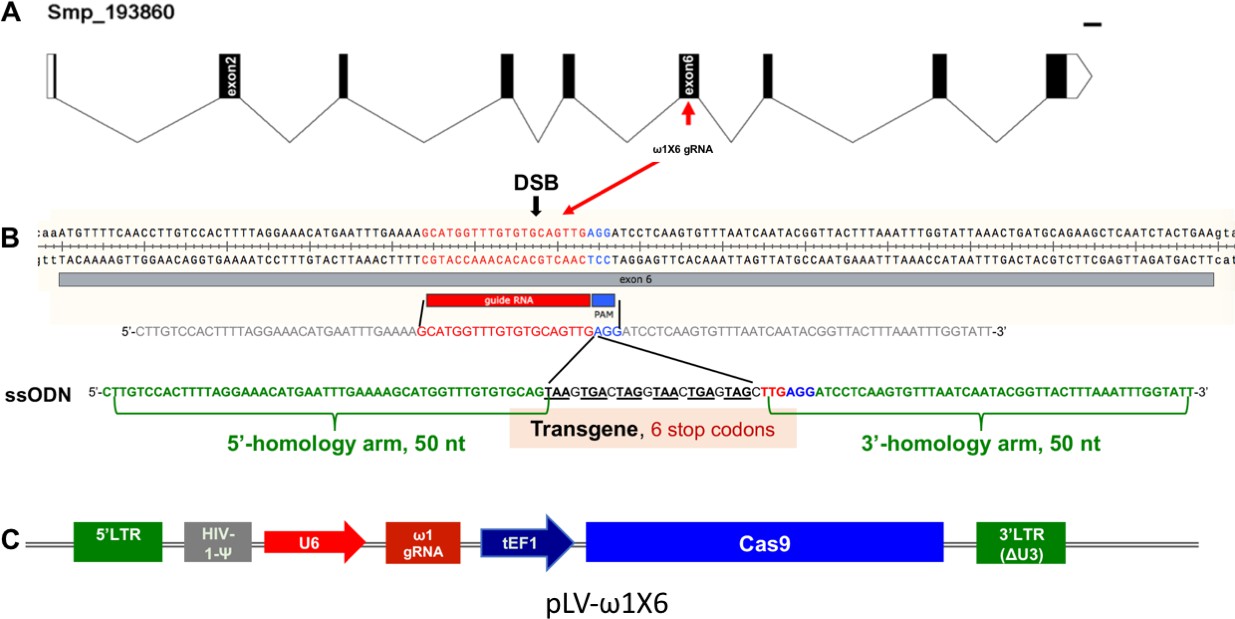
Genomic structure of the locus encoding omega-1 (ω1) in the genome of S.mansoni, guide RNA and CRISPR/Cas9 encoding construct.
(A) Gene model of ω1 (Smp_193860), showing the position of its nine exons, eight introns and UTRs 6,196 bp on chromosome 1. (B) Nucleotide sequence in exon six indicating location and sequence of gRNA target site, predicted double-stranded break (DSB) (arrow), protospacer adjacent motif (PAM) (AGG, blue box), and 124-nucleotide sequence of the single-stranded DNA donor template provided for DSB repair by homologous recombination. Homology arms of 50 nt flank a central 24 nt of six-stop-codon transgene. (C) Linear map of pLV-ω1X6 showing position of regulatory and coding regions for CRISPR/Cas9 editing; the positions of the human U6 promoter to drive ω1 gRNA, the translational elongation factor EF1-α promoter driving Cas9 from S. pyogenes, and the left and right long terminal repeats of the lentiviral vector derived from HIV-1.
Figure 1—figure supplement 1
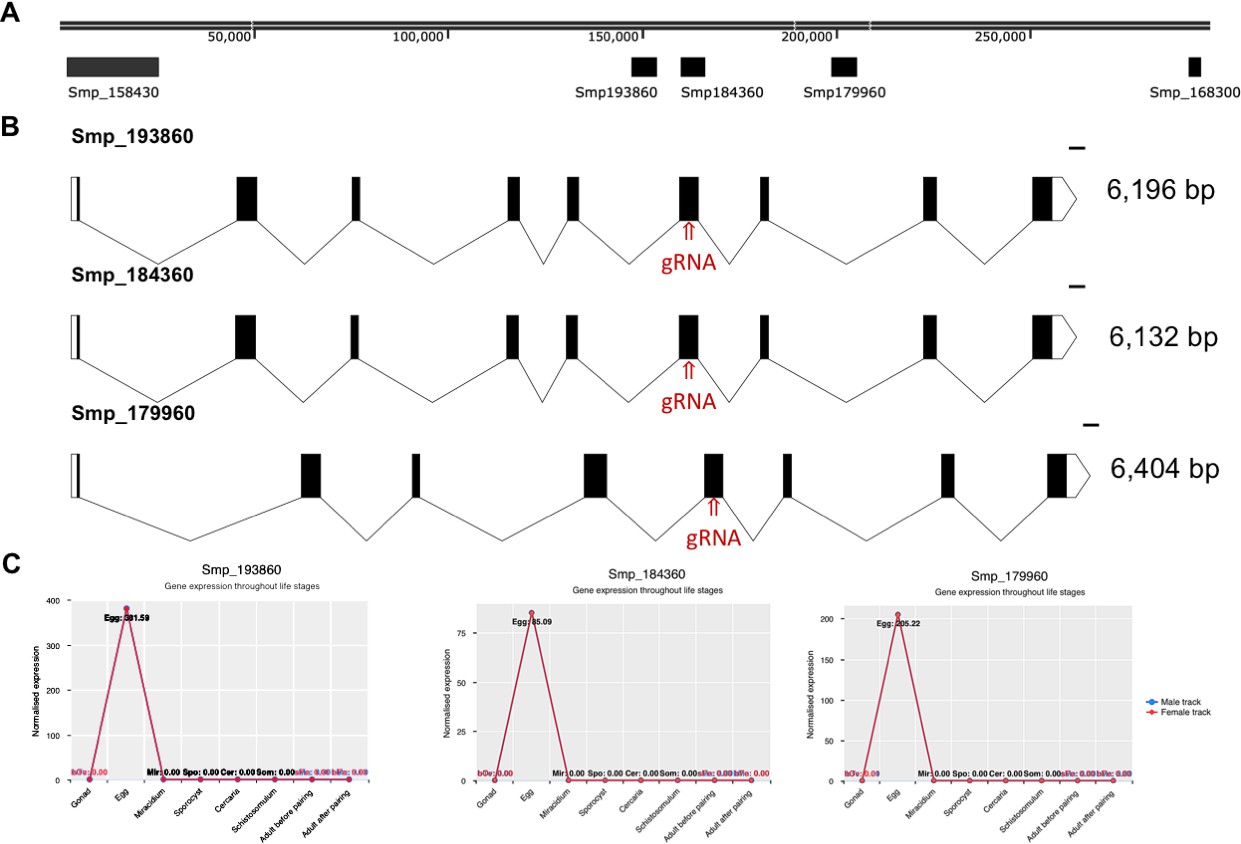
The T2 ribonuclease ω1 is encoded by at least five gene copies located on S.
mansoni chromosome 1. (A) The position of several genes coding for ω1, including Smp_179960, Smp_184360, Smp_193860 are shown, to indicate the physical relationship of the copies on the chromosome. Two additional copies of ω1, Smp_158430 and Smp_168300 do not include the cognate sgRNA and PAM motifs. (B) Map of gene structure and size of Smp_179960, Smp_184360, Smp_193860, along with the ω1-specific sgRNA target site. C, Normalized expression of three copies of ω1 as indicated throughout the developmental stages of S. mansoni. The profile of developmental expression of ω1 was established by meta-analysis of RNAseq reads (Lu et al., 2018).
Figure 2 with 4 supplements
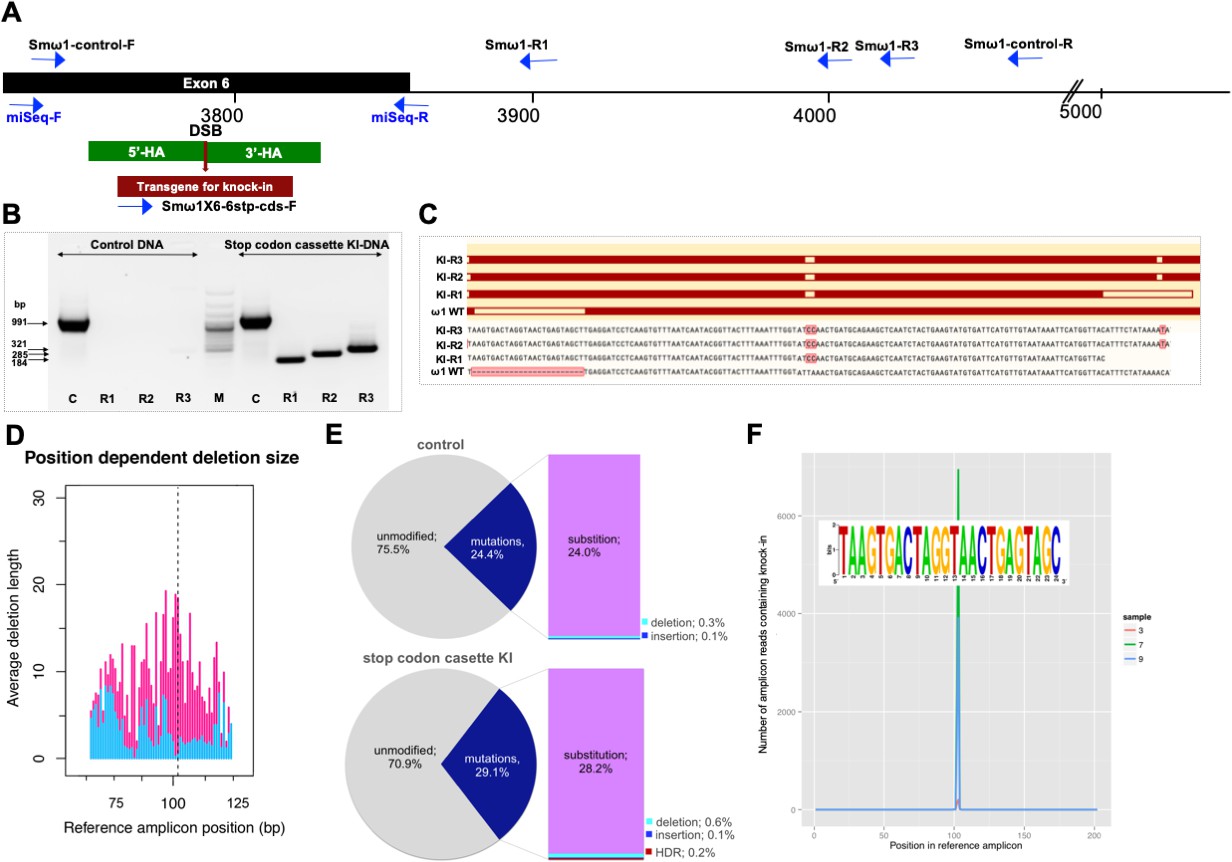
Programmed chromosomal break at ω1 locus repaired by homologous recombination from donor template.
(A) Schematic diagram to indicate positions of primer binding sites (blue arrows), with the foreign gene cassette as the forward primer (Smω1X6–6 stop codons cassette-F) paired with three discrete reverse primers, Smω1-R1, Smω1-R2 and Smω1-R3 from the ω1 locus and a primer pair for target amplicon NGS library amplification; miSeq-F and miSeq-R. The control PCR amplicon was generated using the Smω1-control-F and –R primers. The green box shows the location of 5’ and 3’ homology arms, the red box and arrow indicate the stop codon bearing transgene. (B) PCR products visualized in ethidium bromide-stained agarose gel demonstrating Cas9-catalyzed target site-specific insertional mutagenesis in exon 6 of the ω1 gene. Evidence for transgene knocked-in into programmed target site revealed by amplicons of the expected sizes in lanes R1, R2 and R3, of 184, 285 and 321 bp, respectively (arrows at left) spanned the mutated site in the genomic DNAs pooled from schistosome eggs, including a positive control flanking the insert site (991 bp). The control DNA result shown in this gel was isolated from heat-inactivated-pLV-ω1X6 virions and ssODN treated LE. Similar findings were obtained when programmed gene editing was executed by lentiviral virion-delivered Cas9 and ω1-gRNA transgenes and by ribonucleoprotein complex (RNP) delivered by square wave electroporation (supporting information). The non-KI control groups (sgRNA only, heat-inactivated pLV-ω1X6 virions only, ssODN only) showed no amplicons by stop cassette-KI primers with R1, R2 or R3. (C) Multiple sequence alignments confirmed the presence of the 24 nt transgene inserted precisely into exon 6 of ω1 locus from KI-R1, -R2 and -R3 fragments compared with ω1 wild type (WT). The white box on ω1-WT indicates the absence of the transgene sequence and white boxes on KI-R1, -R2 and –R3 fragments show locations of substitutions relative to the other ω1 copies (Smp_184360): 2 bp (AT to CC) mismatches at positions 253–254 nt. All three contained the (knock-in) insertion sequence (white box), which confirmed targeted mutation of the ω1 gene. (D–F) Illumina deep sequence analysis of amplicon libraries revealed Cas9 induced on-target repair of programmed gene mutation of the ω1 locus by deletions, insertions, and substitutions by CRISPResso analysis. D; position dependent deletion size (deletion site, X-axis; deletion size, Y-axis); the deletions varied in length from point mutations to >20 bp adjacent to the DSB. The dotted line indicates the predicted position of the programmed double-stranded break. (E), frequency of frameshift versus in-frame mutations reported by CRISPResso. The pie charts show the fraction of all mutations (indels and substitutions) in the coding region (positions 42–179) of the amplicon predicted to induce frameshifts, that is indels of 1–2 bp, or multiples thereof. Top graph corresponds to sample 2 (eggs only control) (Supplementary file 3), bottom graph corresponds to sample 9 (eggs exposed to virions and ssODN, that is CRISPR/Cas9-treated) (Supplementary file 3). Findings for control and treated samples are provided in Supplementary File 3. (F), Frequency distribution of insertions of the knock-in transgene. Number of amplicon reads containing an insertion of the knock-in sequence (with ≥75% identity to it) is shown in the Y-axis, and the position of the insertion relative to the reference amplicon is shown on the X-axis. The programmed Cas9 scission lies between positions 102 and 103. Samples 3, 7 and 9 are independent amplicon libraries (technical replicates) made from the same sample of genomic DNA pooled from six biological replicates exposed to virions and ssODN. The insert shows a sequence logo, created using WebLogo (Crooks et al., 2004), of the sequences of the 3826 sequence reads from samples 3, 7 and 9, with insertions of 24 bp at position 102; most matched the donor template, TAAGTGACTAGGTAACTGAGTAGC.
Figure 2—figure supplement 1
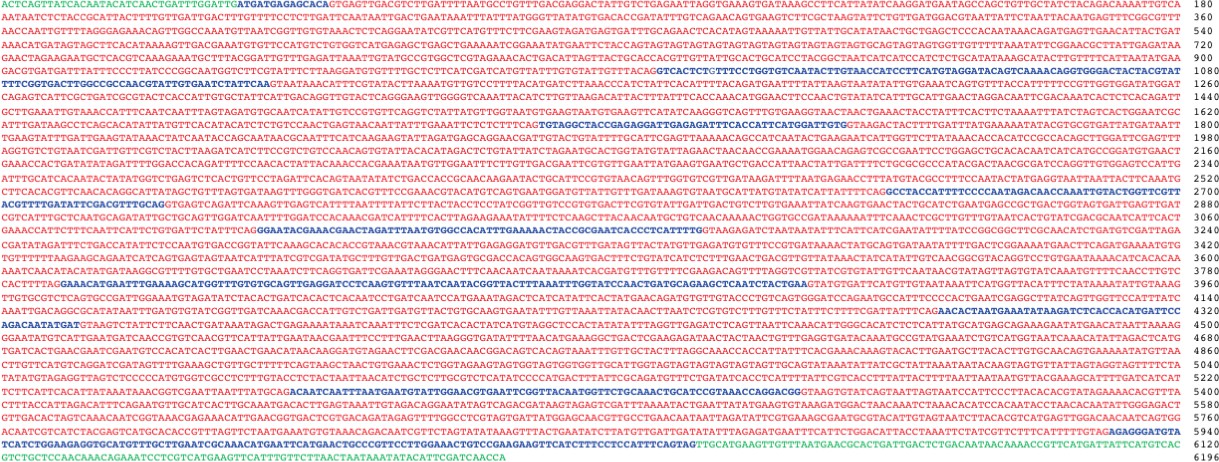
The nucleotide sequence of the Smp_193860 copy, and indicates the UTR (green), coding exons (blue) and introns (red).
https://doi.org/10.7554/eLife.41337.006
Figure 2—figure supplement 2
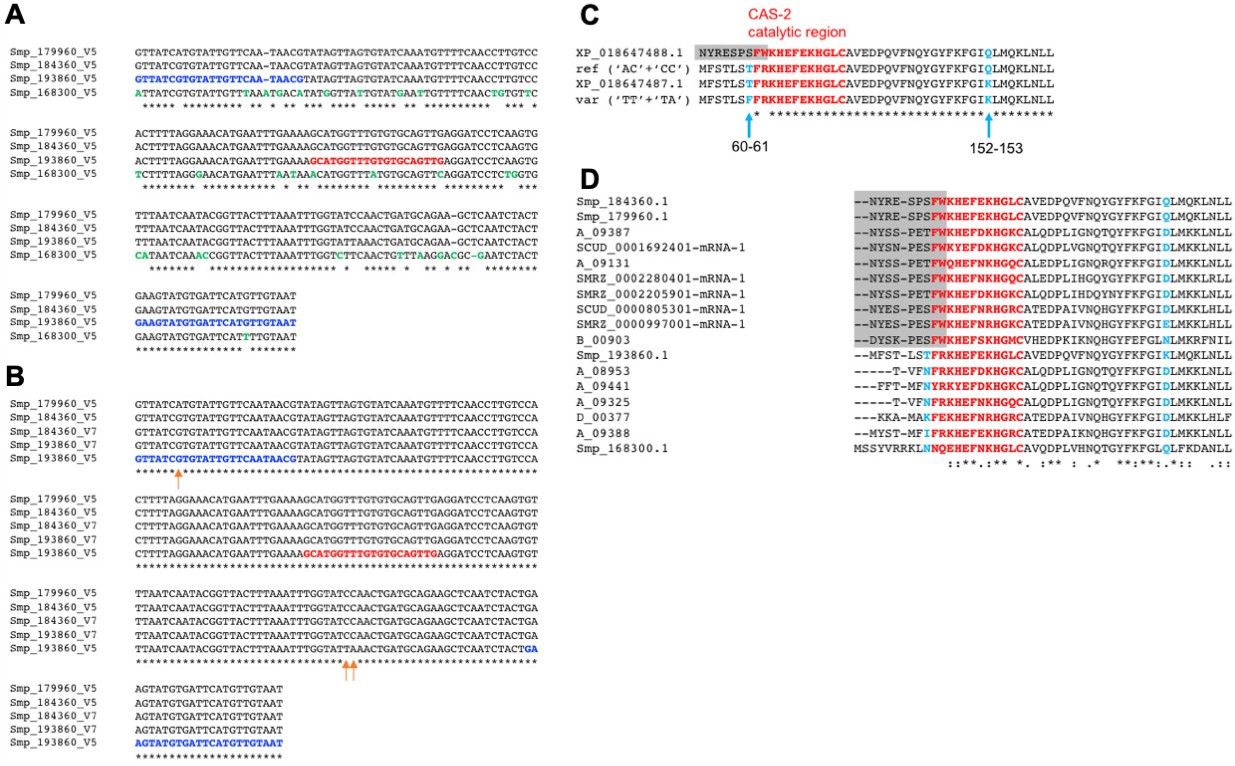
Variation among copies of ω1 in the reference genome of S.mansoni.
(A) An alignment assembled using CLUSTALW (Larkin et al., 2007) of the MiSeq amplicon region in the ω1 genes Smp_179960, Smp_184360, Smp_193860 and Smp_168300 using the sequences from the S. mansoni genome, assembly V5. The MiSeq primers (highlighted in blue) and sgRNA (red) were designed based on Smp_184360. Residues highlighted in green show where Smp_168300 differs from the other three genes. (B) An alignment made using CLUSTALW (Larkin et al., 2007) of the coding region of the amplicon sequence found in the gene Smp_193860 in the S. mansoni V7 assembly, the predicted alternative sequence for the variant having ‘TT’ at position 60–61 and ‘TA’ at 152–153 in the amplicon (‘var’), and the translations of two mDNAs retrieved from NCBI (top BLASTP hits in the NCBI protein database). Note that this corresponds to a part only of the ω1 T2 ribonuclease. The CAS-2 catalytic region is highlighted in red (Fitzsimmons et al., 2005). The mRNA XP_018647488.1 has an alternative splicing event at the start of the exon included in the amplicon (shaded grey), so that it only matches the region from ‘KHEFEK…’ (in the CAS-2 catalytic region) onwards. (C) An alignment of the coding region of the amplicon sequence in schistosome ω1 homologues (family 873078), excluding diverged members from S. japonicum as well as the diverged S. haematobium gene B_00112. The region with sequence similarity to the alternative splice-form is in shaded grey. Note that the Smp_193860 sequence used in this alignment is the version in the S. mansoni draft genome V5 gene set, which has the Q->K substitution at 152–153.
Figure 2—figure supplement 3

Programmed HDR-catalyzed knock-in of transgene into ω1, exon 6.
The PCR products visualized in ethidium bromide-stained agarose gel demonstrated Cas9-catalyzed target site-specific insertional mutagenesis in exon 6 of the ω1 gene. The 24 nt transgene knocked-in into target site indicated in lanes R1, R2 and R3 of 321, 285 and 184 bp, respectively (arrows at left) spanning the mutated site in the genomic DNAs pooled from schistosome eggs, including a positive control flanking the insert site (991 bp). Lanes 1–5 show the amplicons from the control groups; medium only, sgRNA only, cas9 only, ssODN only and heat-inactivated pLV-ω1X6 + ssODN. Lanes 6–9 show the amplicons from experiment groups; RNP, RNP and ssODN (KI), pLV-ω1X6 virions, and pLV-ω1X6 virions and ssODN (KI). Programmed knock-in was detected only in the KI experimental groups, as shown in lanes 7 and 9 where the transgene-specific amplicon obtained with the R1, R2 and R3 primers was present. This product was not amplified by PCRs where DNAs from control and other experimental groups served as the template. Amplicons of 991 bp were obtained with all genomic DNAs, confirming the integrity of the genomic DNAs and the control amplicon primer pair.
Figure 2—figure supplement 4
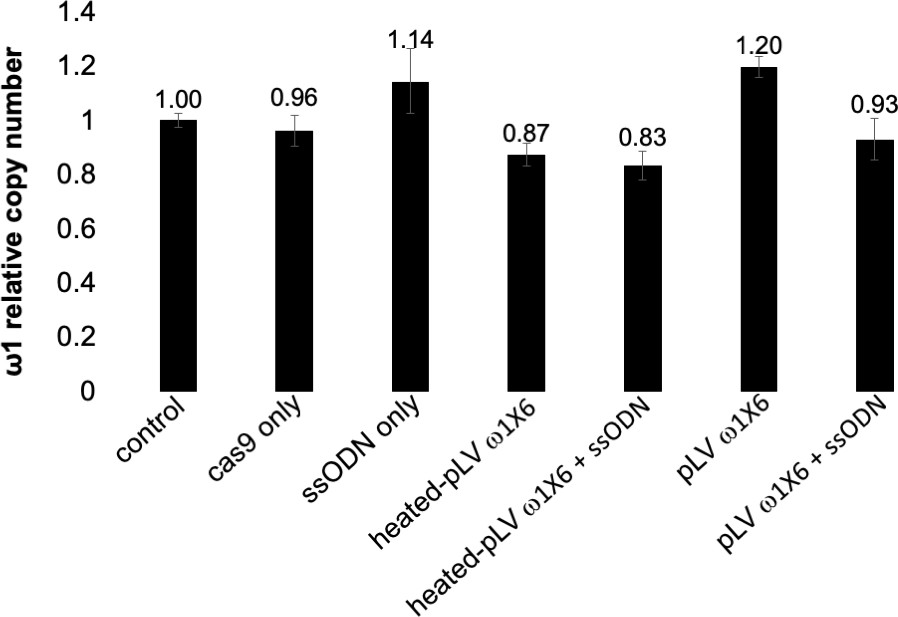
Estimated relative copy number of ω1.
Copy number estimated by qPCR in genomic DNAs isolated from CRISPR/Cas9-treated eggs or controls. The relative copy number of the LE as calibrator sample = 1. Means ± SD of control (wt LE), LE treated- Cas9 only, LE treated-ssODN only, LE treated-heat-inactivated pLV-ω1X6 virions, LE treated-heat-inactivated pLV-ω1X6 virions and ssODN, LE treated- pLV-ω1X6 virions, LE treated-pLV-ω1X6 virions and ssODN.
Figure 3 with 1 supplement
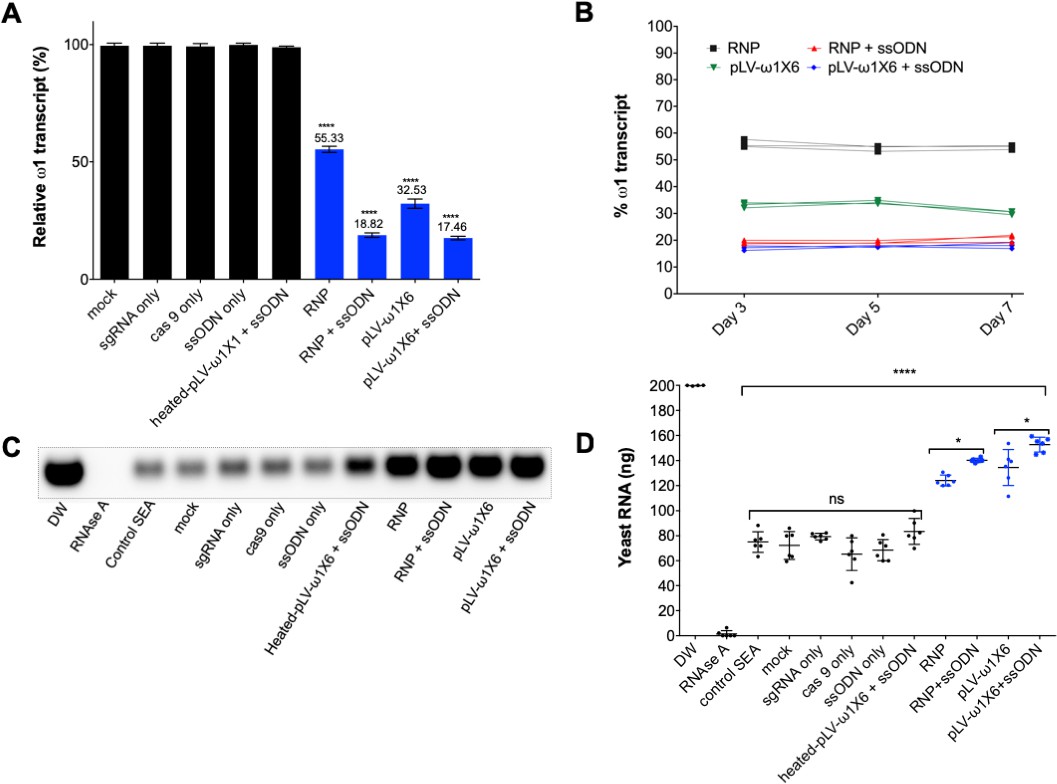
Diminished ω1-specific transcript levels and ribonuclease T2 activity following programmed editing.
(A) ω1 mRNA abundance reduction up to ~70% after genome editing by sgRNA/Cas9 complex and lentivirus systems, and markedly reduced >80% with the addition of ssODN as the DNA repair donor. Relative expression of ω1 transcripts at 3 days following CRISPR/Cas9 manipulation; mean ±SD, n = 11 (biological replicates); p≤0.0001 (****) ANOVA statistic significant. (B) Stable reduction of ω1 transcripts at days 5 and 7 after treatment (three biological replicates) in four experimental groups; RNP (black), RNP and ssODN (red), pLV-ω1X6 virions (green), pLV-ω1X6 virions and ssODN (blue) compared to controls. (C–D) Loss of RNase activity as assessed by hydrolysis of yeast RNA. Residual yeast following exposure to SEA, visualized after gel electrophoresis; DW (negative control), RNase A, control SEA (from wt LE), other negative control SEAs; mock, sgRNA only, cas9 only, heated-pLV-ω1X6 + ssODN and the Δω1-SEAs from RNP, RNP with ssODN, pLV-ω1X6 virions, and pLV-ω1X6 virions with ssODN. (D) Intact yeast RNA (nanograms) remaining following incubation with SEA (mean ±SD, n = 6). More RNA remained following incubation with Δω1-SEA in all groups, RNP, RNP and ssODN, pLV-ω1X6 virions, and pLV-ω1X6 virions and ssODN treated SEA) (blue) than in the WT SEA controls (p≤0.0001). Among the gene edited experimental groups, more RNA remained when donor template was introduced at the same time as RNP or pLV-ω1X6 virions (p≤0.01, n = 11 by ANOVA). Significant differences were not apparent among the WT SEA control groups.
Figure 3—figure supplement 1
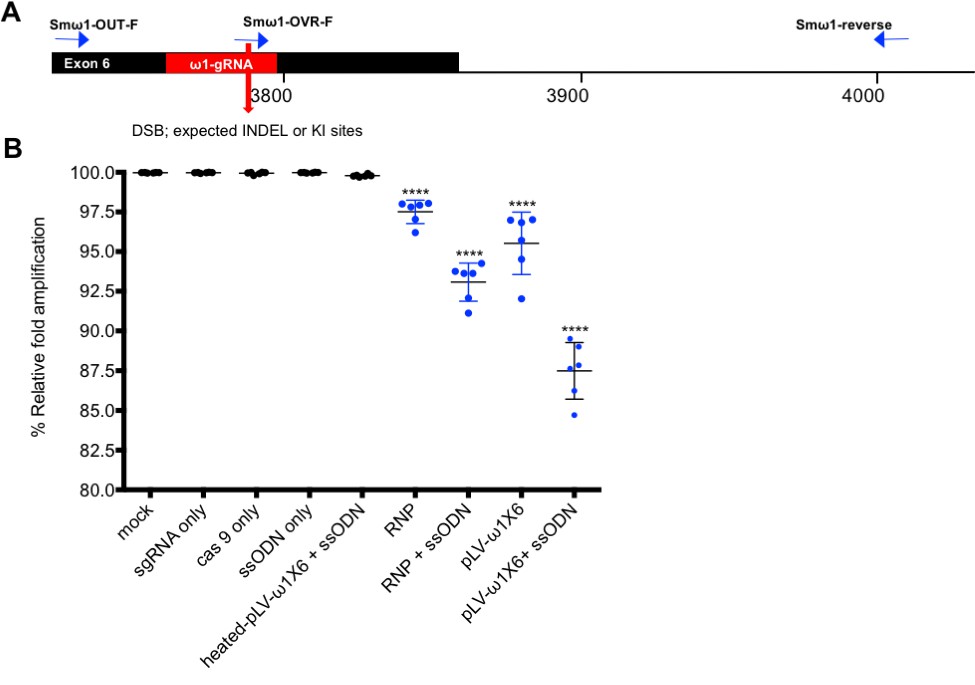
Quantitative PCR to estimate efficiency of programmed mutagenesis.
(A) The three primers (tri-primer set): Smω1-OVR-F (probe at gRNA, expected DSB and KI sites as red bar and arrow), Smω1-OUT-F and shared Smω1-reverse primer locations used in SYBR green-based PCR to estimate efficiency of on-target, programmed CRISPR/Cas9 gene editing. Estimation of gene-editing efficiency was determined as described (Shah et al., 2015; Yu et al., 2014). (B) Relative fold amplification efficiency; the ratio of OVR:OUT (gray bar) was set at 100% for control DNA sample, and little or no reduction was observed in relative fold amplification compared to other control groups, including groups exposed to culture medium only, sgRNA only, Cas9 only, ssODN only, heat-killed pLV-ω1X6 virions and ssODN. By contrast, there was reduced relative fold amplification of 2.5%, 6.9%, 4.5% and 12.5% in the experimental groups, RNP, RNP and ssODN, pLV-ω 1X6 virions, and pLV-ω 1X6 virions and ssODN, respectively. Percentages of relative fold amplification differed significantly among control and experiment groups. Means ± SE were established from eleven biological replicates.
Figure 4 with 1 supplement
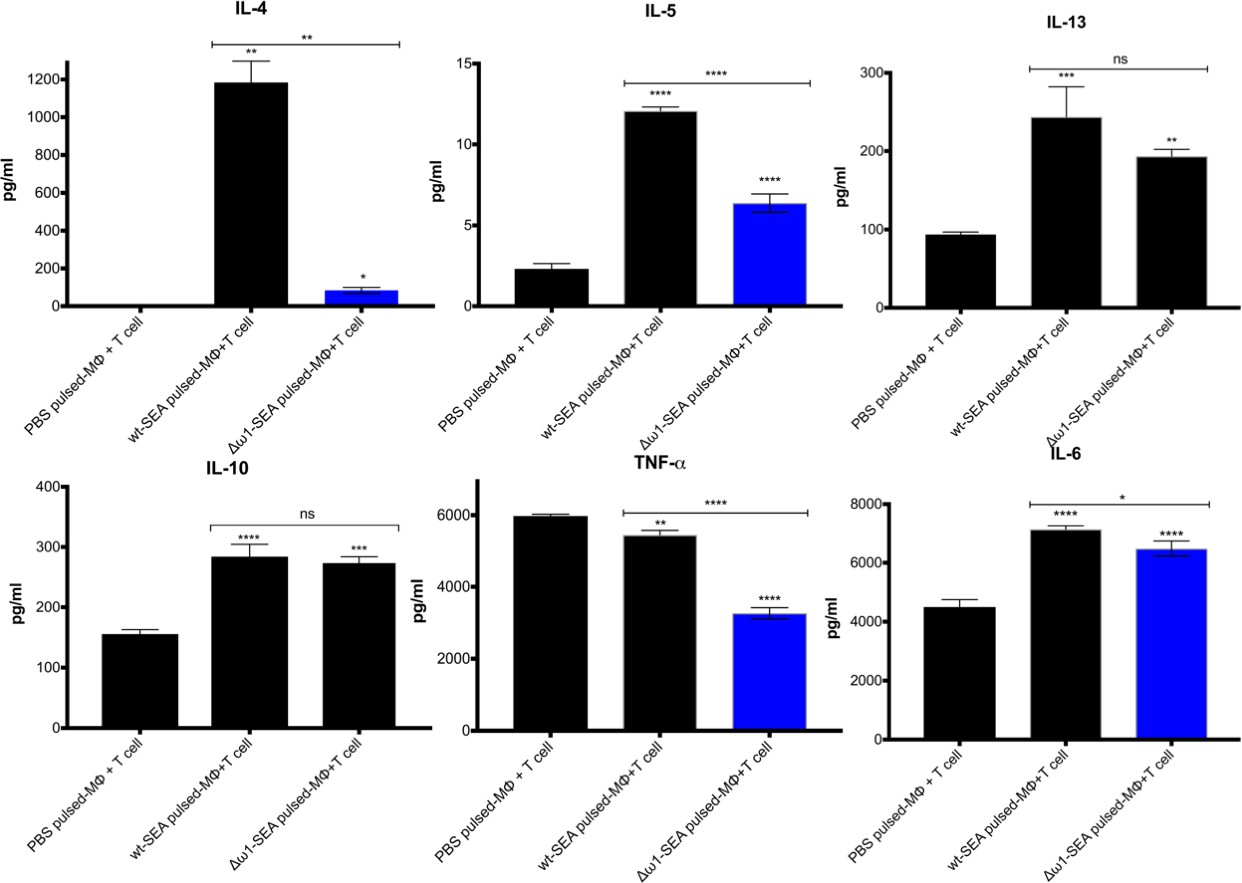
Reduced Th2 cytokine levels following exposure to Δω1-SEA.
Reduction in Th2 cytokines IL-4 and IL-5 but not IL-13 following pulsing of Mϕ (PMA induced-THP-1 cells) with Δω1-SEA prior to co-culture with human CD4+ T cells (Jurkat cell line) compared with WT-SEA pulsed-Mϕ (top panels). In addition, levels of IL-6 and TNF-α were reduced where Mϕ were first pulsed with Δω1-SEA but not WT SEA. Differences were not evident for IL-10. The assay was carried out in triplicate; p<0.0001,≤0.0001, 0.0038 and 0.0252 indicated as ****, ***, ** and *, respectively (one-way ANOVA, multiple comparison, n = 4).
Figure 4—figure supplement 1
Levels of IL-2, IL-10 and IFN-γ following exposure to Δω1-SEA.
Levels of IL-2 (blue circle) and IL-10 (black square) were not significantly different among groups after pulsing the Mϕ (PMA-induced THP-1 cells) with Δω1-SEA prior to co-culture with CD4+ T cells compared with WT-SEA pulsed-Mϕ. IFN-γ (red triangle) was not detected in any of the three groups.
Figure 5

Pulmonary circumoval granulomas revealed attenuated granulomatous response to Δω1 schistosome eggs.
Schistosome eggs (~3,000 eggs) that had been transduced with lentivirus virions encoding ω1-specific sgRNA and Cas9 in tandem with ssODN were introduced via the tail vein into mice. The mice were euthanized 10 days later; thin sections of the left lung were stained with H&E, and circumoval granulomas counted and measured. (A) Representative 2D scanned micrographs of granulomas inoculated with WT eggs (2× magnification) and 20× magnification (A1 and A2), and with Δω1 eggs; (B) (2×), B1 and B2 (20×). (C) control mouse lung. (D) and (E) Representative micrograph of individual, control eggs induced-granuloma that was counted to assess for granuloma volume. (F) and (G) Representative micrographs showing Δω1 egg induced-granulomas. All single egg induced-granuloma from WT and Δω1 eggs were measured and granuloma volume estimated. (H) Scatter plots of the volume (mm3) for individual granuloma, mean ± SE (red) are shown. The volumes of granulomas induced by Δω1 eggs were significantly smaller than those surrounding WT eggs (Welch’s t-test, p≤0.0001, n > 100).
Tables
Key resources table
| Reagent type (species) or resource | Designation | Source or reference | Identifiers |
|---|---|---|---|
| Parasite | S. mansoni eggs | BEI resources | |
| Synthetic RNA | Guide RNA targeting exon 6 of omega-1 | Thermo Fisher Scientific | Custom |
| Plasmid construct | Lentiviral CRISPR Cas9 construct containing human U6 promoter driving gRNA and human EF1 promoter driving Cas9 | Sigma | All-in-one vector (Custom) |
| Oligonucleotides | single strand oligodeoxynucleotide | Eurofin Genomics | Custom |
| Streptococcus pyogenes, nuclease | Cas9 nuclease | Dharmacon | CAS11201 |
| Homo sapiens, cell line | HEK293 | ATCC | CRL-1573, RRID:CVCL_0045 |
| Homo sapiens, cell line | THP-1 | ATCC | TIB-202, RRID:CVCL_0006 |
| Homo sapiens, cell line | Jurkat | ATCC | CRL-2901, RRID:CVCL_U620 |
| Commercial kit | Lentiviral Packaging Mix | Sigma-Aldrich | SHP001 |
| Commercial reagent | Lentiviral concentrator | Takara Bio | 631231 |
| Commercial kit | Lentiviral quantification | Takara Bio | 631280 |
| Commercial kit | QIAseq 1-step Amplicon Library kit | Qiagen | 180412 |
| Commercial reagent | GeneRead Adaptor I | Qiagen | 180986 |
| Commercial kit | QIAseq Library Quant System | Qiagen | QSIL-003 |
| Commercial kit | Th1/Th2/Th17 ELISA multi-analyte test kit | Qiagen | 336161 |
Additional files
-
Supplementary file 1
Putative NHEJ and HDR pathway genes in S. mansoni.
- https://doi.org/10.7554/eLife.41337.015
-
Supplementary file 2
List of oligonucleotide primers.
Nucleotide sequences and position on the schistosome ω1 gene; Smp_193860.
- https://doi.org/10.7554/eLife.41337.016
-
Supplementary file 3
Frequency of knock-in sequences, indels and substitutions identified in the Illumina sequencing reads, considering the entire 202 bp amplicon (except for 25 bp at the ends to exclude primer regions).
- https://doi.org/10.7554/eLife.41337.017
-
Transparent reporting form
- https://doi.org/10.7554/eLife.41337.018
Download links
A two-part list of links to download the article, or parts of the article, in various formats.
Downloads (link to download the article as PDF)
Open citations (links to open the citations from this article in various online reference manager services)
Cite this article (links to download the citations from this article in formats compatible with various reference manager tools)
Programmed genome editing of the omega-1 ribonuclease of the blood fluke, Schistosoma mansoni
eLife 8:e41337.
https://doi.org/10.7554/eLife.41337


