Chemical modulation of transcriptionally enriched signaling pathways to optimize the conversion of fibroblasts into neurons
- The Salk Institute for Biological Studies, United States
- University Hospital Freiberg, University of Freiberg, Germany
- Lieber Institute for Brain Development, United States
- Leopold-Franzens-University Innsbruck, Austria
Figures
Figure 1 with 1 supplement

An optimized all-in-one viral system simplifies fibroblast transduction and increases conversion efficiency.
(A) Schematic of all-in-one lentiviral system for inducible overexpression of N2A for iN conversion. (B) Cell lines of varying conversion efficiencies used for comparison (C) Immunocytochemical analysis of iNs following three weeks of conversion, stained with βIII-tubulin, PSA-NCAM, and DAPI. The scale bar represents 20 μm. (D) Flow cytometry histogram plots of PSA-NCAM:PE-stained iNs following 3 weeks of conversion with UNA (blue) or E:N2A (Orange) lentiviral systems. (E) Comparison of % PSA-NCAM:PE + cells from three three lines (L2,L5,L7) reprogrammed with E + N2A or UNA (3 biological and two technical replicates). (F) Immunocytochemical analysis of E:N2A or UNA iNs following three 3 weeks of conversion, stained with βIII-tubulin, NeuN, and DAPI. Scale bar represents 100 μm. (G-H) Quantification of immunocytochemical staining in F. (3 biological and two technical replicates).
-
Figure 1—source data 1
Human fibroblasts used in this study.
- https://doi.org/10.7554/eLife.41356.004
Figure 1—figure supplement 1
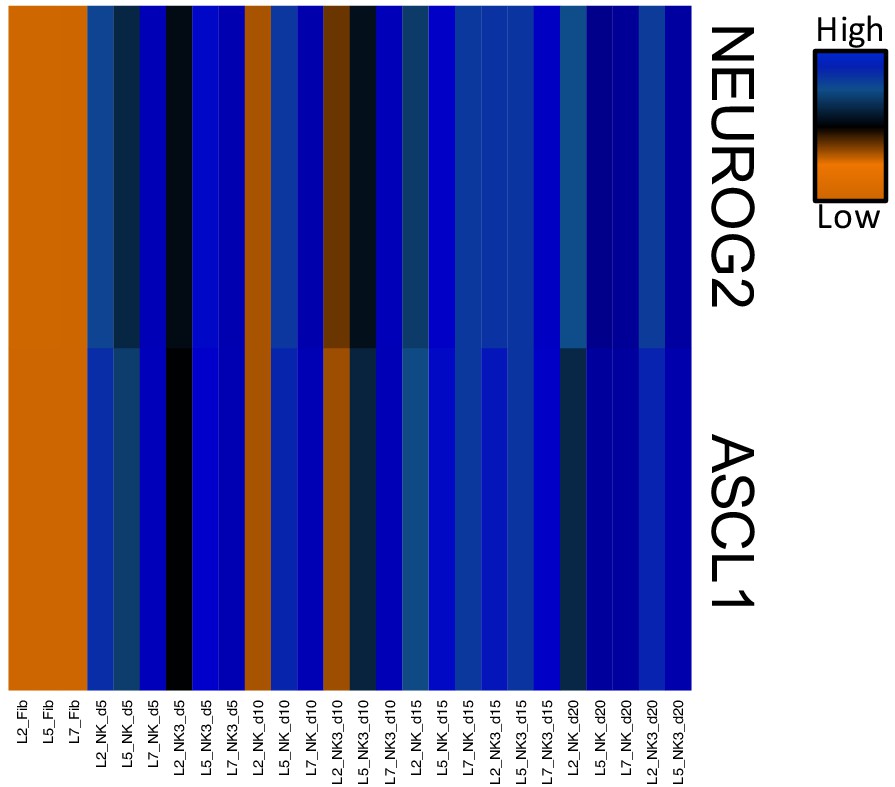
Heatmap of FPKM normalized counts of Neurog2 and Ascl1.
Dox-induced expression of Neurog2 and Ascl1 was maintained for all 20 days of conversion with NC and NC+ZPAK.
Figure 2 with 3 supplements
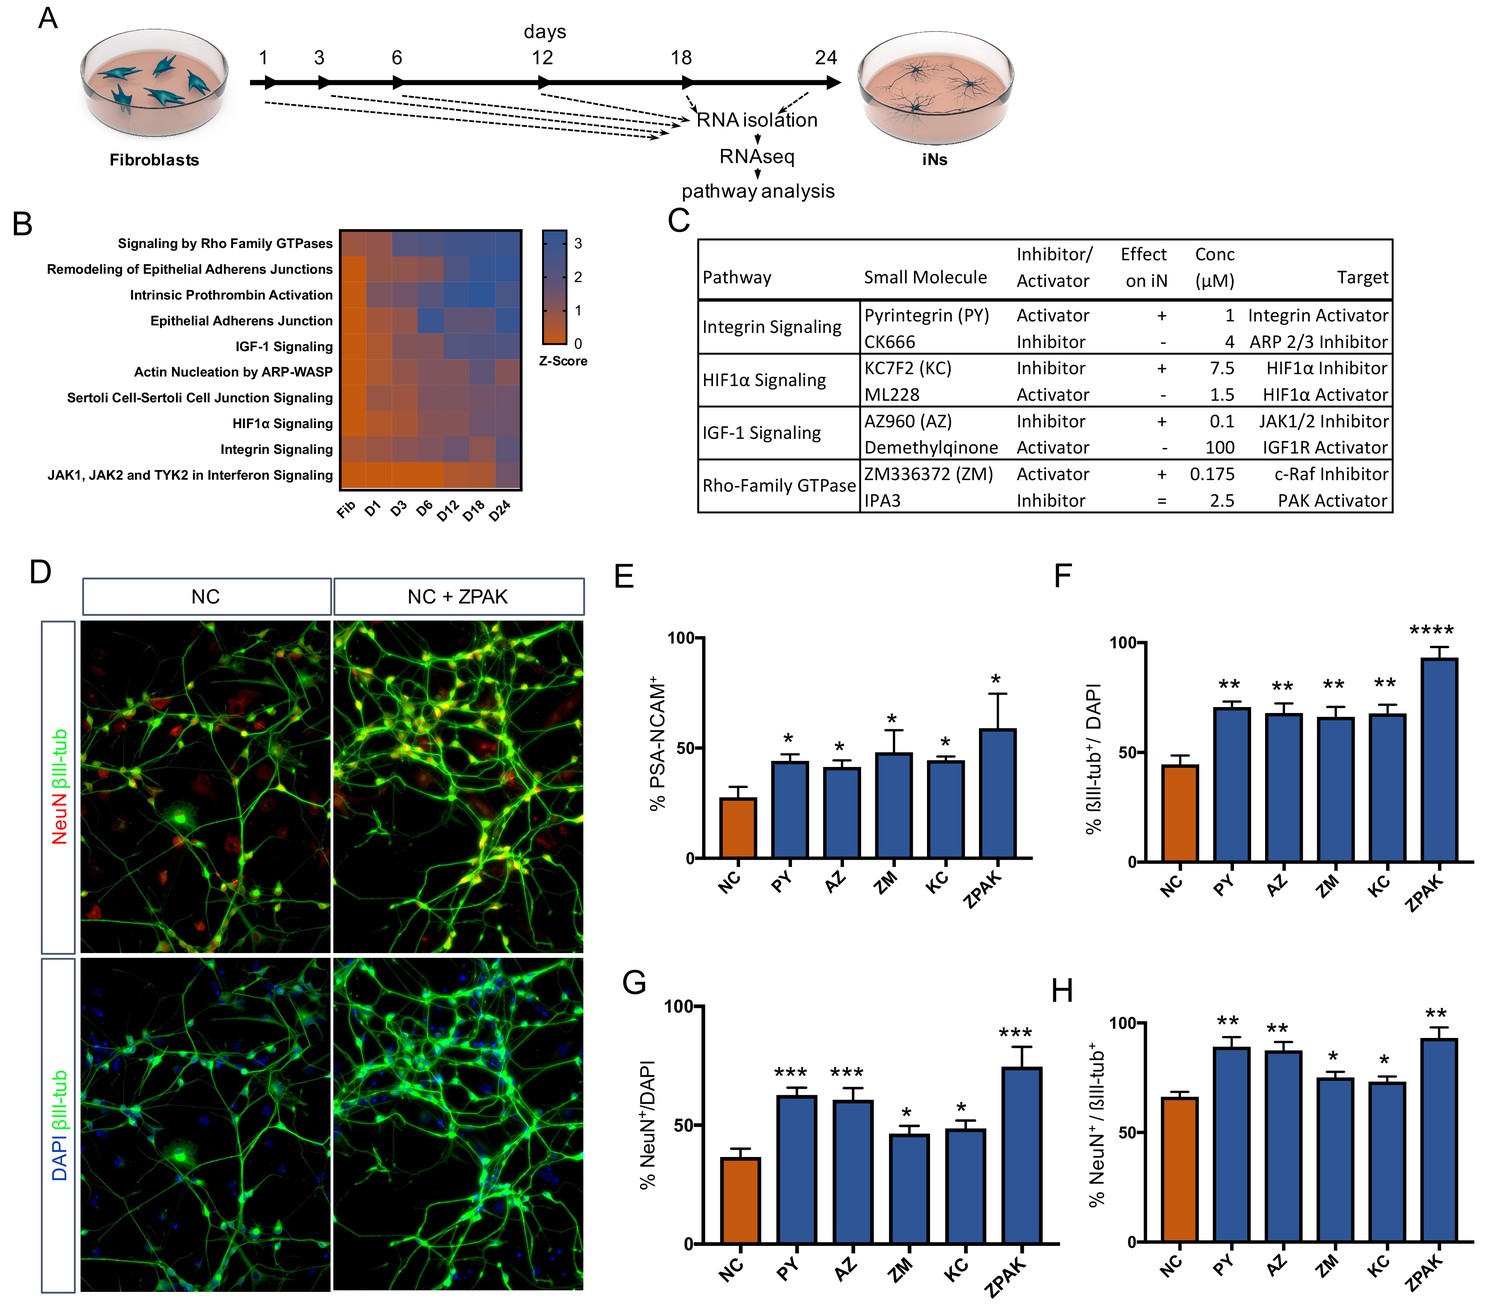
Time-based RNAseq identifies signaling pathways influential during iN conversion.
(A) Schematic for timeline of RNA isolation during neuronal reprogramming of L10 (B) Activation Z-Score of the indicated signaling pathway as called by IPA Comparison Analysis during neuronal reprogramming. Z-Scores represent a statistical measure of the match between the expected relationship direction and observed gene expression of a given pathway, with z-scores > 2 considered significant. (C) Description of small molecules selected to inhibit or activate branches of pathways identified in (B) Effect on iN conversion is based on increased % PSA-NCAM + cells by flow cytometry, with + indicating increased PSA-NCAM %, - reduced PSA-NCAM %, and = no effect on PSA-NCAM %. (D) Immunocytochemical analysis of neural markers in NC or NC+ZPAK iNs (L1, L5, L9) following three weeks of conversion, stained with βIII-tubulin, NeuN, and DAPI. Scale bar represents 100 μm. Representative image from L1. (E) flow cytometry quantification of %PSA-NCAM + cells in iNs (L1, L5, L9) converted in NC and NC+ZPAK supplements. (F-H) Quantification of immunocytochemical staining in (D). Results are shown as mean ± SEM. *p<0.05; **p<0.01; ***p<0.001; ****p<0.0001, n = 3 biological replicates. Significance values were calculated by t test.
-
Figure 2—source data 1
Ingenuity pathway analysis of direct fibroblast to neuron conversion.
- https://doi.org/10.7554/eLife.41356.010
-
Figure 2—source data 2
Expanded small molecule information.
- https://doi.org/10.7554/eLife.41356.007
Figure 2—figure supplement 1
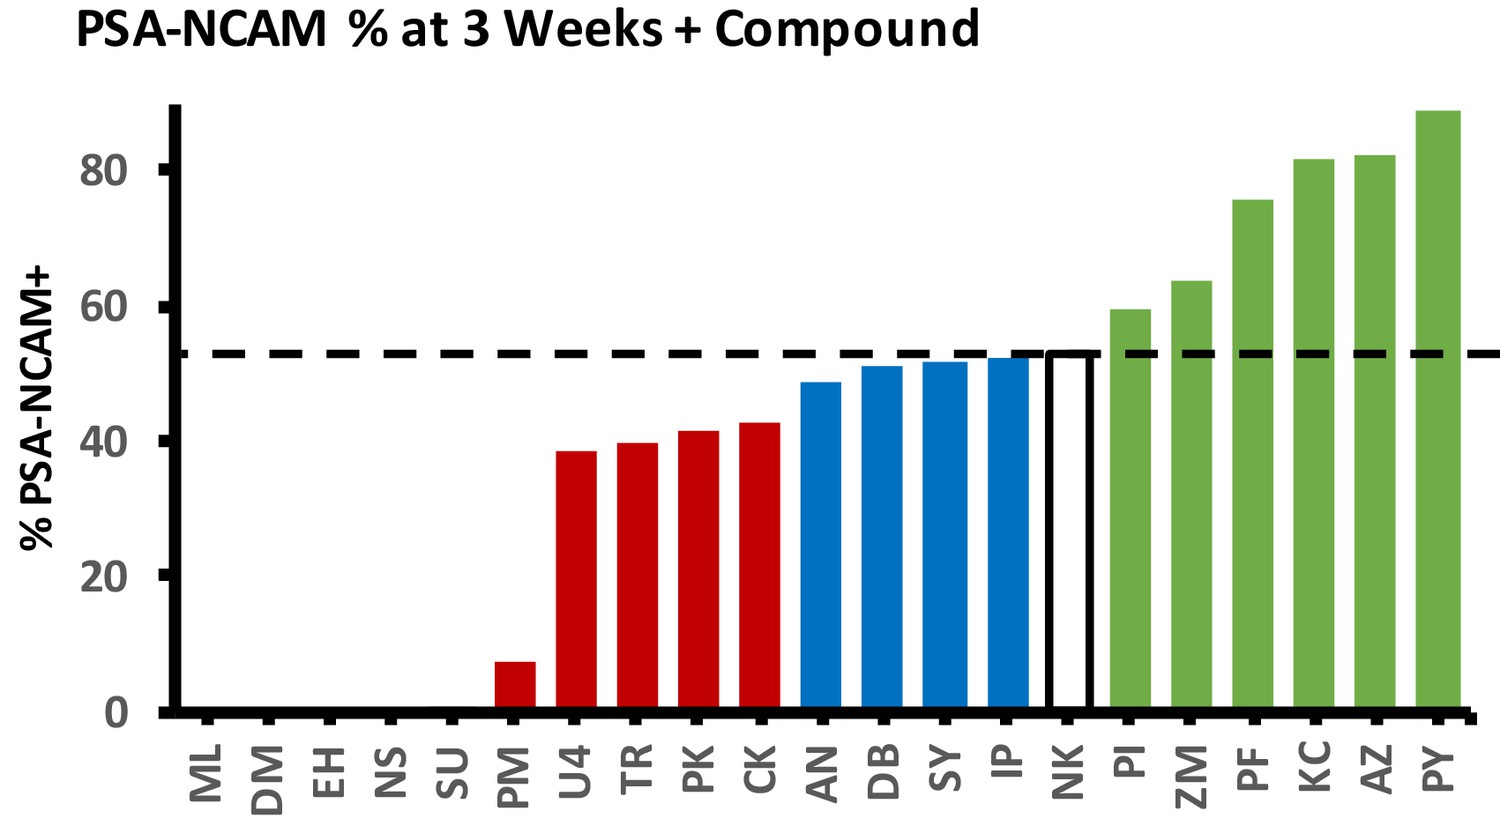
Effect of screened small molecules on %PSA-NCAM yield of iNs.
Dashed line represents NC (NK) control. Molecules with a score of 0 were lethal during direct conversion.
Figure 2—figure supplement 2
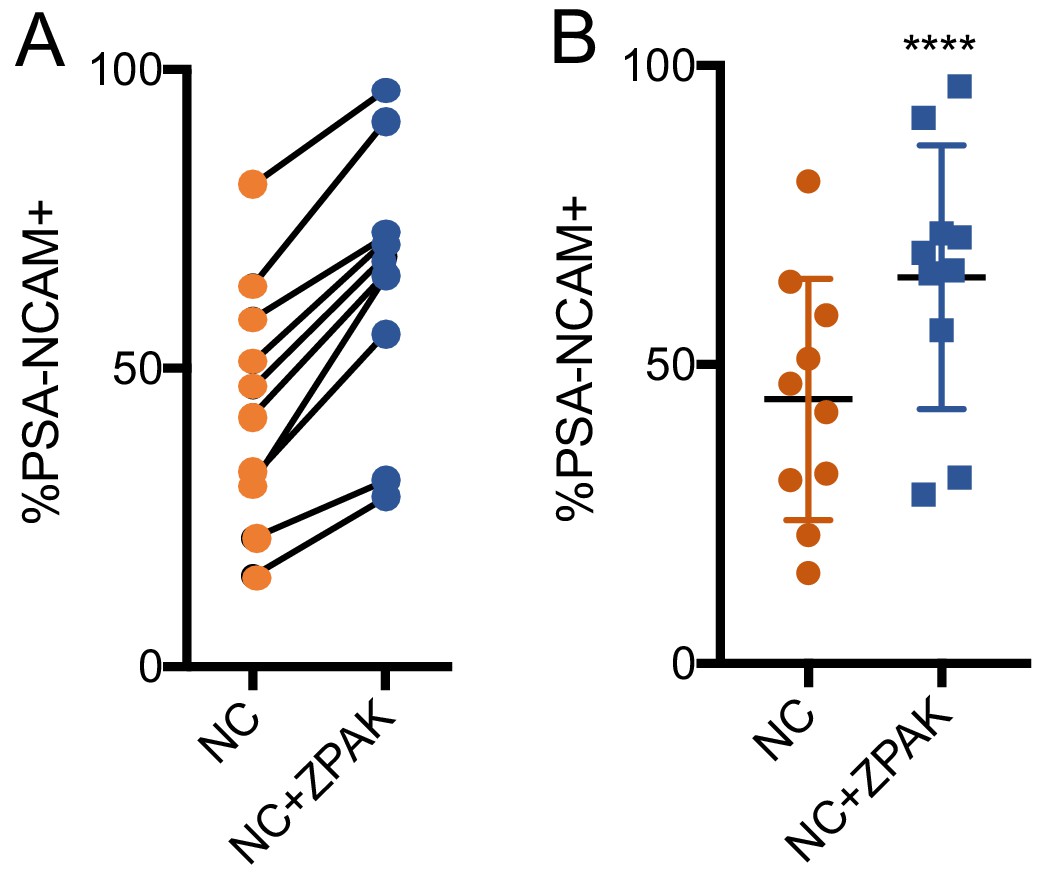
% yield of PSA-NCAM+ iNs from all 10 lines used in this study.
(A) % change of PSA-NCAM+ cells for all lines converted in NC or NC+ZPAK. (B) Dot plot demonstrating significantly increased PSA-NCAM+ cell yield with NC+ZPAK. Results are shown as mean ± SD. n = 10, ****p<0.00.1. Significance values were calculated by paired t-test.
Figure 2—figure supplement 3
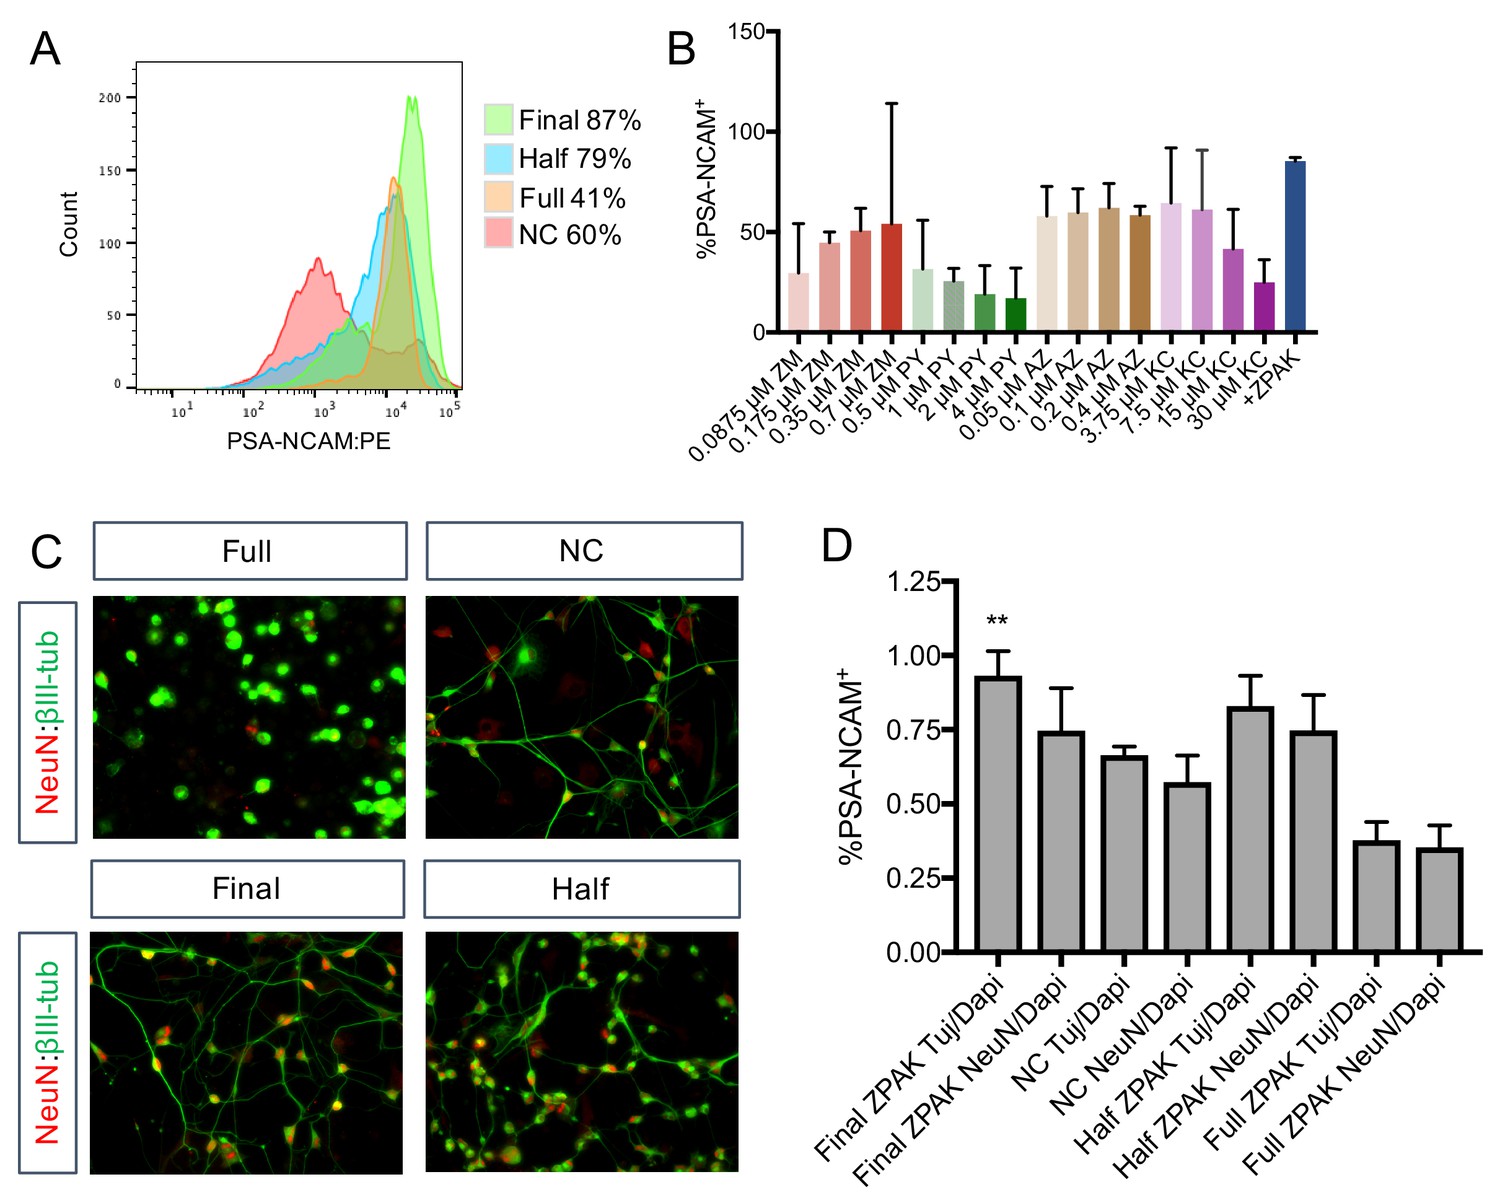
Concentration optimization of ZPAK cocktail.
(A) Flow cytometry analysis of % PSA-NCAM+ L1 cells cultured with NC or NC +Full ZPAK (4 μM PY, 30 μM KC, 0.4 μM AZ, and 0.7 μM ZM), Half ZPAK (2 μM PY, 15 μM KC, 0.2 μM AZ, and 0.35 μM ZM), and Final ZPAK (1 μM PY, 7.5 μM KC, 0.1 μM AZ, and 0.175 μM ZM). (B) Flow cytometry analysis of % PSA-NCAM+ L1, L4, and L8 cells cultured with the indicated concentrations of PY, KC, AZ, ZM, and Final ZPAK. (C) Representative image of iNs produced from Full, Half, and Final ZPAK concentrations and NC alone. (D) Quantification of results from (C). Results are shown as mean ± SD. **p<0.01. Significance values were calculated by t-test.
Figure 3 with 6 supplements
ZPAK induces a more defined neuronal transcription that more closely relates to the adult brain transcriptome.
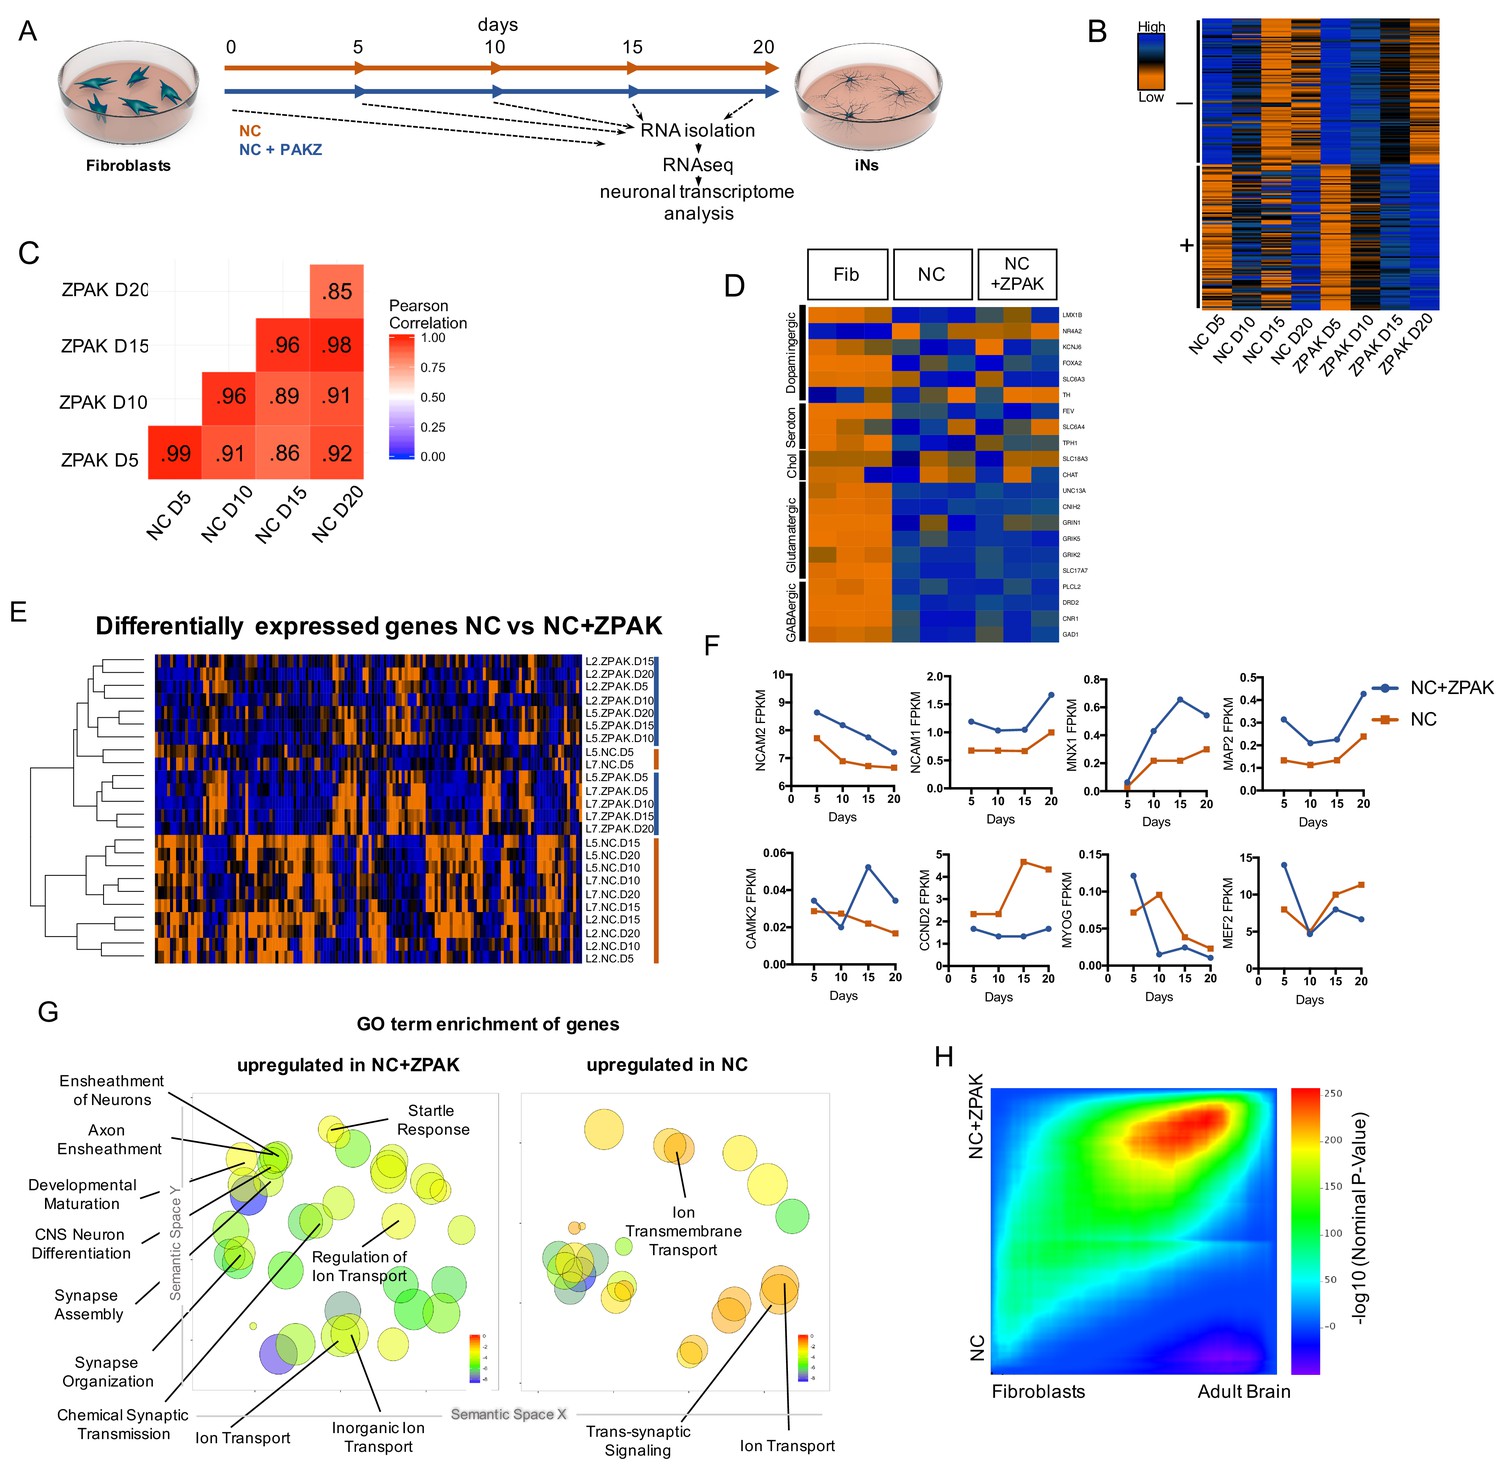
(A) Schematic for timeline RNA isolation during neuronal reprogramming of L2, L5, and L7 at fibroblast and 5, 10, 15, and 20 days of conversion (B) Heatmap of FPKM normalized counts of the top 100 correlating (+) and top 100 inverse correlating (-) genes (FPKM ≥ 1) for day 5, 10, 15 and 20 of neuronal reprogramming with NC or NC+ZPAK. Orange = low expression, blue = high expression (C) Correlate R values of FPKM normalized counts from 25,610 genes during neuronal reprogramming with NC or NC+ZPAK cocktail. (D) Heatmap showing relative expression of the glutamatergic neuron-specific genes Unc-13 homolog A (UNC13A), AMPA receptor auxiliary protein 2 (CNIH2),NMDA1 (GRIN1), GluK5 (GRIK5), GluK2 (GRIK2) and vGLUT1 (SLC17A7), GABAergic neuron-specific genes phospholipase C like 2 (PLCL2), dopamine receptor D2 (DRD2), cannabinoid receptor 1 (CNR1) and glutamate decarboxylase 1 (GAD1), Serotonergic neuron-specific genes ETS transcription factor (FEV), serotonin transporter 1 (SLC6A4), and tryptophan hydroxylase (TPH1), Dopaminergic neuron-specific genes tyrosine hydroxylase (TH), dopamine transporter 1 (SLC6A3), forkhead box A2 (FOXA2), potassium voltage-gated channel subfamily J member 6 (KCNJ6), nuclear receptor subfamily four group A member 2(NR4A2), and LIM homeobox transcription factor one beta (LMX1B), and cholinergic neuron-specific genes vesicular acetylcholine transporter (SLC18A3), and choline O-acetyltransferase (ChAT); normalized by row. (E) Heatmap of 143 significantly (p-adj < 0.05) differentially expressed genes between NC and NC+ZPAK at 5, 10, 15 and 20 days of reprogramming (n = 3). (F) FPKM normalized counts of five representative neuron specification genes - Neural Cell Adhesion Molecule 2 (NCAM2), Neural Cell Adhesion Molecule 1 (NCAM1), Motor Neuron and Pancreas Homeobox 1 (MNX1), Microtubule-associated Protein 2 (MAP2), Calcium/Calmodulin Dependent Protein Kinase II (CAMK2) - and three representative fibroblast-to-iN limiting genes - Cyclin D2 (CCND2), Myogenin (MYOG), and Myocyte enhancer factor-2 (MEF2) - over time during fibroblast-to-iN conversion with NC (orange) or NC+ZPAK (blue). (G) Gene ontology (GO) enrichment analysis of genes upregulated in NC or NC+ZPAK (log2FC > 1). Results are shown as REVIGO (Supek et al., 2011) scatterplots in which similar GO terms are grouped in arbitrary two-dimensional space based on semantic similarity. Each circle indicates a specific GO term and circle sizes are indicative of how many genes are included in each term, where larger circles indicate greater numbers of genes that are included in that GO term. Colors indicate the level of significance of enrichment of the GO term by log10 p-value. (H) Rank-rank hypergeometric overlap (RRHO) map (Plaisier et al., 2010) comparing the gene expression differences between NC and NC+ZPAK to expression differences between matched fibroblasts and adult human brain (Allen Brainspan). Each pixel represents overlap between NC or NC+ZPAK to fibroblast or adult brain transcriptome, color-coded according to the –log10p value of a hypergeometric test (step size = 100). On the map, the extent of shared genes upregulated in NC+ZPAK and adult brain is displayed in the top right corner, whereas the shared genes upregulated in NC and fibroblasts are displayed in the bottom left corner (see schematic in Figure 3—figure supplement 6).
-
Figure 3—source data 1
Significantly differentially expressed genes between NC and NC+ZPAK.
- https://doi.org/10.7554/eLife.41356.018
Figure 3—figure supplement 1
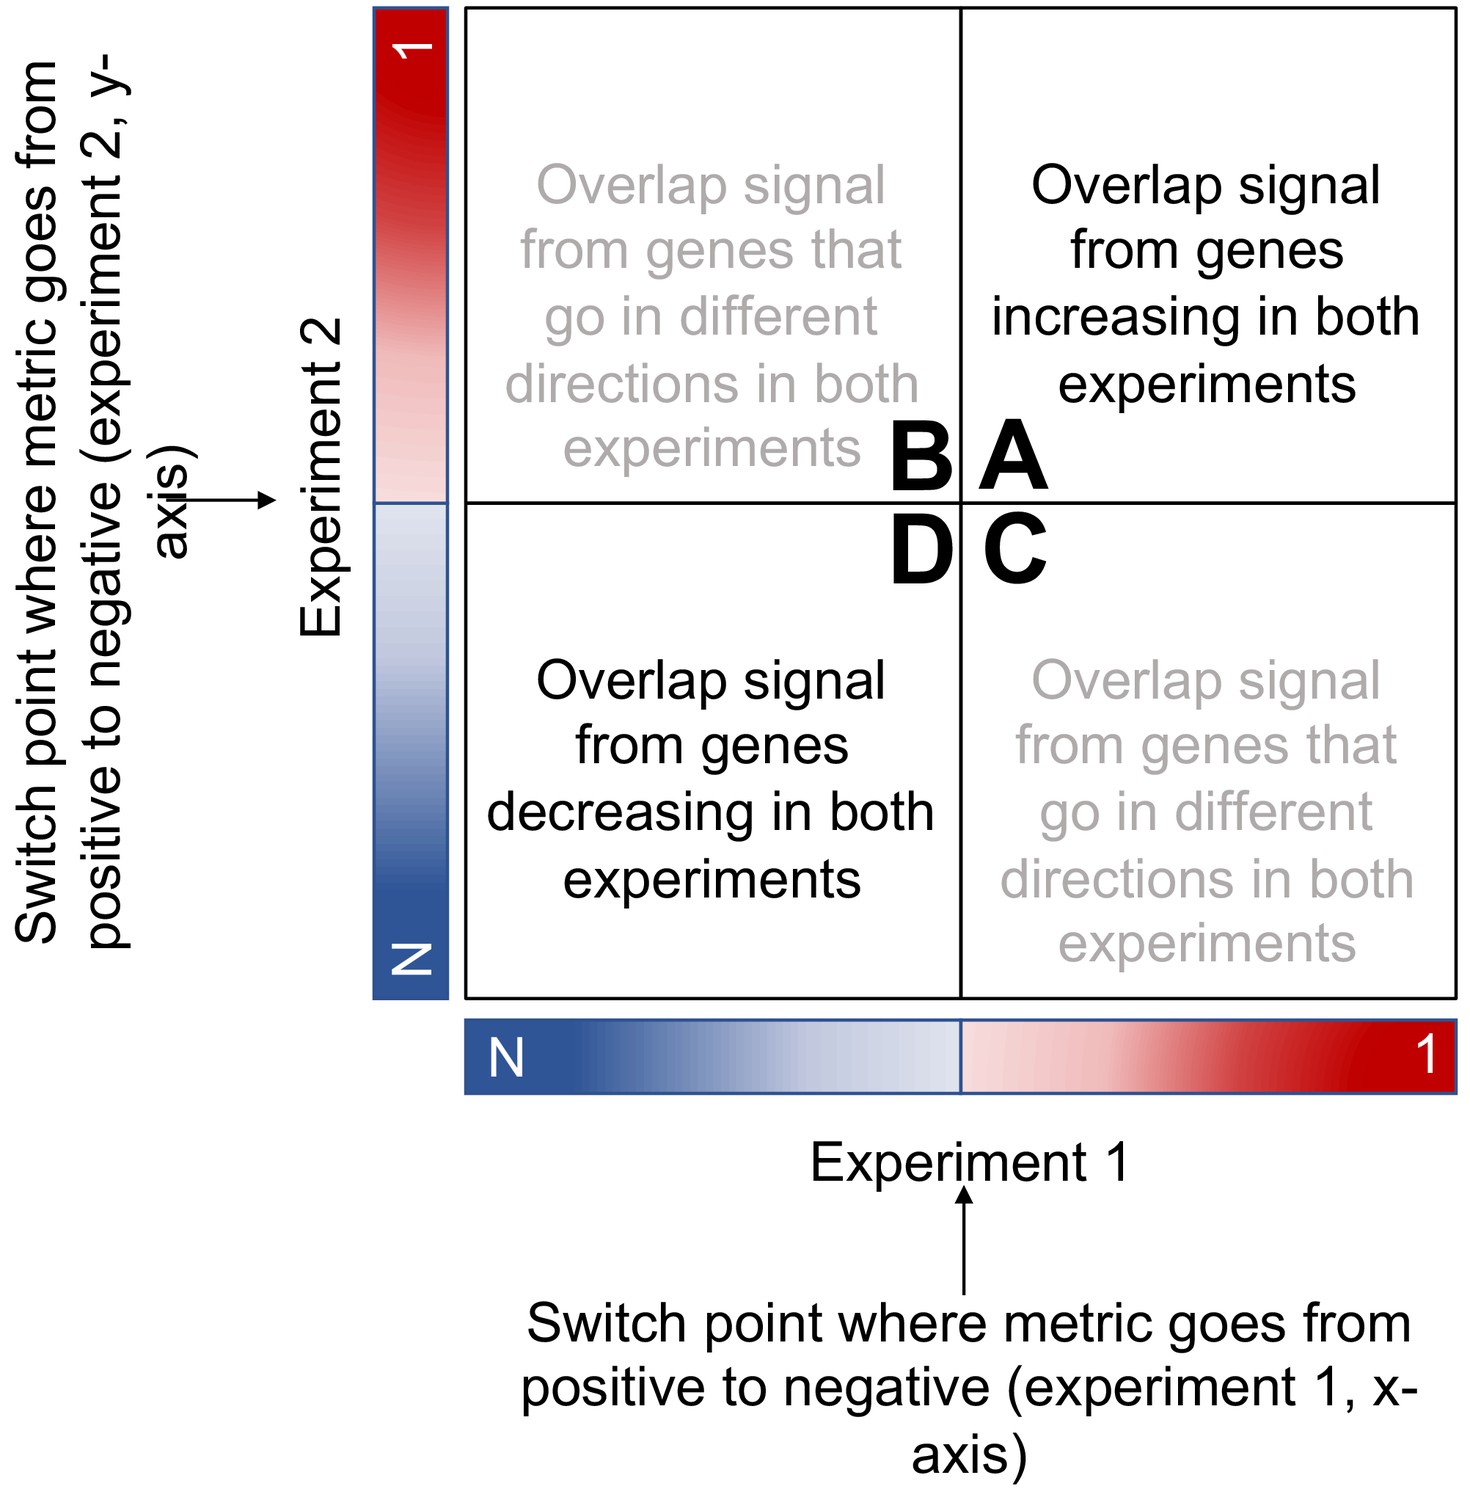
RRHO schematic adapted from RRHO User Guide (Plaisier et al., 2010).
https://doi.org/10.7554/eLife.41356.012
Figure 3—figure supplement 2
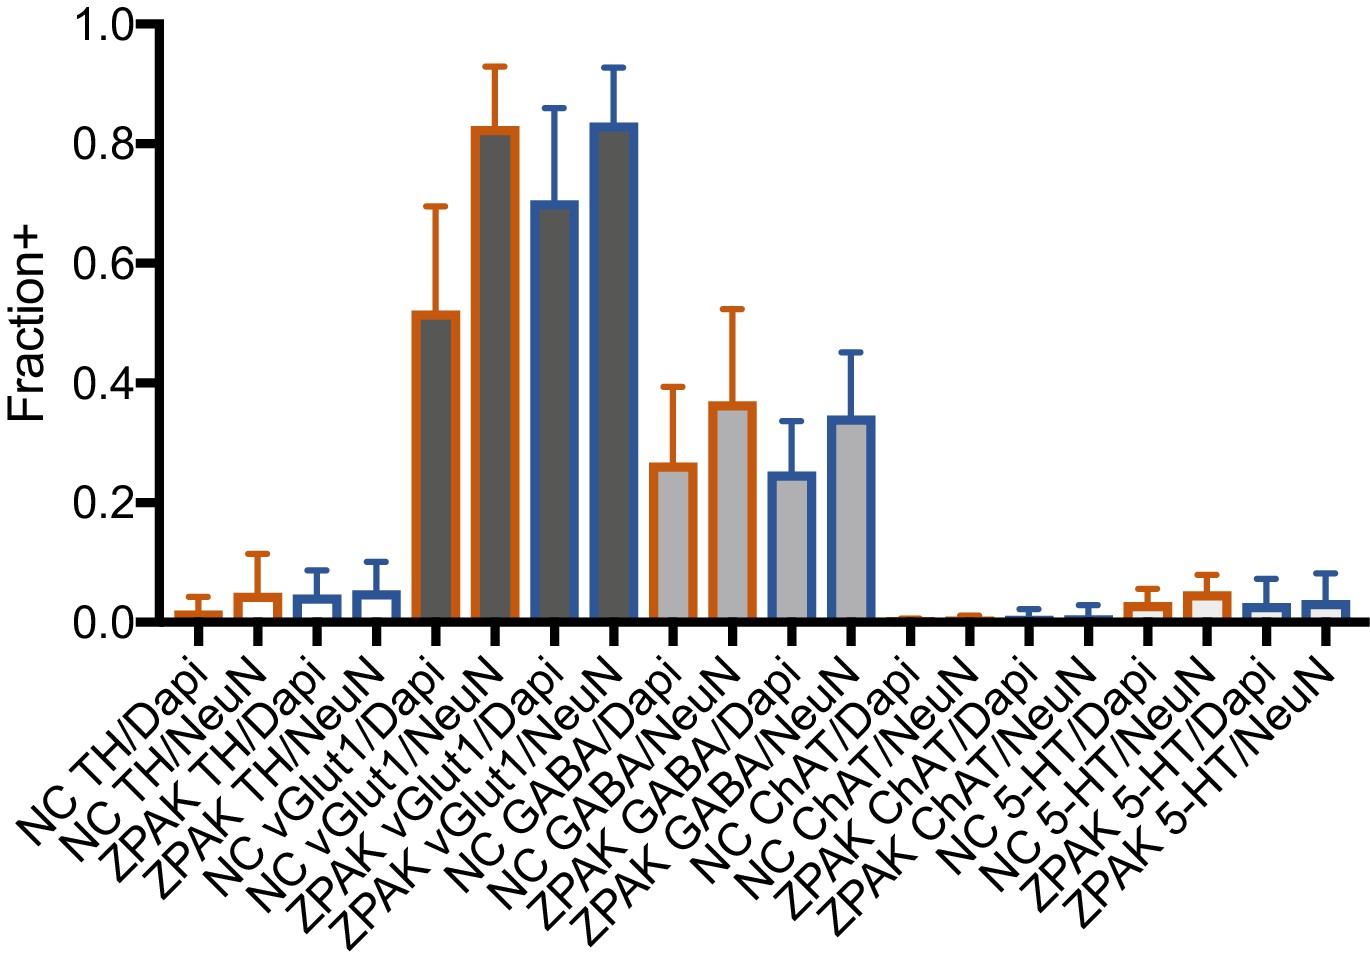
Immunocytochemical quantification of neuron subtype markers TH (Dopaminergic), vGlut1 (Glutamatergic), GABA (GABAergic), ChAT (Cholinergic), and 5-HT (Serotonergic) in NC and NC+ZPAK iNs.
https://doi.org/10.7554/eLife.41356.013
Figure 3—figure supplement 3
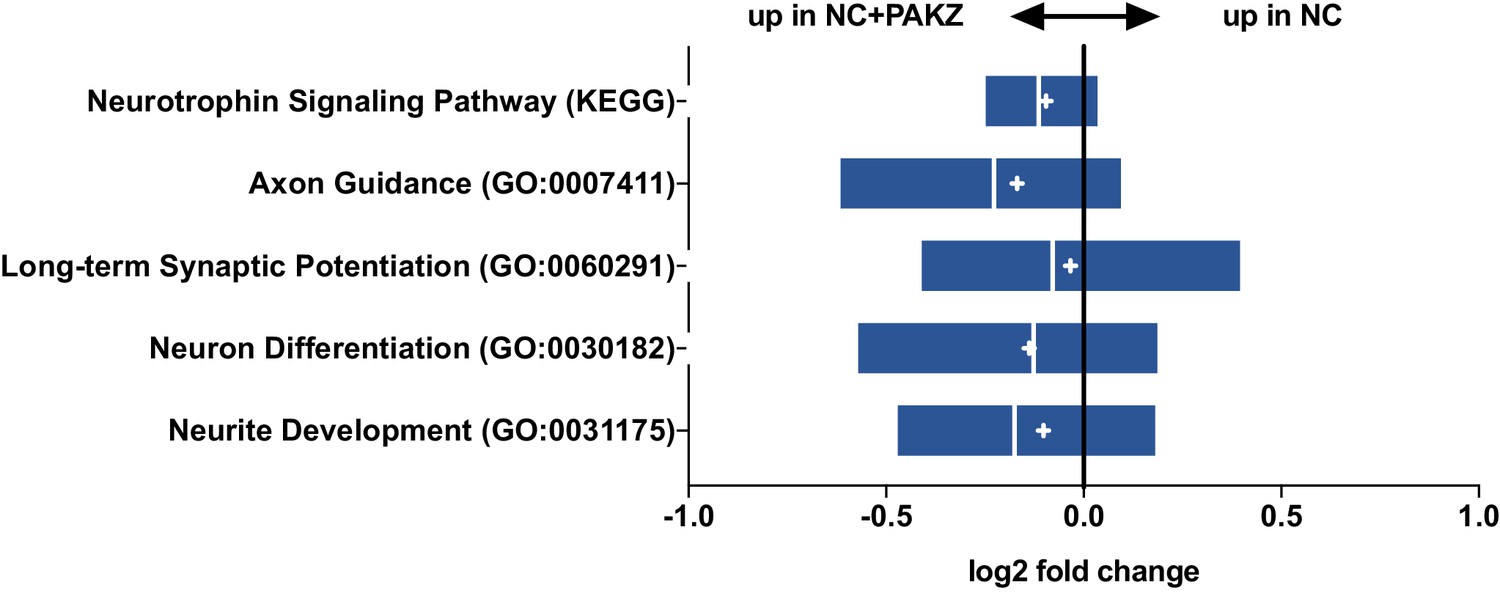
Gene set expression analysis.
Predefined and validated gene sets from GO and KEGG for neuron function show enrichment in mean and median expression in NC+ZPAK over NC.
Figure 3—figure supplement 4
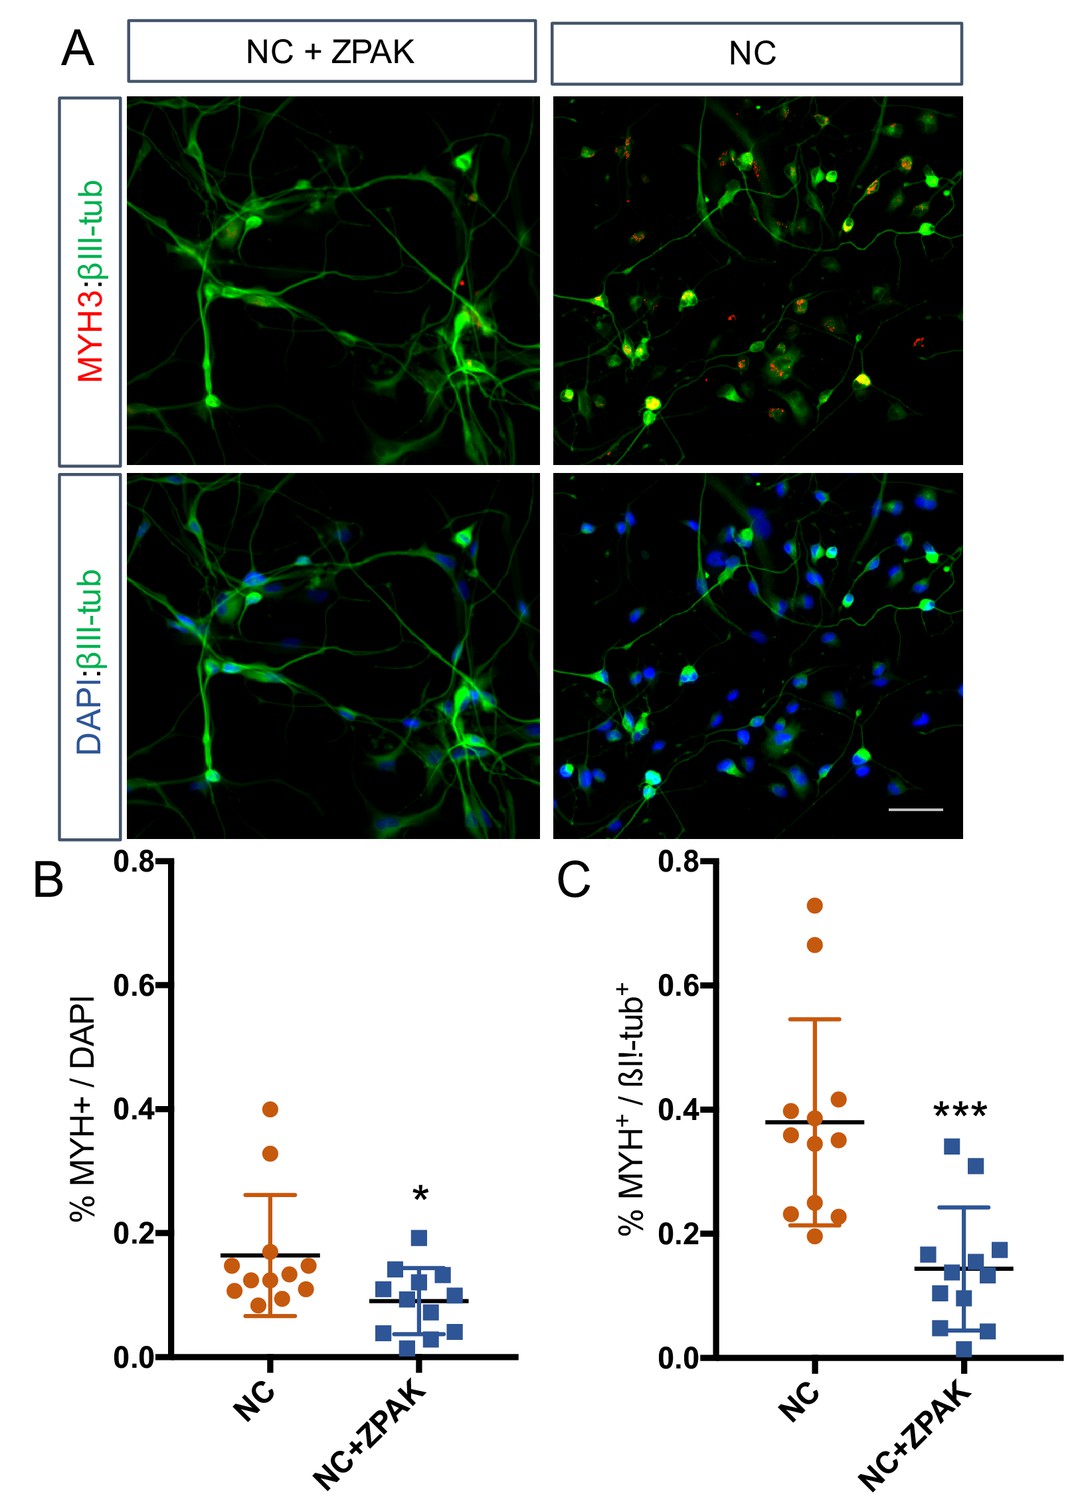
Immunocytochemical analysis of MYH3 expression in L1, L4 and L8 NC and NC+ZPAK iNs.
(A) Representative image of MYH3 staining in NC and NC+ZPAK iNs. Scale bar represents 100 μm. (B) Quantification of MYH3-positive cells per dapi-positive nuclei. (C) Quantification of MYH3-positive cells per βIII-tub-positive cells. Results are shown as mean ± SD. *p<0.05, ***p<0.001.
Figure 3—figure supplement 5
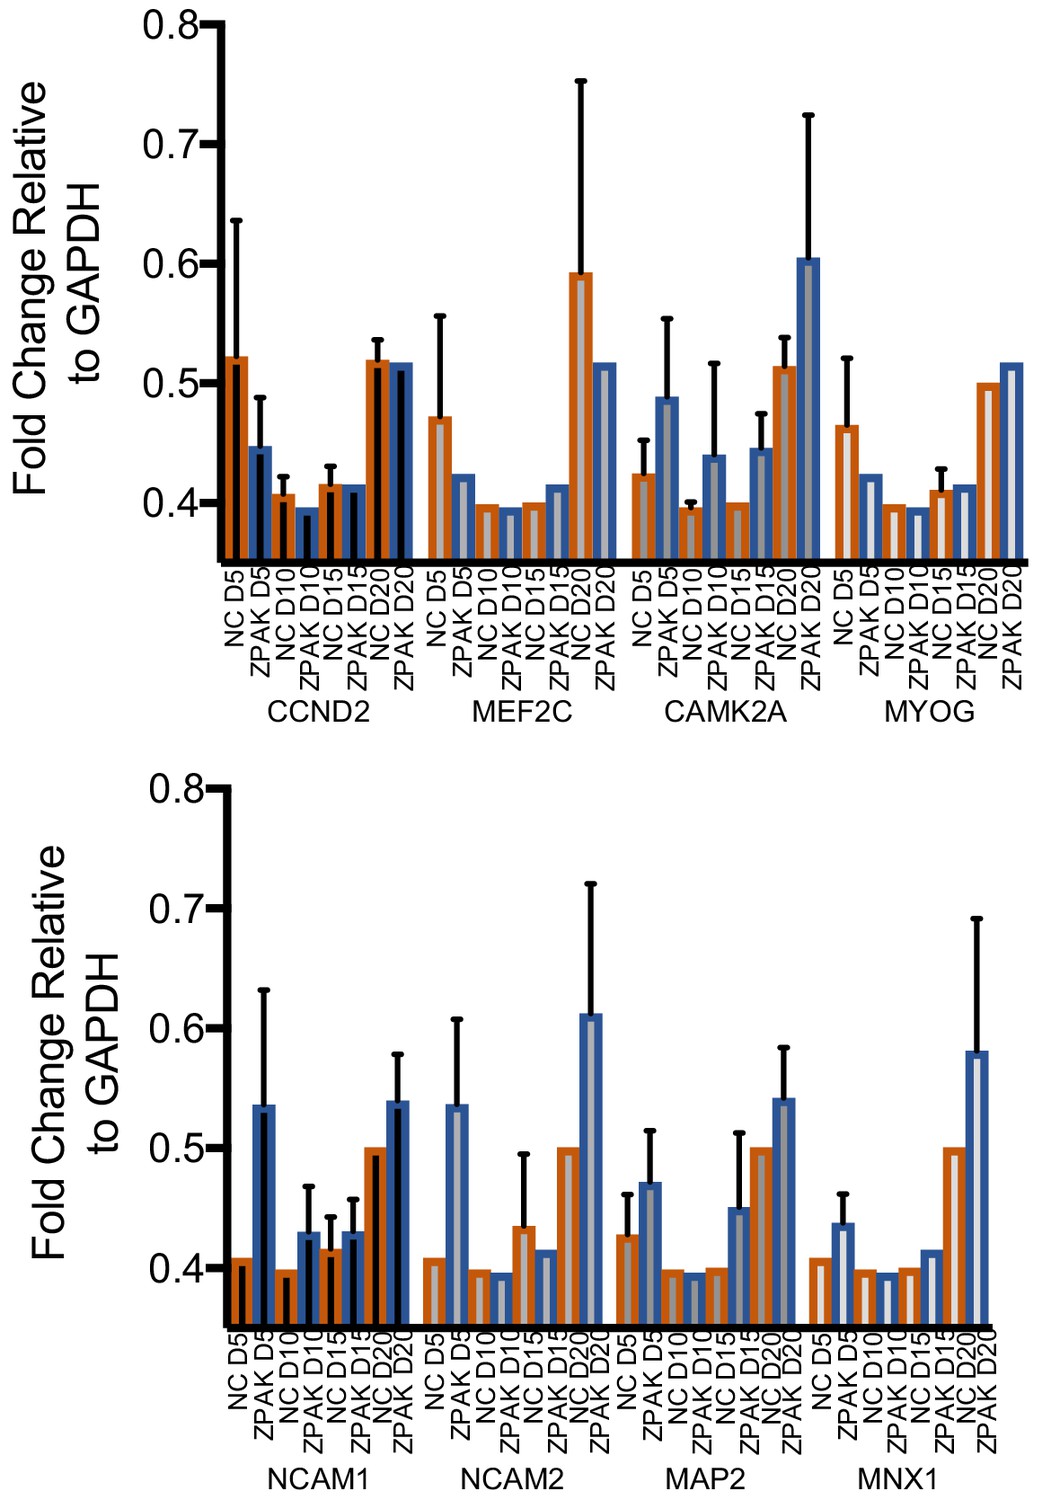
Fold change of genes activated or suppressed by ZPAK assessed by SYBR qPCR in L2, L5, and L7 at D5, 10, 15, and 20 of conversion relative to GAPDH.
https://doi.org/10.7554/eLife.41356.016
Figure 3—figure supplement 6
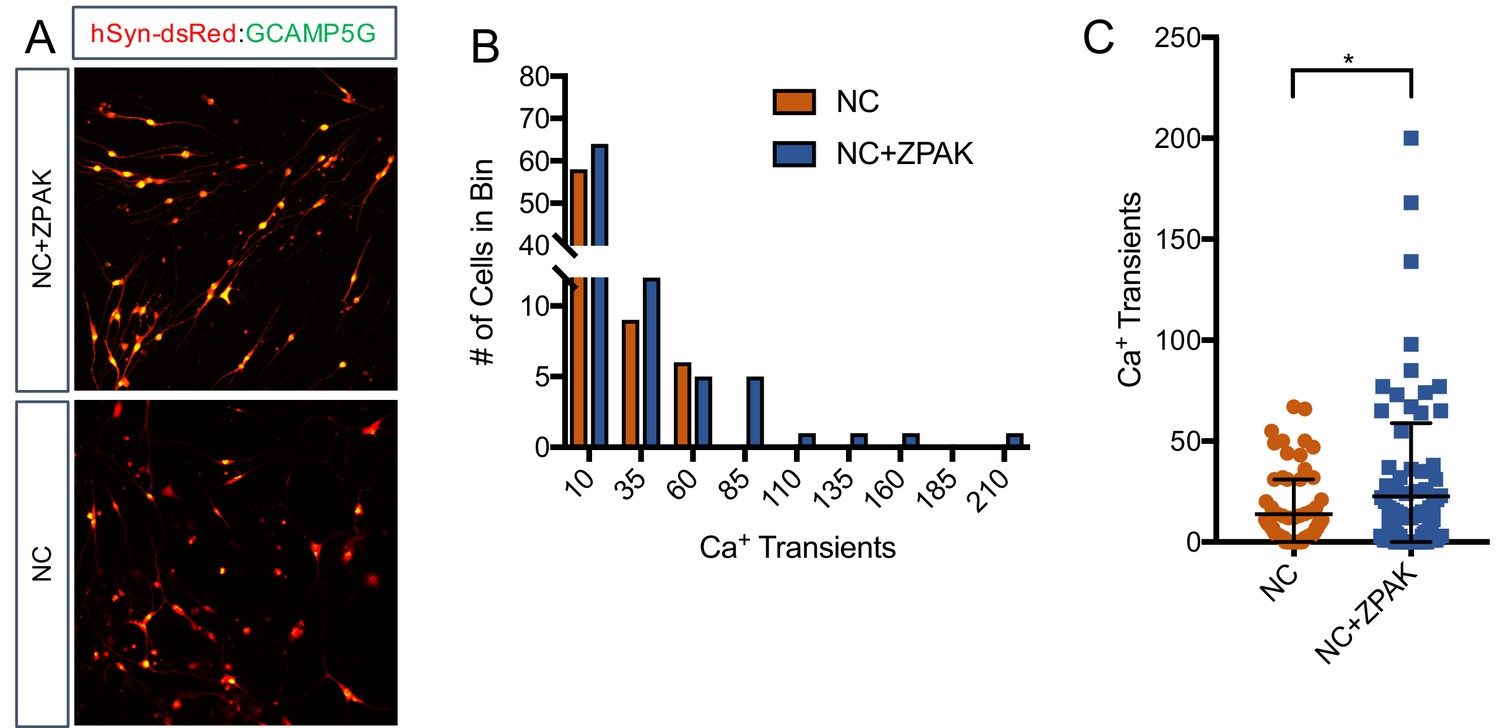
Calcium imaging reveals increased spontaneous activity in NC+ZPAK iNs.
(A) Representative image of iNs cultured with NC or NC+ZPAK and transduced with lentiviral particles for GCAMP5G or hSyn-dsRed. Ten areas of overlap in yellow per field with coexpression of hSyn and GCAMP were considered for calcium activity. (B) Histogram of number of calcium transients in four cell lines (L4, L2, L9, L8) converted in NC or NC+ZPAK. At almost all levels of spontaneous activity, there are more active ZPAK iNs compared to NC alone. Additionally, the most active neurons we observed were converted in NC+ZPAK. (C) Comparison of the activity of all cells (n = 160) quantified in this experiment shows a significantly increased level of spontaneous activity in NC+ZPAK iNs. Results are shown as mean ± SD. *p<0.05. Significance values were calculated by t-test.
Figure 4 with 1 supplement
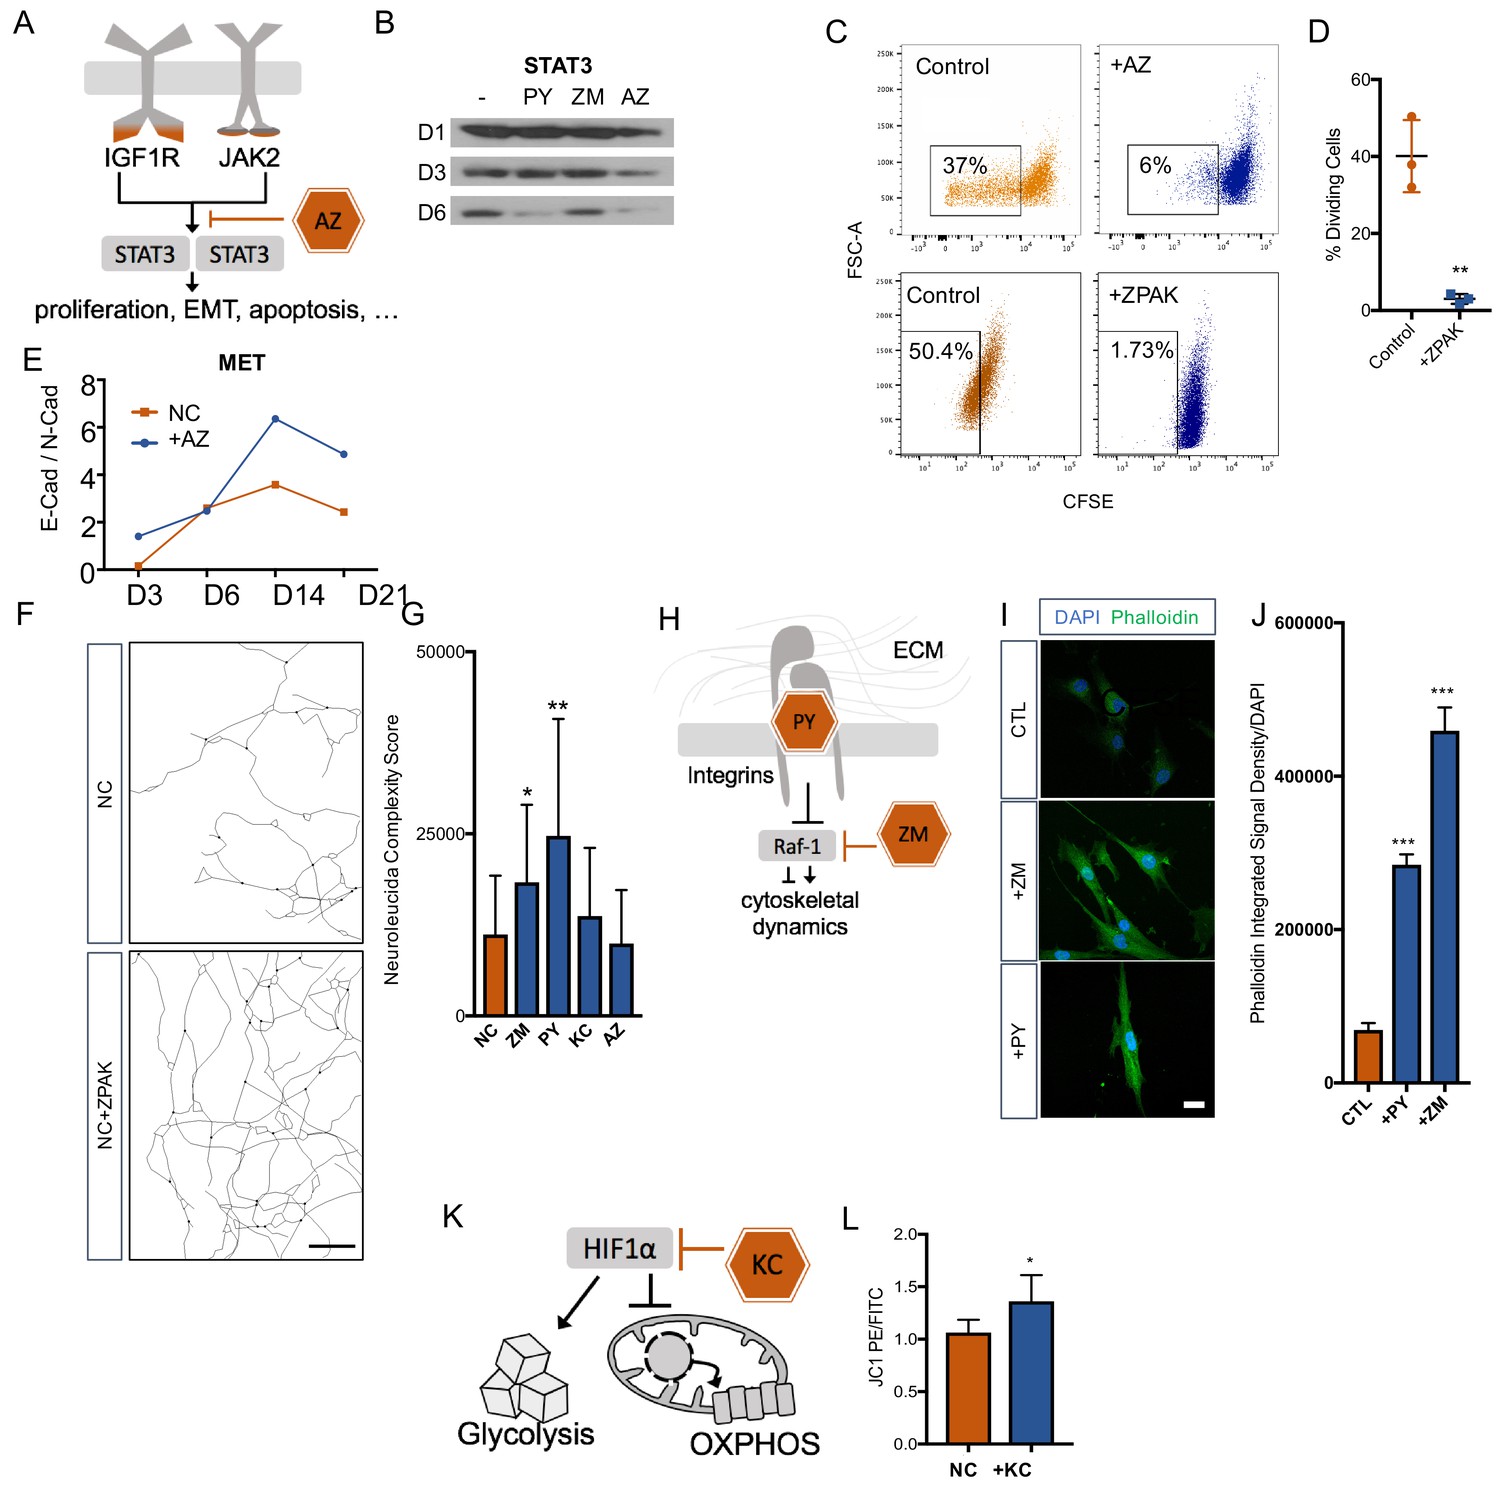
Cellular mechanisms influenced by ZPAK-mediated reprogramming.
(A) Schematic diagram of AZ targeting confluence of IGF1R and JAK2 signaling pathways. (B) Western blot analysis of protein levels of STAT3 assessed at one, three, and six days in L6 fibroblast media containing PY, ZM, AZ or control media. (C) CFSE stained L1, L5, and L8 fibroblasts cultured with control, AZ-containing medium, or ZPAK-containing medium for 48 hours after plating at 50% confluency. Boxes indicate percentages of cells that have undergone at least one cellular division. (D) Quantification of % dividing cell reduction in ZPAK from C. Results are shown as mean ± SD. n = 3, ** P < 0.01. Significance values were calculated by t-test. (E) Two color flow cytometry analysis of E- cadherin (E-Cad) and N-cadherin (N-Cad) expression in L10 and L6 fibroblast-to-iN conversion in NC or NC+AZ. Increasing ratios of E-Cad/N-Cad are indicative of the mesenchymal-to-epithelial switch. (F) Representative Neurolucida reconstruction of L1 reprogrammed for 21 days in NC or NC+ZPAK medium. Scale bar 100 μm (G) Neurolucida complexity scores of iNs derived from NC or NC+ZPAK components. Complexity scores were normalized to cell number by counterstaining with DAPI to count cell bodies. Results are shown as mean ± SD. n = 3, * P < 0.05. (H) Schematic diagram of PY and ZM interaction with cytoskeletal dynamics. (I) L1 fibroblasts cultured for 48h with ZM, PY, or CTL medium labeled for F-Actin with FITC Phallodidin and nuclei with DAPI. Scale bar 20 μm. (J) Integrated signal density of FITC phalloidin stain from H. Signal density was normalized to cell numbers by DAPI. Results are shown as mean ± SEM. n = 3, *** P < 0.001. (K) Schematic diagram of KC targeting HIF1α to inhibit glycolysis and promote oxidative phosphorylation (OXPHOS). (L) Mitochondria in L10, L4, & L2 iNs cultured for 21 days in NC or NC+KC stained with JC-1 and measured for membrane depolarization by flow cytometry. Increased ratios of aggregate (PE) to diffuse (FITC) JC-1 are indicative of increased mitochondrial membrane potential. Results are shown as mean ± SD. n = 3. Significance values were calculated by t-test.
Figure 4—figure supplement 1
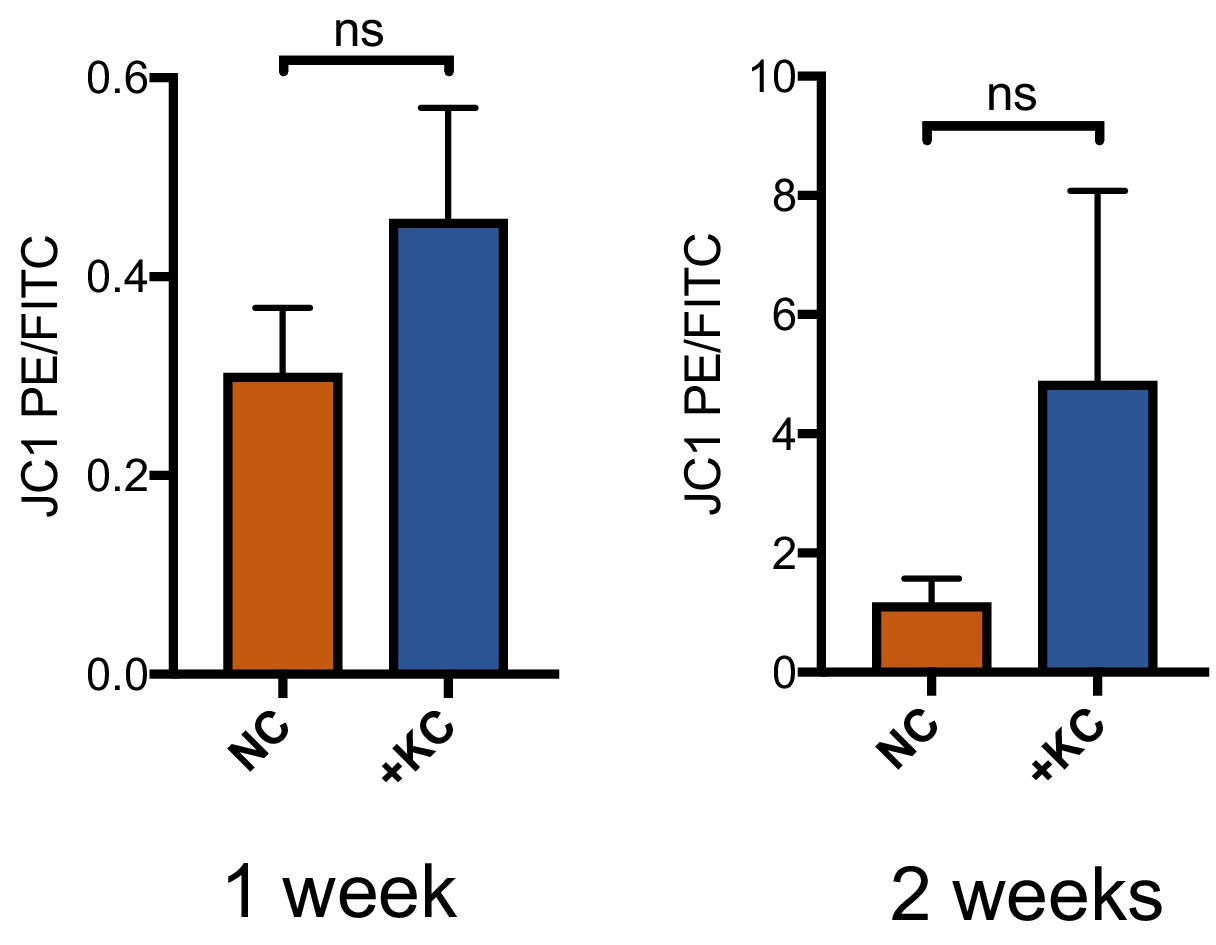
Mitochondria in L10, L4, and L2 iNs cultured for one or two weeks in NC or NC + KC, stained with JC-1 and measured for membrane depolarization by flow cytometry.
Increased ratios of aggregate (PE) to diffuse (FITC) JC-1 are indicative of increased mitochondrial membrane potential. Results are shown as mean ± SD. n = 3. Significance values were calculated by t-test.
Figure 5 with 1 supplement

Epigenetic signatures of donor age are preserved in ZPAK-derived iNs.
(A) Heat map showing the top 5000 significantly (padj < 0.05) differentially methylated CpGs between iNs generated by NC+ZPAK from two young (0, 1 years), two middle age (29 years), and two old (71, 87 years) donors, and one young and one old untreated fibroblast (0, 87 years, respectively). Each line represents a single probe. High methylation levels are shown in yellow, low methylation is shown in blue. Methylation of one young and one old paired, unconverted fibroblast is shown next to its iN counterpart. (B) Principal Component Analysis (PCA) of the methylation profiles of two young iNs, one young fibroblast, two middle age iNs, two old iNs, and one old fibroblast cell line. All iNs were reprogrammed with NC+ZPAK medium. Plot shows principal component one and principal component two for each sample. Samples closer to each other in principal component space are similar in their methylation profiles.
Figure 5—figure supplement 1
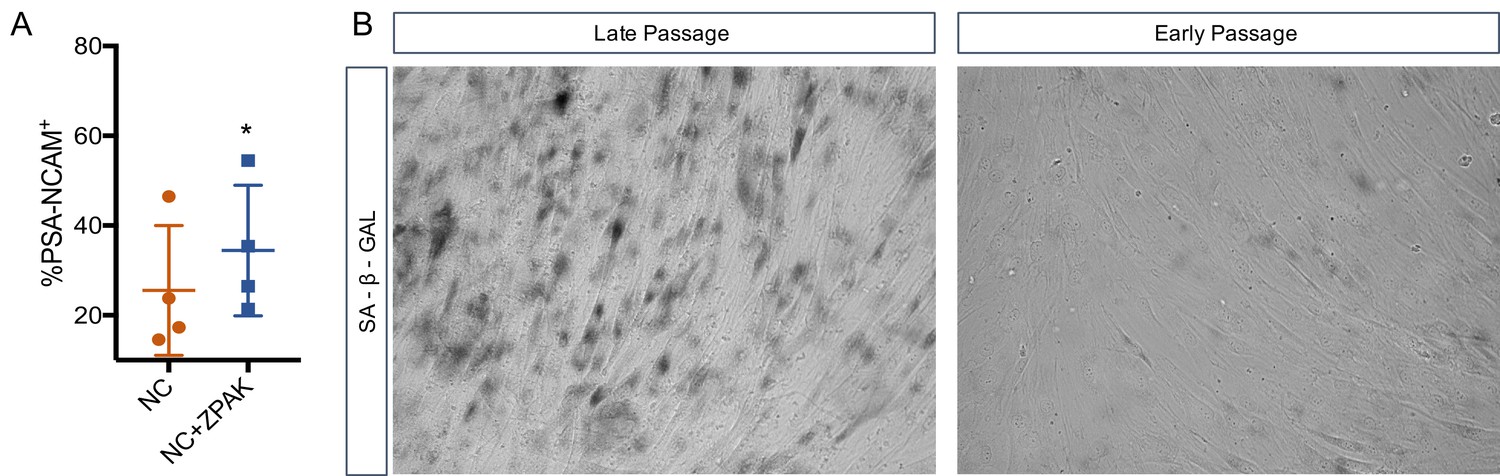
High passage iN conversion in NC and NC+ZPAK.
(A) % yield of PSA-CNAM+ iNs from four lines (L1, L4, L10, L8) of late passage (>30) fibroblasts converted in NC or NC+ZPAK. (B) representative brightfield images of early (p6) and late passage (p33) fibroblasts stained with senescence marker SA-B-Gal. Results are shown as mean ± SD. n = 4, *P<0.05. Significance values were calculated by t-test.
Tables
Key resources table
| Reagent type (species) or resource | Designation | Source or reference | Identifiers | Additional information |
|---|---|---|---|---|
| Chemical compound, drug | AZ960 | Cayman | RRID:SCR_008945 | |
| Chemical compound, drug | Pyrintegrin | Tocris | RRID:SCR_003689 | |
| Chemical compound, drug | ZM336372 | Cayman | RRID:SCR_008945 | |
| Chemical compound, drug | KC7F2 | Fischer Scientific | RRID:SCR_008452 | |
| Chemical compound, drug | Phalloidin CruzFluor 488 Conjugate | SCBT | RRID:AB_2631056 | ‘1:1000’ |
| Antibody | N-Cadherin (Mouse monoclonal) | Miltenyi Biotec | RRID:AB_2727381 | ‘1:50’ |
| Antibody | E-Cadherin (Mouse monoclonal) | Miltenyi Biotec | RRID:AB_10827695 | ‘1:11’ |
| Antibody | STAT3 (Rabbit monoclonal) | Cell Signaling | RRID:AB_2716836 | ‘1:1000’ |
| Antibody | Anti-NeuN (Mouse monoclonal) | EMD Millipore | RRID:AB_2298772 | ‘1:200’ |
| Antibody | Anti-Tubulin β−3 (Rabbit polyclonal) | Covance | RRID:AB_2313773 | ‘1:3000’ |
| Antibody | Anti-GABA (Rabbit polyclonal) | Sigma | RRID:AB_477652 | ‘1:500’ |
| Antibody | Anti-vGlut1 (Rabbit polyclonal) | Synaptic Systems | RRID:AB_887875 | ‘1:100’ |
| Antibody | Anti-TH (Rabbit polyclonal) | Pel-Freez | RRID:AB_2313713 | ‘1:250’ |
| Antibody | Anti-ChAT (Goat polyclonal) | EMD Millipore | RRID:AB_10615776 | ‘1:100’ |
| Antibody | Anti-5-HT (Rabbit polyclonal) | Protos Bio Tech | RRID:AB_2313881 | ‘1:1000’ |
| Antibody | Anti-PSANCAM (Mouse monoclonal) | Miltenyi Biotec | RRID:AB_1036069 | ‘1:50’ |
| Antibody | anti-MYH (Mouse monoclonal) | Santa Cruz Biotechnology | RRID:AB_10989398 | ‘1:100’ |
| Chemical compound, drug | Cell Trace CFSE | ThermoFisher Scientific | C34554 | |
| Commercial assay or kit | Mito Probe JC-1 | ThermoFisher Scientific | M34152 | ‘1:1000’ |
| Software, algorithm | Ingenuity Pathway Analysis | QIAGEN Bioinformatics | RRID:SCR_008653 |
Additional files
-
Transparent reporting form
- https://doi.org/10.7554/eLife.41356.023
Download links
A two-part list of links to download the article, or parts of the article, in various formats.
Downloads (link to download the article as PDF)
Open citations (links to open the citations from this article in various online reference manager services)
Cite this article (links to download the citations from this article in formats compatible with various reference manager tools)
Chemical modulation of transcriptionally enriched signaling pathways to optimize the conversion of fibroblasts into neurons
eLife 8:e41356.
https://doi.org/10.7554/eLife.41356


