A secretory pathway kinase regulates sarcoplasmic reticulum Ca2+ homeostasis and protects against heart failure
- University of California, San Diego, United States
- La Jolla Institute for Allergy and Immunology, United States
Figures
Figure 1

Fam20C phosphorylates luminal SR proteins and regulates CSQ2 polymerization.
(A) Representative autoradiograph and Flag immunoblot (IB) of Flag immunoprecipitates (IPs) of 32P-orthophosphate-labeled HEK293 cells co-expressing HA-tagged WT or D478A kinase-inactive (KI) Fam20C with the indicated substrates (n = 3). (B) Residues of Calsequestrin 2 (CSQ2) corresponding to the only Fam20C S-x-E phosphorylation motif on the protein are highlighted in blue. (C) Representative autoradiograph and Flag IB of Flag IPs of 32P-orthophosphate-labeled rat cardiomyoblast H9C2 cells expressing the indicated variant of CSQ2 (n = 3). (D) Representative autoradiograph of time-dependent incorporation of [γ-32P] ATP into CSQ2 using purified proteins in an in vitro kinase assay (n = 3). CSQ2-His was expressed and purified from E. coli and Fam20C WT or KI was purified from baculovirus. Corresponding IB of α-His is shown below. (E) Turbidity of un- and phosphorylated-CSQ2 as measured by absorbance at 350 nm (n = 3). (F) Model demonstrating the consequence of Fam20C phosphorylation of CSQ2.
Figure 2
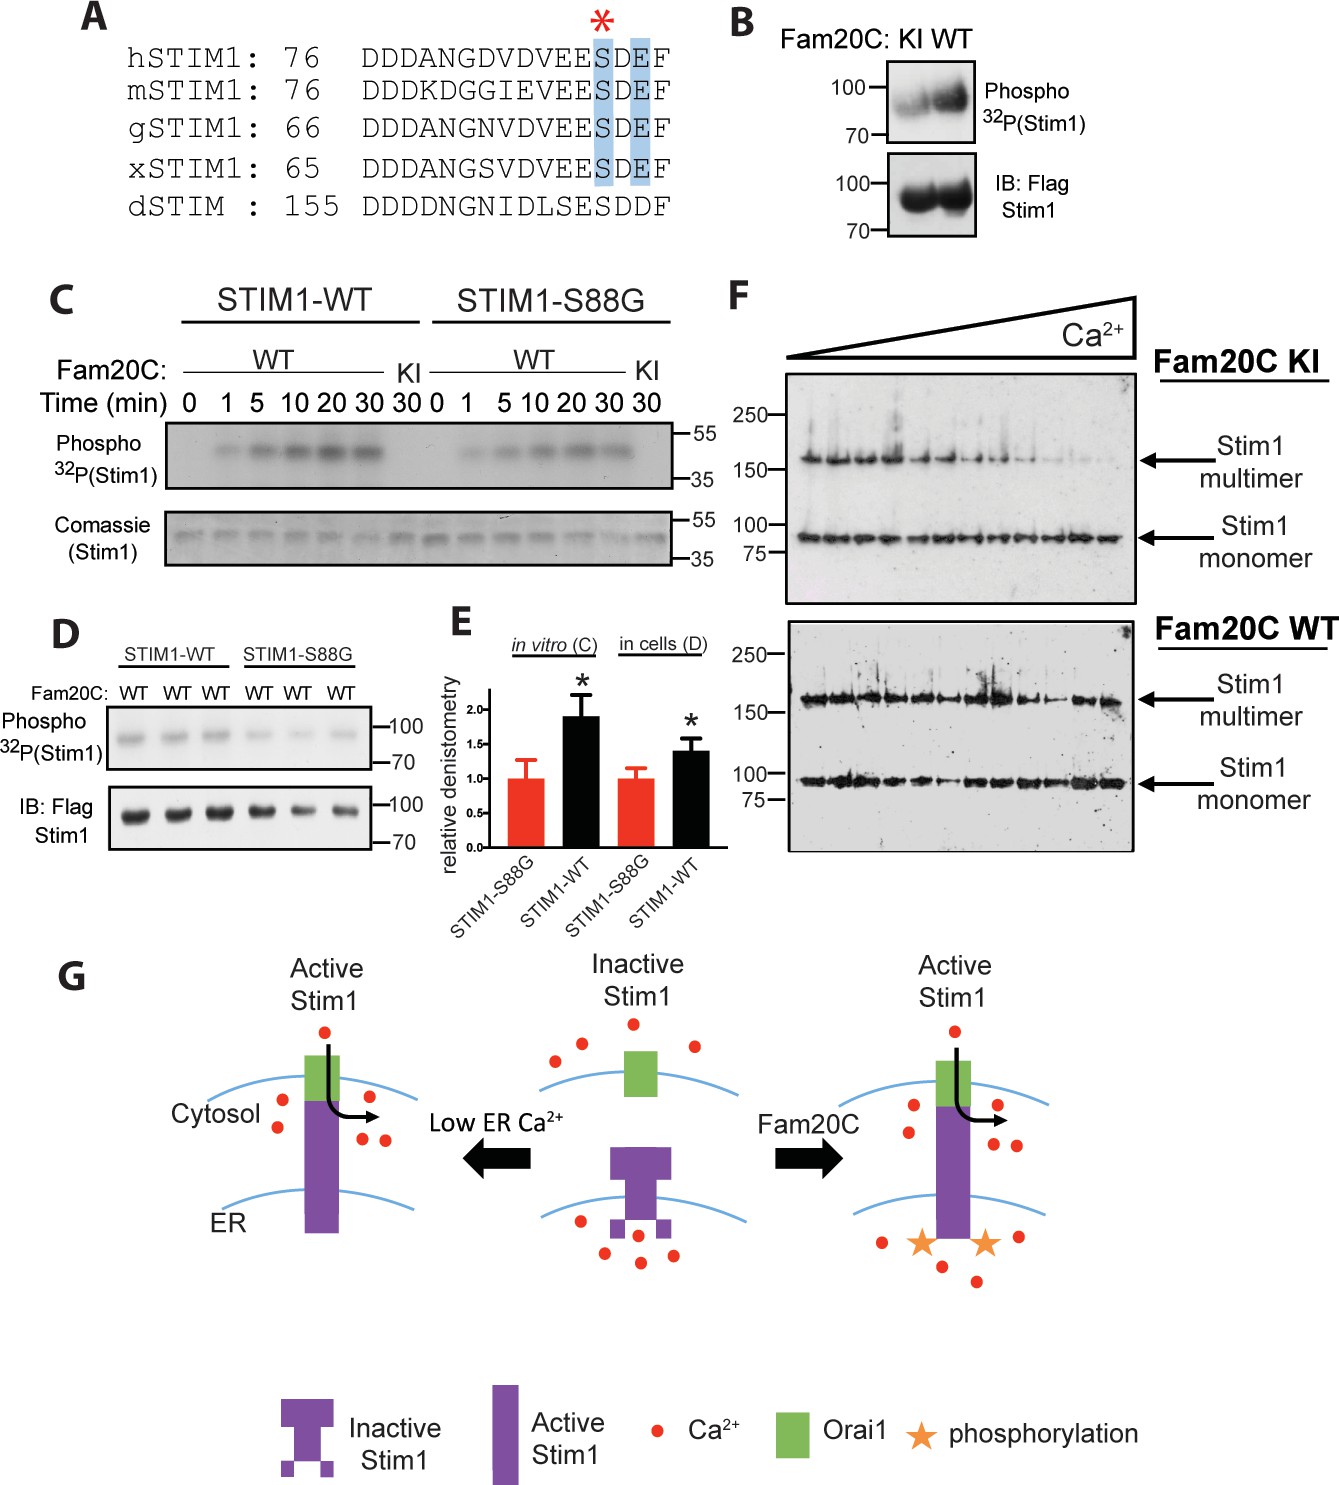
Fam20C phosphorylation of Stim1 regulates Stim1 activation (A) Residues of Stim1 from the canonical Ca2+-binding EF-hand loop corresponding to the Fam20C S-x-E phosphorylation motif are highlighted in blue.
Heart disease associated Stim1-Ser88 is noted with an asterisk (h: human, m: mouse, g: gallus, x: xenopus, d: drosophila). (B) Representative autoradiograph and Flag IB of Flag IPs of 32P-orthophosphate-labeled HEK293 cells co-expressing Stim1-Flag and HA-tagged WT or D478A kinase-inactive (KI) Fam20C (n = 3). (C) Representative autoradiograph of time-dependent incorporation of [γ-32P] ATP into Stim one using purified proteins in an in vitro kinase assay. His-tagged Stim1 was expressed and purified from E. coli, and Fam20C WT or KI was purified from baculovirus (n = 6). Corresponding coomassie staining is shown below. (D) Representative autoradiograph and Flag IB of Flag IPs of 32P-orthophosphate-labeled HEK293 cells co-expressed with Stim1 and WT Fam20C (n = 6). (E) Densitometry relative to protein control of autoradiograph from C and D (at 30 min time point). (F) Representative western blots showing the crosslinking of Stim1(A230C) co-expressed with either Fam20C KI (top), or Fam20C WT (bottom), in cellular membranes incubated with increasing Ca2+ concentrations (0–2.0 mM) (n = 3). Crosslinked, multimerized (active) Stim one is indicated by the upper arrow, and monomeric (inactive) Stim1 is indicated by the lower arrow. (G) Model demonstrating Stim1 activation via either low ER Ca2+ or Fam20C phosphorylation. Data are represented as the mean ±SEM. *p < 0.05 by Student’s t test.
Figure 3 with 1 supplement
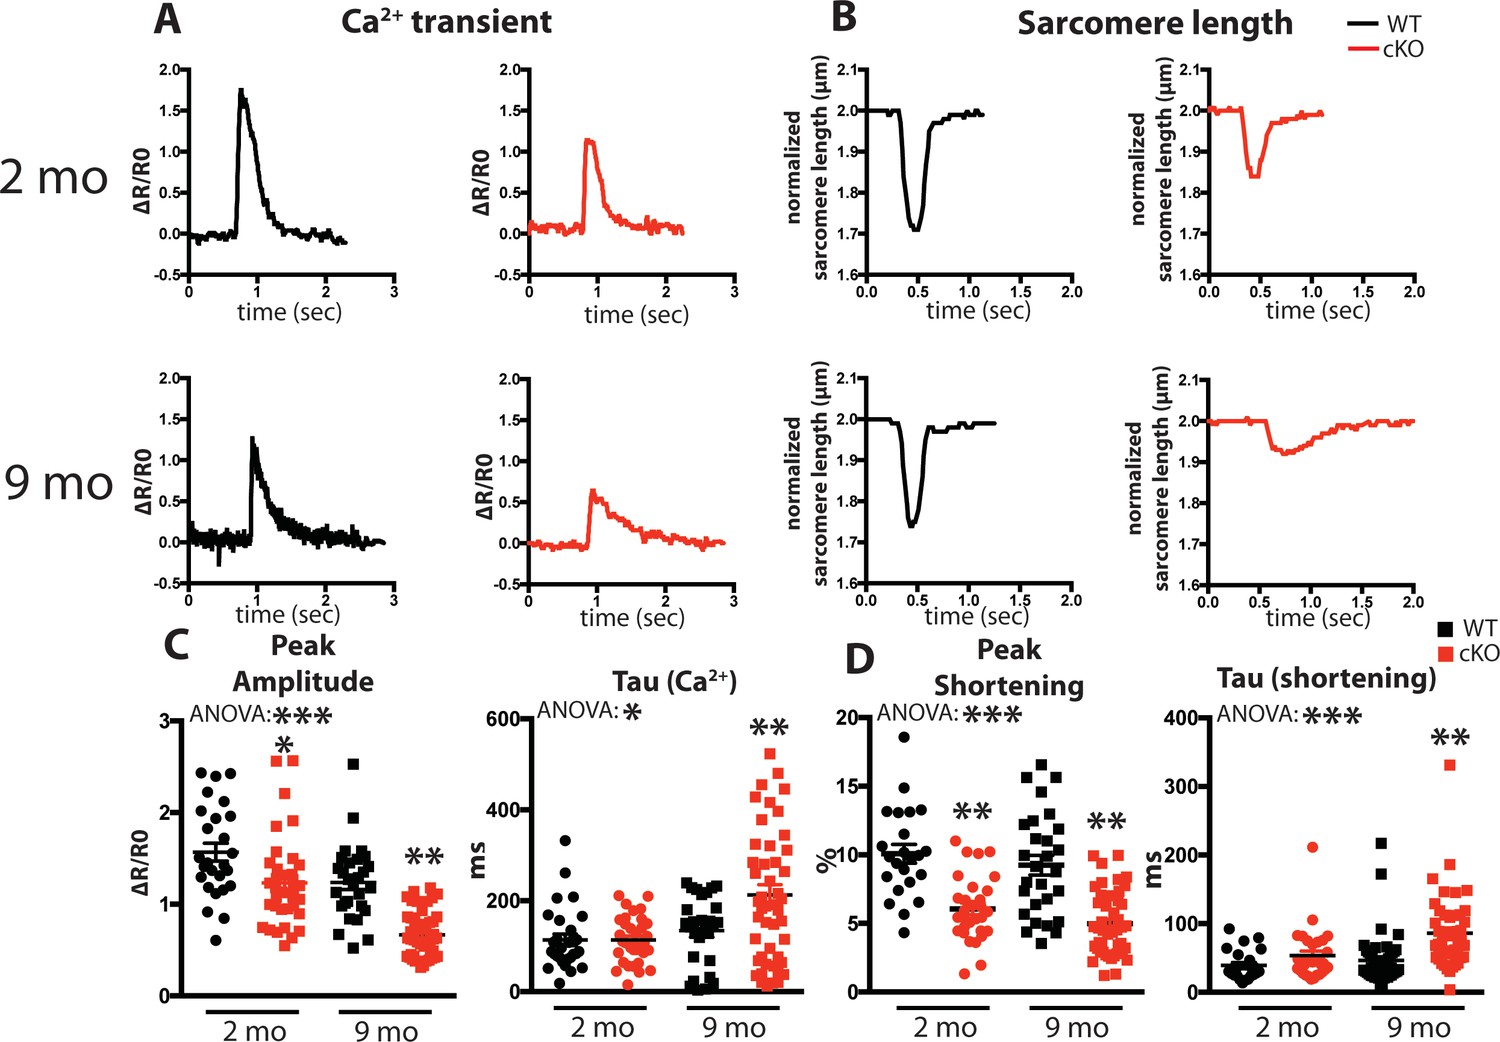
Fam20C regulates Ca2+ handling in isolated cardiomyocytes.
(A and B) Tracing of 0.5 Hz stimulated isolated cardiomyocytes for (A) Ca2+ transients (change between the basal and peak ratio (ΔR) of Fura2-AM fluorescence) and (B) sarcomere length for 2 (top) and 9 (bottom) months old mice. (C) Quantitation of normalized peak amplitude (left) and relaxation constant tau (right) of Ca2+ transients from A. (D) Quantitation of peak amplitude changed (left) and relaxation constant tau (right) of sarcomere length from B (n = 3 mice, 15–25 cardiomyocytes per mice). Data are represented as the mean ±SEM. *p < 0.05; **p < 0.01, by Student’s t test or ANOVA (when indicated) for WT v. cKO.
Figure 3—figure supplement 1
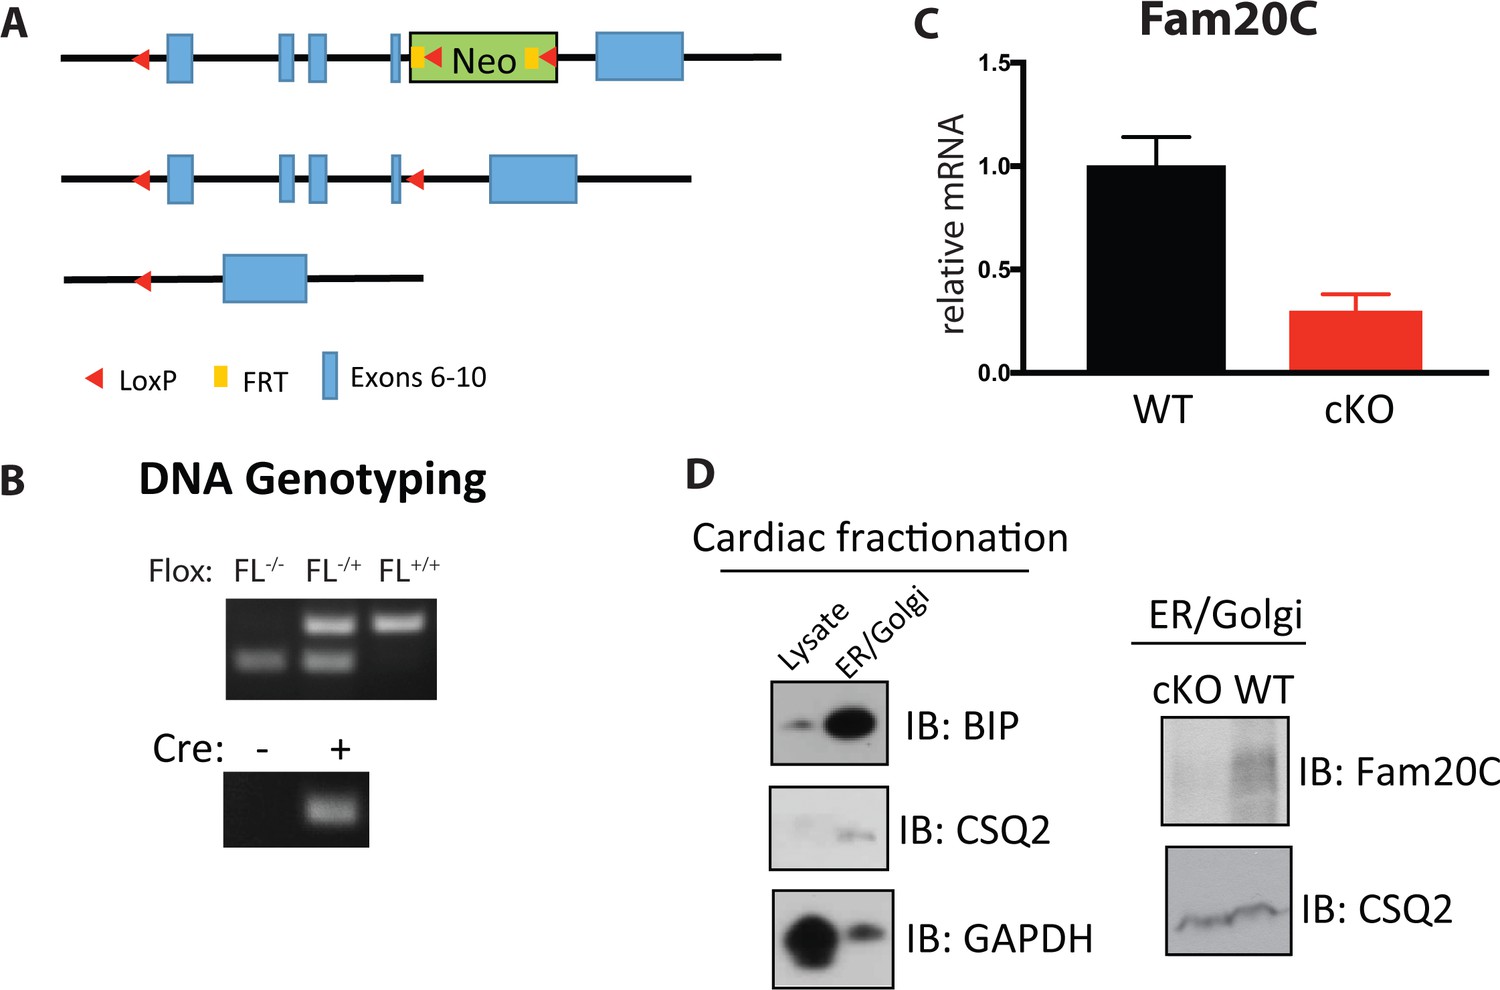
Generation of cardiac specific Fam20C cKO mice.
(A) Targeting strategy used to generate a floxed allele of Fam20c. (B) PCR-based DNA electrophoresis genotyping to determine floxed and Cre alleles. (C) RT-qPCR of Fam20C expression of whole heart lysates from 2 months old mice (n = 3). (D) Whole heart lysates were subjected to differential centrifugation fractionation and were analyzed by Immunoblotting.
Figure 4 with 1 supplement
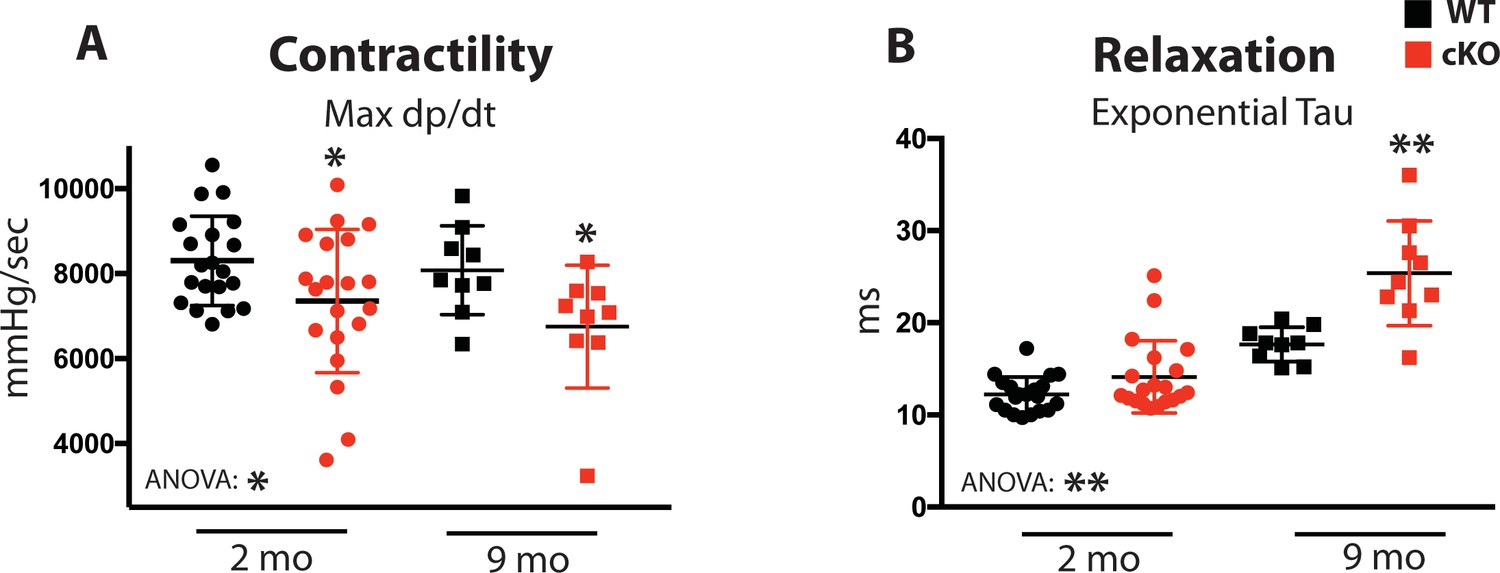
Fam20C regulates cardiac contractility and relaxation in vivo.
Hemodynamic assessment of contraction and relaxation (n = 9–20). (A) Assessment of maximum pressure difference over time (dP/dt). (B) Assessment of the isovolumetric relaxation constant tau. Data are represented as the mean ±SEM. *p < 0.05; **p < 0.01, by Student’s t test or ANOVA (when indicated) for WT v. cKO.
Figure 4—figure supplement 1
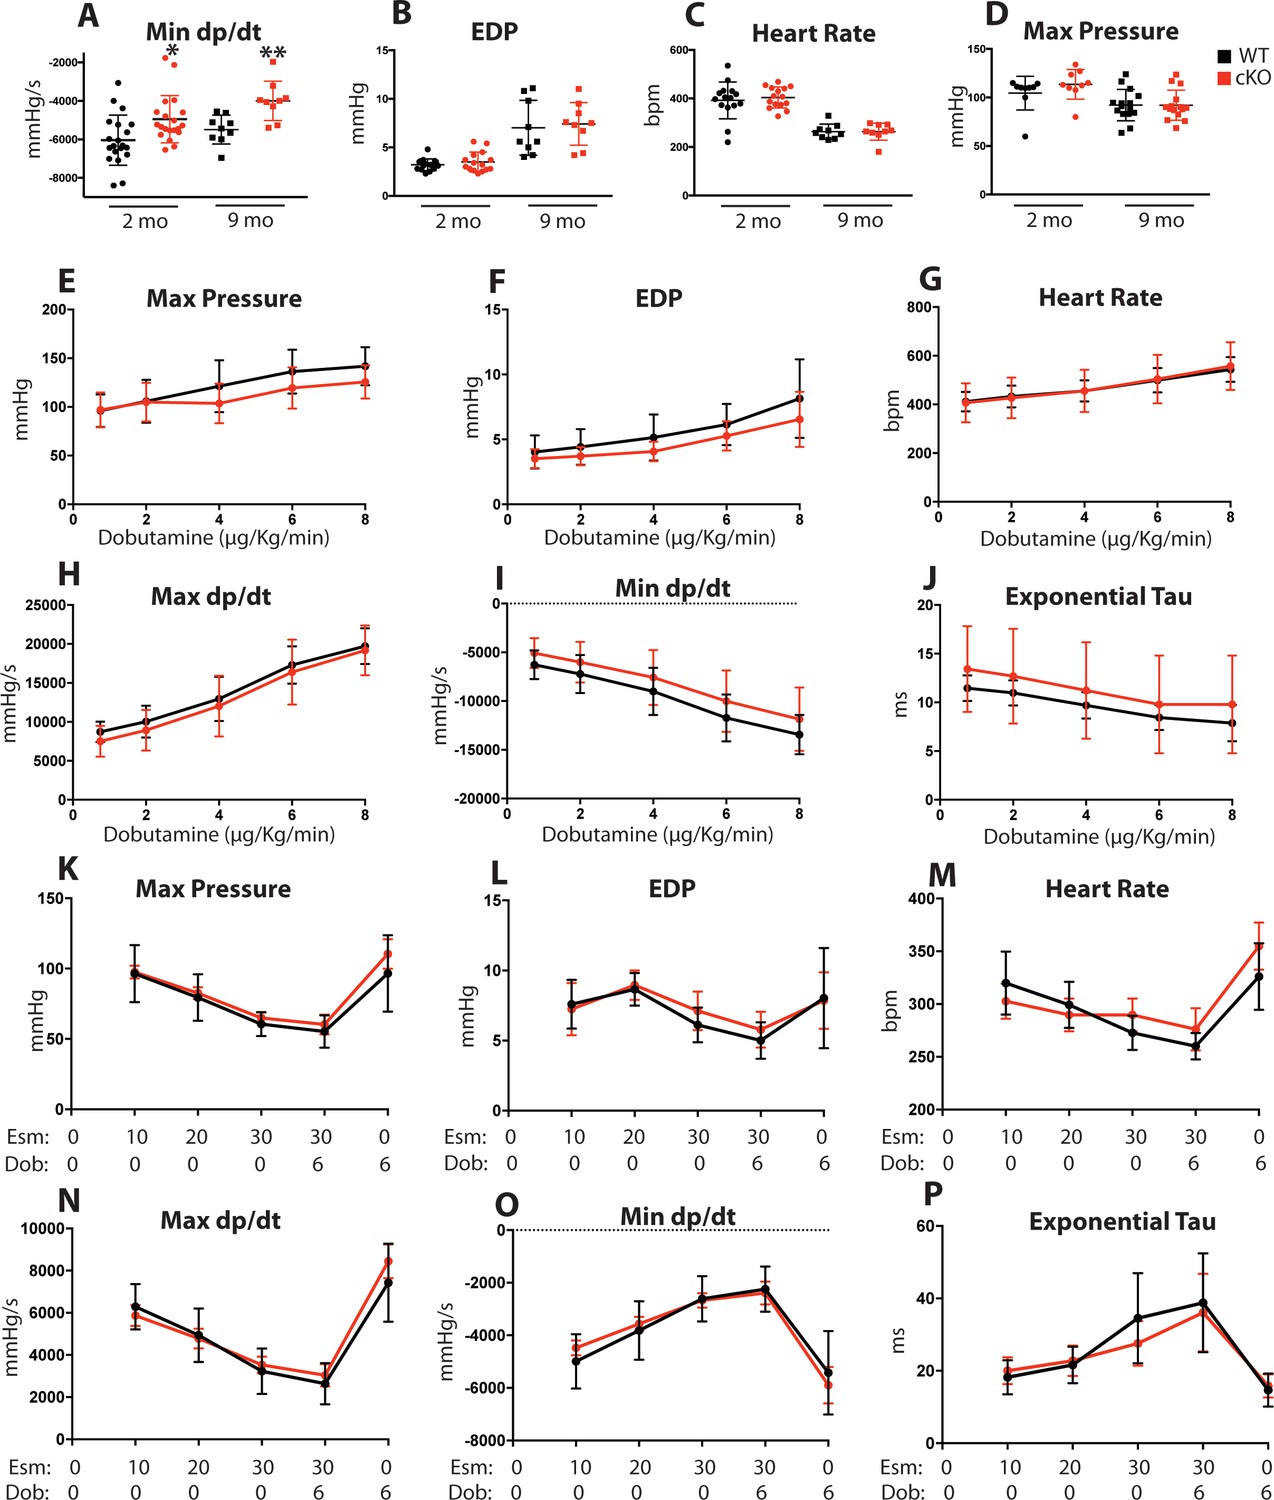
Role of Fam20C in the acute hemodynamic response to β-adrenergic receptor activation.
(A–D) Changes in LV hemodynamic variables of 2 and 9 months old mice for (A) minimum dP/dt, (B) end-diastolic pressure, (C) heart rate in beats/min (bpm), and (D) maximum LV pressure (n = 9–20). (E–P) Changes in LV hemodynamic variables with dobutamine (n = 9) (E–J) and esmolol (n = 6) (K–P) infusion of 2 months old mice. Calculated values for (E) maximum LV pressure, (F) end-diastolic pressure (EDP), (G) heart rate in beats/min (bpm), (H) maximum dP/dt, (I) minimum dP/dt, and (J) time constant for relaxation (Tau). Dobutamine doses are given in micrograms per kilogram per minute. Calculated values for (K) maximum LV pressure, (L) end-diastolic pressure (EDP), (M) heart rate in beats/min (bpm), (N) maximum dP/dt, (O) minimum dP/dt, and (P) time constant for relaxation (Tau). Esmolol doses are given in milligrams per kilogram per minute. Data are represented as the mean ±SEM. *p < 0.05; **p < 0.01, by Student’s t test for WT v. cKO.
Figure 5
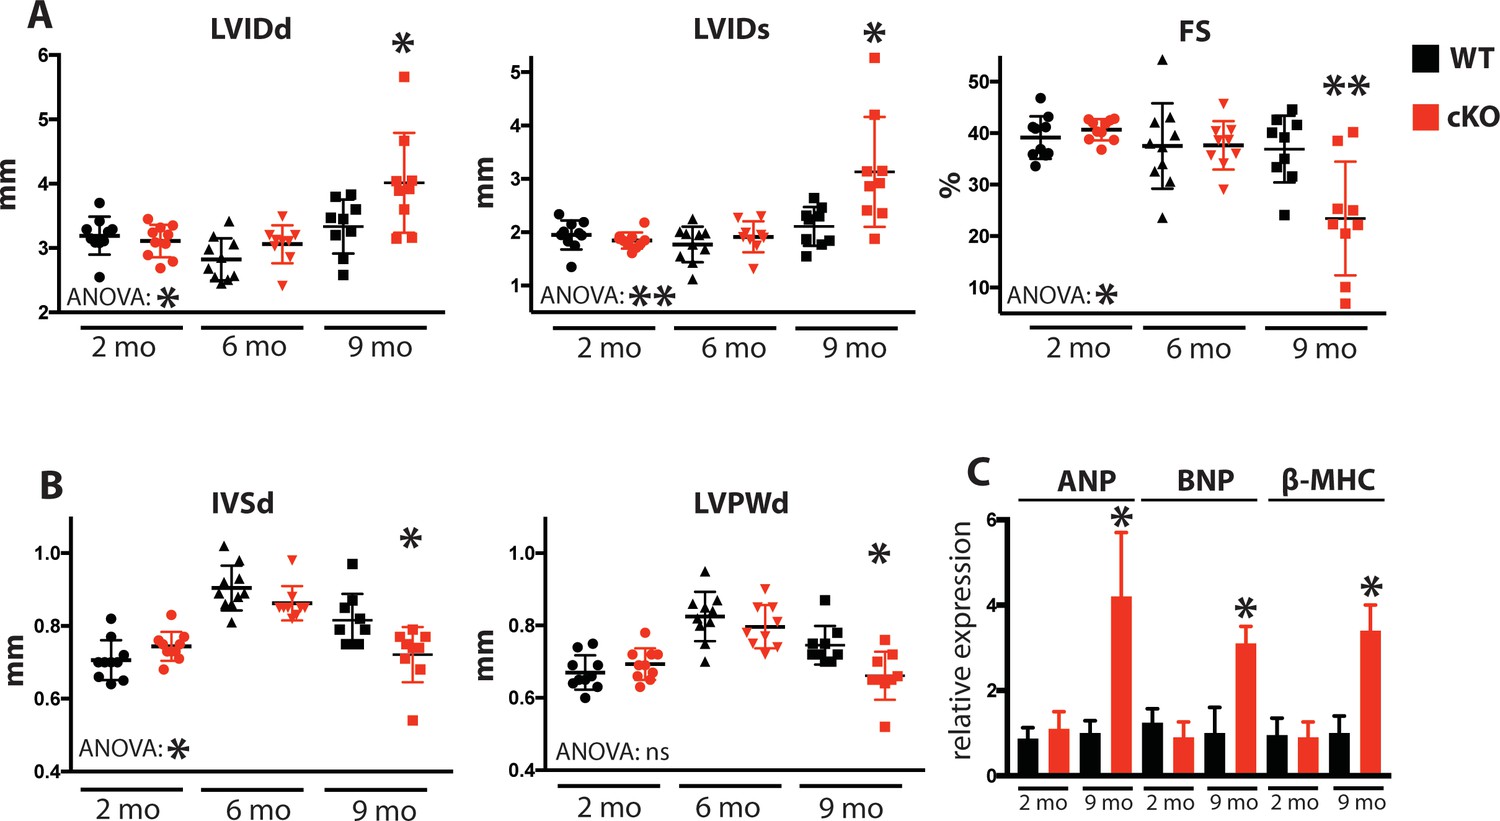
Fam20C cKO mice develop heart failure upon aging.
(A and B) Echocardiographic measurements for Fam20CFl/Fl α-MHC-Cre-positive (cKO) and α-MHC-Cre-negative littermate control mice (WT) (n = 10 mice at 2, 6, and 9 months) of (A) LVIDd, LVIDs, LV FS, (B) IVSd, and LVPWd. (C) RT-qPCR of cardiac fetal gene markers of Fam20C WT and cKO mice at 2 and 9 months (n = 3). Data are represented as the mean ±SEM. *p < 0.05; **p < 0.01, or ns (not significant) by Student’s t test or ANOVA (when indicated) for WT v. cKO.
Figure 6 with 1 supplement
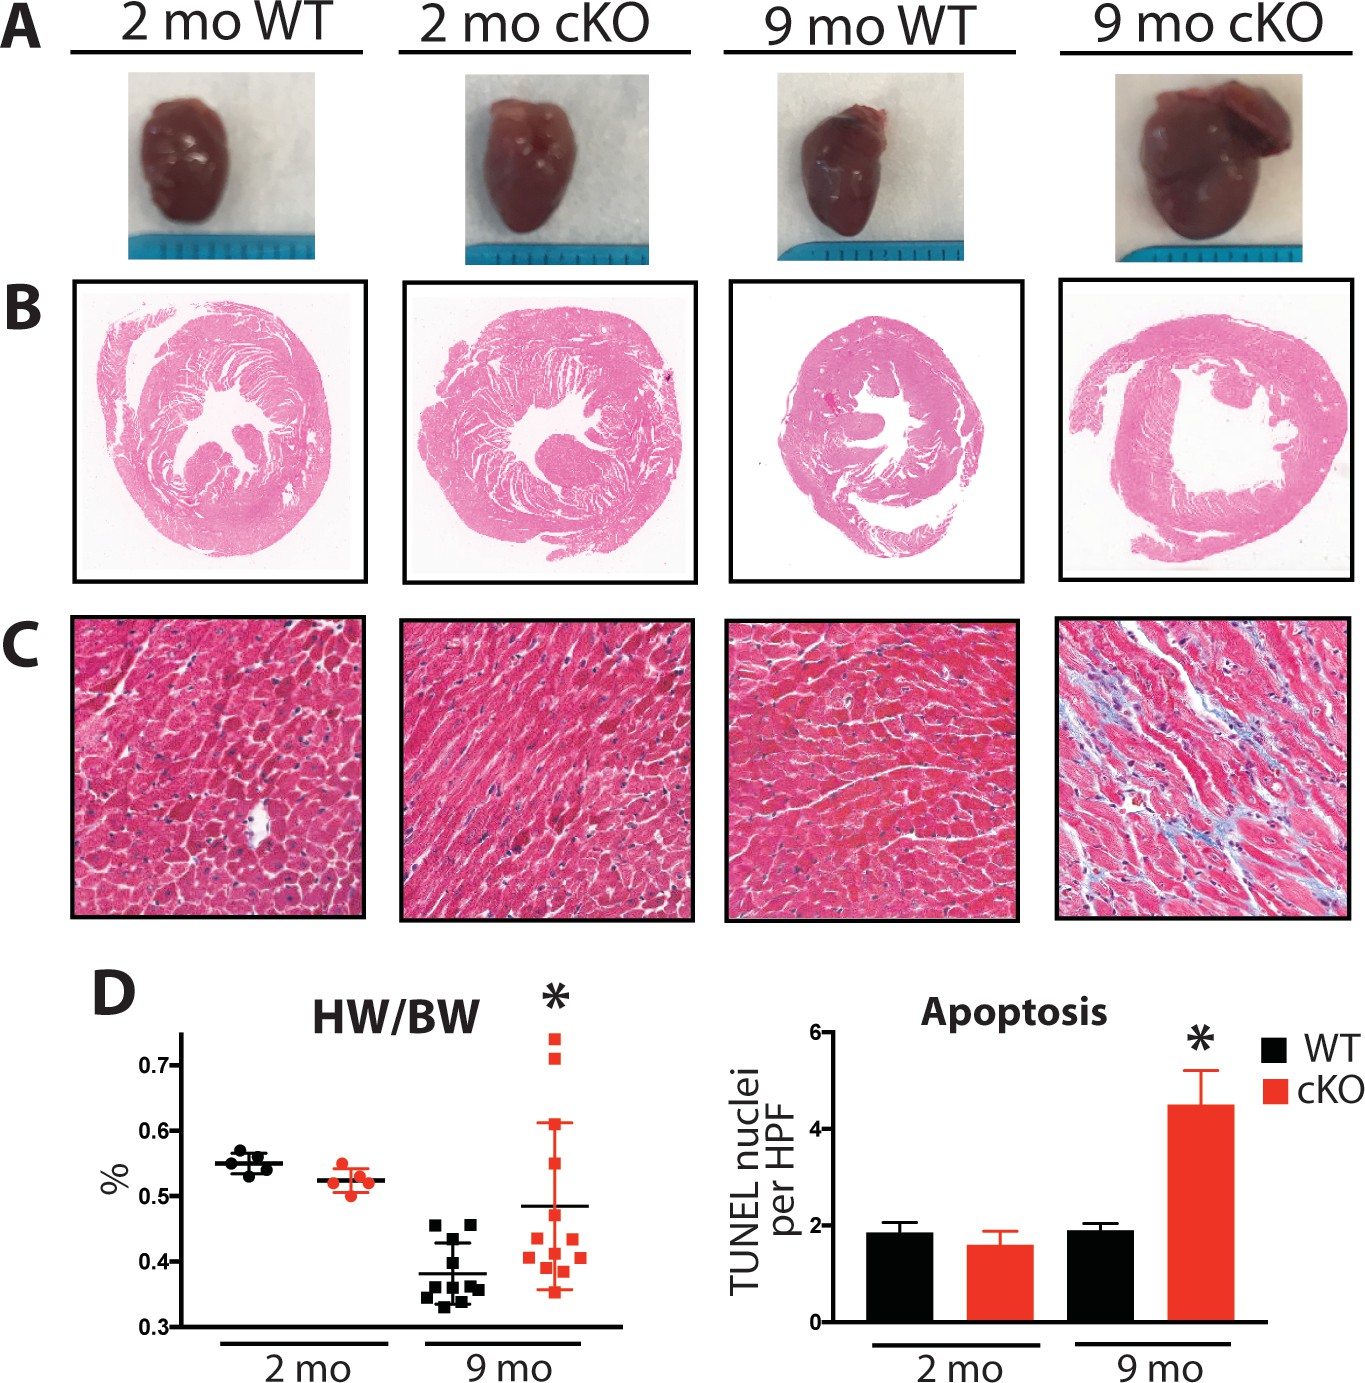
Aging Fam20C cKO mice develop fibrosis, apoptosis, and DCM.
(A) Representative macroscopic view of whole mouse hearts. (B and C) Representative microscopic view of (B) H and E stained (1x magnification) and (C) Masson’s Trichrome stained (40x magnification) cardiac sections (n = 3). (D) Heart weight to body weight ratios (n = 5–13) (left). Quantitation of TUNEL positive nuclei per high powered field (HPF) (n = 3 mice) (right). Data are represented as the mean ±SEM. *p < 0.05; **p < 0.01, by Student’s t test for WT v. cKO.
Figure 6—figure supplement 1
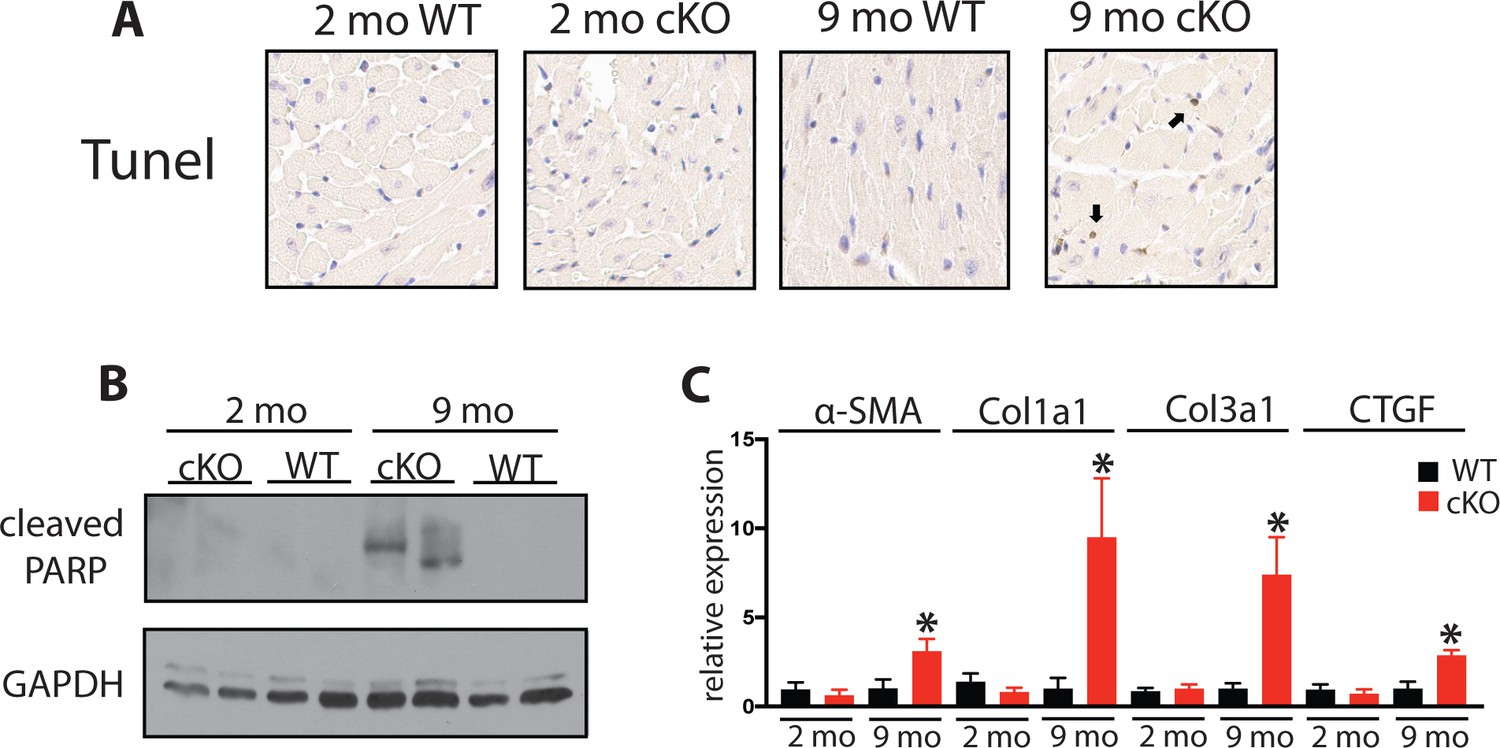
Aging Fam20C cKO mice develop apoptosis and fibrosis.
(A) Representative microscopic view of TUNEL stained cardiac sections (40x magnification) (n = 3 mice). (B) Whole heart lysates were immunoblotted for cleaved PARP and GAPDH loading control. (C) RT-qPCR of profibrotic genes (n = 3). Data are represented as the mean ±SEM. *p < 0.05 for WT v. cKO by Student’s t test.
Figure 7 with 1 supplement

Fam20C cKO mice develop heart failure following induced pressure overload.
(A) Echocardiographic measurements for baseline (2 months old) mice and after 4 weeks of TAC (n = 7–9) of LVIDd, LVIDs, and LV FS. (B) Heart weight to body weight ratios (n = 5–9) (left). RT-qPCR of cardiac fetal gene markers following TAC (n = 3) (right). (C) Representative microscopic view of Masson’s Trichrome stained (40x magnification) cardiac sections following TAC (n = 3 mice). (D) Mice were subjected to 2 weeks of chronic Isoproterenol (ISO) infusion (n = 5–9). Heart weight over body weight ratio (n = 5–9) (left) and RT-qPCR of cardiac fetal gene markers (n = 3) (right). Data are represented as the mean ±SEM. *p < 0.05, **p < 0.01, for WT v. cKO; † p < 0.05 for TAC or ISO treatment by Student’s t test.
Figure 7—figure supplement 1

Induced pressure overload causes hypertrophy, apoptosis in Fam20C cKO mice.
(A) Pressure gradient 1 month after TAC (n = 7–9). (B–C) Echocardiographic measurements for baseline (2 months old) mice and 1 month after TAC of (B) IVSd and (C) LVPWd (n = 7–9). (D) Representative microscopic view of TUNEL stained cardiac sections (40x magnification) (n = 3 mice). (E) Quantitation of TUNEL positive nuclei per high powered field (HPF) (n = 3). Data are represented as the mean ±SEM. *p < 0.05; **p < 0.01 for WT v. cKO; † p < 0.05 for TAC or ISO treatment by Student’s t test.
Figure 8
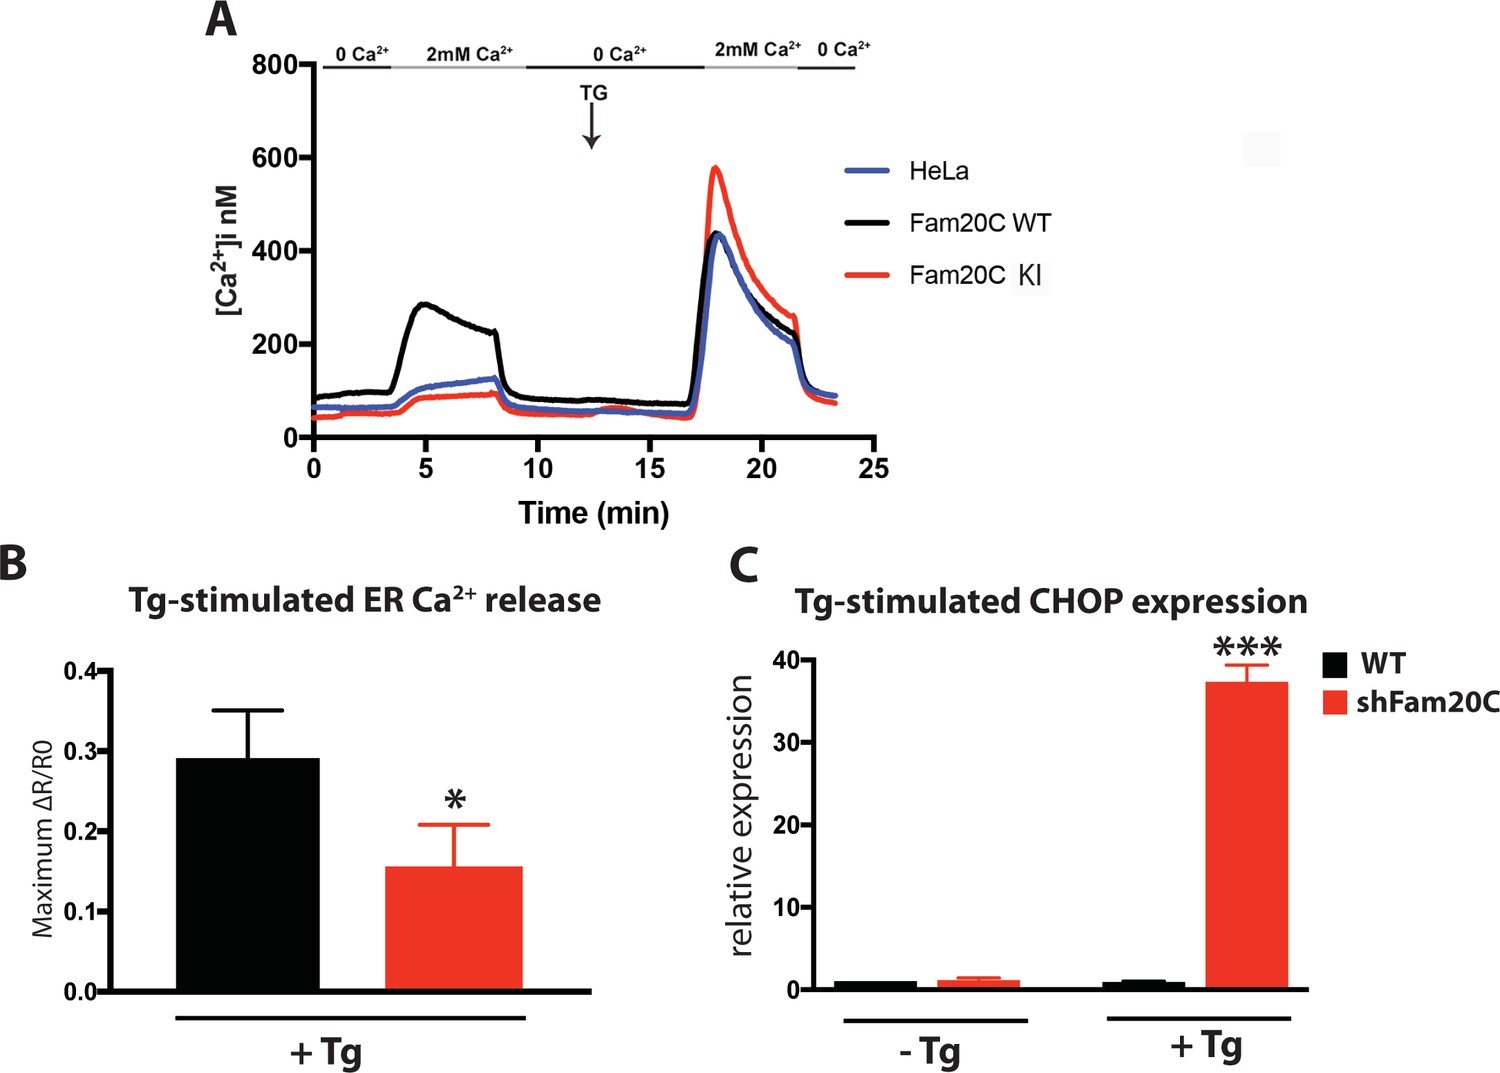
Fam20C regulates ER Ca2+ homeostasis.
(A) Single-cell [Ca2+]i measurements in HeLa cells expressing Fam20C WT (n = 156), Fam20C KI (n = 139), or in non-transfected HeLa cells (HeLa; n = 126). Cells were exposed to solutions containing varied concentrations of CaCl2 or 1 μM thapsigargin (TG) as indicated. (B) Peak Ca2+ release (maximum minus basal, peak ratio (ΔR) of Fura2-AM fluorescence) of WT and Fam20C shRNA knockdown (shFam20C) U2OS cells following 2 μM thapsigargin (Tg) treatment. (C) RT-qPCR of UPR response gene CHOP expression of WT and shRNA Fam20C knockdown U2OS cells following mild stimulation with thapsigargin (250 nM, 4 hr). Data are represented as the mean ±SEM. *p < 0.05; ***p < 0.001, by Student’s t test for WT v. shFam20C.
Tables
Key resources table
| Reagent type (species) or resource | Designation | Source or reference | Identifiers | Additional information |
|---|---|---|---|---|
| Antibody | Mouse monoclonal M2 FLAG | Sigma | A2220-5 ml, RRID:AB_439685 | (1:100) |
| Antibody | Rabbit polyclonal anti-Flag | Sigma | F7425-.2MG, RRID:AB_796202 | (1:1000) |
| Antibody | Rabbit polyclonal anti-Stim1 | Cell Signaling | 4916S, RRID:AB_1849882 | (1:1000) |
| Antibody | Rabbit polyclonal anti 6x-His | Thermo Fisher | MA1-21315- HRP, RRID:AB_10977997 | (1:2000) |
| Antibody | Rabbit polyclonal anti Bip/ GRP78 | Abcam | ab21685, RRID:AB_880312 | (1:1000) |
| Antibody | Rabbit polyclonal anti Calsequestrin 2 | Thermo Fisher | PA1-913, RRID:AB_2540244 | (1:5000) |
| Antibody | Mouse monoclonal anti GAPDH | Calbiochem | CB1001 | (1:10000) |
| Antibody | Mouse monoclonal anti PARP (cleaved) | Cell Signaling | 9541S, RRID:AB_2160592 | (1:1000) |
| Antibody | Rabbit polyclonal anti Fam20C | Tagliabracci et al., 2013 Tagliabracci et al., 2013 | (1:5000) | |
| Chemical compound, drug | Trizol | Thermo Fisher | 15596026 | |
| Chemical compound, drug | Esmolol | abcam | ab146018 | |
| Chemical compound, drug | Dobutamine | abcam | ab120768 | |
| Chemical compound, drug | Thapsigargin | Thermo Fisher | 586005– 1 MG | |
| Chemical compound, drug | 32P-orthophosphate | PerkinElmer | NEX05 3010MC | |
| Chemical compound, drug | Gamma 32P ATP | PerkinElmer | BLU002Z001MC | |
| Chemical compound, drug | Fura-2, AM, cell permeant | Thermo Fisher | F1221 | |
| Software, algorithm | Graph Pad Prism | Version 7 | ||
| Sequence-based reagent | RT-qPCR primers | this paper | Table 1 | |
| Genetic reagent (M. musculus) | Fam20c Fl/+ | inGenious Targeting Laboratory | ||
| Commercial assay or kit | iScript cDNA Synthesis kit | BioRad | 1708891 | |
| Commercial assay or kit | nucleospin RNA kit | MACHEREY- NAGEL | 740955.25 | |
| Commercial assay or kit | ApopTag Peroxidase In Situ Apoptosis Detection | Millipore Sigma | S7100 | |
| Cell line (homo sapiens) | HEK293T | Tagliabracci et al., 2013 Tagliabracci et al., 2013 | RRID:CVCL_6910 | |
| Cell line (homo sapiens) | HeLa | Hirve et al., 2018 | RRID:CVCL_0030 | |
| Cell line (homo sapiens) | U2OS (WT/shFam20C) | Tagliabracci et al., 2013 Tagliabracci et al., 2013 | RRID:CVCL_0042 | |
| Cell line (rattus norvegicus) | H9C2 | ATCC | CRL-1446, RRID:CVCL_0286 |
Table 1
qRT-PCR primers.
m corresponds to mouse, h corresponds to human.
| Gene | Forward | Reverse |
|---|---|---|
| mANP | TCGTCTTGGCCTTTTGGCT | TCCAGGTGGTCTAGCAGGTTCT |
| mBNP | AAGTCCTAGCCAGTCTCCAGA | GAGCTGTCTCTGGGCCATTTC |
| mβ-MCH | ATGTGCCGGACCTTGGAAG | CCTCGGGTTAGCTGAGAGATCA |
| mCol1a1 | GAGAGAGCATGACCGATGGATT | GCTACGCTGTTCTTGCAGTGAT |
| mCol 3a1 | CAGCAGTCCAACGTAGATGAATTG | CATGGTTCTGGCTTCCAGACA |
| mα-SMA | TCCTGACGCTGAAGTATCCG | GGCCACACGAAGCTCGTTAT |
| mCTGF | AATCTCCACCCGAGTTACCA | AACTTAGCCCTGTATGTCTTCAC |
| mFam20C | AACATGGATCGGCATCACTAC | AGGAGCGAGAATGGAAAGC |
| mGAPDH | CACCATCTTCCAGGAGCGAG | CCTTCTCCATGGTGGTGAAGAC |
| hCHOP | GTCTAAGGCACTGAGCGTATC | CAGGTGTGGTGATGTATGAAGA |
| hGAPDH | ACATCGCTCAGACACCATG | TGTAGTTGAGGTCAATGAAGGG |
Additional files
-
Transparent reporting form
- https://doi.org/10.7554/eLife.41378.015
Download links
A two-part list of links to download the article, or parts of the article, in various formats.
Downloads (link to download the article as PDF)
Open citations (links to open the citations from this article in various online reference manager services)
Cite this article (links to download the citations from this article in formats compatible with various reference manager tools)
A secretory pathway kinase regulates sarcoplasmic reticulum Ca2+ homeostasis and protects against heart failure
eLife 7:e41378.
https://doi.org/10.7554/eLife.41378


