Genome-wide interrogation of extracellular vesicle biology using barcoded miRNAs
- Stanford University School of Medicine, United States
Figures
Figure 1 with 2 supplements
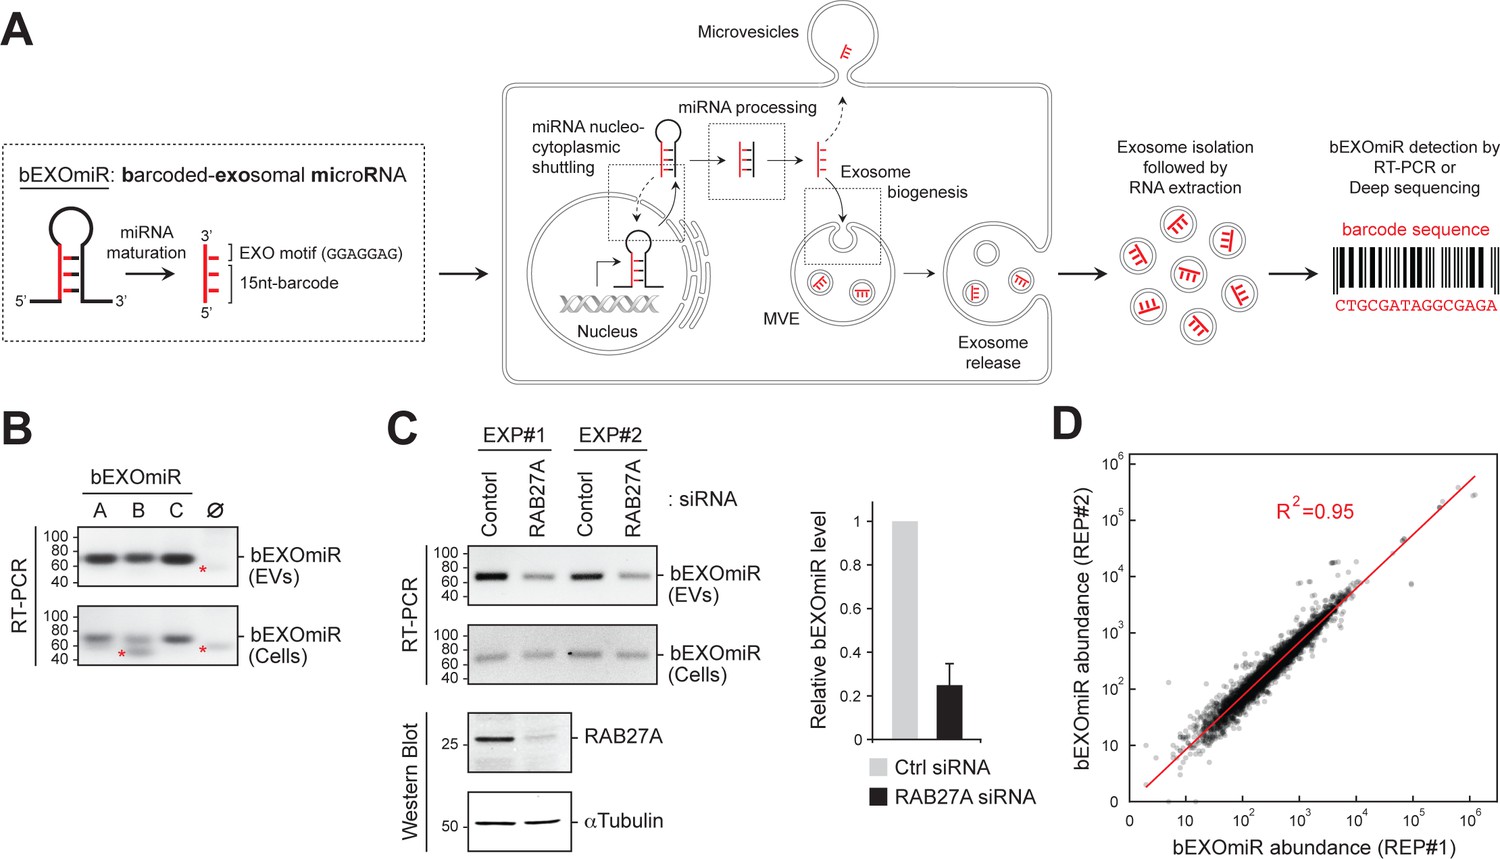
Development and assessment of bEXOmiRs as high-throughput reporters of EV release.
(A) Left, Generic structure of bEXOmiRs before and after processing. bEXOmiRs contain a random 15 nucleotide (nt) (base-paired) sequence followed by a constant exosome-targeting motif (GGAGGAG, ‘EXO motif’). Middle, intracellular trafficking of bEXOmiRs before export via EVs (exosomes and/or microvesicles). Once secreted, bEXOmiRs can be detected in purified EV fractions by RT-PCR or next generation sequencing. (B) Three example bEXOmiRs (A, B, C; Figure 1—figure supplement 1A) were cloned into a mammalian expression vector and transfected into HEK293T cells. bEXOmiR expression in both EV (upper panel) and cellular (bottom panel) fractions was assessed by Stem-Loop RT-PCR. Negative control RT-PCR devoid of RT-primer is shown in lane ∅. Red asterisks indicate non-specific PCR amplification bands. (C) HEK293T cells transfected with control or RAB27A siRNA. Fresh media was added 24 hr post-transfection; EVs were then isolated 48 hr later. Semi-quantitative RT-PCR gel images (top) show relative levels of a bEXOmiR reporter in both cellular (Cells) and EV fractions from control and RAB27A siRNA-treated cells from two experiments. Graph shows bEXOmiR level after RAB27A depletion, as quantified by qRT-PCR (n = two independent experiments, EXP#1 and EXP#2). Immunoblots at bottom show depletion of RAB27A; α-Tubulin was a loading control. Marker mobility is shown at left in basepairs (B and C) top panels) or kilodaltons (C bottom panels). (D) Reproducibility of 5000 bEXOmiR abundances measured by deep sequencing in isolated EVs from two replicate cultures (REP1 and REP2) of K562 cells previously infected with the 5,000-bEXOmiR test library (see text).
Figure 1—figure supplement 1
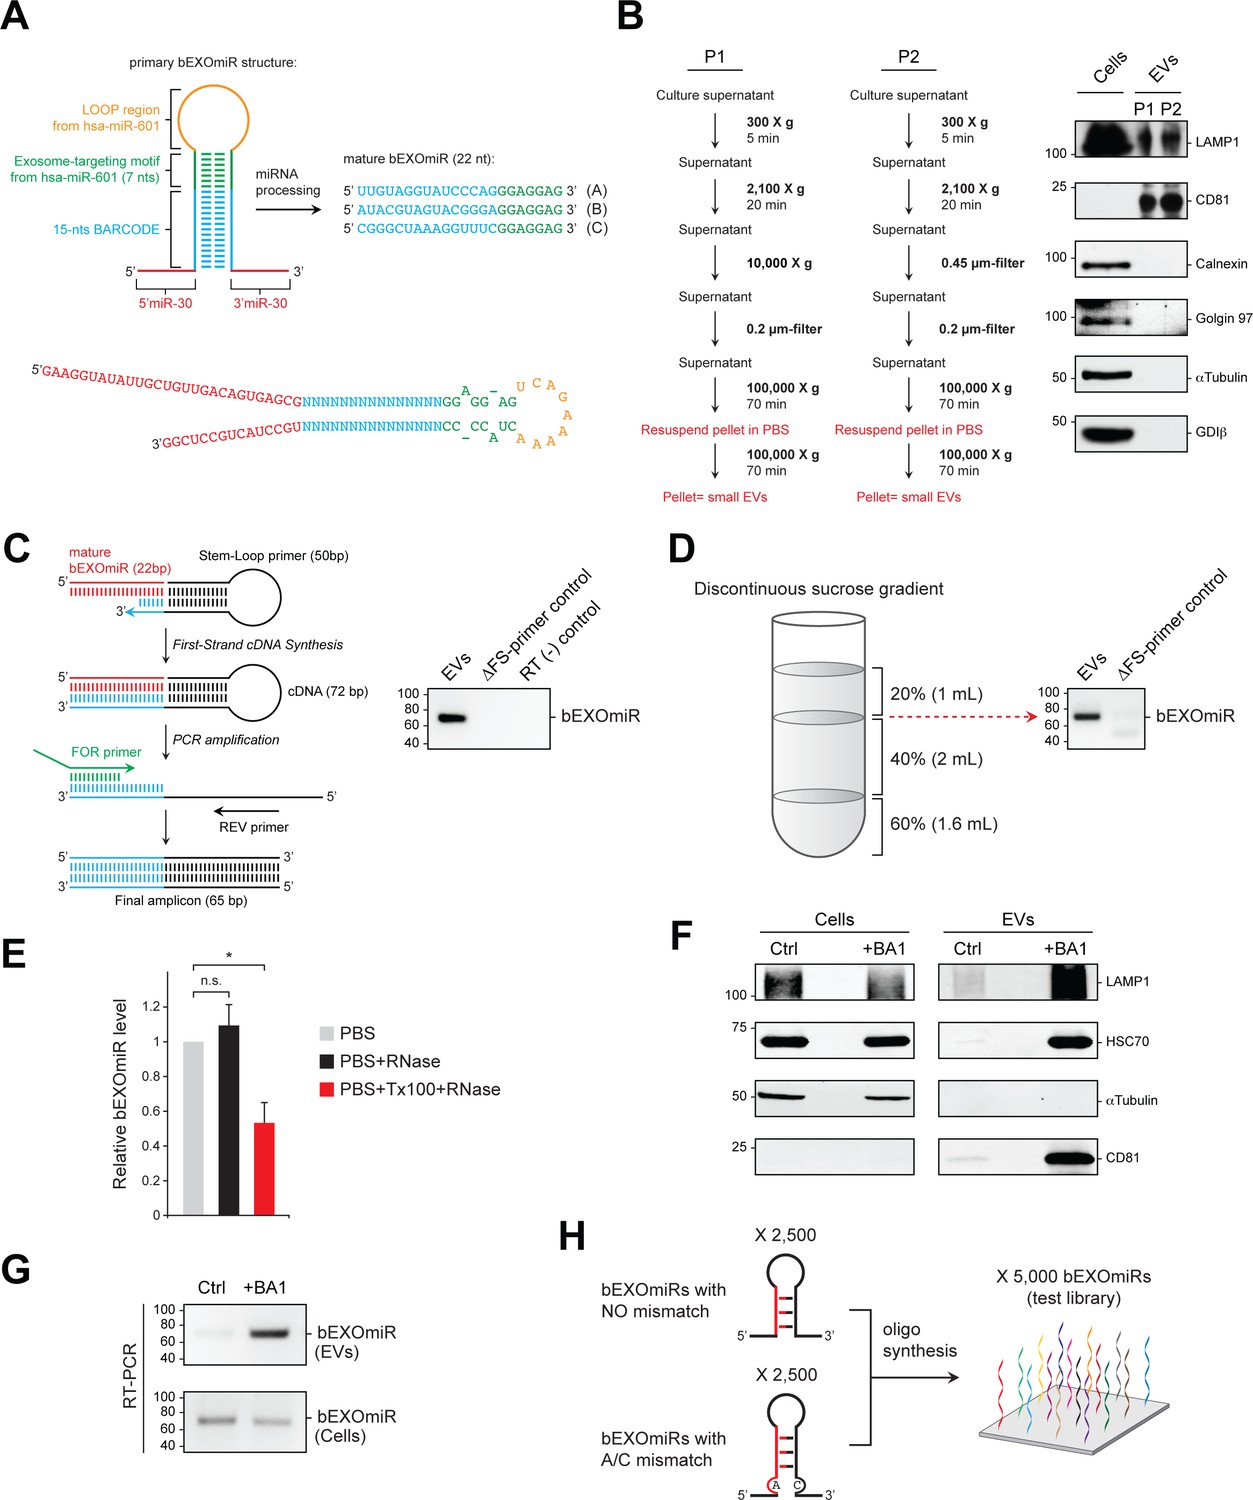
Characterization of bEXOmiRs in EVs.
(A) Detailed design of bEXOmiR reporters. The double stranded stem-region contains a 15 nt-random sequence (barcode; highlighted in blue) with perfect base complementarity. Three examples of barcode sequences, A, B and C are shown at right. The barcode sequence is then followed by a constant 7nt exosome-targeting motif (EXO motif, green) that contains two asymmetric bulges (one in each strand; a, bottom). The EXO motif is then followed by a loop sequence (orange); both were derived from endogenous hsa-miR-601. Finally, mini-miR-30 context sequences (Chang et al., 2013) were placed at the base of the stem region (red). N indicates any ribonucleotide base. (B) Left, two protocols (P1 and P2) for EV isolation used in this study. Biochemical characterization of whole cell lysate (Cells) and EV fractions derived from P1 and P2 is shown in immunoblot panels at right using antibodies for LAMP1, CD81, Calnexin, Golgin 97, α-Tubulin and GDI-β. Molecular mass marker mobility is shown at left in kilodaltons. (C), Schematic for Stem-loop RT-PCR protocol used to detect bEXOmiRs in extracted RNA samples. Panel at right, lane 1 (EVs) shows expression of bEXOmiR-C (panel A) detected by RT-PCR using RNA extracted from EVs released during 48 hr from HEK293T cells transfected with a bEXOmiR-expression vector. Reactions lacking either Stem-Loop primer (ΔFS-primer control, Lane 2) or reverse transcriptase (RT (-), Lane 3) are shown. Molecular marker mobility is shown at left in base pairs. (D) bEXOmiR-expressing HEK293T cells were grown for 48 hr prior to EV isolation and flotation using a discontinuous sucrose gradient; the presence of the bEXOmiR reporter was determined by RT-PCR at the indicated gradient interface (dotted red arrow), as shown in lane 1 (floated EVs) of the agarose gel at right. No bEXOmiR signal was observed in reactions lacking Stem-loop primer (lane 2). (E) RNase protection assay. Isolated EVs from bEXOmiR-expressing K562 cells were incubated with PBS (gray bar), PBS + RNase (black bar) or PBS + TX100 + RNase (red bar). t test: *p<0.05; error bars represent SEM; n = 3. (F) and (G), bEXOmiR-expressing K562 cells were treated with 10 nM Bafilomycin A1 (BA1) for 20 hr before EV isolation. Immunoblot analysis of control (DMSO) and BA1-treated (BA1) cells and EVs is shown in (F). RT-PCR detection of bEXOmiR reporter in cells and EV fractions from control and BA1-treated cells is shown in (G). (H) Schematic representation of the design and composition of the initial bEXOmiR test library.
Figure 1—figure supplement 2

Characterization of CD63-positive structures in cells with or without bEXOmiR expression.
Top, K562 cells visualized after centrifugation onto coverslips, immunostained for CD63; bottom, quantitation of total CD63-vesicle area. Each dot represents a single, CD63-positive structure in 18 or 20 parental or bEXOmiR expressing cells, respectively (n ~ 600 structures counted for each condition; mean ~32 structures per cell for the parental and ~34 for the bEXOmiR expressing cells. Red line indicates the median area for each population.
Figure 2
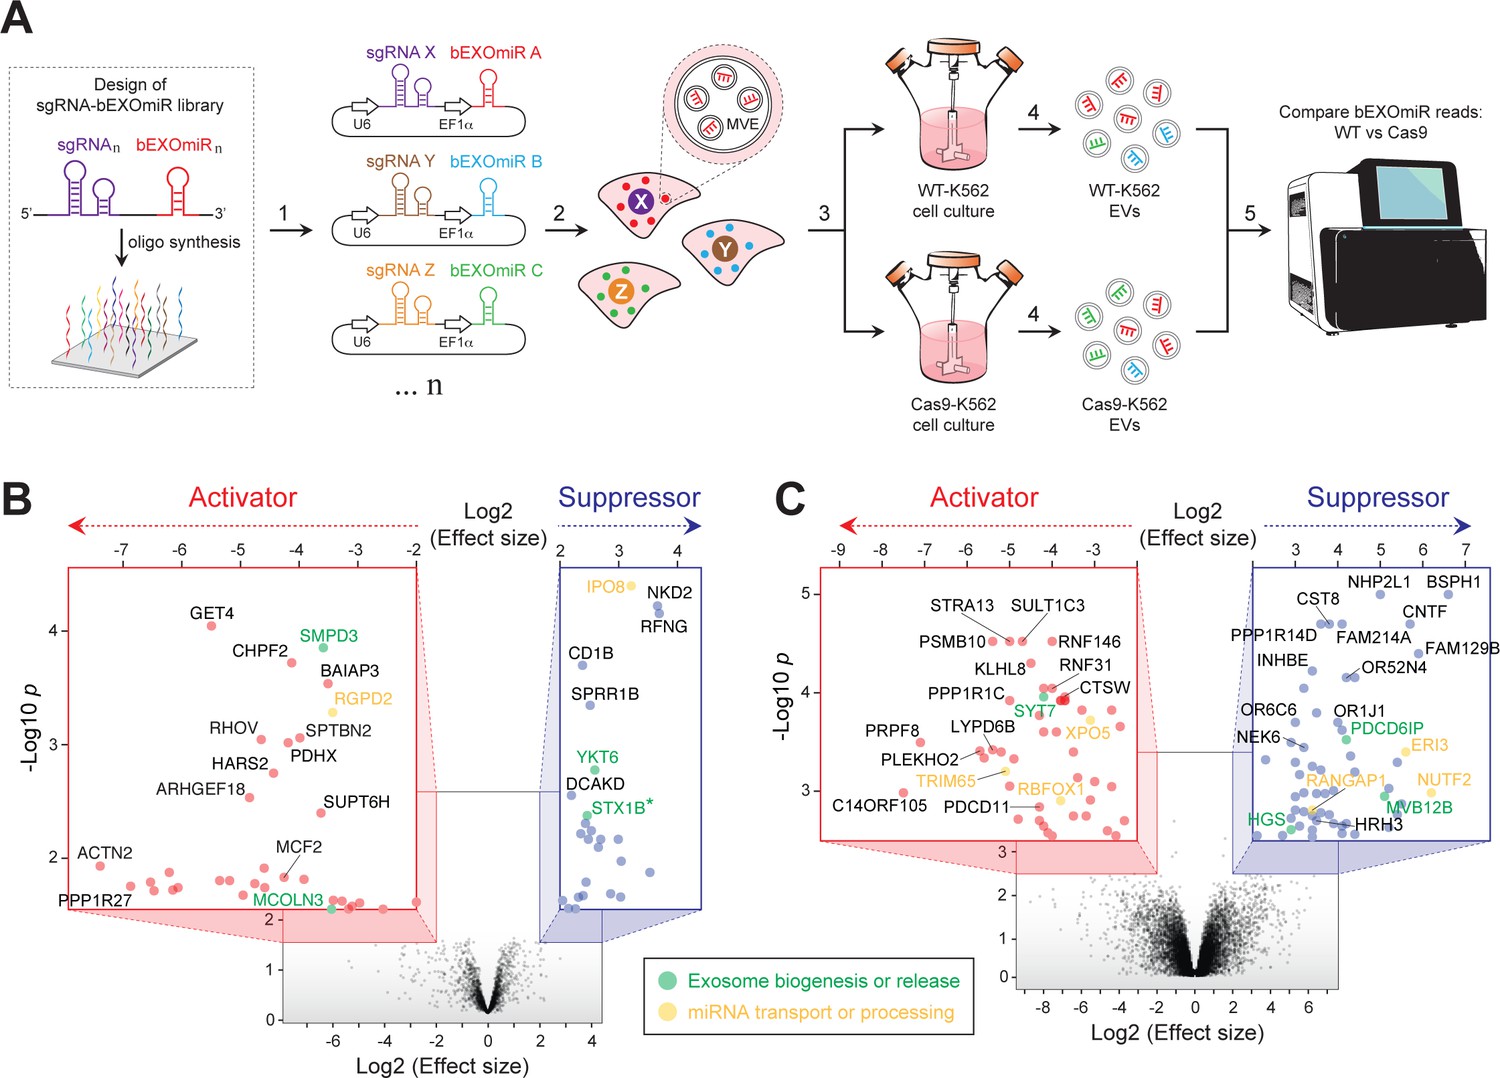
Genome-wide CRISPR/Cas9 screen using bEXOmiRs enables systematic interrogation of EV biology.
(A) Diagram depicting key steps of the screen performed in this study. Oligonucleotides encoding sgRNA-bEXOmiR pairs were designed computationally and then synthesized using solid-phase technology. Next, oligonucleotides were pool-cloned (1) into a Lentivirus vector that drives expression of both sgRNA and bEXOmiR under U6 and EF1α promoters, respectively. WT and Cas9-positive K562 cells were then infected at low MOI (2), such that after infection and selection, each cell expresses only a single sgRNA-bEXOmiR pair (3). This approach enables identification and quantification of both EVs and their respective cell of origin via unique molecular identifiers: barcodes and sgRNAs respectively. sgRNA-bEXOmiR-expressing cells were then grown for 48 hr before collection of culture supernatants from which EVs were purified (4). Finally, barcode abundance was measured, comparing WT and Cas9-expressing cells, by deep sequencing from EV-extracted RNA (Villarroya-Beltri et al., 2013). (B), Initial pilot screen using a 25,000 bEXOmiR-sgRNA library targeting membrane trafficking, mitochondrial and motility (MMM) genes. Colored insets display zoomed activator (red nodes in red inset) and suppressor (blue nodes in blue inset) hits that passed effect size cutoffs (≤ −2 or ≥+2) and had a -Log p-value>1.5. (C), genome-wide (minus MMM sublibrary) screen. Colored insets display zoomed activator and suppressor hits that passed effect size cutoffs (≤ −2 or ≥+2) and had a -Log p-value>2.5. Green labels in (B) and (C) indicate previously known EV regulators; yellow labels represent genes that regulate miRNA trafficking or processing.
Figure 3

Analysis of bEXOmiR EV-targeting.
Reproducibility of ~32,000 bEXOmiR abundances measured in EVs isolated from replicated WT- (A) or Cas9-positive (B) cell cultures (REP#1 and #2). (C) Correlation of ~32,000 bEXOmiR abundances in EVs versus intact cells (Cells) from the same WT replicated cultures (left, REP#1; right, REP#2) shown in (A). (D) Correlation of growth versus EV phenotypes observed in the genome-wide screen. (E) Correlation of growth versus EV phenotypic scores calculated using the casTLE algorithm (see Materials and methods) in the genome-wide analysis. Red and blue dots represent identified activator or suppressor hits from the EV generation screen, respectively.
Figure 4 with 1 supplement
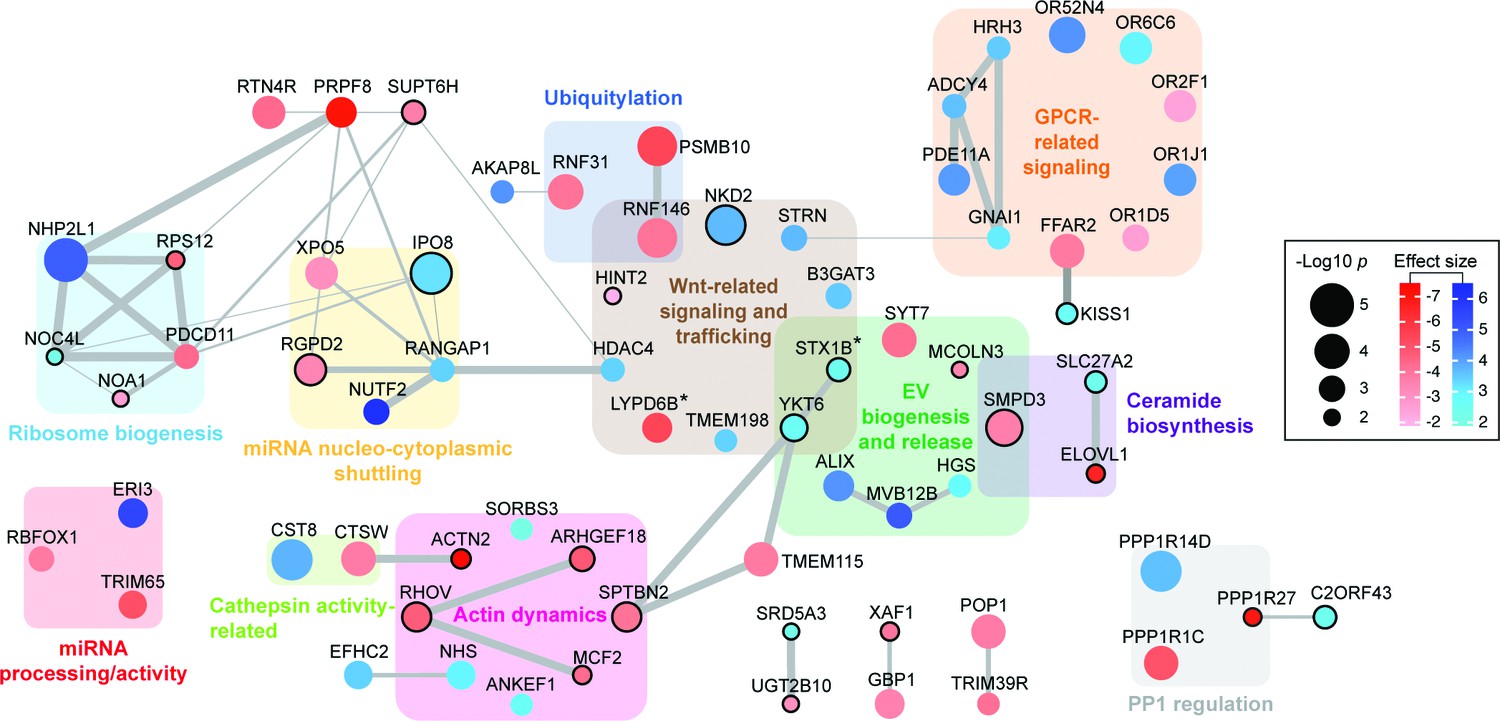
Functional network analysis of top hits.
Only genes (nodes) that showed interactions in STRING analyses or that fell into a related functional category (gene clusters) are displayed. Interactions reported by STRING are represented by gray edges whose width is proportional to a combined significance score (see Materials and methods). Activators are shown in red, suppressors in blue. Node color intensity is proportional to the effect size found in the screen. Node size is proportional to significance score (-Log p-value) calculated in the screen analysis. In all panels, asterisks indicate that an isoform or close family member has been shown to play a role in the same category.
Figure 4—figure supplement 1
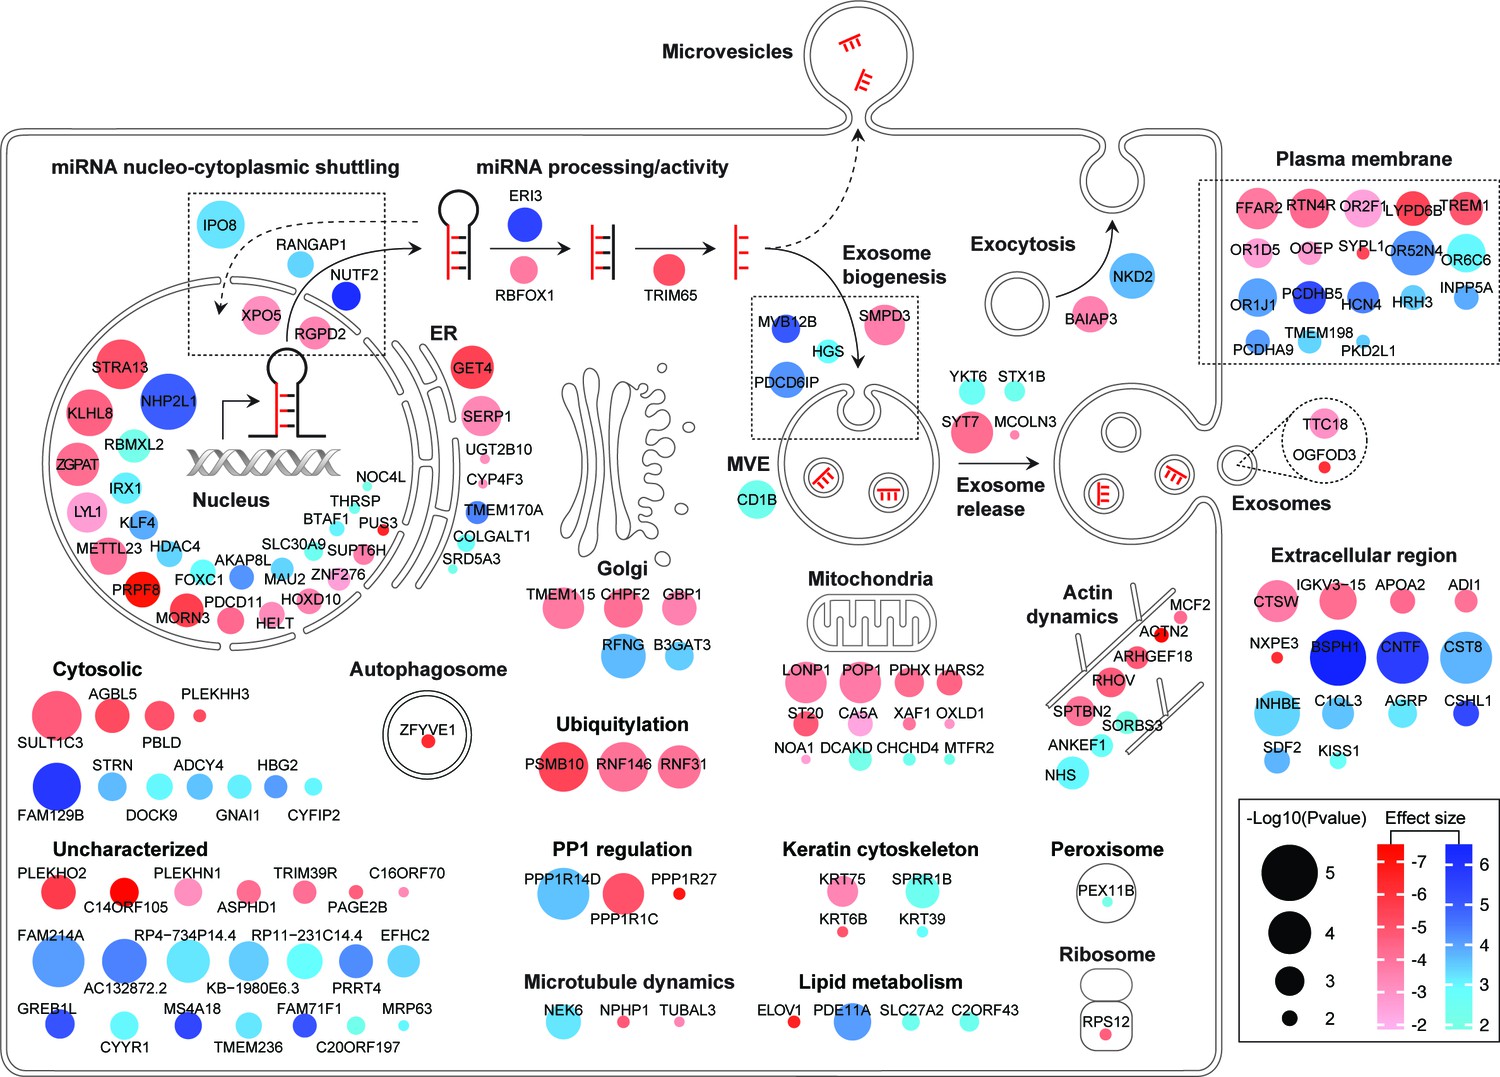
Diagram summary of roles and localizations of top screen hits.
Activators and suppressors are shown in red and blue sphere nodes, respectively. Node color intensity is proportional to effect size observed; node area is proportional to significance score (-Log p-value) calculated in the screen analysis.
Figure 5 with 3 supplements
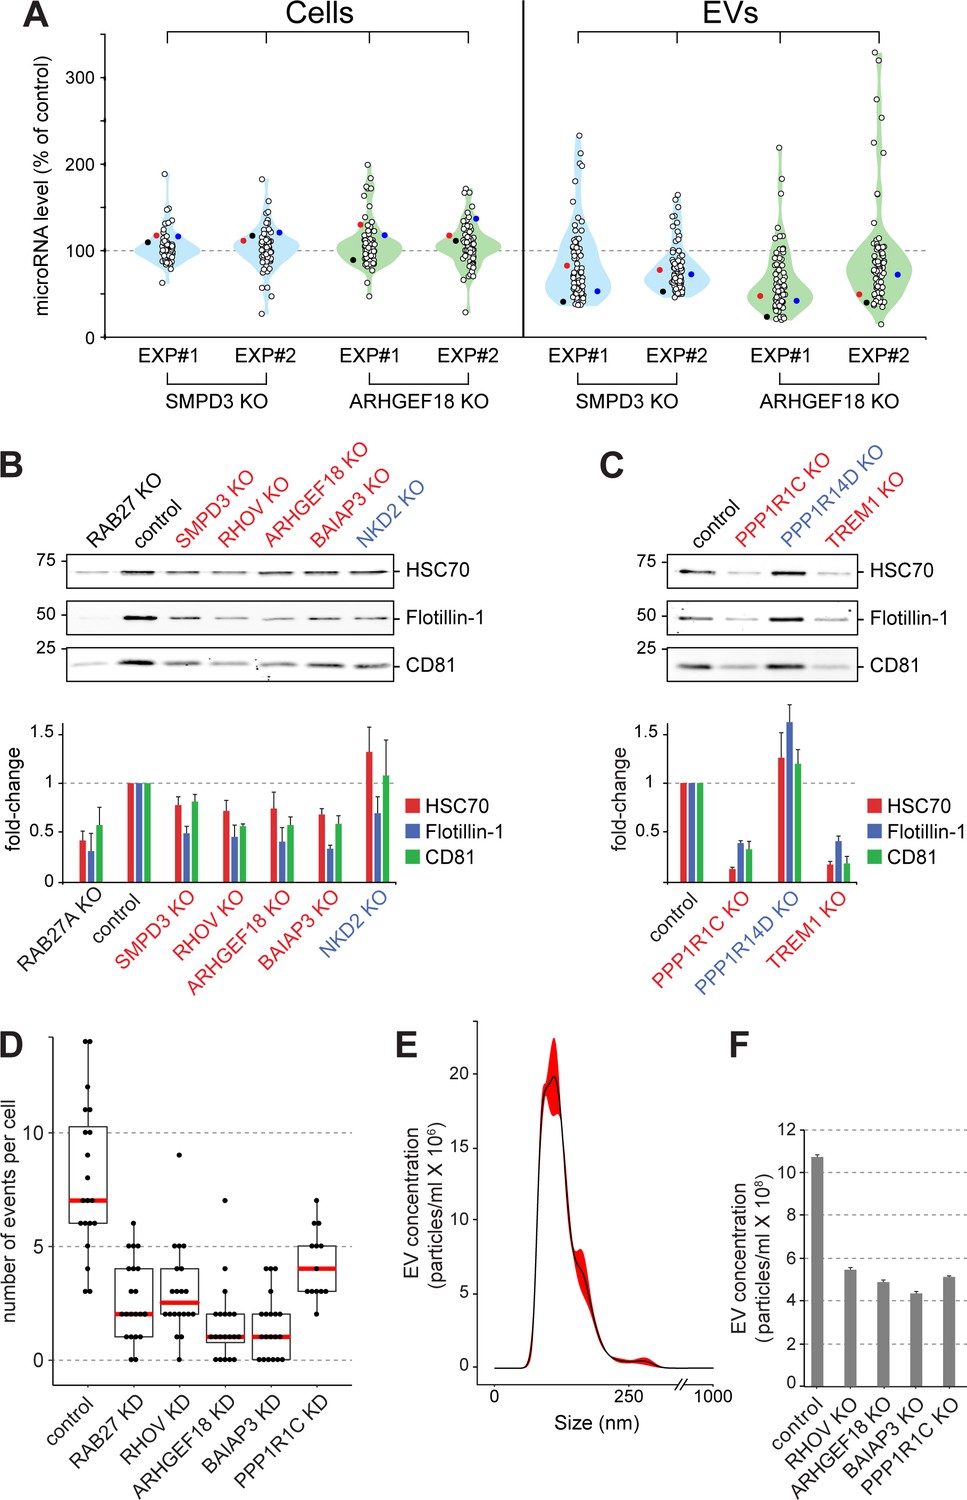
Validation of selected hits with orthogonal assays.
(A), Quantitative Nanostring miRNA profiling of both cellular (Cells) and EV fractions was performed to compare endogenous miRNA signatures in SMPD3 CRISPR knockout (KO) or ARHGEF18 KO K562 cell lines versus control cells; blue and green violin plots, respectively. miRNA abundance is plotted as percent of miRNA abundance in control cells. Violin plots show overall distribution of common EV-associated miRNAs (circles) detected in two independent experiments. Three specific endogenous miRNAs, hsa-miR-19a-3p (black), hsa-miR-151a-3p (red) and hsa-miR-548b-3p (blue) are indicated. (B) and (C), Biochemical analysis of EV fractions in CRISPR knockout cell lines from selected hits derived from the initial MMM-focused (B) or from the rest of the genome-wide (C) screen. EV extracts were immunoblotted with anti-HSC70, anti-Flotillin or anti-CD81 antibodies; numbers at left indicate mobility of molecular weight markers in kD. Bars indicate standard deviation from two independent sets of two replicate experiments. (D) Fusion of pHluorin-CD63-positive structures at the surface of HeLa cells observed using TIRF microscopy of fluorescent siRNA-transfected cells. Each dot represents number of events per cell over 90 s. (E) and (F), Characterization of purified EVs by Nanoparticle Tracking Analysis (NTA). (E) Representative plot of EV size distribution. Black line and red-shaded areas indicate mean value and SEM of particle concentration at each diameter, respectively, determined after three measurements. (F) Yield comparison of EVs derived from control and CRISPR knockout (KO) cells.
Figure 5—figure supplement 1
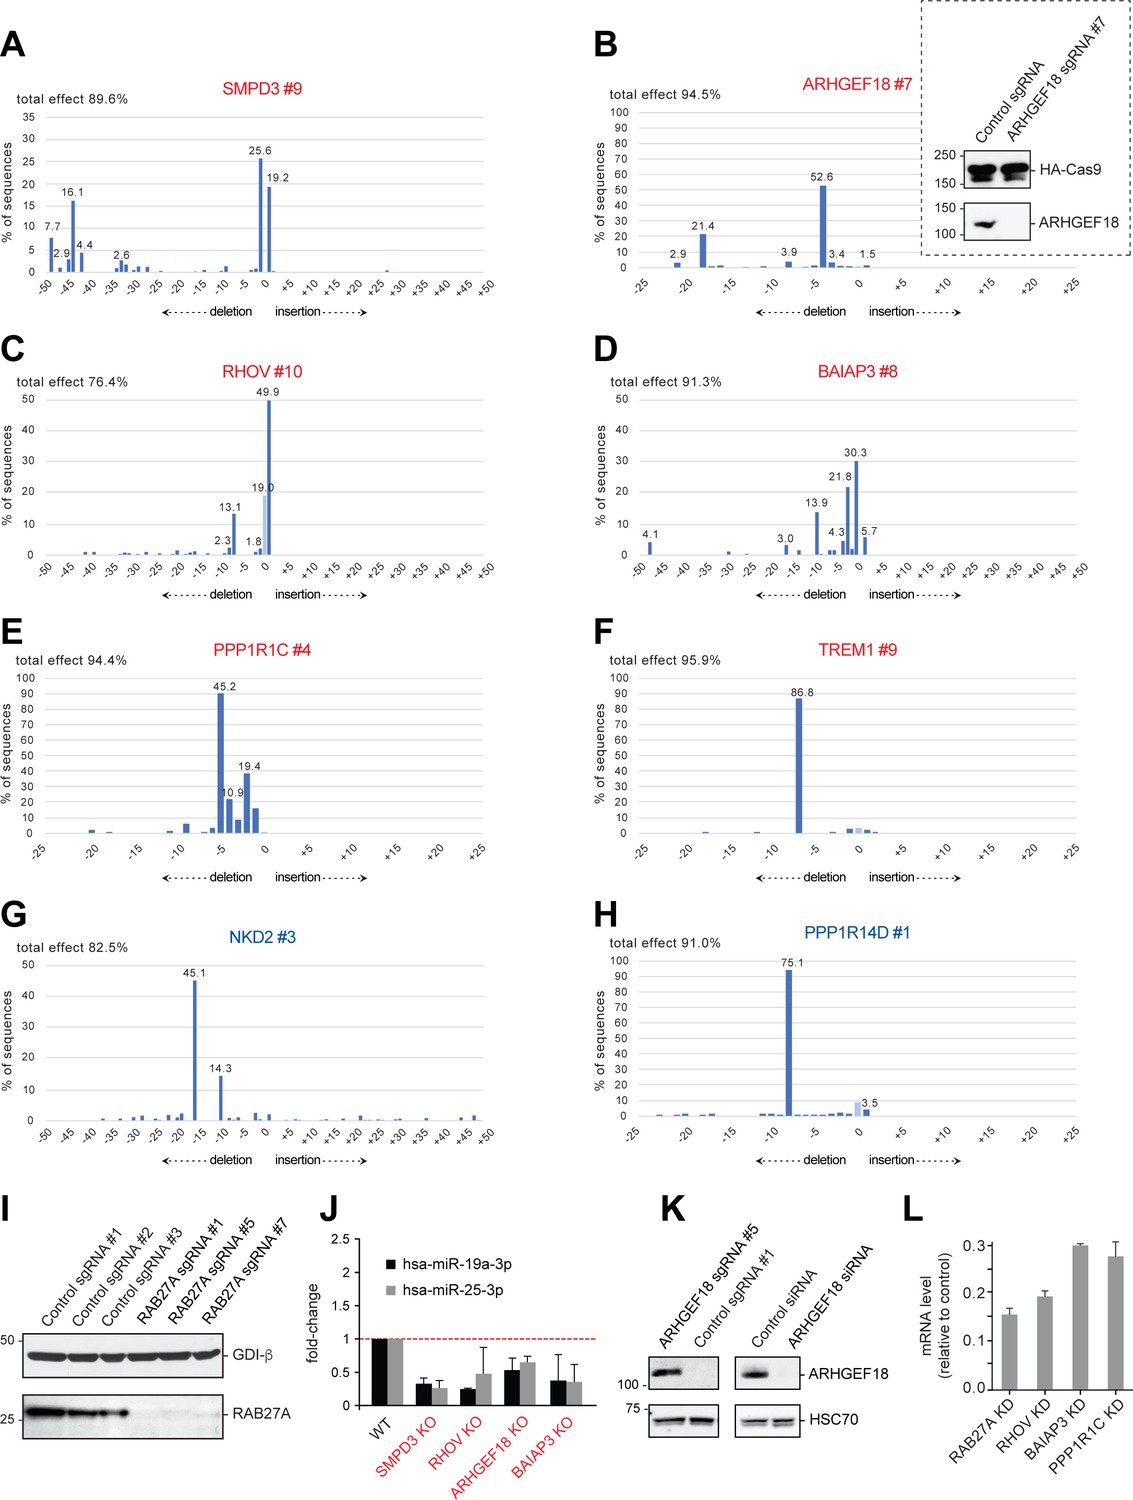
(A–H) Confirmation of CRISPR-deletions in selected hit cell lines by TIDE analysis as indicated.
Activators and suppressors are labeled in red and blue letters, respectively. Inset in (B), ARHGEF18 depletion monitored in Cas9-expressing K562 cells by immunoblot; anti-HA was used to detect HA-tagged Cas9 expressed in this cell line, and also as a loading control. (I), Immunoblot validation of RAB27 sgRNAs; sgRNA #1 was used for hit validation. Numbers next to gene names refer to sgRNA reference number (10 sgRNAs per gene) used in the screen (see Materials and methods). (J), qPCR analysis of two endogenous miRNAs from the Nanostring analysis, to quantify the impact of loss of the indicated hits. (K), ARHGEF18 depletion using a different sgRNA than that used in B, or an siRNA for the NTA and live cell analysis; (L), mRNA levels of siRNA depleted cells used for live cell imaging in Figure 5.
Figure 5—figure supplement 2

Batch retest mini screen using different sgRNA-bEXOmiR associations.
Top 100 hits from initial MMM screen (Figure 2B) were targeted with the same, previously-used sgRNAs but paired with different bEXOmiRs, as shown in (A). (B), Volcano plot showing results of the top 100 MMM hit-focused screen (two replicates). Selected activators and suppressors are labeled in red and blue, respectively.
Figure 5—figure supplement 3
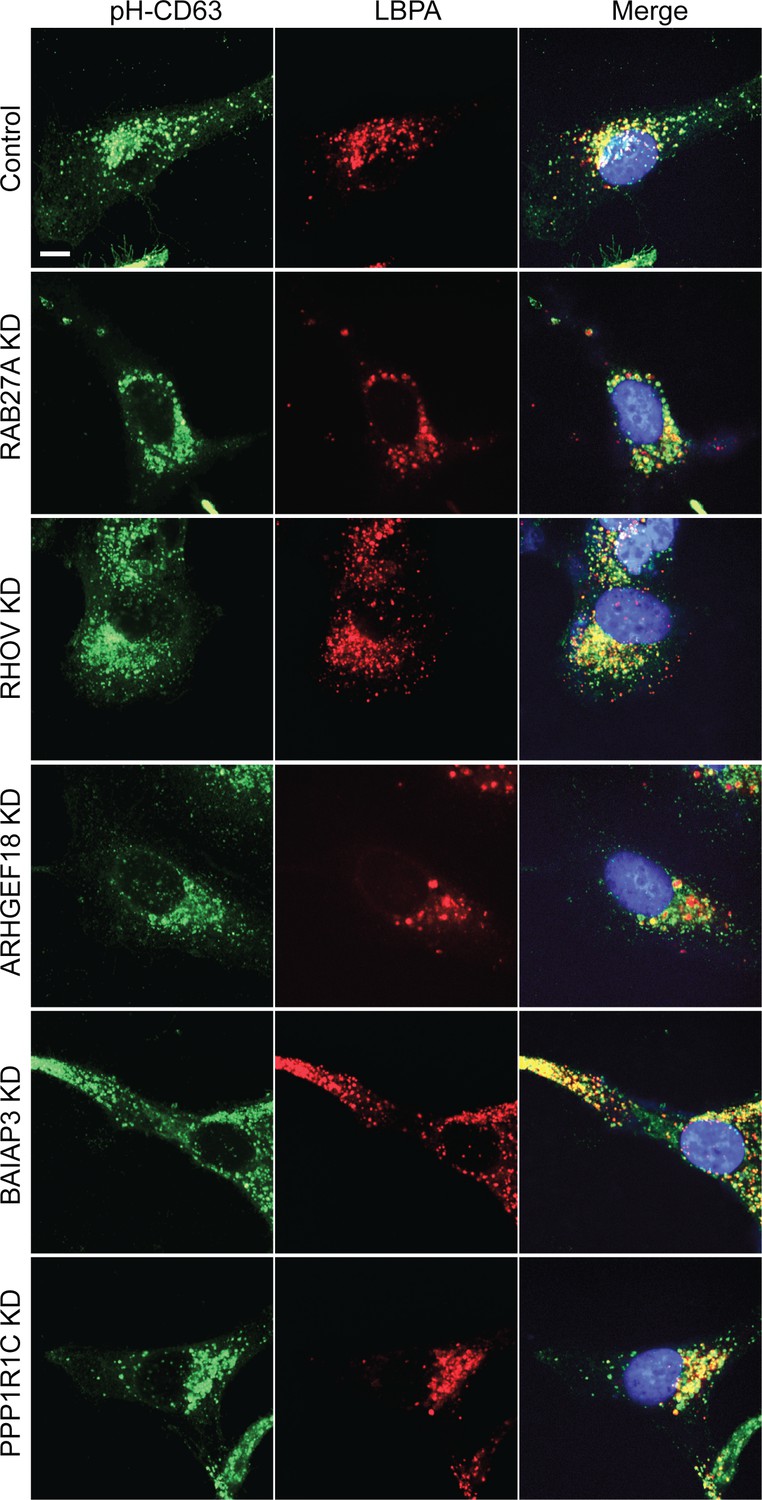
Morphology of CD63-positive compartments in HeLa cells treated with siRNAs targeting indicated genes.
Confocal images show HeLa cells stably expressing pH-CD63 (green), stained with anti-LBPA antibody (red), and nuclei labeled with DAPI (blue). Scale bar, 10 μm.
Figure 6 with 1 supplement
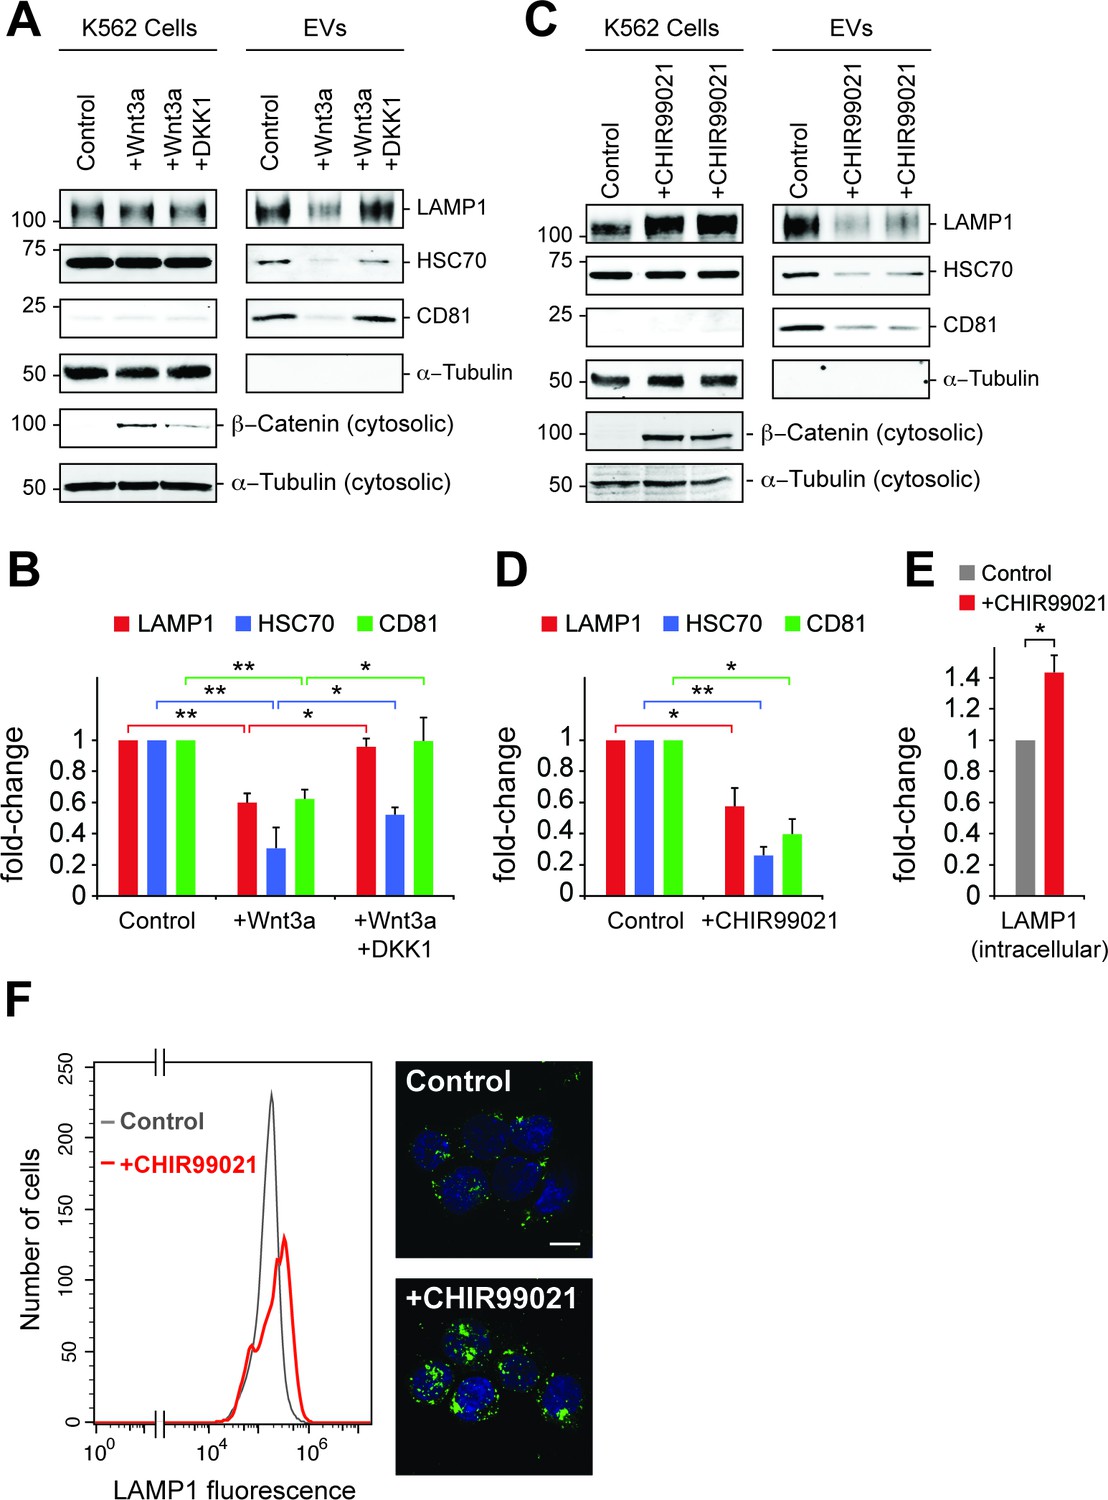
Wnt signaling regulates EV release.
(A) Serum-starved K562 cells were treated with PBS (control) or Wnt3a (100 ng/ml) or Wnt3a + Dickkopf peptide (DKK1, 200 ng/ml) for 24 hr prior to EV isolation. Biochemical analysis of cellular (Cells) and EV fractions was performed by immunoblotting of extracts using antibodies against antigens shown. Detection of ß-Catenin was carried out using cytosolic fractions. (B) Quantitation of EV marker protein levels from EV immunoblots shown in (A). (C), Serum-starved K562 cells were treated with DMSO (control) or CHIR99021 (10 µM) for 24 hr prior to EV isolation. Biochemical analysis of EV fractions was performed as in (A). Representative immunoblots for a control experiment along with two replicate CHIR99021-treated samples are shown. (D) Quantitation of protein levels from EV immunoblots in (C). (E) Quantitation of LAMP1 protein from cellular fractions in (C). Molecular mass marker mobility is shown at the left of immunoblot panels in kilodaltons. t test: *p<0.05; **p<0.01; error bars represent SEM; n ≥ 3. (F) Flow cytometry determination of LAMP1 levels in anti-LAMP antibody-labeled control and CHIR99021-treated cells. Confocal images at right show lysosomes stained with anti-LAMP1 antibody (green) and nuclei labeled with DAPI (blue). Bar,10 µm.
Figure 6—figure supplement 1
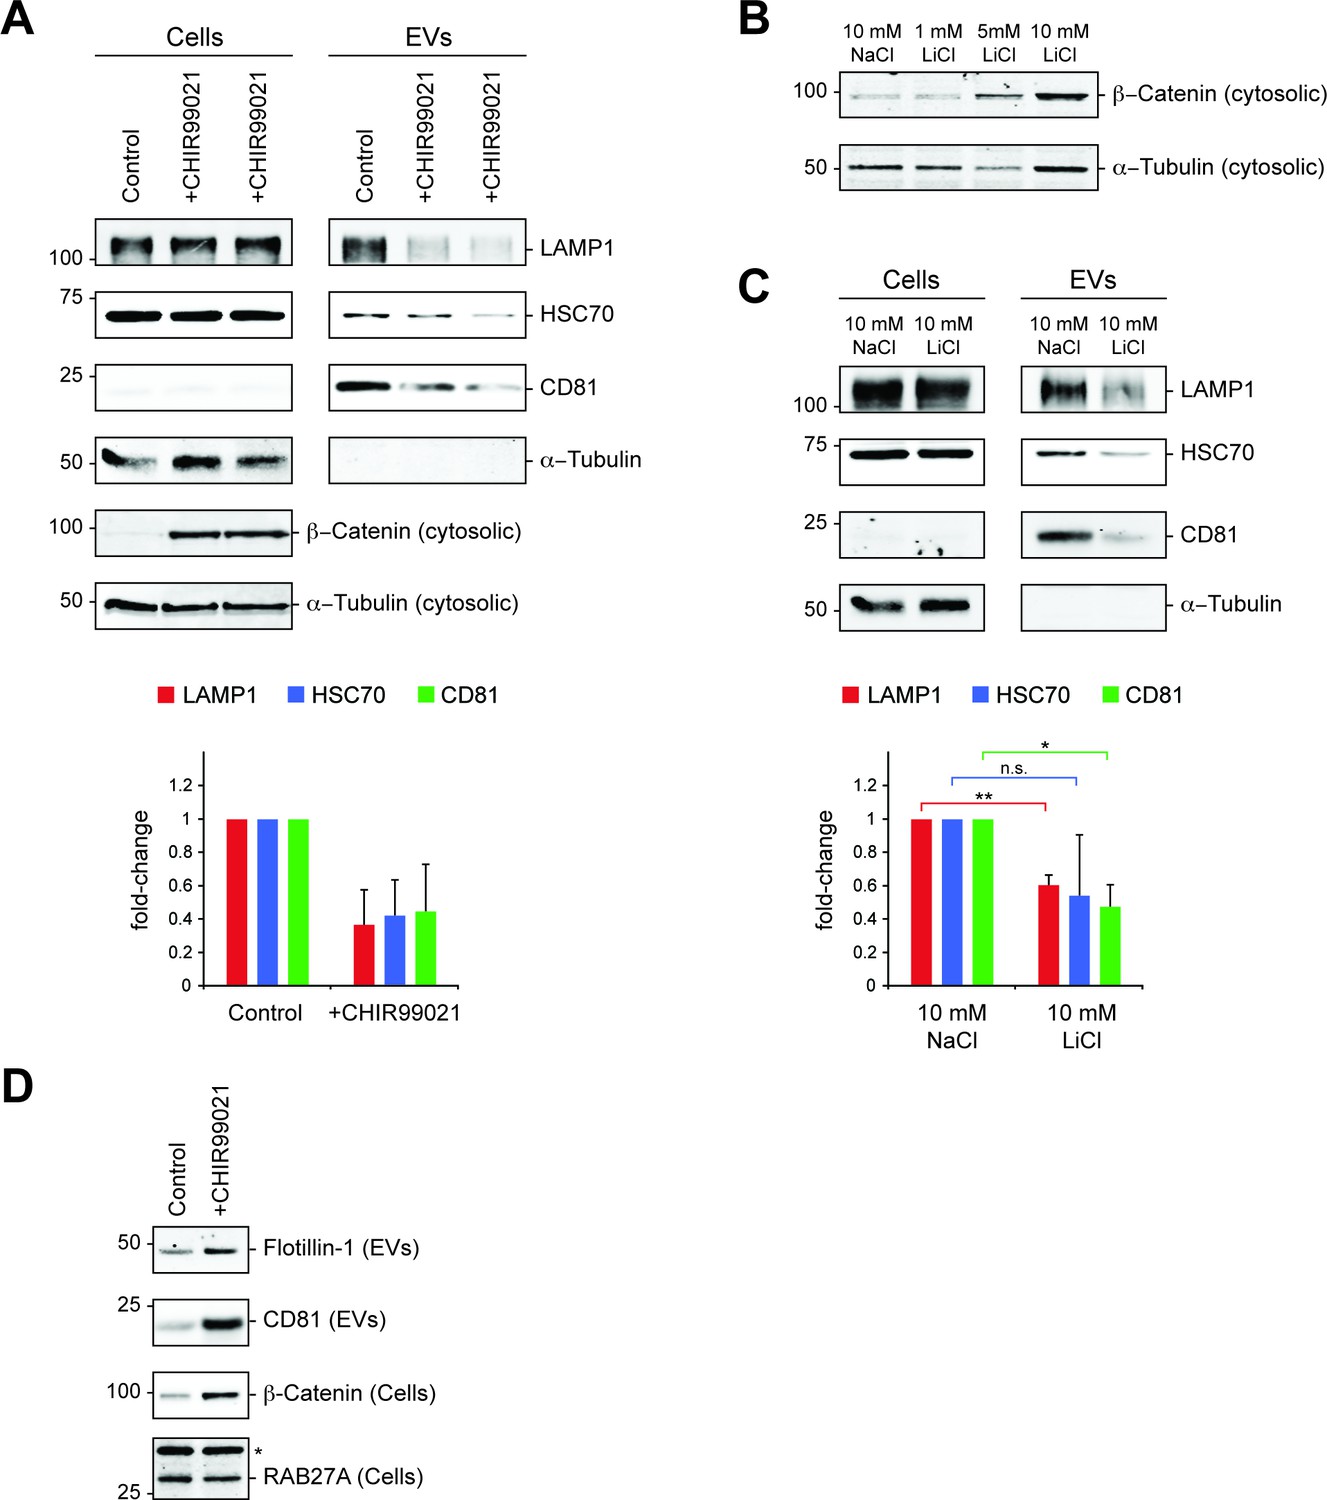
Pharmacological inhibition of GSK3 downregulates exosome release.
(A) Serum-starved HEK293T cells were treated with DMSO (control) or CHIR99021 (10 µM) for 24 hr before EV isolation. Representative immunoblots for a control experiment along with two replicate CHIR99021-treated samples are shown. Plot below shows quantitation of the EV fraction immunoblots above. Molecular mass marker mobility is shown at left in kilodaltons. Error bars represent standard deviation; n = 2 independent experiments. (B) Determination of β-Catenin stabilization upon LiCl treatment. K562 cells were treated with 10 mM NaCl (control) or increasing LiCl concentrations as indicated for 24 hr. Immunoblot analysis of cytosolic fractions was then performed with anti-β-Catenin and anti-α-Tubulin antibodies. (C) Cellular and EV fractions from K562 cells treated with either 10 mM NaCl or LiCl for 20 hr were analyzed by immunoblotting as indicated. Plot below shows quantitation of EV fraction immunoblots in (C). Molecular mass marker mobility is shown at left in kilodaltons. t test: *p<0.05; **p<0.01; error bars represent SEM; n = 3. (D) Serum starved RPE cells analyzed by immunoblot of the indicated proteins in EV or cellular fractions after 20 hr CHIR99021 treatment. The asterisk indicates a nonspecific band that was used as loading control.
Figure 7
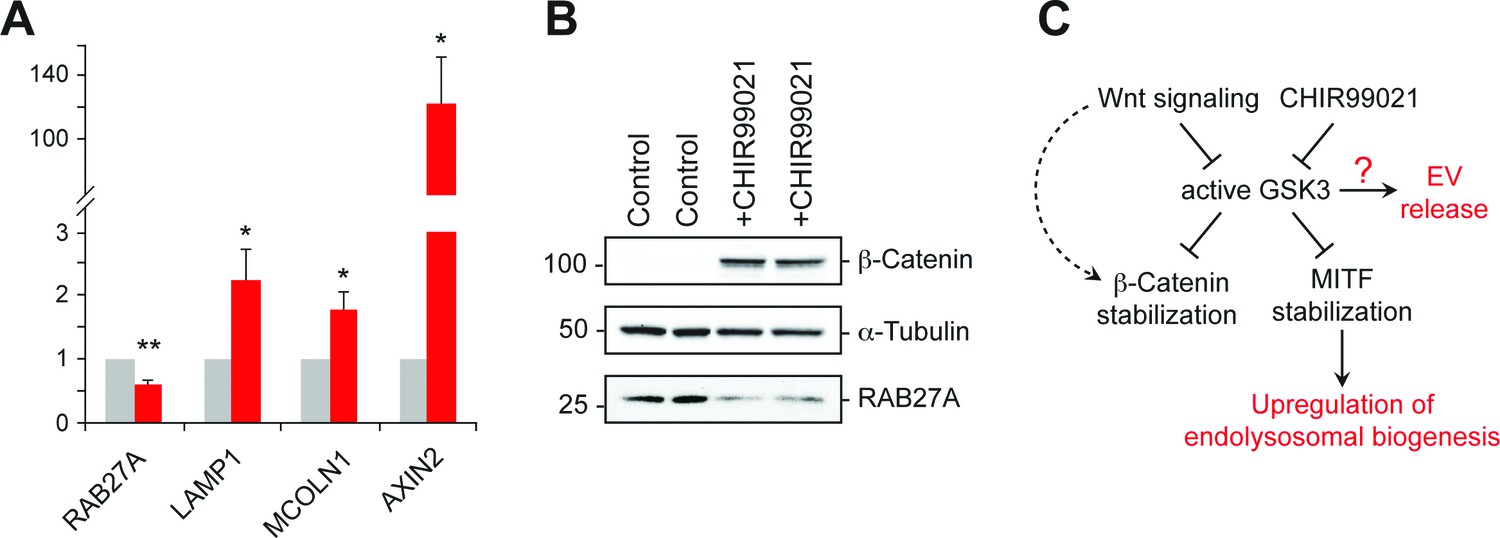
GSK3 inhibition decreases Rab27 mRNA levels.
(A) qPCR analysis of indicated mRNA levels in K562 cells treated for 20 hr with CHIR99021. Shown is the combined data from four independent experiments; error bars represent SEM (t test: *p<0.05; **p<0.01). (B) Immunoblot of RAB27 levels in duplicate samples treated with CHIR99021 as in A. (C) Schematic representation of the pathway by which Wnt regulates exosome release. The link between RAB27 and GSK3 is not yet known.
Videos
Video 1
Time-lapse of a control HeLa cell stably expressing pHluorin-CD63 at 3.3X real time speed shown as a heat map.
Images were acquired at three frames per sec.
Video 2
Time-lapse of an ARHGEF18 KD HeLa cell stably expressing pHluorin-CD63 at 3.3X real time speed as in Video 1.
https://doi.org/10.7554/eLife.41460.014Tables
Key resources table
| Reagent type (species) or resource | Designation | Source or reference | Identifiers | Additional information |
|---|---|---|---|---|
| Cell line (Homo sapiens) | K562 | ATCC | RRID: CVCL_0004 | |
| Cell line (Homo sapiens) | K562 Cas9+ | PMID: 27018887 | ||
| Cell line (Homo sapiens) | K562 ARHGEF18 KO #5 | this paper | Progenitor: K562 Cas9+ | |
| Cell line (Homo sapiens) | K562 ARHGEF18 KO #7 | this paper | Progenitor: K562 Cas9+ | |
| Cell line (Homo sapiens) | K562 BAIAP3 KO #8 | this paper | Progenitor: K562 Cas9+ | |
| Cell line (Homo sapiens) | K562 NKD2 KO #3 | this paper | Progenitor: K562 Cas9+ | |
| Cell line (Homo sapiens) | K562 PPP1R1C KO #4 | this paper | Progenitor: K562 Cas9+ | |
| Cell line (Homo sapiens) | K562 PPP1R14D KO #1 | this paper | Progenitor: K562 Cas9+ | |
| Cell line (Homo sapiens) | K562 RAB27A KO #1 | this paper | Progenitor: K562 Cas9+ | |
| Cell line (Homo sapiens) | K562 RHOV KO #10 | this paper | Progenitor: K562 Cas9+ | |
| Cell line (Homo sapiens) | K562 SMPD3 KO #9 | this paper | Progenitor: K562 Cas9+ | |
| Cell line (Homo sapiens) | K562 TREM1 KO #9 | this paper | Progenitor: K562 Cas9+ | |
| Cell line (Homo sapiens) | HEK293T | https://mrcppureagents.dundee.ac.uk/ | RRID: CVCL_0045 | |
| Cell line (Homo sapiens) | HeLa | ATCC | RRID: CVCL_0030 | |
| Antibody | mouse monoclonal anti-a-Tubulin | Sigma-Aldrich | T5168 | (1:10000) |
| Antibody | rabbit polyclonal anti-ARHGEF18 | GeneTex | GTX102223; RRID: AB_10728594 | (1:1000) |
| Antibody | rabbit polyclonal anti-Rab27A | Synaptic Systems | 168 013 | (1:1000) |
| Antibody | mouse monoclonal anti-CD81 | BD Biosciences | 555675 | (1:1000) |
| Antibody | mouse monoclonal anti-ß-Catenin | BD Biosciences | 562505; RRID: AB_11154224 | (1:1000) |
| Antibody | mouse monoclonal anti-Golgin 97 | Thermo Scientific | A-21270 | (1:1000) |
| Antibody | rabbit polyclonal anti-Flotillin-1 | Novus Biologicals | NBP1-79022; RRID: AB_11011337 | (1:1000) |
| Antibody | mouse polyclonal anti-Calnexin | Santa Cruz | sc-23954 | (1:1000) |
| Antibody | mouse monoclonal anti-HSC70 | Santa Cruz | sc-7298 | (1:1000) |
| Antibody | mouse monoclonal anti-LAMP1 | DSHB | G1/139/5; RRID: AB_10659721 | (1:2) |
| Antibody | mouse monoclonal anti-CD63 | DSHB | H5C6; RRID: AB_528158 | (1:1000) |
| Antibody | rabbit polyclonal anti-GDIß | PMID: 8195183 | home-made | (1:1000) |
| Antibody | mouse monoclonal anti-LBPA | EMD Millipore | MABT837 | (1:1000) |
| Genetic reagent (Homo sapiens) | ARHGEF18 (siRNA) | Dharmacon | ||
| Genetic reagent(Homo sapiens) | BAIAP3 (siRNA) | Dharmacon | ||
| Genetic reagent(Homo sapiens) | RHOV (siRNA) | Dharmacon | ||
| Genetic reagent(Homo sapiens) | PPP1R1C (siRNA) | Dharmacon | ||
| Genetic reagent (Homo sapiens) | RAB27A (siRNA) | Dharmacon | ||
| Recombinant DNA reagent | pMCB306 | PMID: 28319085 | ||
| Recombinant DNA reagent | pMCB306-pHluorin-CD63 | this paper | Progenitor: pMCB306 | |
| Chemical compound, drug | Recombinant Mouse Wnt-3a Protein | R and D Sysytems | 1324-WN-002 | |
| Chemical compound, drug | CHIR-99021 | Selleckchem | S1263 | |
| Chemical compound, drug | DharmaFECT 1 | Dharmacon | ||
| Chemical compound, drug | Bafilomycin-A1 | Sigma-Aldrich | ||
| Software, algorithm | Fiji | RRID: SCR_002285 | ||
| Software, algorithm | CellProfiler | PMID: 17076895 | RRID: SCR_007358 | |
| Other | DAPI | Invitrogen | RRID: AB_2307445 | 1:10000 |
Additional files
-
Supplementary file 1
Screen results from EV and cellular fractions.
- https://doi.org/10.7554/eLife.41460.018
-
Supplementary file 2
Data from all sublibrary screens with bEXOmiR recovery rates.
- https://doi.org/10.7554/eLife.41460.019
-
Supplementary file 3
Sequences of oligonucleotides used in this study.
- https://doi.org/10.7554/eLife.41460.020
-
Supplementary file 4
Sequences of sgRNA-bEXOmiR associations used in the genome-wide screen.
- https://doi.org/10.7554/eLife.41460.021
-
Supplementary file 5
Sequencing counts of bEXOmiRs in EV fraction sub-library screens.
- https://doi.org/10.7554/eLife.41460.022
-
Supplementary file 6
Sequencing counts of sgRNAs in cellular fractions from sub-library screens.
- https://doi.org/10.7554/eLife.41460.023
-
Supplementary file 7
NanoString miRNA profiling results.
- https://doi.org/10.7554/eLife.41460.024
-
Transparent reporting form
- https://doi.org/10.7554/eLife.41460.025
Download links
A two-part list of links to download the article, or parts of the article, in various formats.
Downloads (link to download the article as PDF)
Open citations (links to open the citations from this article in various online reference manager services)
Cite this article (links to download the citations from this article in formats compatible with various reference manager tools)
Genome-wide interrogation of extracellular vesicle biology using barcoded miRNAs
eLife 7:e41460.
https://doi.org/10.7554/eLife.41460


