Programmed knockout mutation of liver fluke granulin attenuates virulence of infection-induced hepatobiliary morbidity
- Khon Kaen University, Thailand
- George Washington University, United States
- Australian Institute of Tropical Health and Medicine, James Cook University, Australia
- The University of Melbourne, Australia
Figures
Figure 1 with 1 supplement
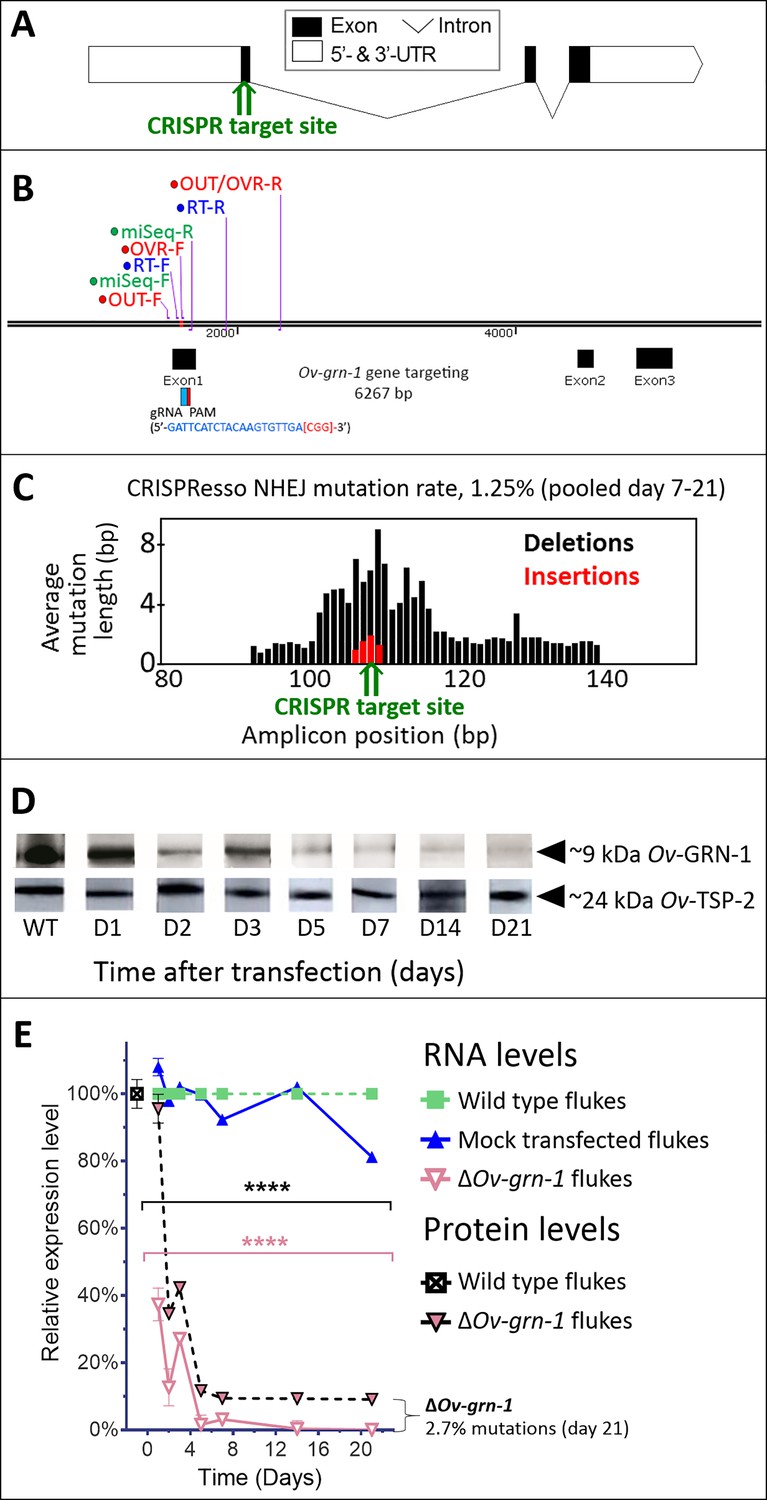
CRISPR/Cas9-mediated gene editing strategy to knockout Ov-GRN-1 in the adult developmental stage of the O. viverrini liver fluke.
(A) Schematic depiction of Ov-GRN-1 gene with CRISPR/Cas9 target site in first exon marked with green arrow. (B) The exon1, 2 and 3 location of Ov-GRN-1 gene, size of 6267 bp and gRNA targeting exon 1: gRNA sequence is highlighted in blue and the PAM (CGG) in parenthesis in red. Primer pairs were used to detect levels of mRNA expression using a RT-qPCR assay (Ov-GRN-1 RT- forward or RT-F and Ov-GRN1 RT-reverse or RT-R), Tri-primers were used to detect the % relative fold amplicon or mutations (outside-forward or OUT-F, overlap-forward or OVR-F and reverse primer or OUT/OVR-R) and MiSeq forward and reverse (MiSeq-F and MiSeq-R) primers were used to prepare the NGS amplicon. (C) CRISPR/Cas9-catalyzed insertion (red bars) and deletion (black bars) mutations (INDELs) detected in the Ov-GRN-1 gene; target site of programmed CRISPR/Cas9 double strand break indicated by the green arrow. Average mutation length was plotted against Ov-GRN-1 gene amplicon position in base pairs (bp). (D) Somatic tissues of individual adult worms (in triplicate per time per group) were solubilized, electrophoresed in SDS-PAGE gels, transferred to nitrocellulose membrane and probed with anti-Ov-GRN-1 rabbit antibody. WT: wild-type control fluke tissues; D1 to 21: ΔOv-GRN-1 fluke tissues sampled the arrow highlighting the ~9 kDa Ov-GRN-1 band at increasing time points (days) following transfection and ΔOv-GRN-1 flukes showed similar levels of expression of Ov-TSP-2 protein (control antibody). D1 to 21, protein products from flukes days 1 to 21 following gene-editing treatment. Western blot strips probed with rabbit anti-Ov-TSP-2 antiserum, the arrow highlighting the band at ~24 kDa representing Ov-TSP-2. (E) Reduced levels of Ov-GRN-1 transcripts and Ov-GRN-1 protein after transfection of adult flukes with Ov-GRN-1 CRISPR/Cas9 construct using quantitative real-time PCR (mRNA) and densitometry of western blot signals (protein). Data were plotted relative to wild type (WT) fluke values (100%) as the mean ±SD of three replicates. ****p < 0.0001 compared to levels in WT flukes - protein in black; RNA in pink - at each time point (two-way ANOVA Holm-Sidak multiple comparison test).
Figure 1—figure supplement 1
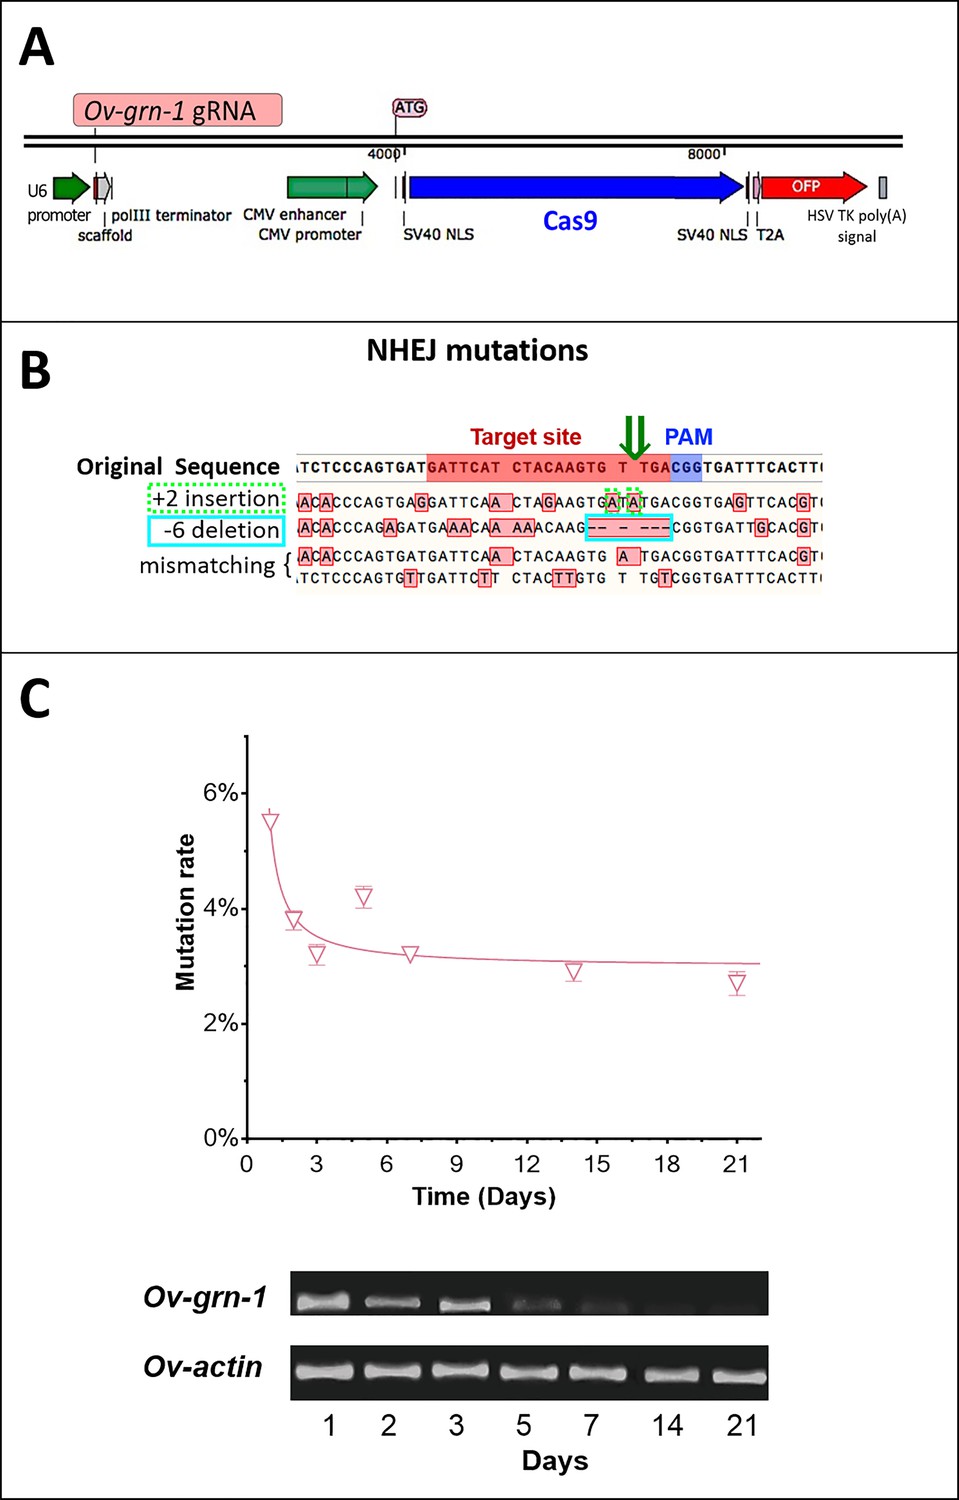
CRISPR/Cas9 targeting Ov-GRN-1 design and fluke transfection.
(A) Ov-GRN-1 guide RNA insertion and Cas9 cassette. (B) The reference (WT) Ov-GRN-1 sequence with the target (red bar) and PAM (blue bar) sites highlighted. The dark green arrow indicates the programmed CRISPR/Cas cleavage site. Deep sequencing was used to determine specific mutations; the four sequences below the reference sequence provide examples of mutated Ov-GRN-1 genes; variations with red-boxed bases highlight mutations induced by the CRISPR/Cas9 manipulation. All four examples show a range of insertion, deletion or mismatch mutations boxed in red. The ‘+2 insertion’ with a dotted light green box highlights two alanine insertions near the programmed target site. The ‘−6 deletion’ highlights six absent base pairs with a light blue box that includes the target site. (C) The mutation rates were estimated using qPCR at each time point of ΔOv-GRN-1 adult flukes cultured in vitro and the means and standard deviations were determined. Gel of RT-qPCR products following electrophoresis (lower image) revealed that Ov-GRN-1 RNA levels were reduced in ΔOv-GRN-1 adult flukes.
Figure 2 with 1 supplement
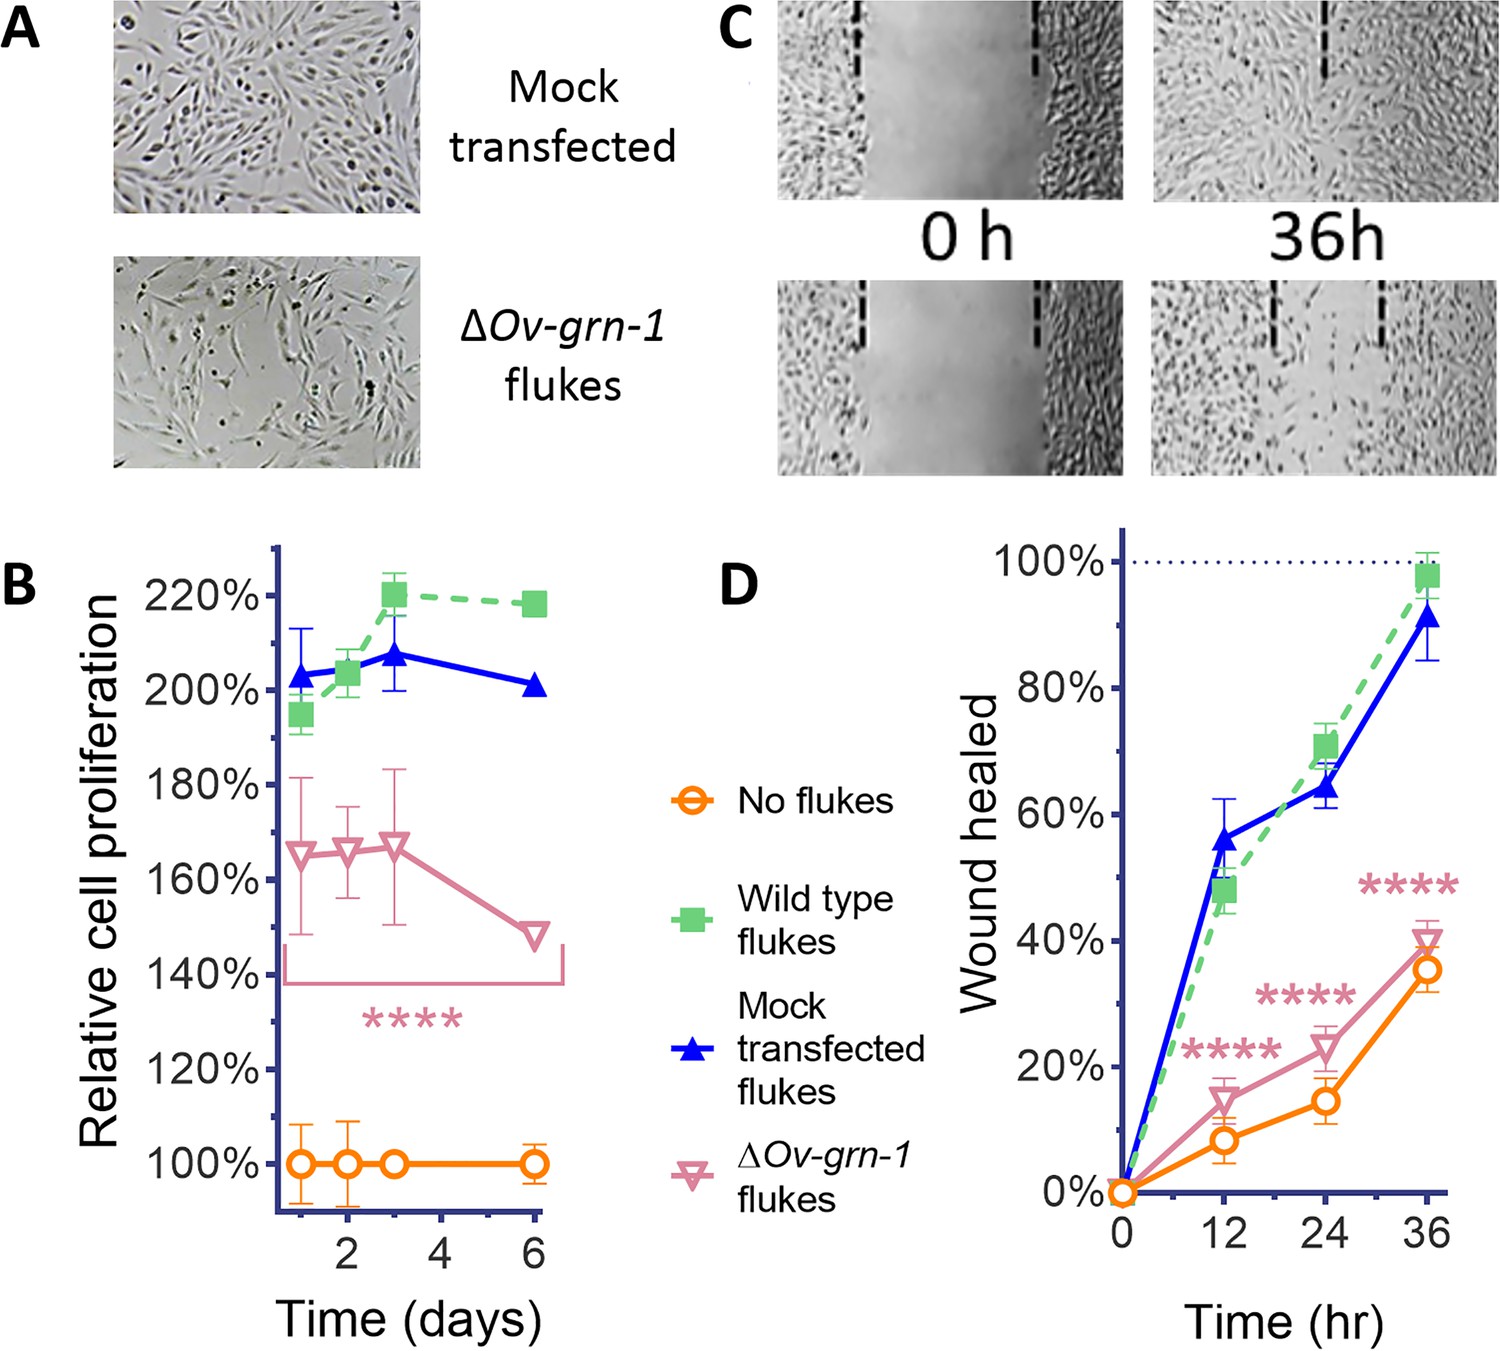
ES products of ΔOv-GRN-1 adult flukes induced less cell proliferation and wound repair in vitro.
(A) Representative cell proliferation images of H69 cholangiocyte cells co-cultured with flukes in Transwell plates; mock transfected (top) and ΔOv-GRN-1 (bottom) groups shown at day 3. (B) Reduced cell proliferation induced by ES products of ΔOv-GRN-1 fluke, as shown in panel (A), quantified from days 1 to 6. Data were plotted as mean relative percentage to control cells cultured in the absence of flukes. (C) Representative image of repair of wound from scratch in cultured H69 scratch during co-culture with flukes in Transwell plates. Mock transfected (upper) and ΔOv-GRN-1 (lower) groups shown at 0 and 36 hr after scratch wounding. Dotted line indicates the margin of the wound. (D) Scratch wound repair assay quantified from 0 to 36 hr, revealing diminished healing in cells co-cultured with the ΔOv-GRN-1 parasites. Panels (B) and (D): mean ±SD, three replicates; ****p < 0.0001 compared to wild-type flukes with two-way ANOVA Holm-Sidak multiple comparison test.
Figure 2—figure supplement 1
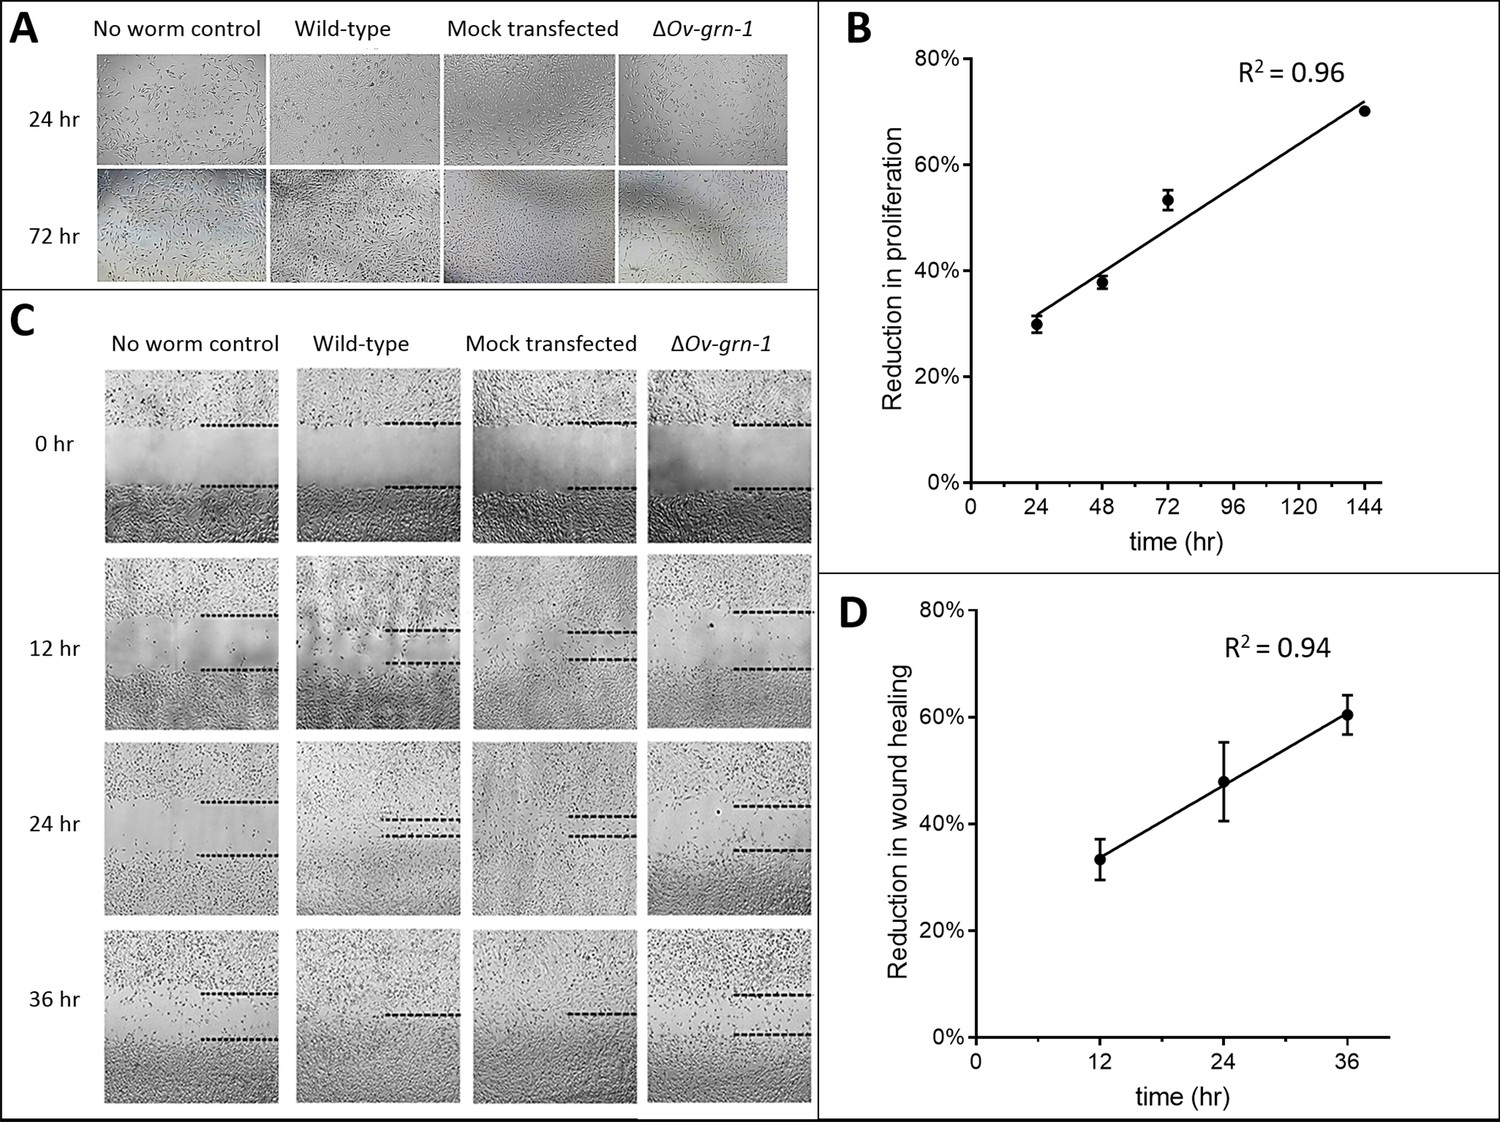
Extended set of images showing ΔOv-GRN-1 adult fluke ES products induce less in vitro cell proliferation and wound repair.
(A) Representative cell proliferation images of H69 immortalized human cholangiocyte cell line co-cultured with flukes in Trans-well plates; shown at 24 and 72 hr. (B) Comparing the difference in cell proliferation values from Figure 2B between ES products from the ΔOv-GRN-1 flukes and ES from WT flukes revealed a linear correlation of reduction of cell proliferation that increases over time. (C) Representative image of scratch wound repair of cultured cholangiocytes when H69 cells were co-cultured in Trans-well plates with flukes; time points from 0 to 36 hr post-scratch. Dotted line indicates the margin of the wound. (D) Scratch wound repair assay quantified values from Figure 2D showed an increasing linear correlation over time of reduced wound closure when plotting the difference between the ΔOv-GRN-1 and the WT fluke groups. Panels (B) and (D): mean ±SD, three biological replicates.
Figure 3 with 1 supplement
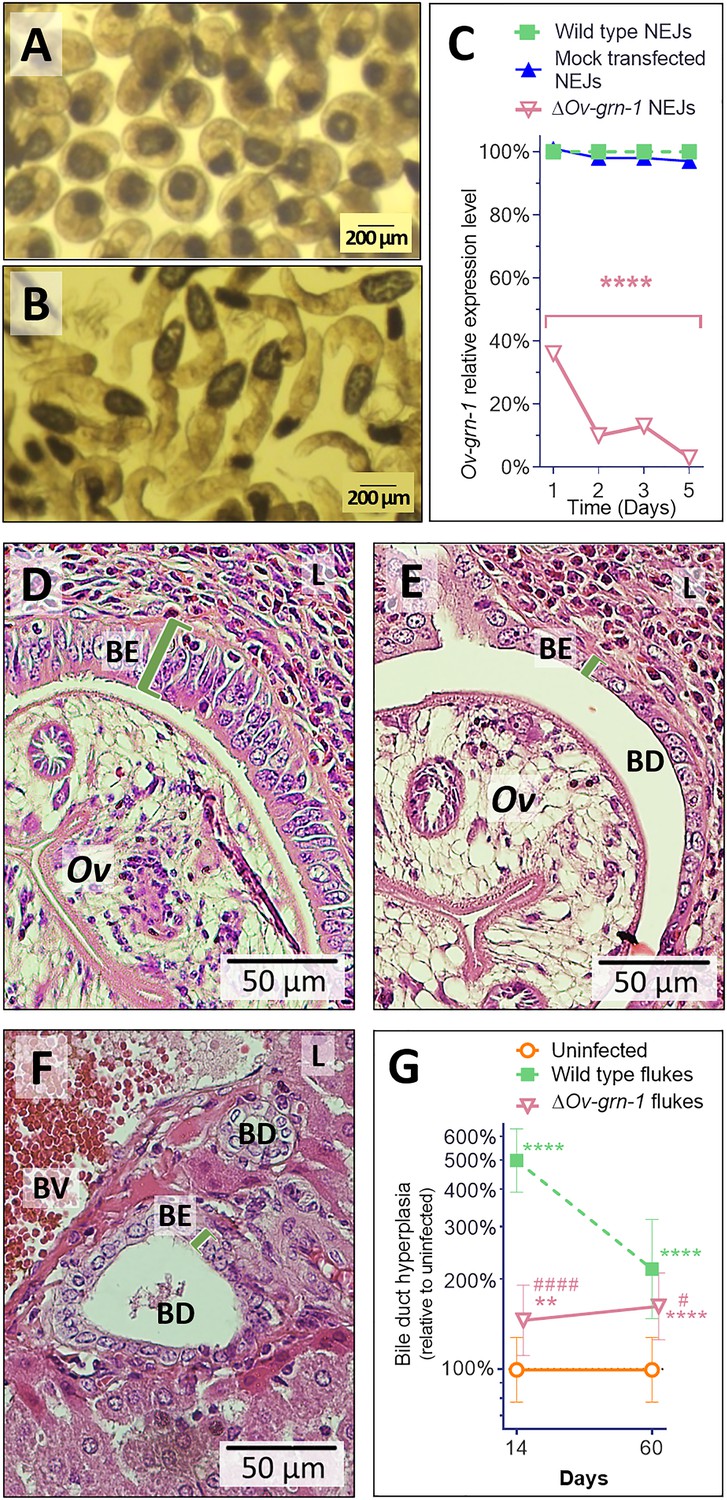
Gene edited ΔOv-GRN-1 newly excysted juveniles infected hamsters but drove reduced acute pathogenic lesions.
Micrographs of metacercariae (A) and newly excysted juvenile flukes (NEJ) (B). (C) Levels of Ov-GRN-1 transcripts in mock-transfected and ΔOv-GRN-1 flukes at one to five days as quantified with qPCR and plotted relative to the wild type (WT) untreated group; mean ±SD; three replicates; ****p ≤ 0.0001 compared to WT flukes with two-way ANOVA Holm-Sidak multiple comparison test at each time point. (D) Representative micrograph (200 × magnification) of H&E-stained thin sections from livers of hamsters at 14 days after infection with WT flukes. (E) Representative micrograph of H&E-stained thin sections showing hamster liver 14 days after infection with ΔOv-GRN-1 flukes. (F) Representative micrograph of H&E stained thin sections of livers of control, uninfected hamsters, revealing the healthy, organized pavement-like profile of the cells of the biliary epithelium (BE) enclosing the lumen of the bile duct (BD), near a blood vessel (BV), within the liver (L). Infection by WT flukes (D) revealed thickened, disordered epithelium adjacent to the parasite (Ov). Infection with the gene edited ΔOv-GRN-1 flukes (E) revealed a bile duct epithelium more similar to the uninfected hamster. (G) Epithelium width/hyperplasia (green bracket) was quantified using ImageJ and plotted as the mean ±SD of five biological replicates (hamsters) from each of group and time point (14 and 60 days). Significant differences were apparent when compared to the uninfected group using the two-way ANOVA with Holm-Sidak multiple comparison test: **p ≤ 0.01 and ****p ≤ 0.0001, and wild-type compared to ΔOv-GRN-1, #p ≤ 0.05 and ####p ≤ 0.0001.
Figure 3—figure supplement 1
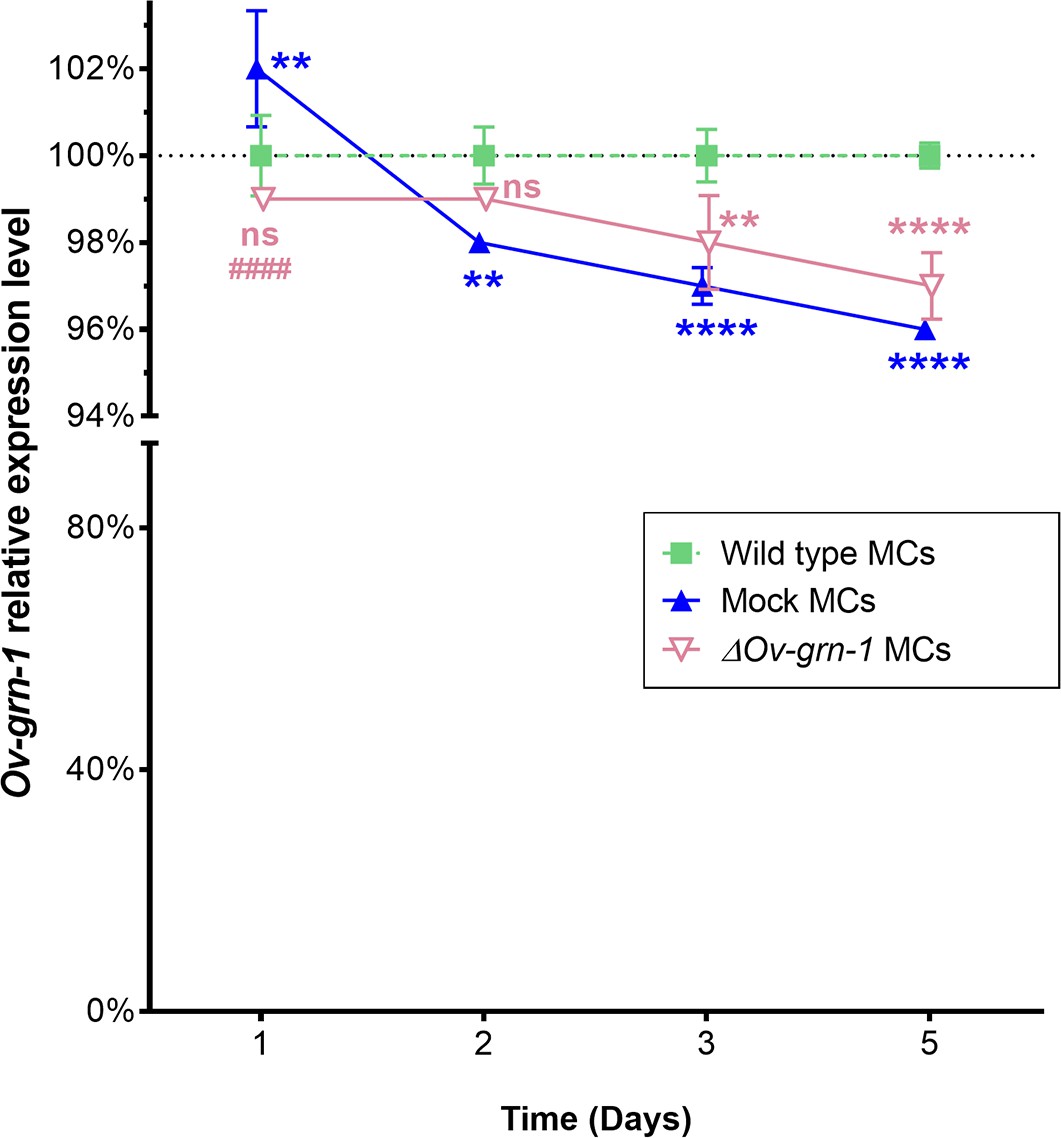
CRISPR/Cas9 ineffective at silencing gene expression in metacercariae (MC).
Expression of Ov-GRN-1 mRNA in WT, mock-transfected, and ΔOv-GRN-1 MC over 5 days as quantified with qPCR and plotted relative to the WT untreated group; mean ±SD from three replicates. Note: Curves have been adjusted horizontally ±0.02 time units and a broken axis used with a condensed lower section to enhance data visualization. Using two-way ANOVA Holm-Sidak multiple comparisons test to compare groups at each time point: p > 0.05 = non-significant (ns) difference; **P ≤ 0.01; and ****p ≤ 0.0001 represent ΔOv-GRN-1 (pink) or Mock (blue) MC compared to WT control group (green), ####p ≤ 0.0001 represents ΔOv-GRN-1 compared to mock MC group.
Figure 4 with 1 supplement
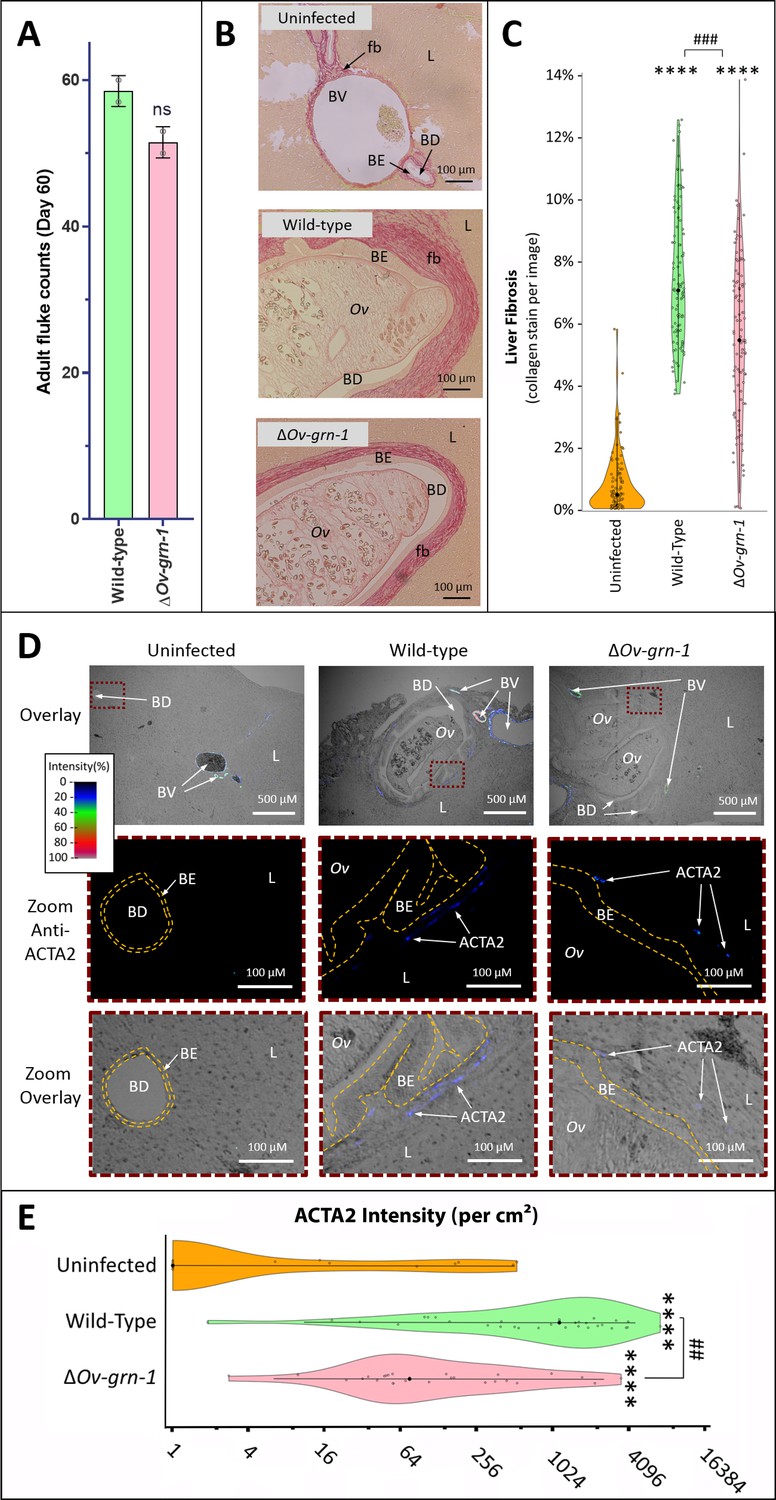
Reduced fibrosis during chronic infection of hamsters with gene-edited ΔOv-GRN-1 liver flukes.
(A) Adult fluke numbers were counted from the livers of necropsy at 60 days post-infection and presented as the average and range for two hamsters per group. Numbers of flukes were similar in the wild type (WT) and ΔOv-GRN-1 groups; non-significant (ns). (B) Representative micrographs of thin sections of Sirius red-stained liver (L) from uninfected hamsters revealed minimal deposition of collagen (fibrosis [fb]) in the periductal regions and adjacent liver parenchyma; a thin margin of red-stained material outlined the endothelial cells of the blood vessel (BV) walls, and the biliary epithelia (BE) of the bile ducts (BD). Livers from hamsters infected with WT flukes (Ov) included marked deposition of collagen with elongated BE cells adjacent to the flukes. There was substantial collagen deposition in livers of hamsters infected with ΔOv-GRN1 flukes compared to uninfected liver sections but far less than for hamsters infected with WT flukes. (C) Liver fibrosis quantified with ImageJ MRI-fibrosis plugin presented as violin plots: 100 images containing bile ducts from 20 sections (five hamsters) per group; mean (black dot)±SD (vertical line). Fibrosis was reduced in the ΔOv-GRN-1 (23% less) compared to WT fluke-infected hamsters. The width of the violin plot represents measurement frequency. The Kruskal-Wallis with Dunn’s multiple comparisons test was used to compare groups against the uninfected hamsters: ****p ≤ 0.0001; and ΔOv-GRN-1 against WT, ###p ≤ 0.001. (D) Representative micrographs, immunofluorescence/bright-field overlays, of sections probed with anti-ACTA2 antibody with fluorescence intensity indicated on a blue/green/red scale. ACTA2 was universally detected in myofibroblasts surrounding BV but not detected adjacent to healthy uninfected BD. The proximity of ACTA2 to fluke-infected BD was suggestive of myofibroblast generation in response to fluke-induced damage to BE. The upper row of micrographs (overlay) present combined bright-field and anti-ACTA2 fluorescence wide views of the liver sections. The boxed regions in the upper row indicate informative sites, which have been magnified and expanded in the central and lower rows of micrographs. The central row presents the boxed region with anti-ACTA2 fluorescence alone (Zoom Anti-ACTA2) and lower row presents the bright-field image overlaid by the fluorescence field (Zoom Overlay). Liver sections exhibited intense fluorescence surrounding BV (arterial blood vessels: red/green, venous vessels: blue/green), whereas in livers of uninfected hamsters BD exhibited only minimal fluorescence. The highlighted magnified (Zoom) rows of images revealed WT infected livers expressing mild (blue) but steady levels of ACTA2-staining surrounding thickened BE layer. The inner and outer BE cell margins are indicated by the dotted line (orange) around BDs with WT flukes. Livers from hamsters infected with ΔOv-GRN1 flukes showed irregular, generally feeble expression of ACTA2 proximal to BD. (E) Quantified levels of ACTA2 signals surrounding BDs from sections of hamster livers. Violin plot with reverse log2 Y-axis showing the ACTA2 intensity (per cm2 at 300 PPI) adjacent to BE, established from 25 to 30 discrete BD images per group (three hamsters), as assessed with ImageJ. Zero values from the uninfected group were deemed to have a value of 1 in order to plot the log axis. SD indicated as a line with the mean indicated by the central black dot, and the width of the violin indicative of frequency of measurement. ACTA2 staining showed 94% median reduction in ΔOv-GRN-1 fluke-infected livers compared to hamsters infected with WT liver flukes. One-way ANOVA with Holm-Sidak multiple comparison test, ****p ≤ 0.0001 compared to uninfected and ##p < 0.01 compared to ΔOv-GRN1 flukes against WT flukes.
Figure 4—figure supplement 1
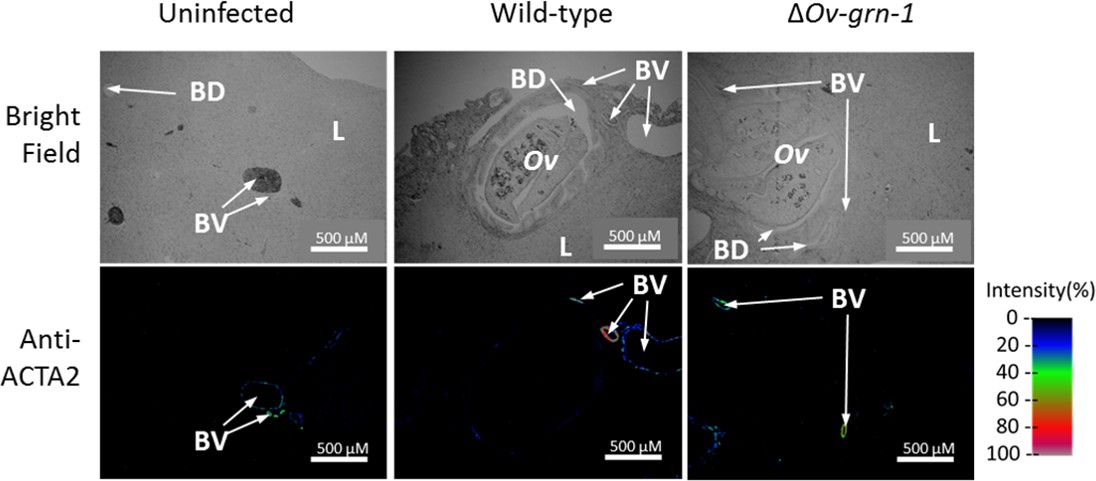
Representative wide-angle view of anti-ACTA2 immunofluorescence and bright field liver sections.
Thin liver sections presented in bright field or under fluorescent light following probing with anti-ACTA2 antibody; fluorescence intensity is indicated on a blue/green/red scale. These images were used to construct the bright field, immunofluorescence overlay and zoomed images in Figure 4D.
Figure 5
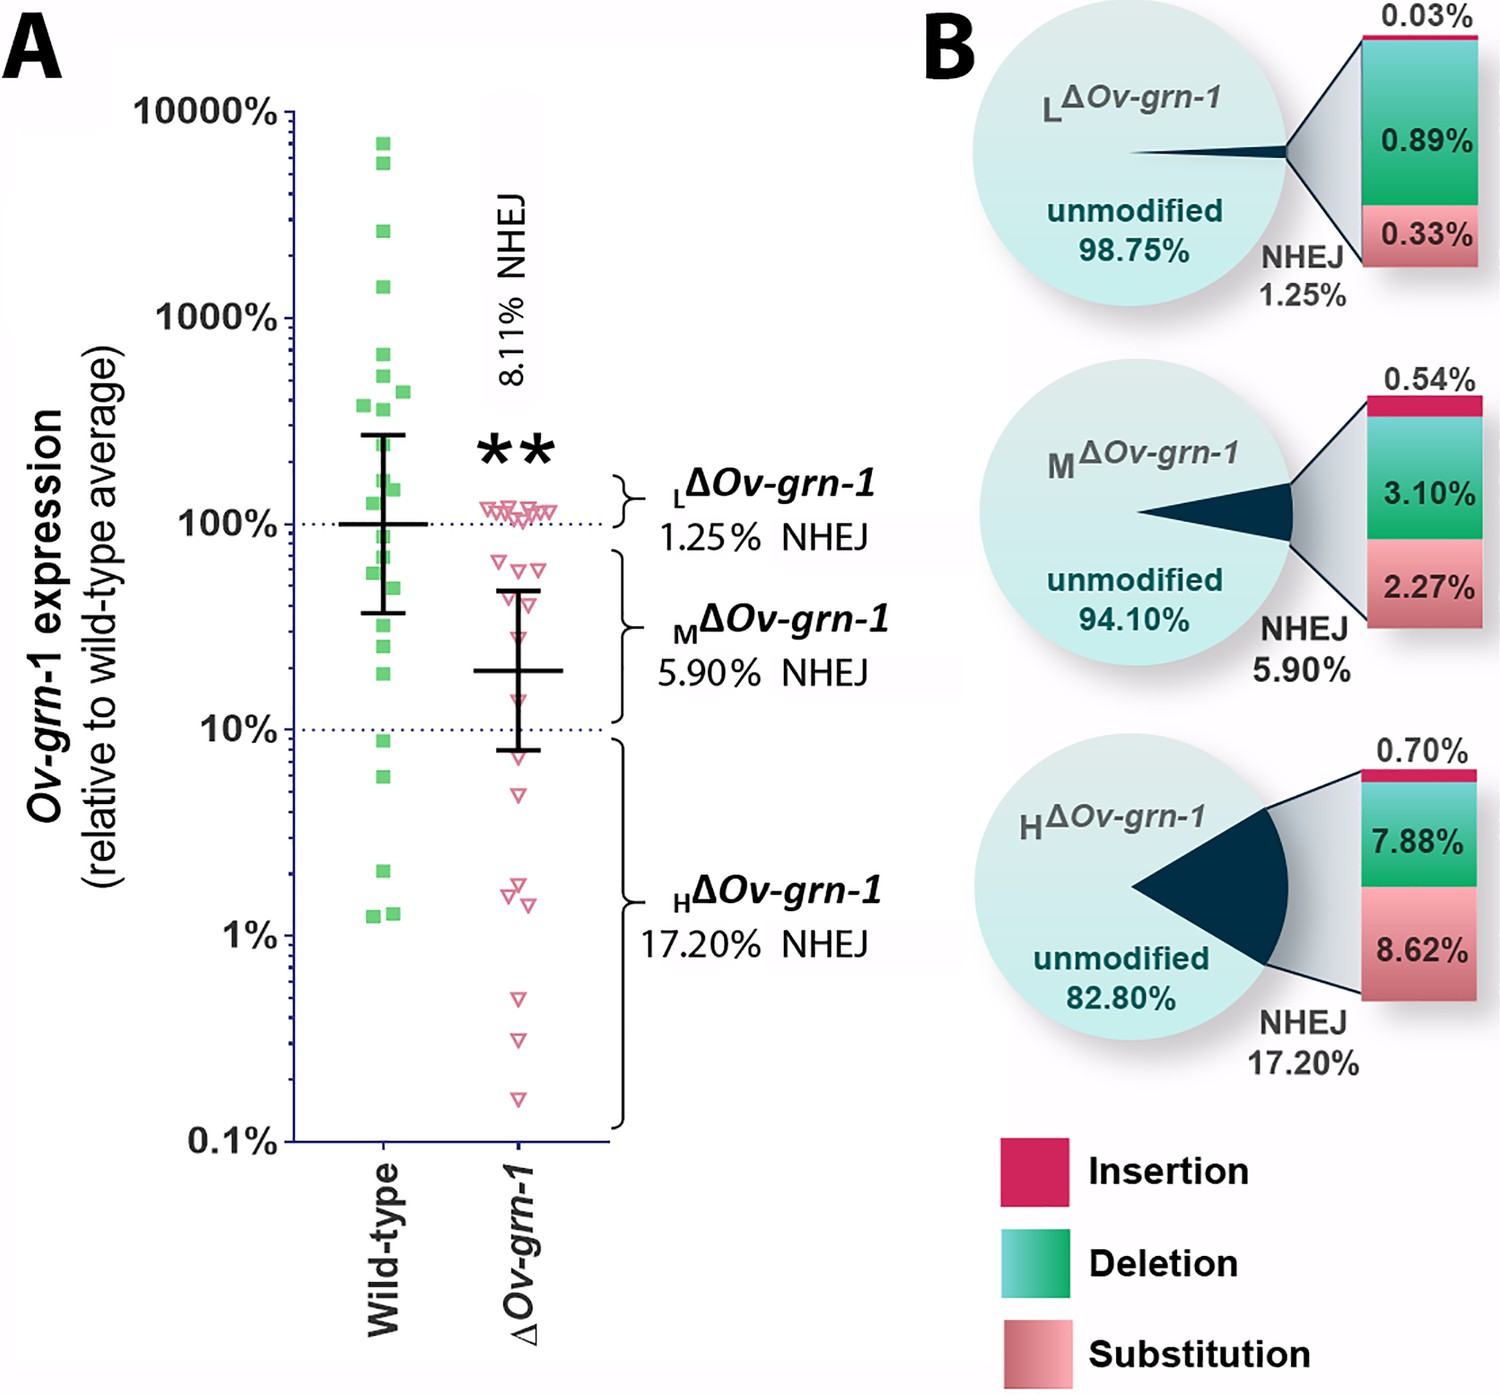
Characterization of gene knockout mutations in adult liver flukes from hamsters chronically infected hamsters.
Expression of Ov-GRN-1 transcripts was reduced in ΔOv-GRN-1 compared to WT flukes. (A) Reverse log10 Y-axis shows the qPCR 2(-ΔΔCt) findings from flukes 60 days after programmed CRISPR/Cas9-gene editing and hamster infection plotted relative to mean value for the WT infection. The WT group displayed a broad level of expression, whereas the mean expression level for the ΔOv-GRN-1 flukes was only 19.4% of the WT group; Mann-Whitney nonparametric test, **p ≤ 0.01. Although significantly lower as a group, individual worms of this ΔOv-GRN-1 cohort displayed phenotypes that ranged from no apparent effect (wild-type phenotype) to markedly diminished expression of Ov-GRN-1 (ΔOv-GRN-1 phenotype). Mutation frequency was assessed by assigning worms in the ΔOv-GRN-1 group into three sub-groups of flukes based on CRISPR/Cas9 mutation frequency. Eight flukes with effective CRISPR gene knockout (HΔOv-GRN1: Ov-GRN-1≤10% expression), seven flukes with modest levels of transcript knockout (MΔOv-GRN-1:>10 to<100% Ov-GRN-1), and 10 flukes exhibiting little or no effect (LΔOv-GRN-1: Ov-GRN-1 100–120%). The aggregate mutation frequency among the three ΔOv-GRN-1 sub-groups was 8.1% and 2.7% as estimated by the NGS-CRISPResso and tri-primer qPCR approaches, respectively. (B) Pie charts showing the CRISPResso estimated rate of programmed mutations in the LΔOv-GRN-1, MΔOv-GRN-1 and HΔOv-GRN1 sub-groups compared to non-mutated, WT reads. NHEJ mutation rate indicated by the pie slice (navy blue) and the proportion of each mutation sub-type is provided on the expanded bar at the right.
Tables
Key resources table
| Reagent type (species) or resource | Designation | Source or reference | Identifiers | Additional information |
|---|---|---|---|---|
| Hamster | Mesocricetus auratus, Syrian golden | Mahidol University, Thailand | NA | |
| Parasite (liver fluke) | Opisthorchis viverrini, adult development stage | (Papatpremsiri et al., 2015; Laha et al., 2007; Sithithaworn et al., 1997; Pinlaor et al., 2013) | NA | Infective stage metacercariae of O. viverrini obtained from naturally infected, cyprinid freshwater fish from Mukdahan and other Isaan provinces, Thailand, and used to infect hamsters. |
| Parasite (liver fluke) | Opisthorchis viverrini, metacercariae and newly excysted juveniles | (Papatpremsiri et al., 2015; Laha et al., 2007; Sithithaworn et al., 1997; Pinlaor et al., 2013; Papatpremsiri et al., 2016) | NA | Infective stage metacercariae of O. viverrini obtained from naturally infected, cyprinid freshwater fish from Isaan provinces, Thailand. |
| Commercial kit | GeneArt CRISPR Nuclease Vector Kit | Invitrogen | A21174 | |
| Serum | Anti-Ov-GRN-1 rabbit serum | (Smout et al., 2009) | NA | |
| Antibody | Alexa Fluor 594- labeled anti-ACTA2 | Abcam (Capone et al., 2016; Burwinkel et al., 2018) | ab202368 | |
| Commercial reagent | Agencourt AMPure XP beads | Beckman | A63880 | |
| Commercial reagent | GeneRead Adaptors I Set A | Qiagen | 180985 | |
| Commercial kit | QIAseq 1-step Amplicon Library Kit | Qiagen | 180412 | |
| Commercial kit | GeneRead Library Quant Kit | Qiagen | 180612 | |
| Human cholangiocyte cell line, H69 | Cholangiocyte cell line derived by SV 40 transformation | (Smout et al., 2015; Grubman et al., 1994) | H69; RRID: CVCL_8121 | |
| Commercial kit | Picro Sirius Red Stain Kit (Connective Tissue Stain) | Abcam | ab150681 |
Additional files
-
Transparent reporting form
- https://doi.org/10.7554/eLife.41463.012
Download links
A two-part list of links to download the article, or parts of the article, in various formats.
Downloads (link to download the article as PDF)
Open citations (links to open the citations from this article in various online reference manager services)
Cite this article (links to download the citations from this article in formats compatible with various reference manager tools)
Programmed knockout mutation of liver fluke granulin attenuates virulence of infection-induced hepatobiliary morbidity
eLife 8:e41463.
https://doi.org/10.7554/eLife.41463


