Perineuronal nets control visual input via thalamic recruitment of cortical PV interneurons
- CNRS UMR 7225, Inserm U1127, Sorbonne Université, France
- Institute Nanoscience-CNR and Scuola Normale Superiore, Italy
- CNR, Istituto di Neuroscienze, Italy
- University of Florence, Italy
Figures
Figure 1
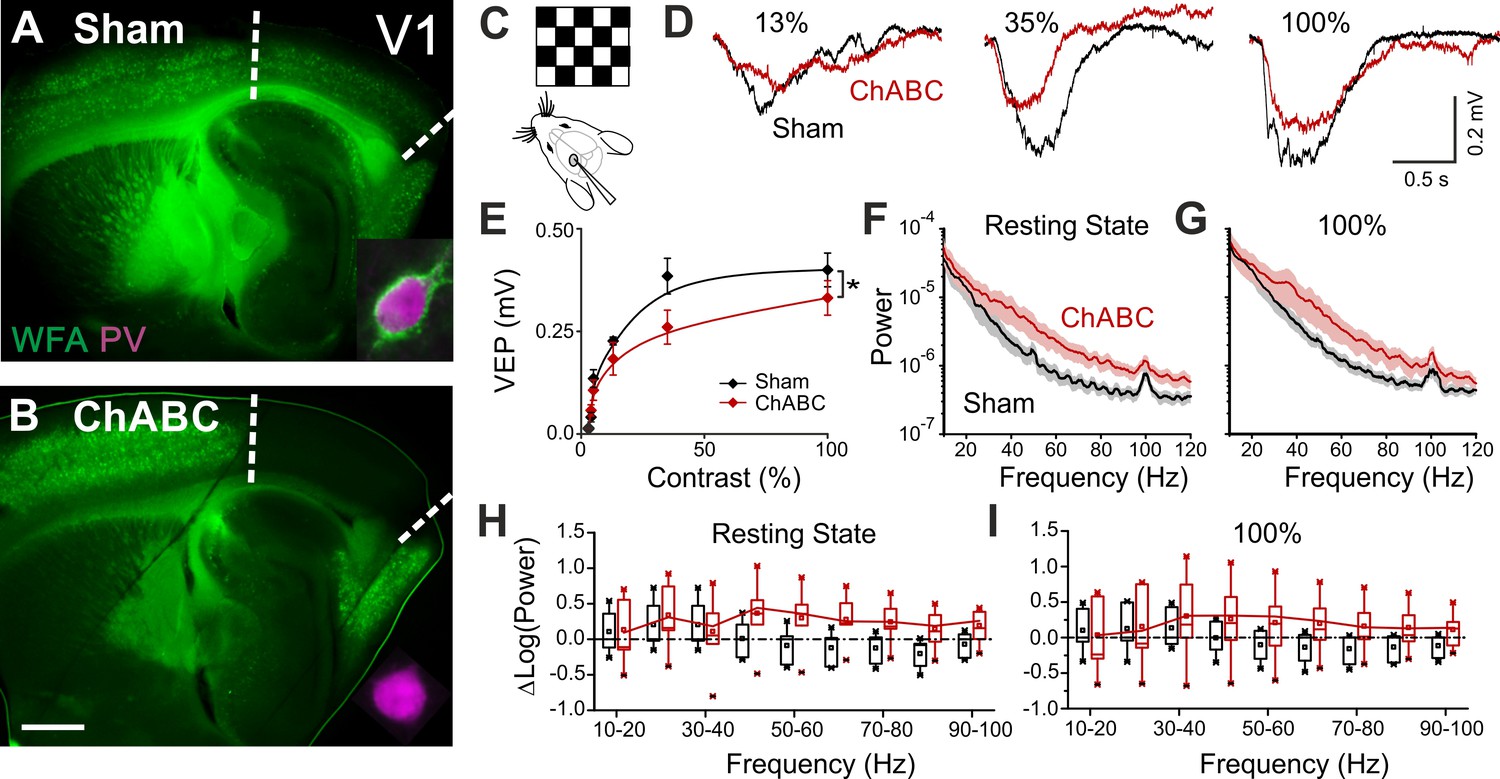
PNN removal in adult mice increases the contrast adaptation gain and the power of γ-oscillation.
(A) Representative micrograph of a sagittal brain slice (thickness: 350 µm) from a control animal, whose visual cortex was injected with PBS (Sham). PNNs are stained with WFA (green) and are present throughout the cortex, including V1 (delimited by dotted lines). The inset shows a magnified micrograph of a cell stained with an anti-PV antibody (magenta), enwrapped by PNNs. (B) Same as in (A), but from a slice obtained from a ChABC-treated mouse. PNN disruption in V1 is indicated by the absence of WFA staining. The inset illustrates a PV cell devoid of PNNs. Scale bar: 500 µm; inset: 20 µm C, Experimental setup. Visual evoked potentials (VEPs) are recorded by a glass microelectrode in the primary visual cortex in the hemisphere injected with either Sham or ChABC. (D) Typical recordings in Sham (black) and after PNN degradation (red). Each recording is the average of 20 sweeps. (E) Transfer function in Sham (black) and after ChABC treatment (red). The two curves exhibit different slopes (*: p < 0.05; ANOVA, N = 5 and 6; ChABC and Sham, respectively). (F–G) Power spectra recorded in resting state (F) and during visual stimulations (G) in control (black) and ChABC-treated (red) animals. Note the differences in the two animal groups. (H–I) Box plots representation of LFP power bins in resting state (H; Two-Way ANOVA, post-hoc Holm Sidak, p < 0.001; N = 5 and 6; ChABC and Sham, respectively) and during visual activity (I; Two-Way ANOVA, post-hoc Holm Sidak, p < 0.005; N = 5 and 6; ChABC and Sham, respectively).
-
Figure 1—source data 1
Source data for Figure 1E–I.
- https://doi.org/10.7554/eLife.41520.004
Figure 2 with 6 supplements
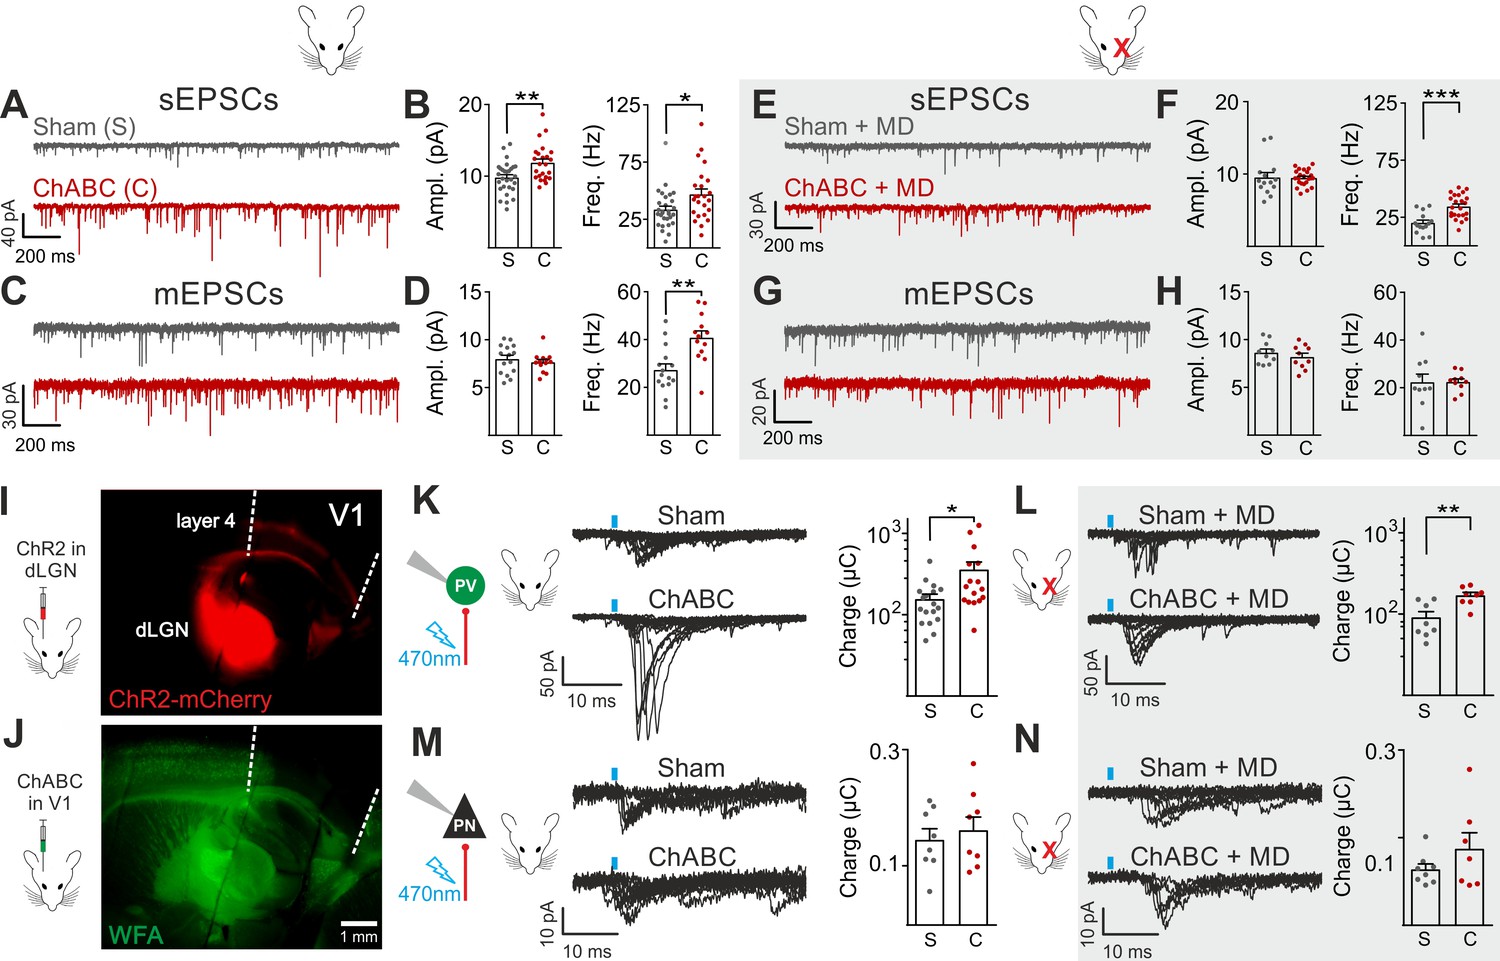
Enhanced glutamatergic recruitment of PV cells by thalamocortical fibers in the absence of PNNs is modulated by sensory deprivation.
(A–B) Example voltage-clamp traces (A) and summary plots (B) of sEPSCs recorded in PV cells in control animals (Sham, grey) and after ChABC treatment (ChABC, red). (C–D) Same as in (A–B) but for mEPSCs recorded in the continuous presence of the sodium-channel blocker TTX. (E–H) Same as in (A–D), but in mice subject to MD. (I) Representative micrograph illustrating a parasagittal brain slice obtained from an adult mouse, which was subject to stereotaxic injection of AAVs to express ChR2- and mCherry in the dLGN. Red staining reflects mCherry expression. Note the extensive innervation of cortical layers 4 and 6. Left: scheme of the AAV injection. (J) After 10 days, the same mouse was injected with ChABC in V1. Note the complete depletion of PNNs in V1, as revealed with WFA staining (green). Left: scheme of ChABC injection, 48–72 hr prior to recordings. (K) Left: Representative traces of optically evoked monosynaptic EPSCs recorded onto a PV cell from a control (Sham, top) and ChABC-injected (ChABC, bottom) animal. Threshold responses: note the presence of failures in both cases. Recordings were done in the presence of TTX and 4-AP. Right: Population data of light-evoked EPSCs (excluding failures) in control (Sham, grey) and ChABC-treated (ChABC, red) animals. Data are plotted in logarithmic scale. (L,) Same as in (K) but in a mouse subject to MD. (M–N) Same as in (K–L), but for PNs. *: p < 0.05, **: p < 0.01, ***: p < 0.001. All values are in Tables S3 and 4.
-
Figure 2—source data 1
Source data for Figure 2B,D,F,H,K,L,M,N.
- https://doi.org/10.7554/eLife.41520.016
Figure 2—figure supplement 1
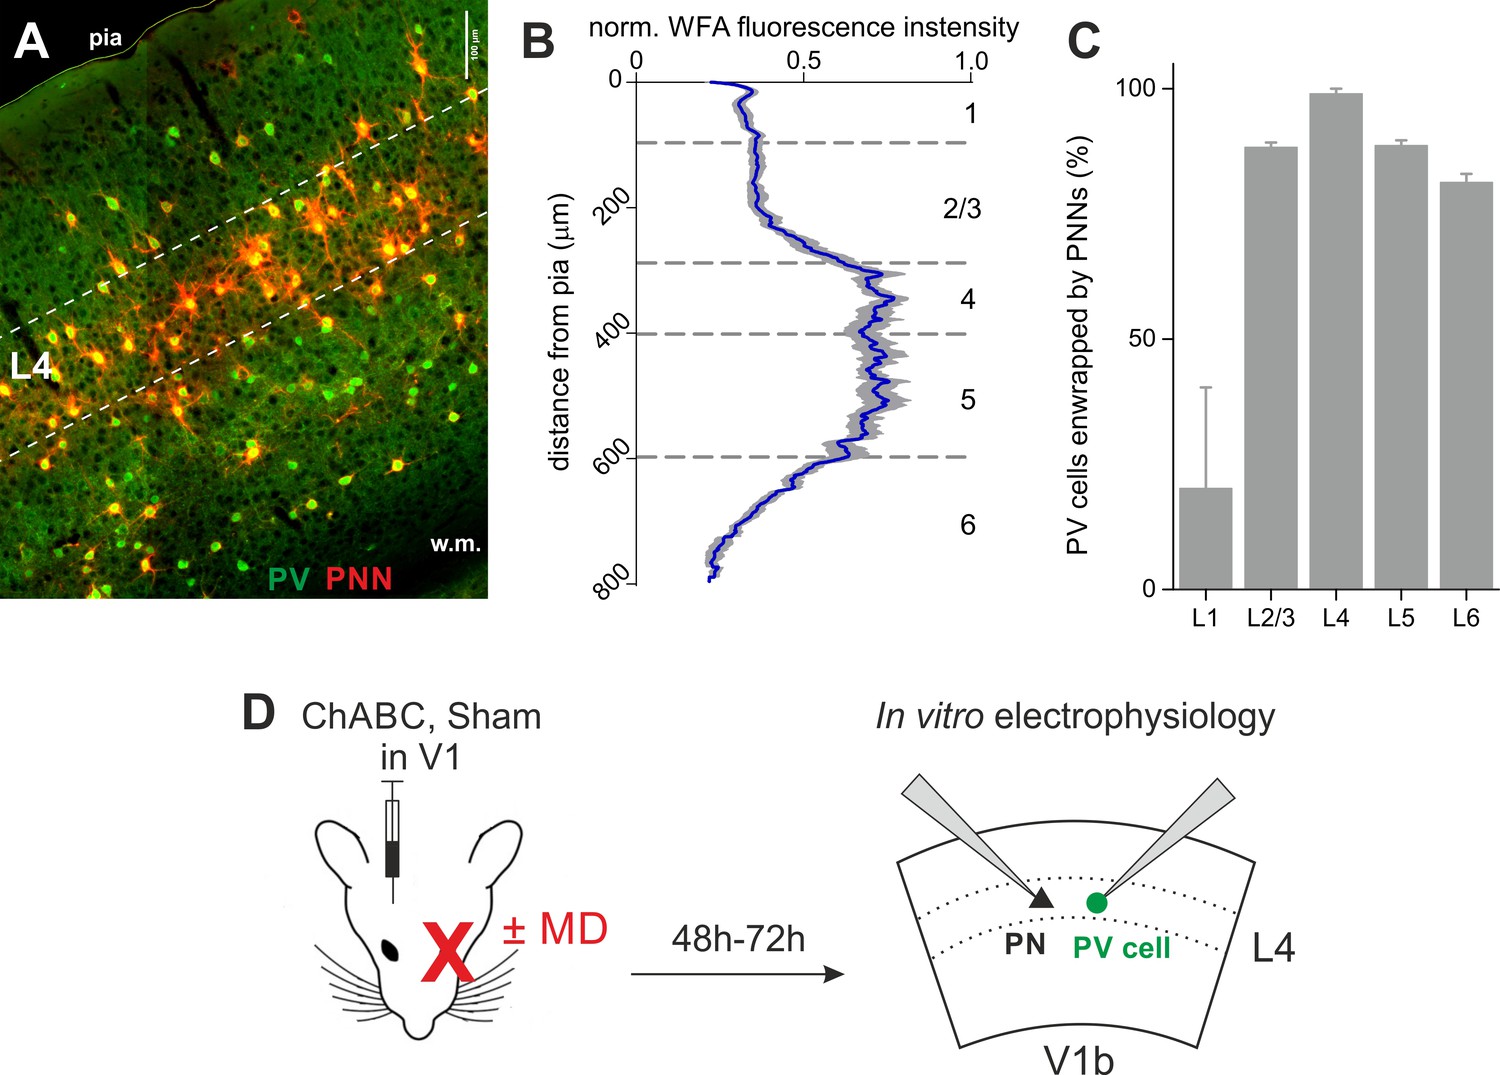
PNNs surrounding PV cells are abundant in L4 of V1.
(A) Epifluorescence image of primary visual cortex (coronal slice, 200 µm) from an adult mouse. PNNs are in red (WFA staining) and PV cells in green (parvalbumin staining). Dotted lines delimitate layer 4. (B) Normalized WFA fluorescence intensity (X axis) across cortical layers (Y axis). Blue line: mean; grey area: standard deviation (n = 10 slices from seven mice). (C) Summary plot illustrating the percentage of PV cells enwrapped by PNNs across cortical layers. (D) Experimental protocol: mice were injected in V1 in vivo with ChABC (or PBS, in sham-treated animals). After 2–3 days, we obtained acute cortical slices and recorded PV cells or PNs in layer 4 of the binocular portion of V1 (V1b). Some mice underwent monocular deprivation. PV = parvalbumin positive interneuron. PN = principal neuron. MD = monocular deprivation.
-
Figure 2—figure supplement 1—source data 1
Source data for Figure 2—figure supplement 1B.
- https://doi.org/10.7554/eLife.41520.007
Figure 2—figure supplement 2
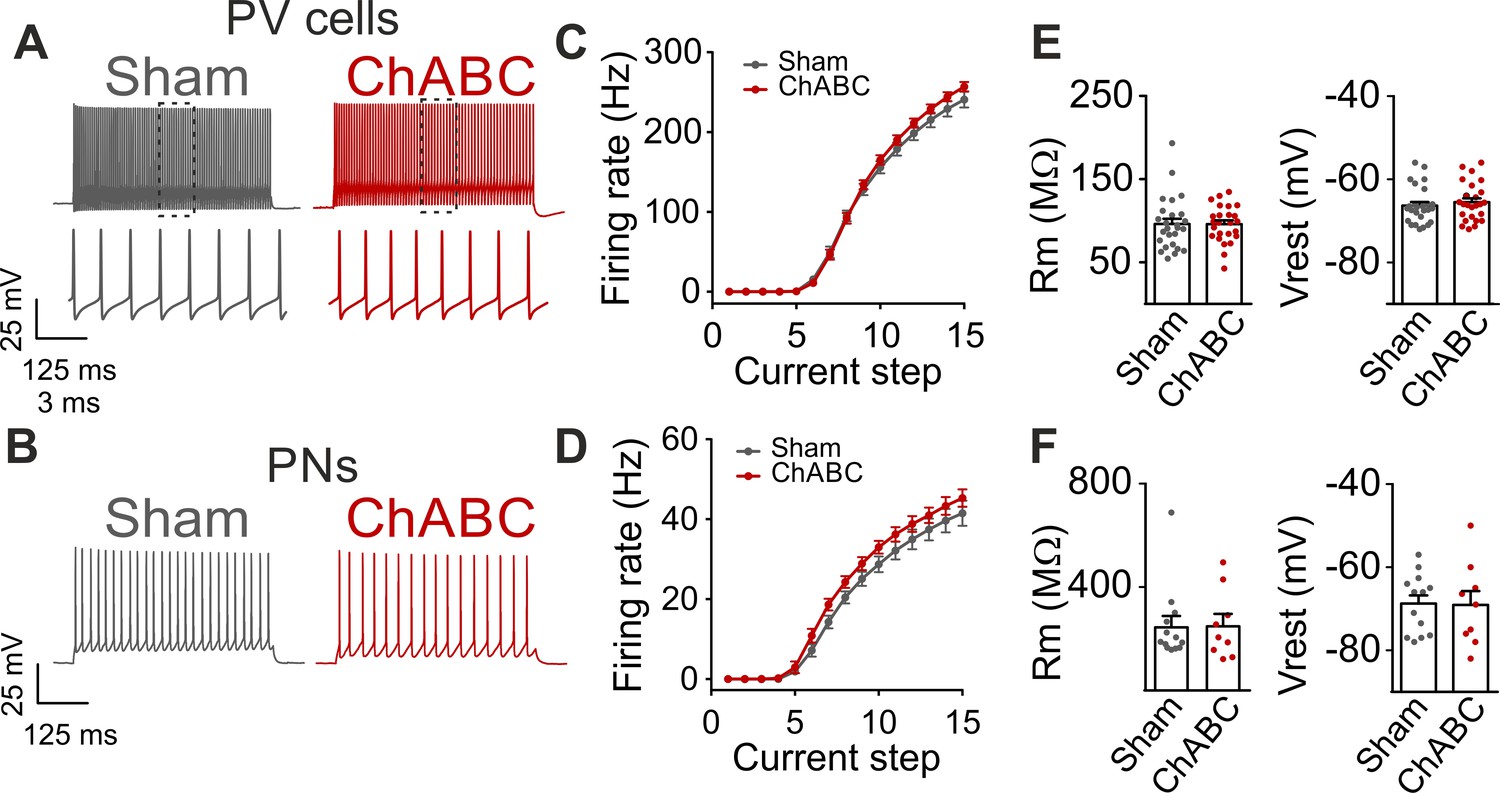
Firing dynamics and passive properties are not altered by PNN removal in adult animals.
(A) Characteristic firing pattern of PV cells in response to depolarizing current injections, in control condition (Sham, grey) and in PNN-depleted animals (ChABC, red). Insets illustrate firing at an expanded timescale corresponding to the dotted region in the upper part. (B) Example firing of PNs in presence (Sham, grey) and absence (ChABC, red) of PNNs. (C–D) Average frequency-current (f–i) curves of PV cells (C) and PNs (d). (E–F) Passive properties of PV cells (E) and PNs (F). PV = parvalbumin positive interneuron. PN = principal neuron. All values are in Table S1.
-
Figure 2—figure supplement 2—source data 1
Source data for Figure 2—figure supplement 2C–F.
- https://doi.org/10.7554/eLife.41520.009
Figure 2—figure supplement 3
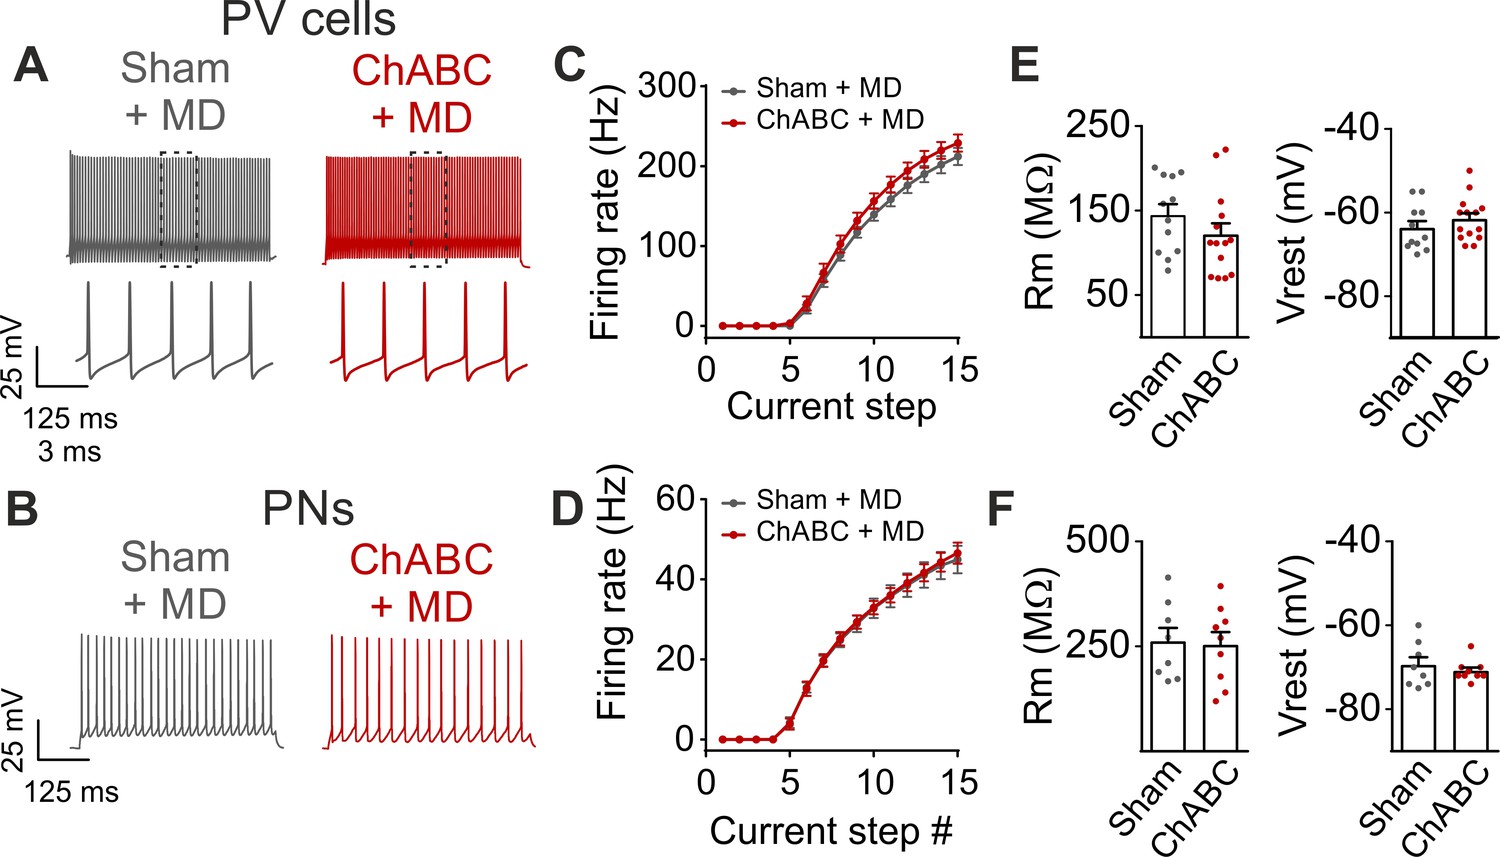
Monocular deprivation does not affect firing dynamics and passive properties following PNN removal in adult animals.
(A–B) Characteristic firing of PV cells and PNs respectively, in response to depolarizing current injections, in control condition (Sham, grey) and in ChABC-treated animals (ChABC, red). Inset in a shows the firing behavior of PV cells at an expanded time scale. (C–D) Average f-i curves of PV cells (C) and PNs (D). (E–F) Passive properties of PV cells (E) and PNs (F). PV = parvalbumin positive interneuron. PN = principal neuron. MD = monocular deprivation. All experiments were performed in sensory deprived animals (MD). All values are in Table S1.
-
Figure 2—figure supplement 3—source data 1
Source data for Figure 2—figure supplement 3C–F.
- https://doi.org/10.7554/eLife.41520.011
Figure 2—figure supplement 4
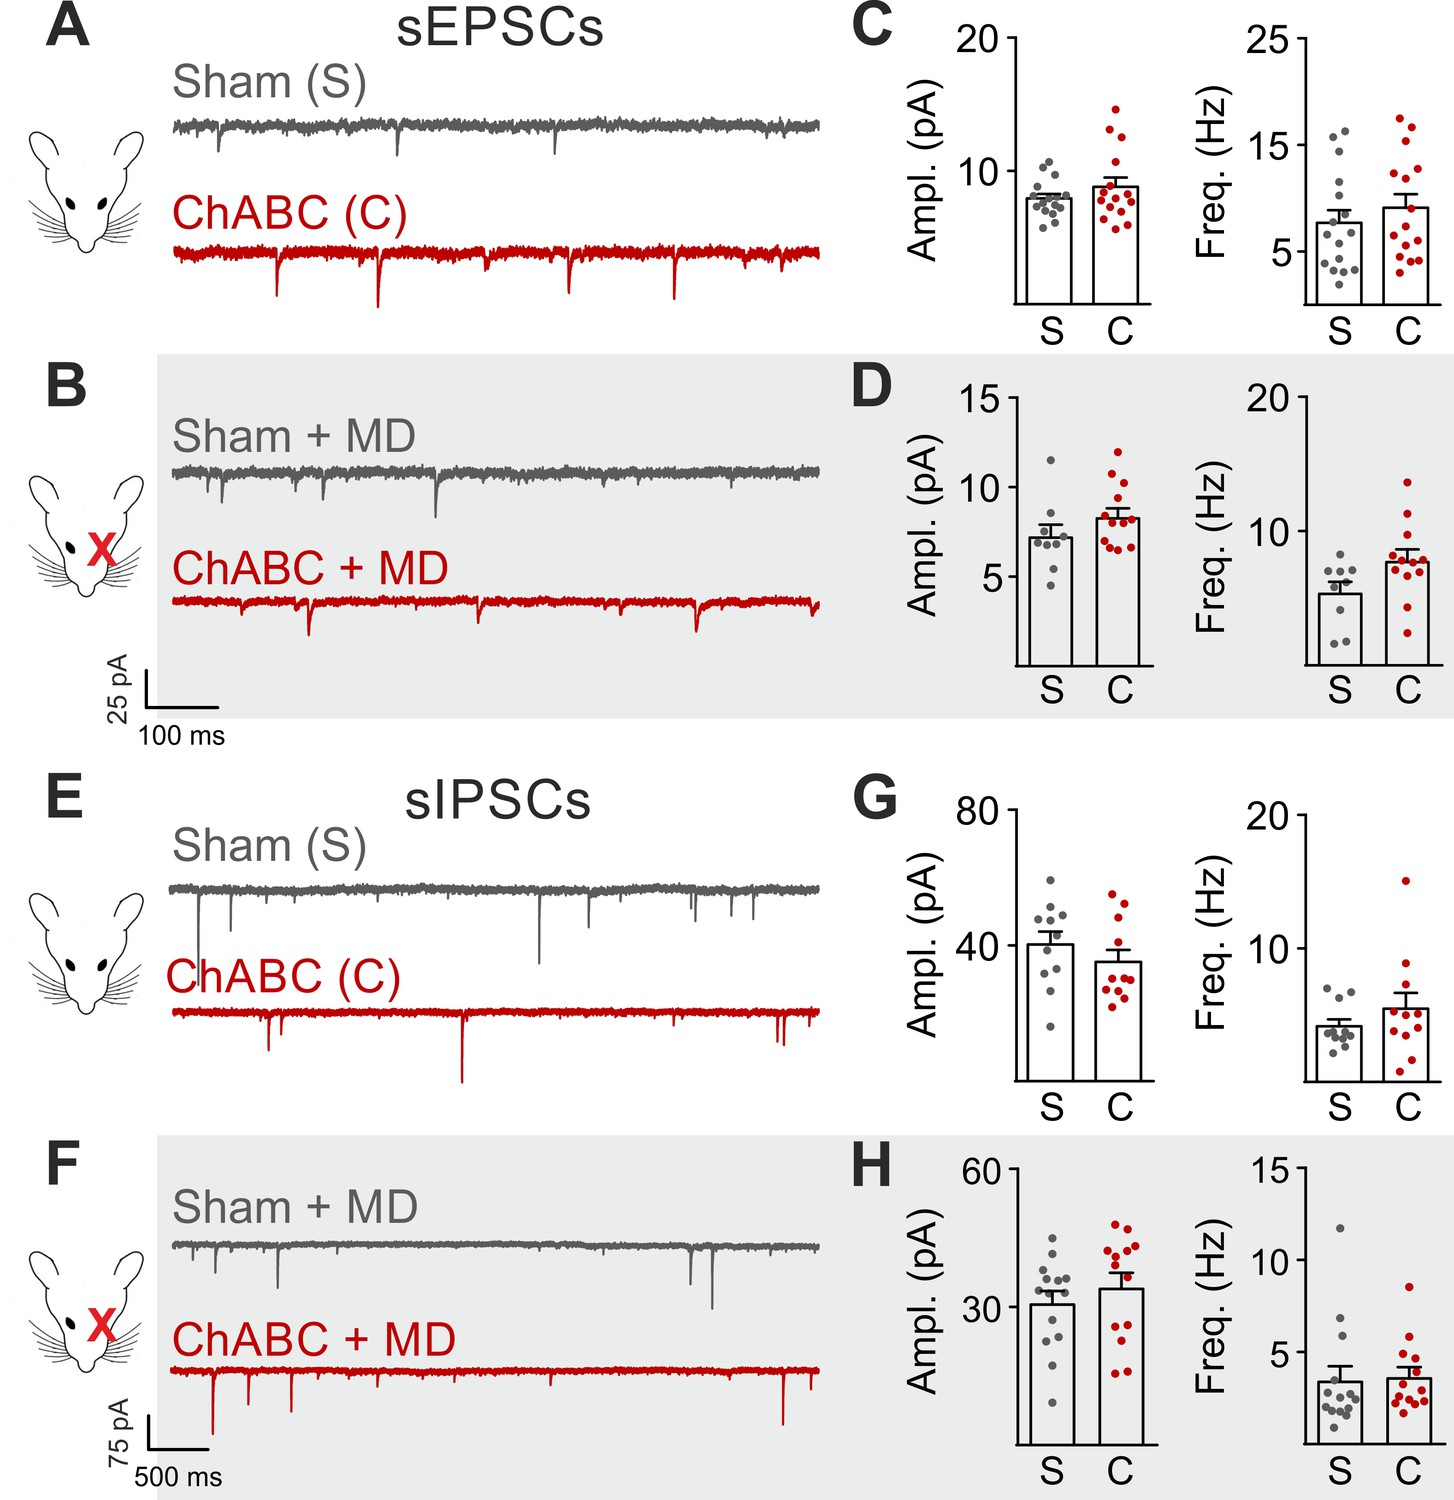
Glutamatergic and GABAergic synaptic transmission onto PNs are unaffected by PNN degradation.
(A–B) Example voltage-clamp traces of sEPSCs recorded in absence (A) and presence (B) of MD, in control animals (Sham, grey) and after ChABC treatment (ChABC, red). (C–D) Plots of average sEPSC amplitude (left) and frequency (right), in absence of MD (c) and in monocular-deprived animals (D), in control animals (S, grey) and after PNN removal (C, red). (E–H) Same as in (A–D), but for sIPSCs, pharmacologically isolated in presence of the glutamate receptor antagonist DNQX. All values are in Supplementary Tables 3 and 5.
-
Figure 2—figure supplement 4—source data 1
Source data for Figure 2—figure supplement 4C,D,G,H.
- https://doi.org/10.7554/eLife.41520.013
Figure 2—figure supplement 5
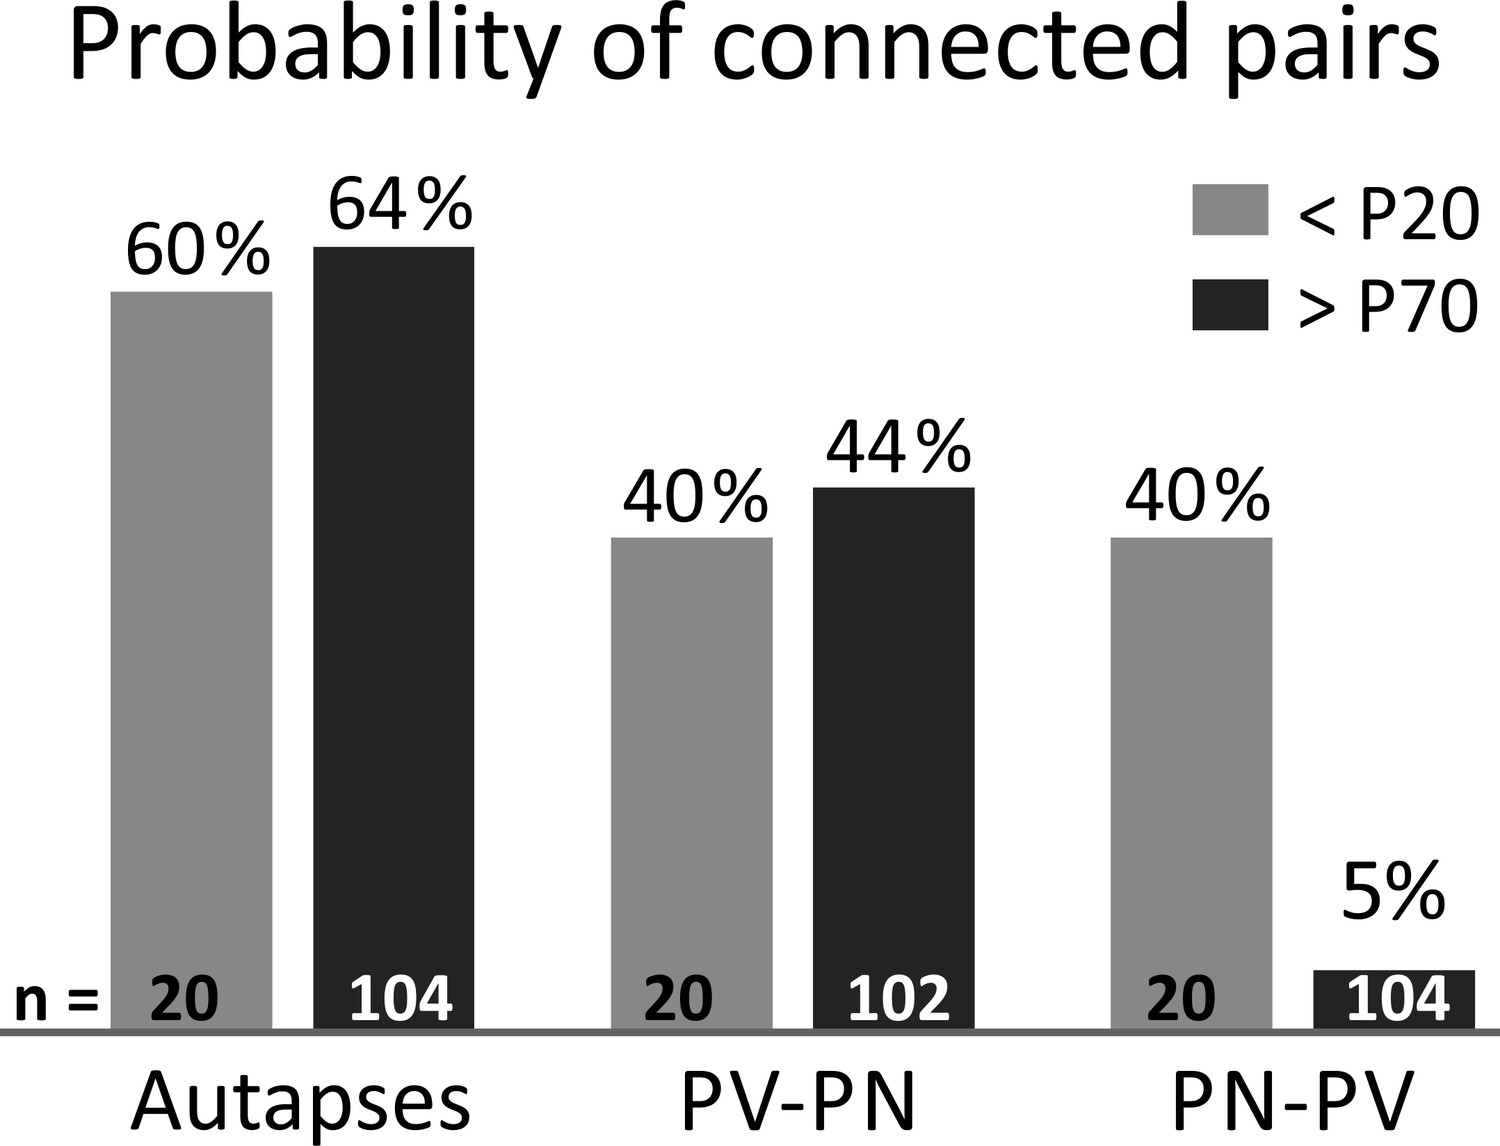
Probability of L4 connected pairs in young and adult mouse V1.
Incidence of autaptic neurotransmission are shown in the left part, PV-PN and PN-PV connectivity in the middle and right part, respectively. Grey bars:<P20 mice; Black bars:>P70 mice. Note that glutamatergic synapses onto PV cells are very rare in adult animals (>P70).=number of tested pairs. PV: parvalbumin-positive interneuron. PN: principal neuron.
Figure 2—figure supplement 6
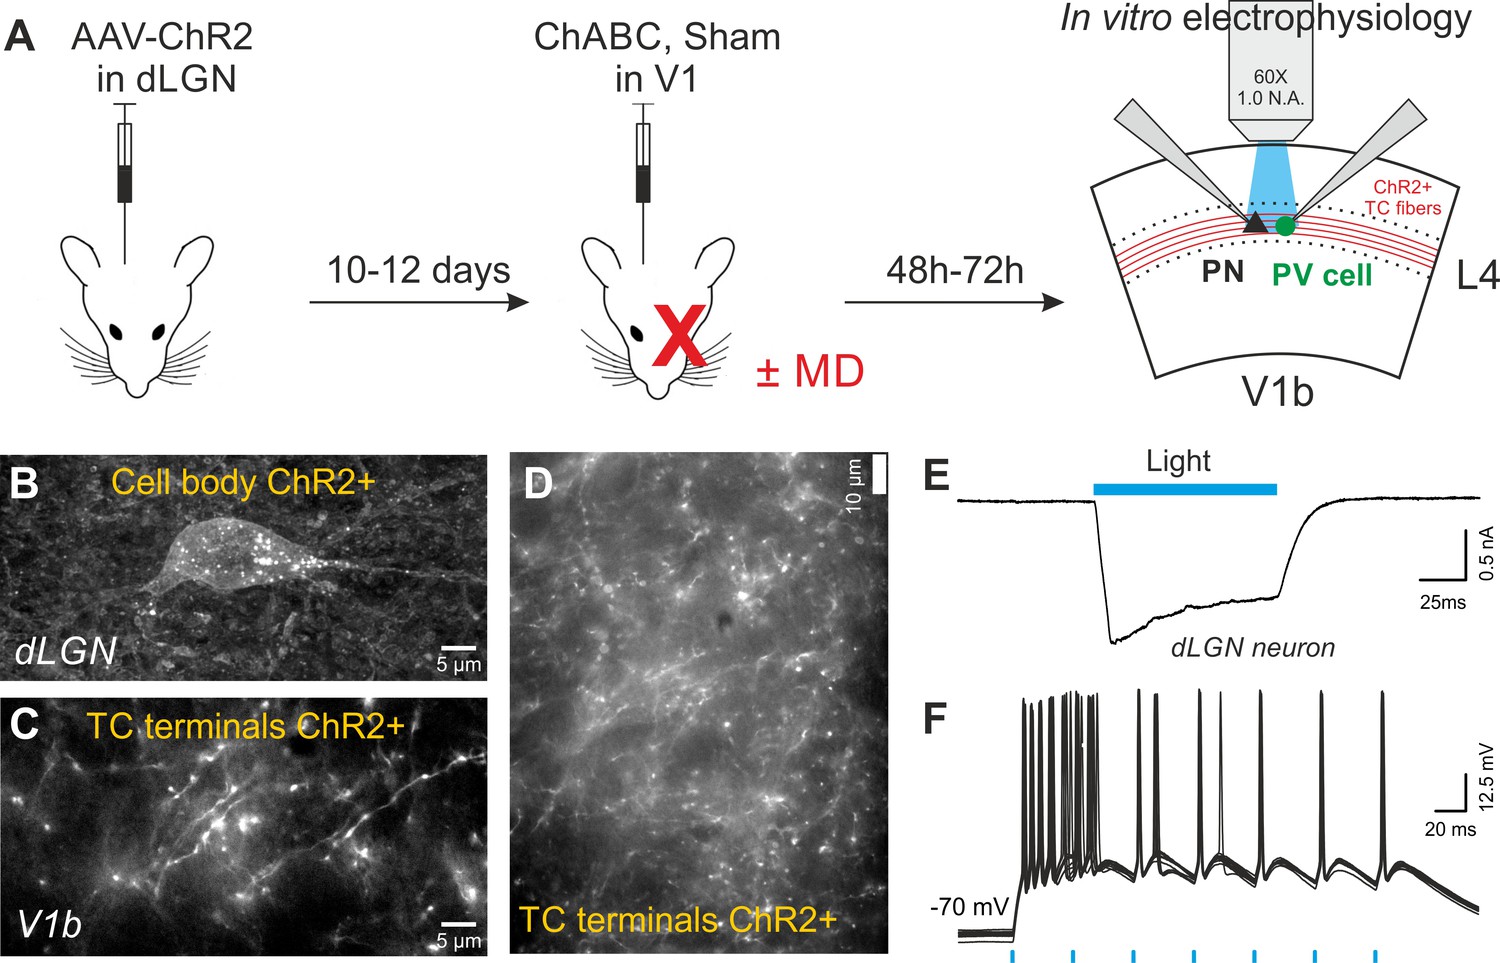
In vivo expression of the light-sensitive opsin ChR2 in the dLGN to measure the strength of thalamocortical connections impinging L4 neurons.
(A) Protocol of dual surgery. CamKII-AAV-ChR2-mCherry was expressed in dLGN of adult mice. 10–12 days later, the same mouse was subject to a second stereotaxic injection of ChABC (or PBS) in order to disrupt PNNs in V1. In addition, some mice underwent a monocular deprivation. In vitro optical stimulation was performed by shining light in V1b, 2–3 days post-ChABC injections. (B) Confocal image of a mCherry (ChR2)-positive glutamatergic cell in dLGN. (C) Confocal image of mCherry (ChR2)-positive fibers in V1b. (D) Fluorescent micrograph of a live cortical slice, at a more expanded scale as compared to panel C, showing lack of mCherry-, and thus ChR2-positive cell bodies in cortical layer 4. This image was taken with the same 63X objective used for photo-stimulation. (E) Example of a typical photo-activated current, recorded in voltage clamp in a dLGN ChR2-positive neuron, following blue light illumination. (F) Representative current-clamp traces of a ChR2-positive dLGN neuron showing reliable action potential firing (20 traces overlapped) in response to brief light flashes. Note the typical burst firing of thalamic neuron in response to the first flash. Blue bars indicate photo-stimulations (blue light, 470 nm).
Figure 3

PNNs do not directly affect GABAergic synapses to and from PV cells.
(A–B) Example voltage-clamp traces (A) and summary plots (B) of sIPSCs recorded in PV cells in control animals (Sham, grey) and after ChABC treatment (ChABC, red). (C–D) Same as in (A–B) but for mIPSCs recorded in the continuous presence of the sodium-channel blocker TTX. s- and mIPSCs were pharmacologically isolated in the continuous presence of DNQX. (E–H) Same as in (A–D), but in mice subject to MD. (I–J) Example traces (average of 50 sweeps) of unitary autaptic IPSCs in PV cells from non-visually deprived animals (I) and following MD (J), in control (Sham, grey) and ChABC-injected mice (ChABC, red). (K–N) Peak amplitude conductance (K, M) and short-term plasticity (L, N) of unitary PV-PV synaptic (opened circles) and autaptic (filled circles) connections in control (Sham, grey) and in ChABC-treated (ChABC, red) mice, in the absence (k,l) and presence (m,n) of MD. Train frequency was 50 Hz. Autaptic responses: filled lines; synaptic responses: dotted lines. (O–T) Same as in (I–N), but for PV-PN uIPSCs. *: p < 0.05. All values are in Tables S5 and 6.
-
Figure 3—source data 1
Source data for Figure 3B,D,F,H,K,L,M,N,Q,R,S,T.
- https://doi.org/10.7554/eLife.41520.018
Figure 4
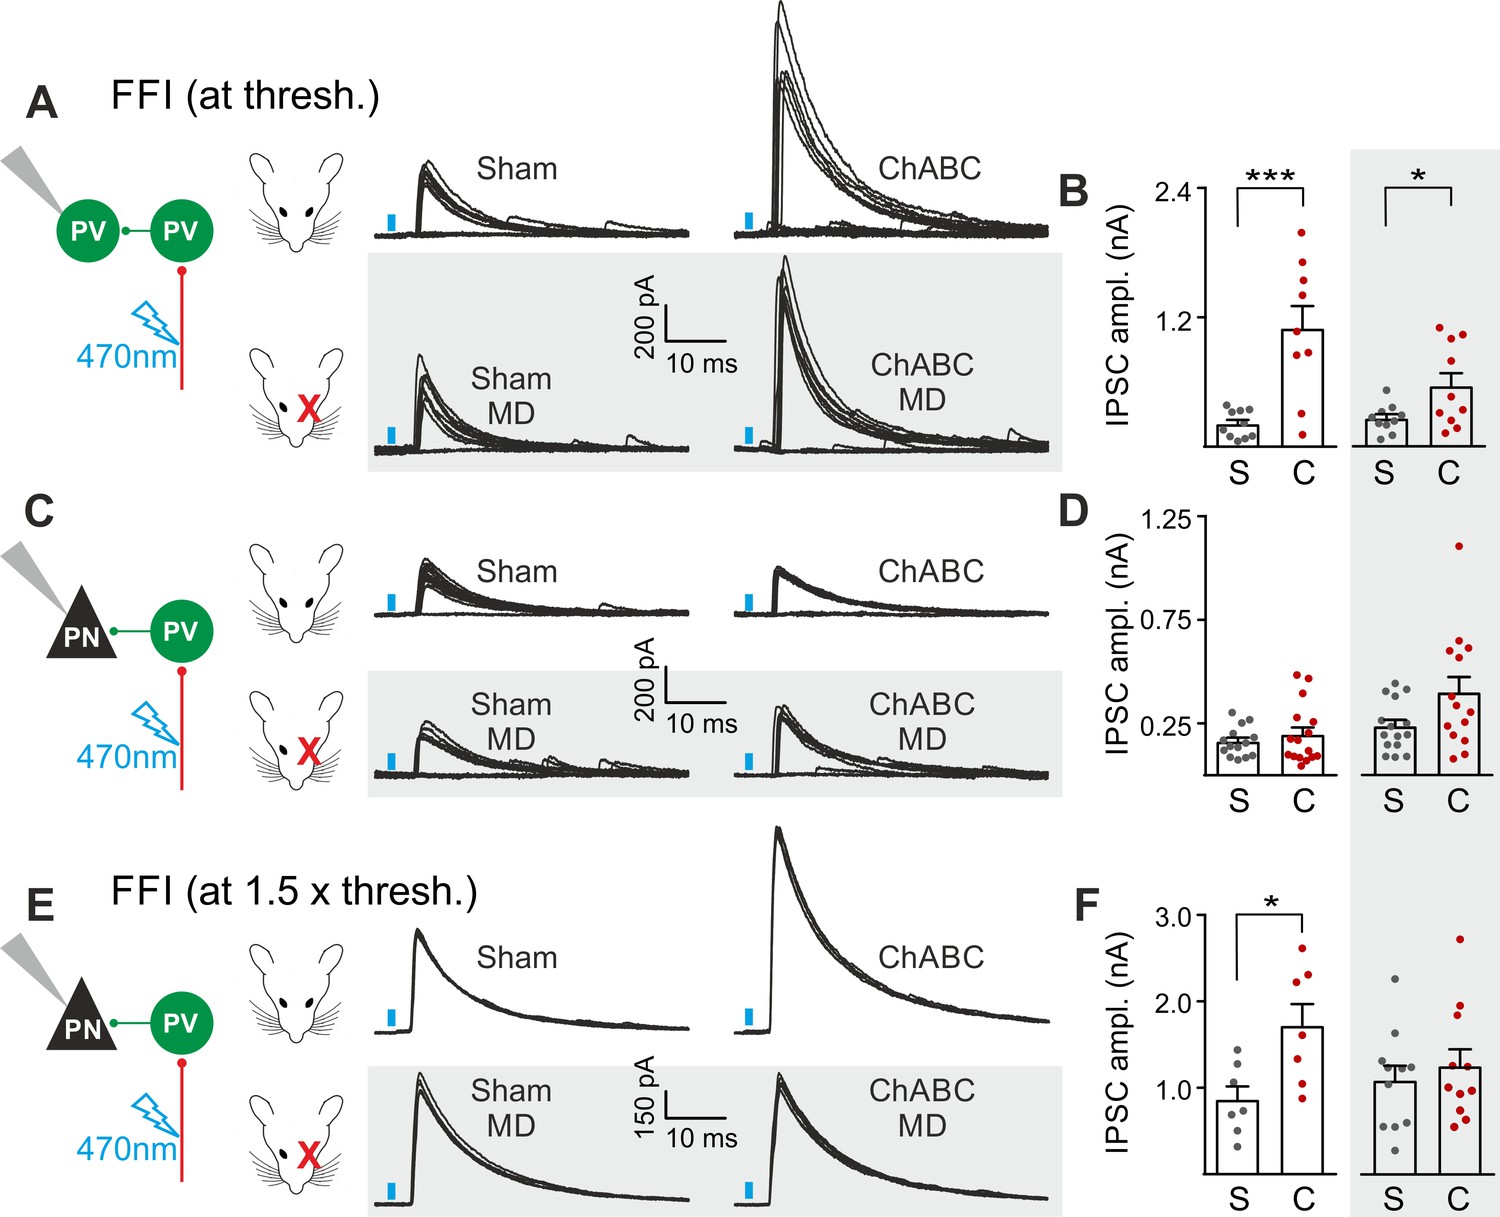
PNNs differently gate thalamocortical feed-forward inhibition on PV cells and PNs in a visually-dependent manner.
(A) Example voltage-clamp traces of feed-forward inhibition (FFI) recorded in PV cells at threshold stimulation (note the presence of failures) in control (Sham, left) and ChABC-treated (ChABC, right) animals, in absence (top) and presence (bottom, shaded area) of MD. Neurons were voltage-clamped at the reversal potential for glutamate-mediated responses in order to isolate disynaptic inhibition. Vertical blue bars correspond to photostimulation. (B) Population data of feed-forward IPSC amplitudes in control (sham, grey) and ChABC-treated (ChABC, red) animals, in the absence (left) and presence (right, shaded area) of MD. (C–D) Same as in (A–B), but for PNs. (E–F) Same as in (C–D), but at 1.5 x threshold stimulation. *: p < 0.05; **: p < 0.01; ***: p < 0.001. All values are in Table S7.
-
Figure 4—source data 1
Source data for Figure 4B,D,H,F.
- https://doi.org/10.7554/eLife.41520.020
Figure 5

Post-CP maturation coincides with a selective reduction of glutamatergic neurotransmission onto PV cells.
(A) Example voltage-clamp traces of sEPSCs recorded in PV cells during development (<P20, P25-P32, P40-P60 and >P70). (B–C) Plots of average sEPSC amplitude (B) and frequency (C) in PV cells. (D–F) Same as in (A–C) but for sIPSCs, pharmacologically isolated in presence of the glutamate receptor antagonist DNQX. (G–L) Same as in (A–F) but onto PNs. PV = parvalbumin positive interneuron. PN = principal neuron. *: p < 0.05, **: p < 0.01, ***: p < 0.001, ****: p < 0.0001. All values are in Table S8.
-
Figure 5—source data 1
Source data for Figure 5B,C,E,F,H,I,K,L.
- https://doi.org/10.7554/eLife.41520.022
Figure 6
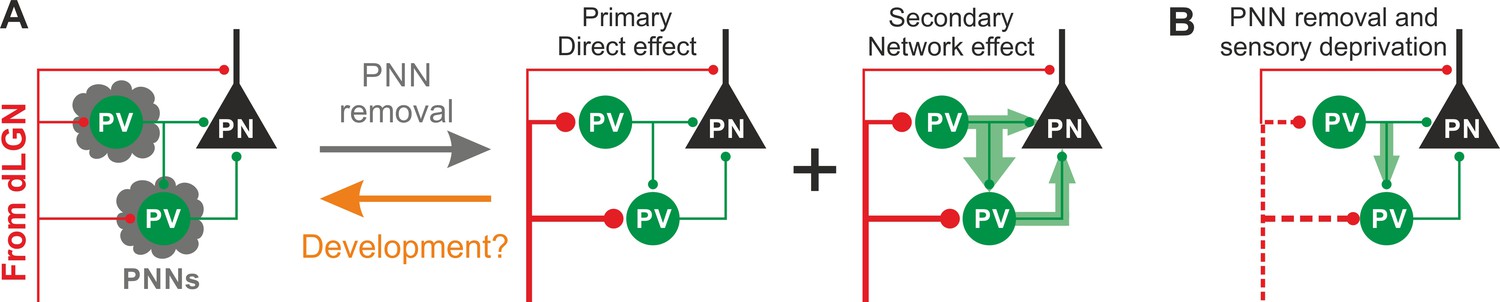
Schematic interpretation of the plastic synaptic and circuit effects induced by PNN removal and monocular deprivation in L4 of adult V1.
(A) In normal adult mice, PV neurons are enwrapped by PNNs (grey). Both PV cells and PNs are contacted by thalamic fibers (red) and form local connections in L4 (green). ChABC injection (grey arrow) disrupts PNNs and induces a specific increase of the recruitment of PV cells by dLGN afferents, schematized by larger synapses (illustrated in red). This primary direct effect leads to a secondary network effect, namely an increase of feed-forward inhibition onto PV cells as well as onto PNs. Importantly, feed-forward inhibition onto PV cells is much stronger and more sensitive than on PNs, as represented by the width of green arrows. Our results on spontaneous transmission suggest that the impact of PNN degradation might re-capitulate younger stages (orange arrow). (B) Plasticity induced by sensory deprivation (MD) in PNN-depleted animals manifests itself as strong reduction (dotted red lines) of the boost of PV-cell recruitment induced by PNN removal normalizing feed-forward inhibition onto PNs and reducing the increase of FFI onto PV cells.
Additional files
-
Source Code 1
MATLAB scripts used for in vivo analyses
- https://doi.org/10.7554/eLife.41520.024
-
Source Code 2
MATLAB scripts used for spike and PSC analyses in slices
- https://doi.org/10.7554/eLife.41520.025
-
Supplementary file 1
contains Tables S1-8
- https://doi.org/10.7554/eLife.41520.026
-
Transparent reporting form
- https://doi.org/10.7554/eLife.41520.027
Download links
A two-part list of links to download the article, or parts of the article, in various formats.
Downloads (link to download the article as PDF)
Open citations (links to open the citations from this article in various online reference manager services)
Cite this article (links to download the citations from this article in formats compatible with various reference manager tools)
Perineuronal nets control visual input via thalamic recruitment of cortical PV interneurons
eLife 7:e41520.
https://doi.org/10.7554/eLife.41520


