Ephrin-B3 controls excitatory synapse density through cell-cell competition for EphBs
- Thomas Jefferson University, United States
- University of Pennsylvania, United States
- University of Delaware, United States
- Institute of Science and Technology Austria, Austria
- Howard Hughes Medical Institute, Stanford University, United States
Figures
Figure 1 with 1 supplement
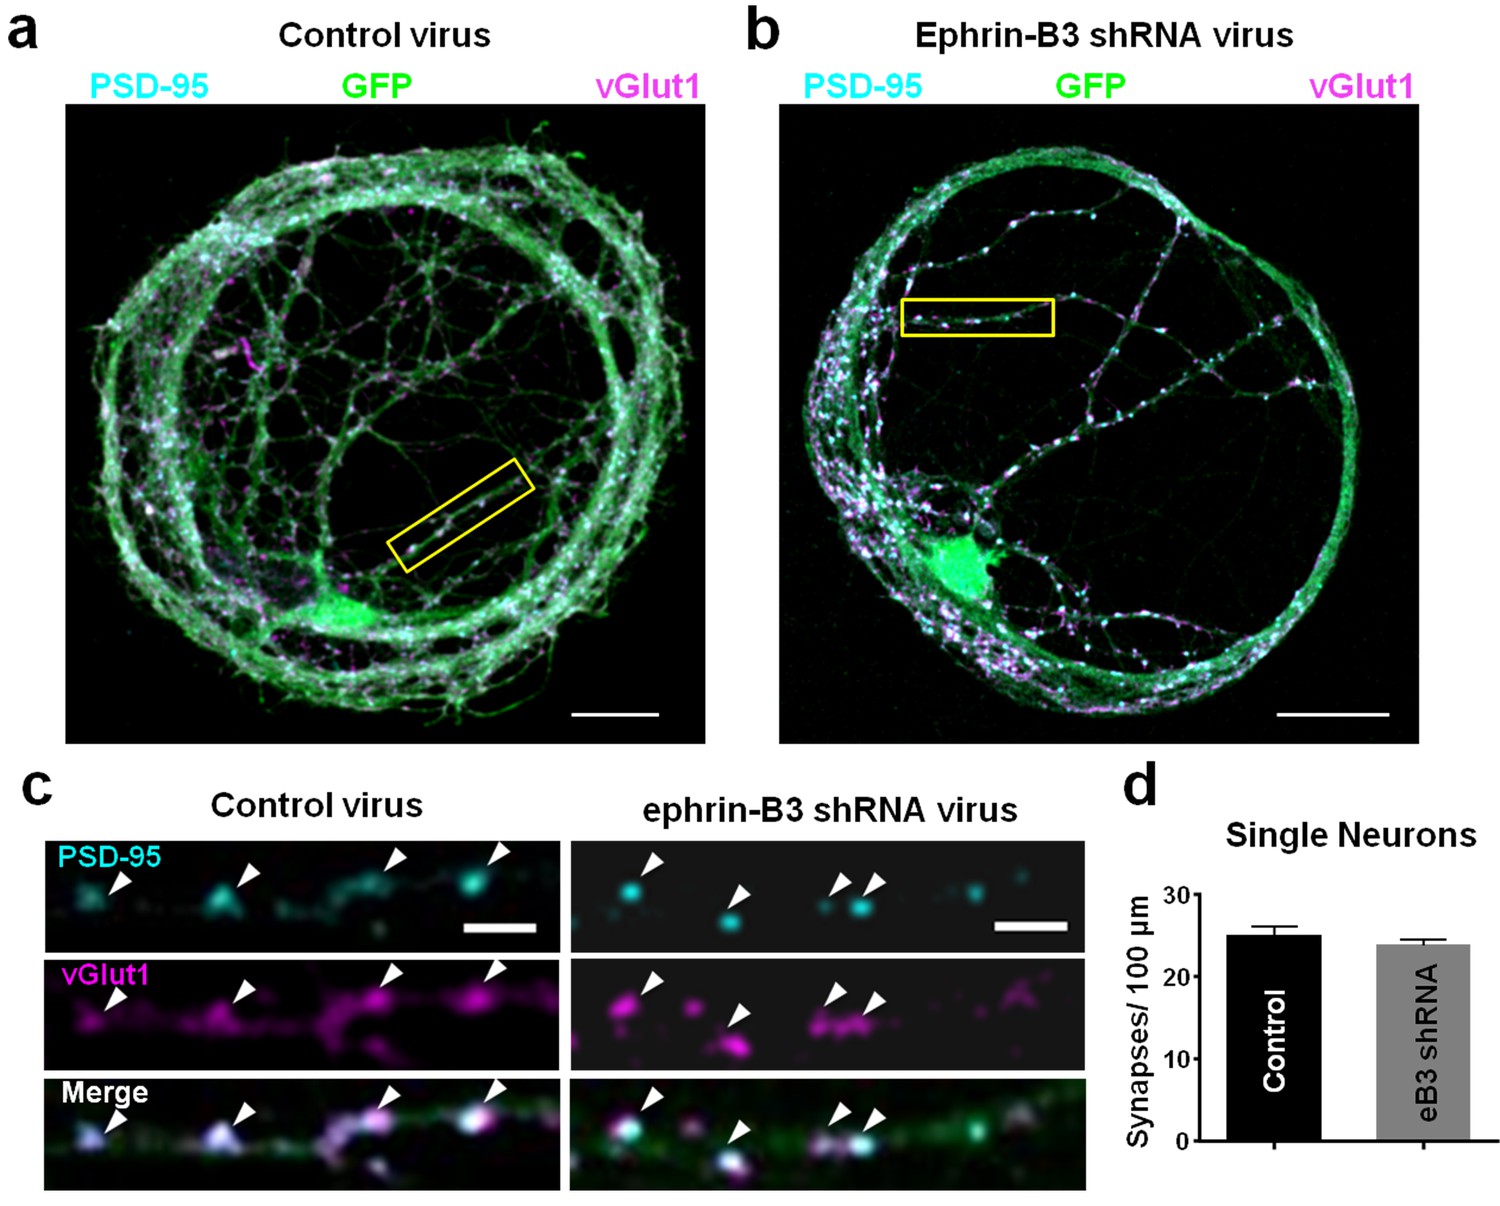
Knockdown of ephrin-B3 does not alter synapse density in single-neuron microislands.
(a and b) Representative images of dendrites from single-neuron microislands transduced with control (pSuper) and eB3 shRNA viruses and immunostained at DIV21 for vGlut1 and PSD-95. Scale bar, 20 μm. (c) Higher magnification images of boxed regions shown in a and b. Arrowheads indicate colocalized vGlut1 and PSD-95 puncta. Scale bar, 5 μm. (d) Quantification of synapse density in single neuron microislands (Control, n=27; eB3 shRNA, n=47; t(72)=0.9390, p=0.3509, two-tailed Student’s t-test) transduced with the indicated viruses.
-
Figure 1—source data 1
Knockdown of ephrin-B3 does not alter synapse density in single-neuron microislands.
- https://doi.org/10.7554/eLife.41563.003
Figure 1—figure supplement 1
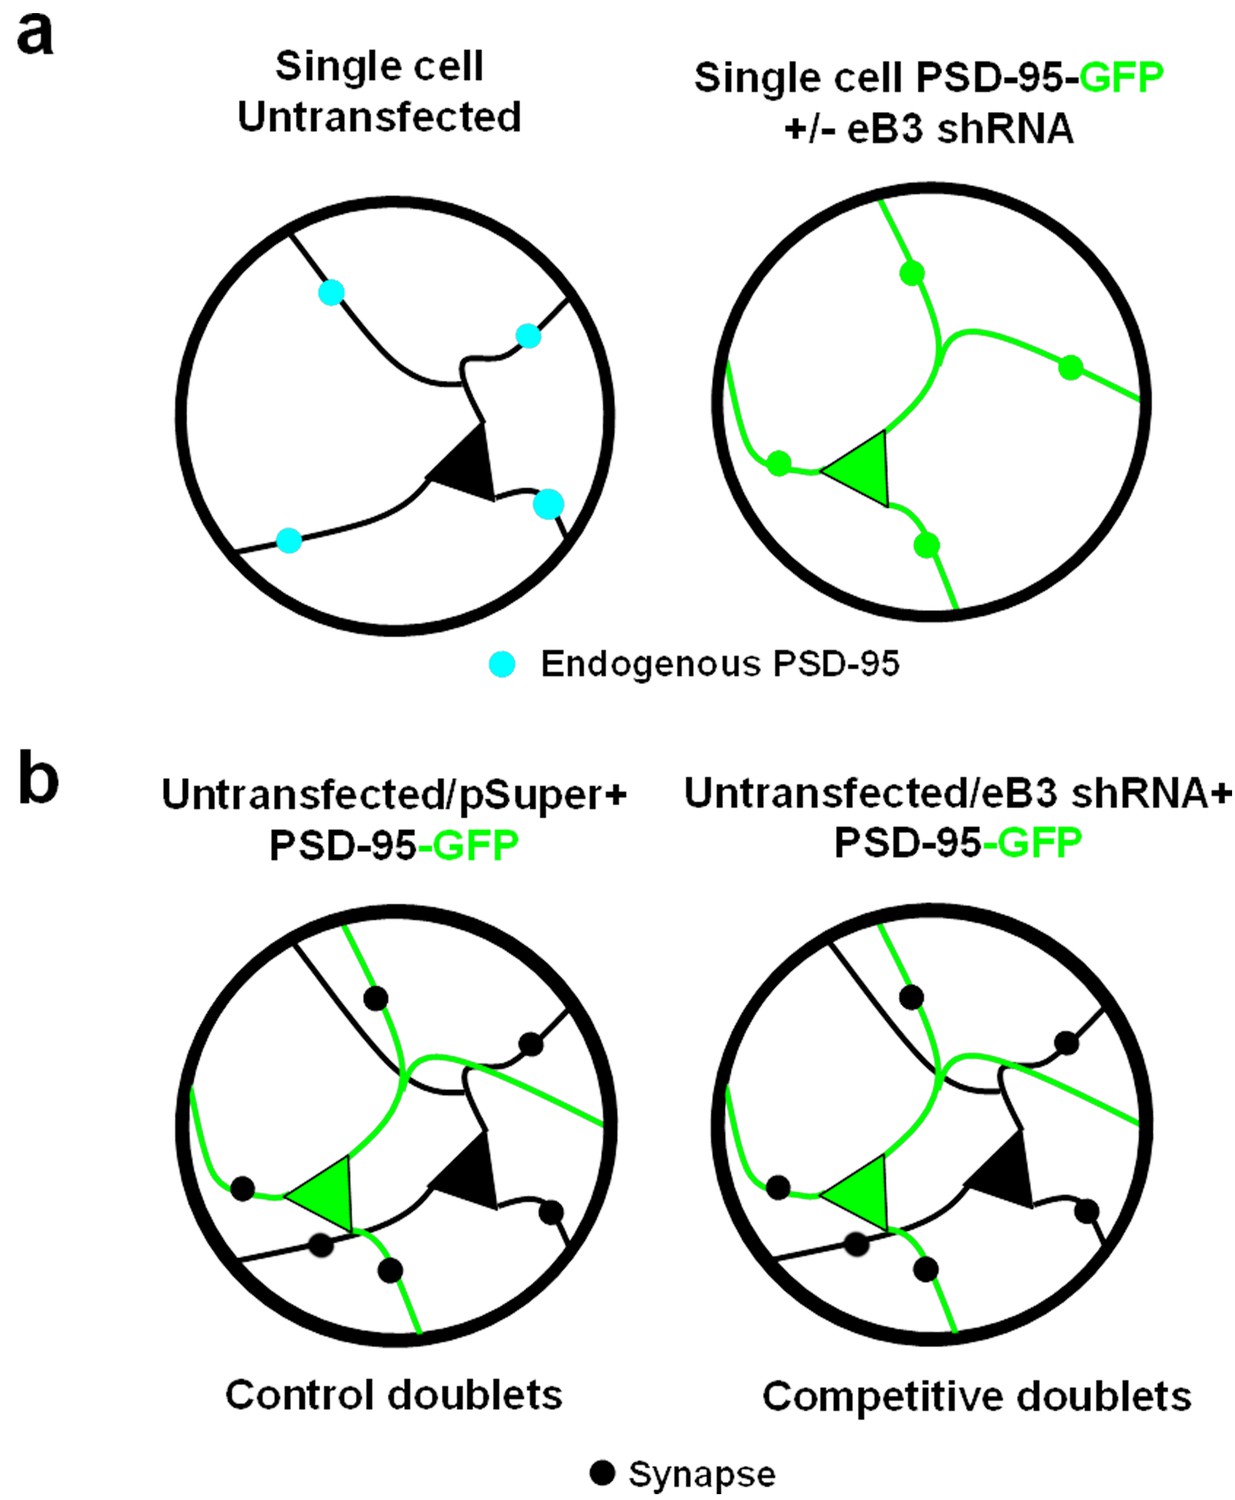
Schematic of microisland experimental design.
(a) Single-neuron microislands provide a system devoid of potential competitive interactions. Blue dots represent endogenous PSD-95, green dots represent PSD-95-GFP (b) Two-neurons microislands allow for an assessment of direct competition for synapses between individual neurons. Black dots represent synapses.
Figure 2
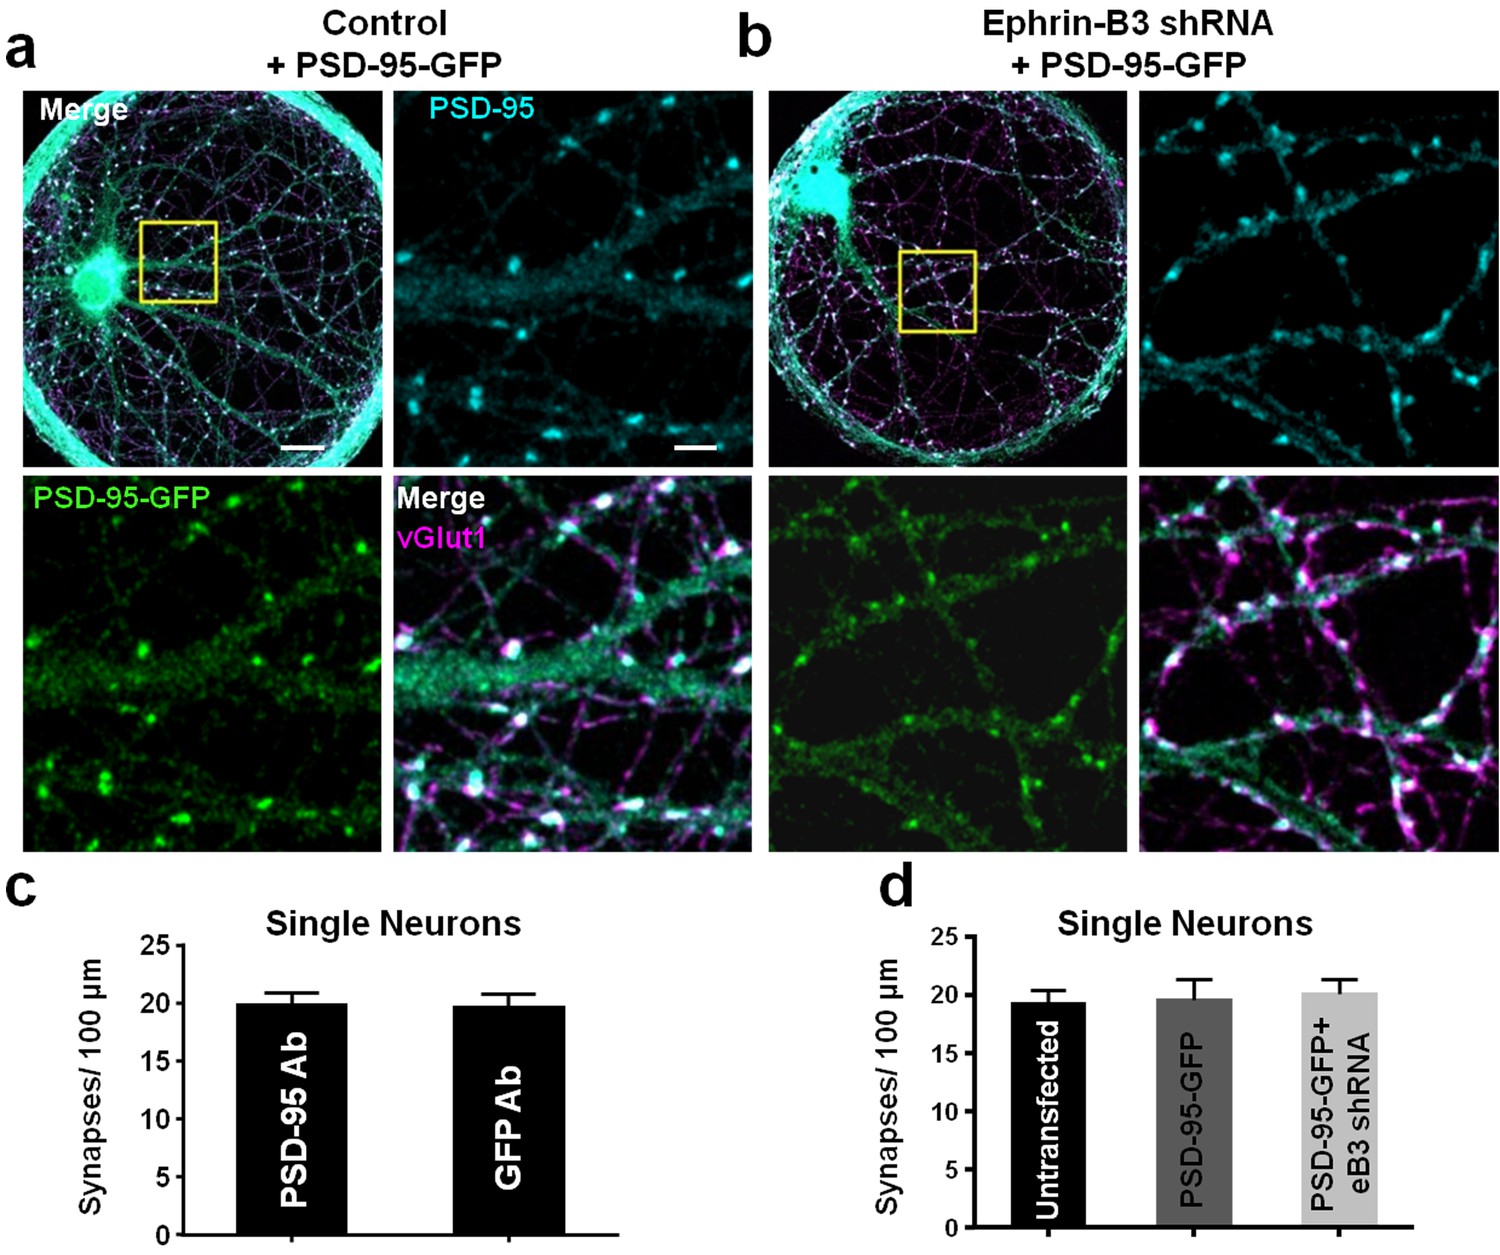
PSD-95-GFP localizes to synapses and does not alter synapse density.
(a and b) Representative images of single-neuron microislands transfected with the indicated constructs and immunostained for GFP (for PSD-95-GFP), PSD-95 and vGlut1. Boxed regions are shown in enlarged insets. Scale bars represent 20 μm in merged images and 5 μm in insets. (c) Comparison of synapse density quantification in single neuron microislands using PSD-95 or GFP immunostaining for PSD-95-GFP (n = 18 cells; t(34)=0.08148, p=0.9355, two-tailed Student’s t-test). (d) Quantification of synapse density in single neurons transfected with the indicated constructs using PSD-95 and vGlut1 immunostaining (Untransfected, n = 20; PSD-95-GFP, n = 18; PSD-95-GFP + eB3 shRNA, n = 18; F(2,53)=.1008, p=0.9043, one-way ANOVA).
-
Figure 2—source data 1
PSD-95-GFP localizes to synapses and does not alter synapse density.
- https://doi.org/10.7554/eLife.41563.006
Figure 3

Synapse density is regulated by an ephrin-B3-dependent competitive mechanism.
(a) Representative images of control and competitive doublets. Neurons were immunostained for vGlut1, PSD-95 and GFP (for PSD-95-GFP) at DIV21. Arrows indicate untransfected (white arrow) and transfected (green arrow) neurons. Scale bar, 20 μm. (b) Higher magnification images of the boxed regions shown in a. Arrowheads indicate examples of colocalized puncta. Scale bar, 5 μm. (c and d) Scatter plots in which the x and y coordinates of each point respectively represent synapse density in transfected and untransfected neurons within a doublet pair. The red point in each graph represents the average of all data points. (e) Quantification of the fraction of total synapse density on neurons within control and competitive doublets (control doublets, n=25 for untransfected and PSD-95-GFP cells; competitive doublets, n=53 for untransfected and eB3 shRNA cells; F(3,152)=23.12, p<0.0001, one-way ANOVA *P<0.05,****P<0.0001 Tukey’s post hoc. (f) Quantification of total synapse density in doublets (control doublets, n=25; competitive doublets n=53; t(76)=.01448, p=0.9882, two-tailed Student’s t-test). (g) Schematic of the microisland doublet experiment. Black and green neurons indicate untransfected and transfected neurons, respectively. Synapses are represented as black dots.
-
Figure 3—source data 1
Synapse density is regulated by a competitive mechanism.
- https://doi.org/10.7554/eLife.41563.008
Figure 4 with 2 supplements

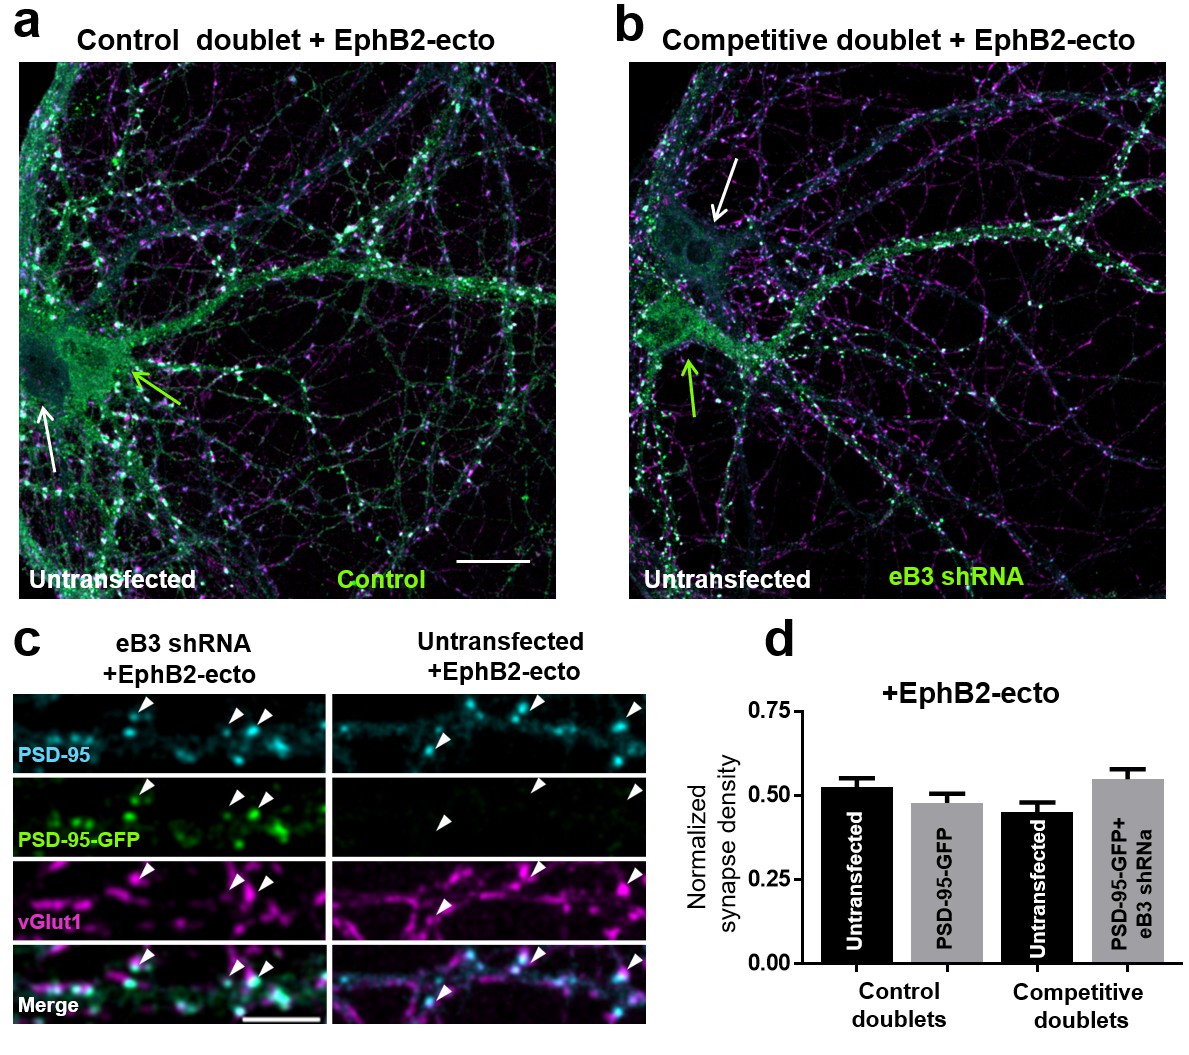
Effects of ephrin-B3 knockdown are rescued by unclustered EphB2 ectodomain treatment.
(a) DIV10 cortical neurons transfected with the indicated constructs along with GFP and treated with unclustered EphB2 ectodomain (EphB2-ecto). Arrowheads indicate colocalized PSD-95 (red) and VGlut1 (blue) puncta along GFP-labeled dendrite. (b) Quantification of colocalized PSD-95 and VGlut1 puncta density (Control/ctrl, n = 22; ctrl/B2-Fc 250 ng n = 19; eB3 shRNA/ctrl, n = 38; eB3 shRNA/B2-Fc 2.5 ng, n = 25; eB3 shRNA/B2-Fc 25, ng n = 22; eB3 shRNA/B2-Fc 250 ng, n = 26; F (5,146)=8.454, p<0.0001, one-way ANOVA, **p<0.01 (c) Model of the effect of unclustered EphB2 ectodomain treatment on adjacent neurons within complex cultures. Black dots represent synapses.
-
Figure 4—source data 1
Effects of ephrin-B3 knockdown are rescued byEphB2 ectodomain.
- https://doi.org/10.7554/eLife.41563.010
Figure 4—figure supplement 1
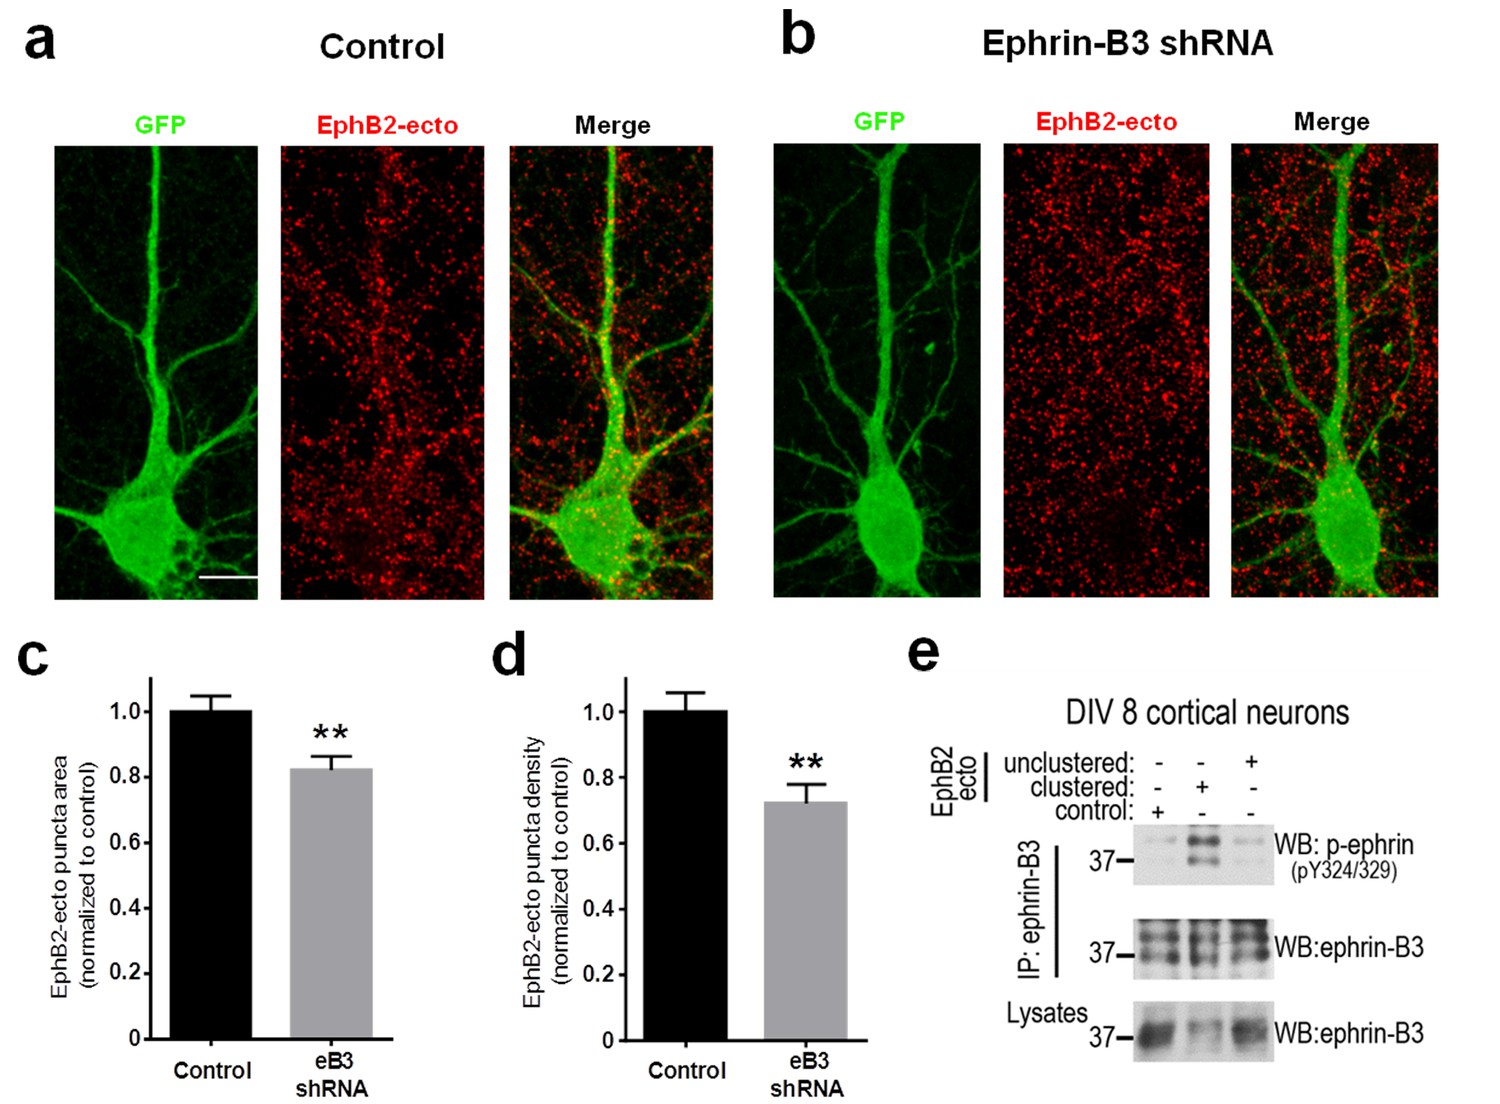
Validation of unclustered EphB2 ectodomain treatment method.
(a and b) Representative images of DIV10 cortical neurons transfected with GFP and either pSuper control vector (control) or eB3 shRNA and treated with 500 ng/ul (250 ng/well) EphB2 ectodomain (EphB2-ecto). Neurons were stained for GFP (green) and EphB2 ectodomain (red). Scale bar, 10 μm. (c) Quantification of EphB2 puncta density normalized to control neurons within each experiment (Control, n = 26; eB3 shRNA, 28; t(52)=3.26, **p=0.002, two-tailed Student’s t-test). (d) Quantification of EphB2 puncta area normalized to control neurons within each experiment (Control, n = 26; eB3 shRNA, 28; t(52)=2.887, **p=0.0056, two-tailed Student’s t-test). (e) Representative western blots of DIV8 neuronal lysates treated with either clustered or unclustered EphB2 ectodomain. Treatment of neurons with the unclustered form of EphB2 ectodomain did not activate ephrin-B3 as shown by probing the immunoprecipitates (ephrin-B3 IP) with an antibody specific to tyrosine-phosphorylated (activated) ephrin-Bs.
-
Figure 4—figure supplement 1—source data 1
Validation of EphB2 ectodomain treatment method.
- https://doi.org/10.7554/eLife.41563.012
Figure 4—figure supplement 2
Unclustered EphB2 ectodomain blocks competition in microislands.
(a and b) Representative images of control (a) and competitive (b) doublets treated with 500 ng/ml (250 ng/well) of unclustered EphB2 ectodomain. Scale bar, 20 μm. (c) Higher magnification images of dendrites in a competitive microisland treated with EphB2 ectodomain. Scale bar, 5 μm. (d) Quantification of the fraction of total synapse density on neurons within control and competitive doublets treated with EphB2 ectodomain (Control doublets, n = 7 for untransfected and PSD-95-GFP cells (one experiment); competitive doublets, n = 9 for untransfected and eB3 shRNA cells (three experiments); F(3, 28)=2.485, p=0.0813 one-way ANOVA.
-
Figure 4—figure supplement 2—source data 1
EphB2 ectodomain blocks competition in microislands.
- https://doi.org/10.7554/eLife.41563.014
Figure 5 with 2 supplements
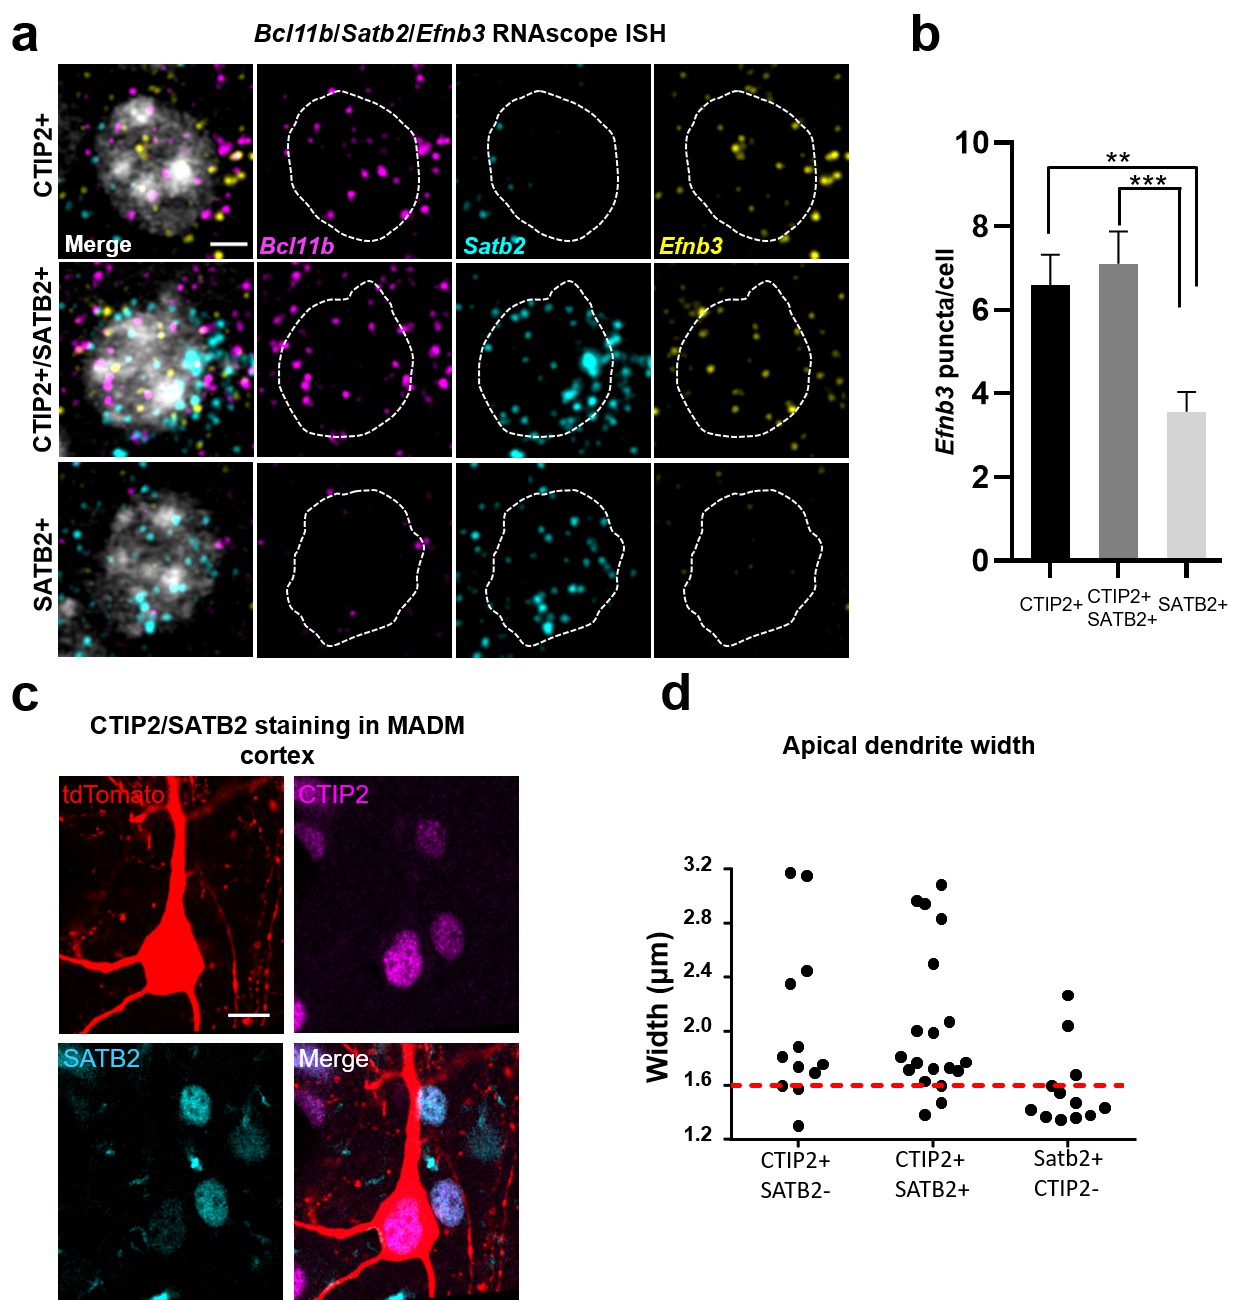
Efnb3 is expressed in CTIP2 +projection neurons.
(a) Representative cells within WT mouse cortex labeled by RNAscope ISH for CTIP2 mRNA (Bcl11b), SATB2 mRNA (Satb2), and eB3 mRNA (Efnb3). Scale bar, 3 μm. (b) Quantification of the number of RNAscope ISH eB3 puncta per cell across the indicated cell types (CTIP2+, n = 72; CTIP2+/SATB2+, n = 69; SATB2+, n = 93; F (2, 231)=9.332, p=0.0001, one-way ANOVA, ***p=0.0004, **p=0.0026 *, Tukey’s post hoc.) (c) Representative image of a tdTomato+/CTIP2 +cell in MADM cortex co-labeled with CTIP2 and SATB2 antibodies. Scale bar, 10 μm. (d) Analysis of apical dendrite width in subgranular neurons expressing CTIP2 and/or SATB2. Most neurons expressing CTIP2 have large (>1.6 μm) dendrites.
-
Figure 5—source data 1
Efnb3 is expressed in CTIP2 +projection neurons.
- https://doi.org/10.7554/eLife.41563.016
Figure 5—figure supplement 1

Schematic of recombination in eB3 MADM mice.
(a) Interchromosomal recombination in eB3 MADM mice generates fluorescently labeled cells of known eB3 genotype. Cre-mediated recombination in G2 phase followed by segregation of chromatids into daughter cells generates a wild-type (tdTomato+) and an eB3 null (EGFP+) cell (G2-X segregation), or one unlabeled and one double-labeled cell with unaltered genotype (G2-Z segregation). Recombination in G1 or G0 phase results in a double-labeled cell with unaltered genotype. Adapted from Espinosa et al., 2009.
Figure 5—figure supplement 2
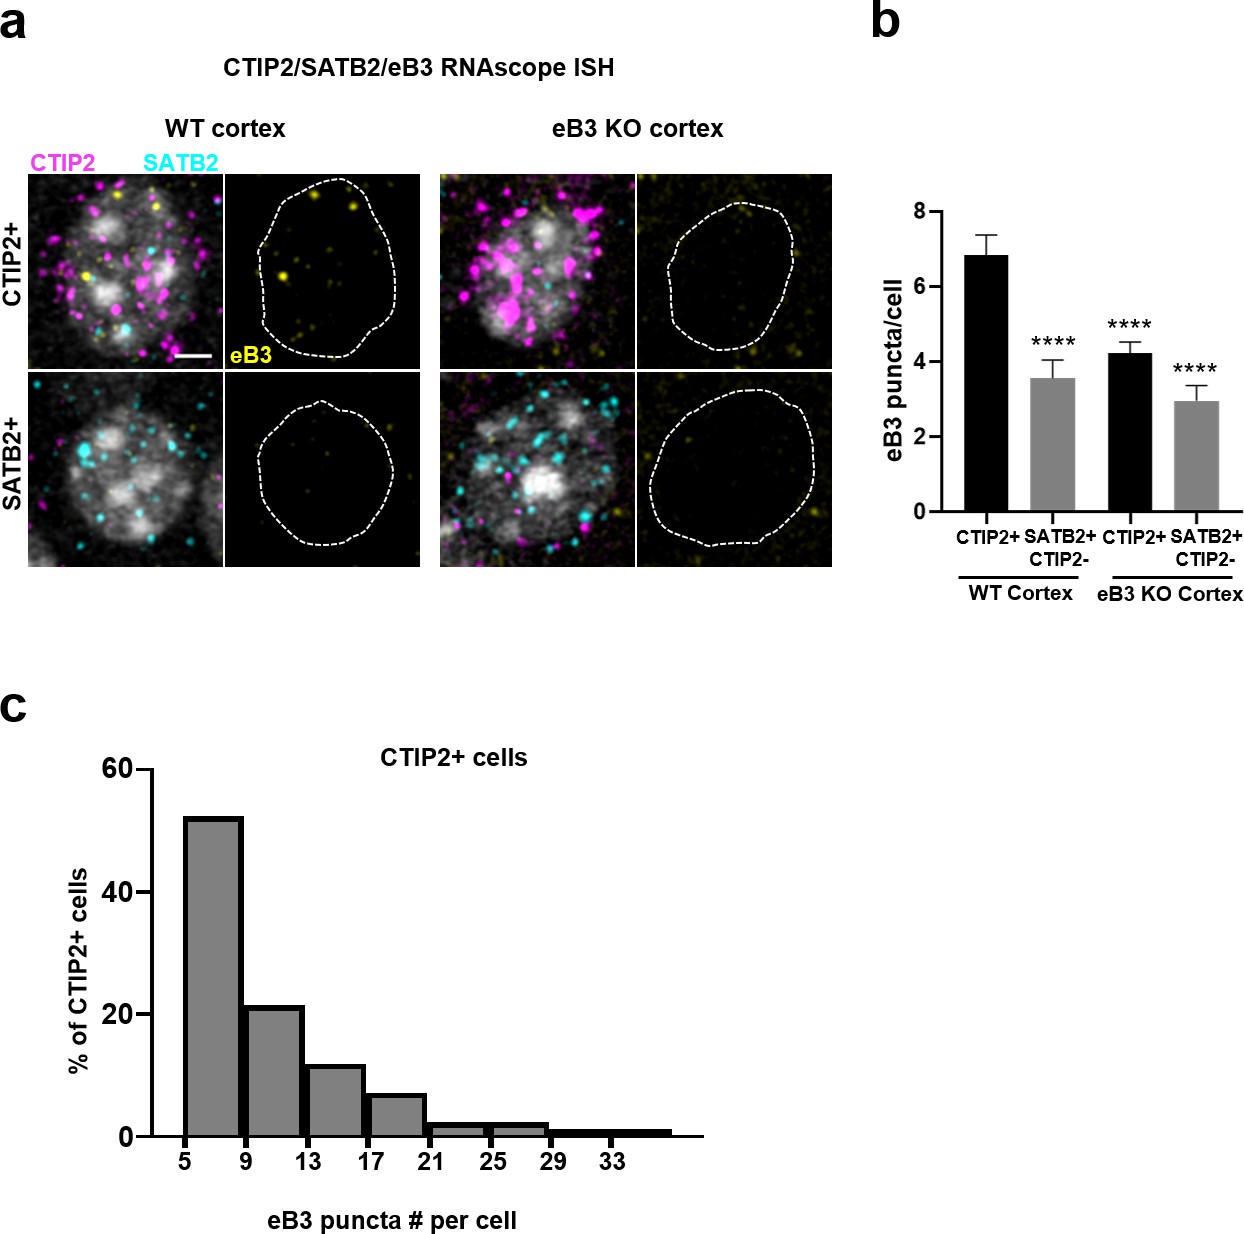
Controls for RNAscope ISH.
(a) Representative three color RNAscope ISH images from WT and Efnb3-/- mouse cortex, showing reduced eB3 probe signal in CTIP2 + cells (CTIP2 + and CTIP2+/SATB2 + included) within Efnb3-/- cortex. Scale bar, 3 µm. (b) Quantification of Efnb3 expression in the indicated cell types in WT and Efnb3-/- cortex (WT CTIP2+, n = 141; WT SATB2+, n = 93; KO CTIP2+, n = 236; KO SATB2+, n = 86 F (3, 552)=14.39, p<0.0001, one-way ANOVA, ****p<0.0001, Tukey’s post hoc). (c) Distribution of Efnb3 puncta numbers in CTIP2 + cells (N = 84, bin size = 4). Cells with less than five puncta were excluded.
-
Figure 5—figure supplement 2—source data 1
Controls for RNAscope ISH.
- https://doi.org/10.7554/eLife.41563.020
Figure 6 with 1 supplement
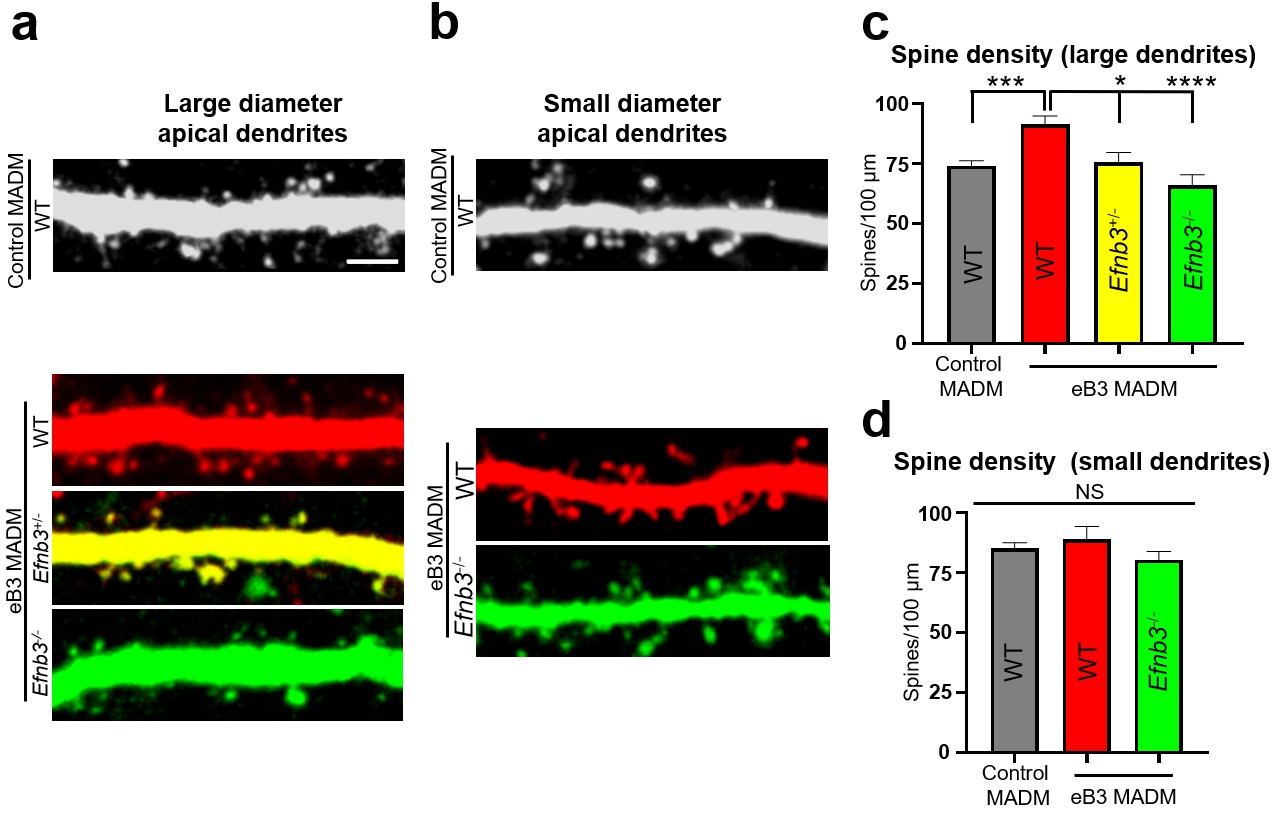
Relative levels of ephrin-B3 control spine density in vivo.
(a) Representative large diameter (>1.6 μm) dendrites of subgranular pyramidal neurons in control and eB3 Nestin-spCre MADM mice. Scale bar, 3 μm. (b) Representative small diameter (<1.6 μm) dendrites of subgranular pyramidal neurons in control and eB3 Nestin-spCreMADM mice. (c) Quantification of spine density on large diameter dendrites from neurons in control and eB3 MADM mice (control MADM (WT), n=93; eB3 MADM tdTomato+ (WT), n=50; eB3 MADM tdTomato+/EGFP+ (Efnb3+/-), n=24; eB3 MADM EGFP+ (Efnb3-/-), n= 38; F(3, 201)= 10.40, p<0.0001, one-way ANOVA, ****p<0.0001, ***p=0.0011 *p<0.05, Tukey’s post hoc.) (d) Quantification of spine density on small diameter dendrites from neurons in control and eB3 MADM mice (control MADM, n=48; eB3 MADM TdTomato+ (WT), n=19; eB3 MADM EGFP+ (Efnb3-/-), n= 33; F(2, 97)= 1.283, p=0.2818, one-way ANOVA).
-
Figure 6—source data 1
Relative levels of ephrin-B3 control spine density in vivo.
- https://doi.org/10.7554/eLife.41563.022
Figure 6—figure supplement 1
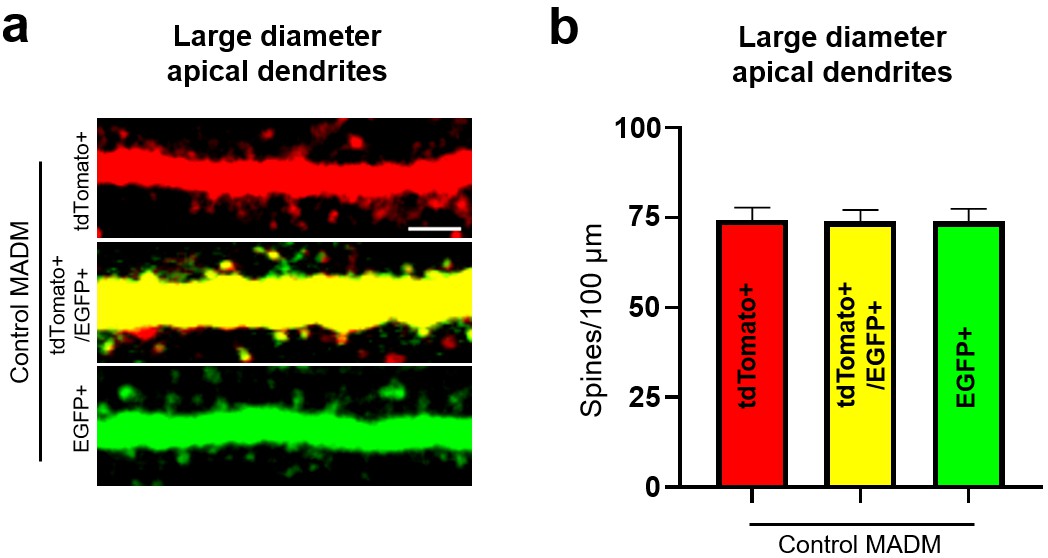
Equal spine density in control MADM neurons regardless of fluorophore expressed.
(a) Representative large diameter (>1.6 μm) dendrites of subgranular pyramidal neurons in control Nestin-spCre MADM mice. Scale bar, 3 μm. (b) Quantification of spine density on large diameter dendrites from neurons in control MADM mice (tdTomato + neurons, n = 38 neurons, five animals; EGFP + neurons, five animals n = 39; tdTomato+/EGFP + neurons, n = 16, two animals; F(2, 90)=0.003162, p=0.9968, one-way ANOVA).
-
Figure 6—figure supplement 1—source data 1
Spine density WT MADM neurons.
- https://doi.org/10.7554/eLife.41563.024
Figure 7

Use of ephrin-B3 MADM mice to generate heterogenotypic cultures.
(a) Representative image of eB3 MADM (Emx1-Cre line) cortex containing sparse EGFP +and/or tdTomato +expressing cells. Scale bar, 100 μm. (b) Workflow diagram for generating eB3 MADM cultures. (c) Representative image of a control eB3 MADM culture. Scale bar, 300 μm. (d) Representative single image field and processed image mask used for synapse density analysis. Scale bar, 15 μm.
Figure 8

Ephrin-B3 regulates local cell-cell differences in synapse density in MADM cultures.
(a and b) Representative image fields and corresponding masks used for analysis from control (a) and heterogenotypic (b) DIV11 MADM cultures. Scale bar, 20 μm. (c and d) Scatter plots in which each point represents the density of vGlut1+ synapses contacting tdTomato+ (y axis) and EGFP+ (x axis) neurons in a single image field. The red point in each graph represents the average of all data points. The proportion of fields in which tdTomato+ neurons received a higher fraction of local synaptic contacts than EGFP+ neurons is significantly higher in heterogenotypic cultures than control cultures (control, n= 218 fields; heterogenotypic, n=108 fields; p=0.0216, Fisher’s exact test).
-
Figure 8—source data 1
Ephrin-B3 regulates local cell-cell differences in synapse density in MADM cultures.
- https://doi.org/10.7554/eLife.41563.027
Figure 9
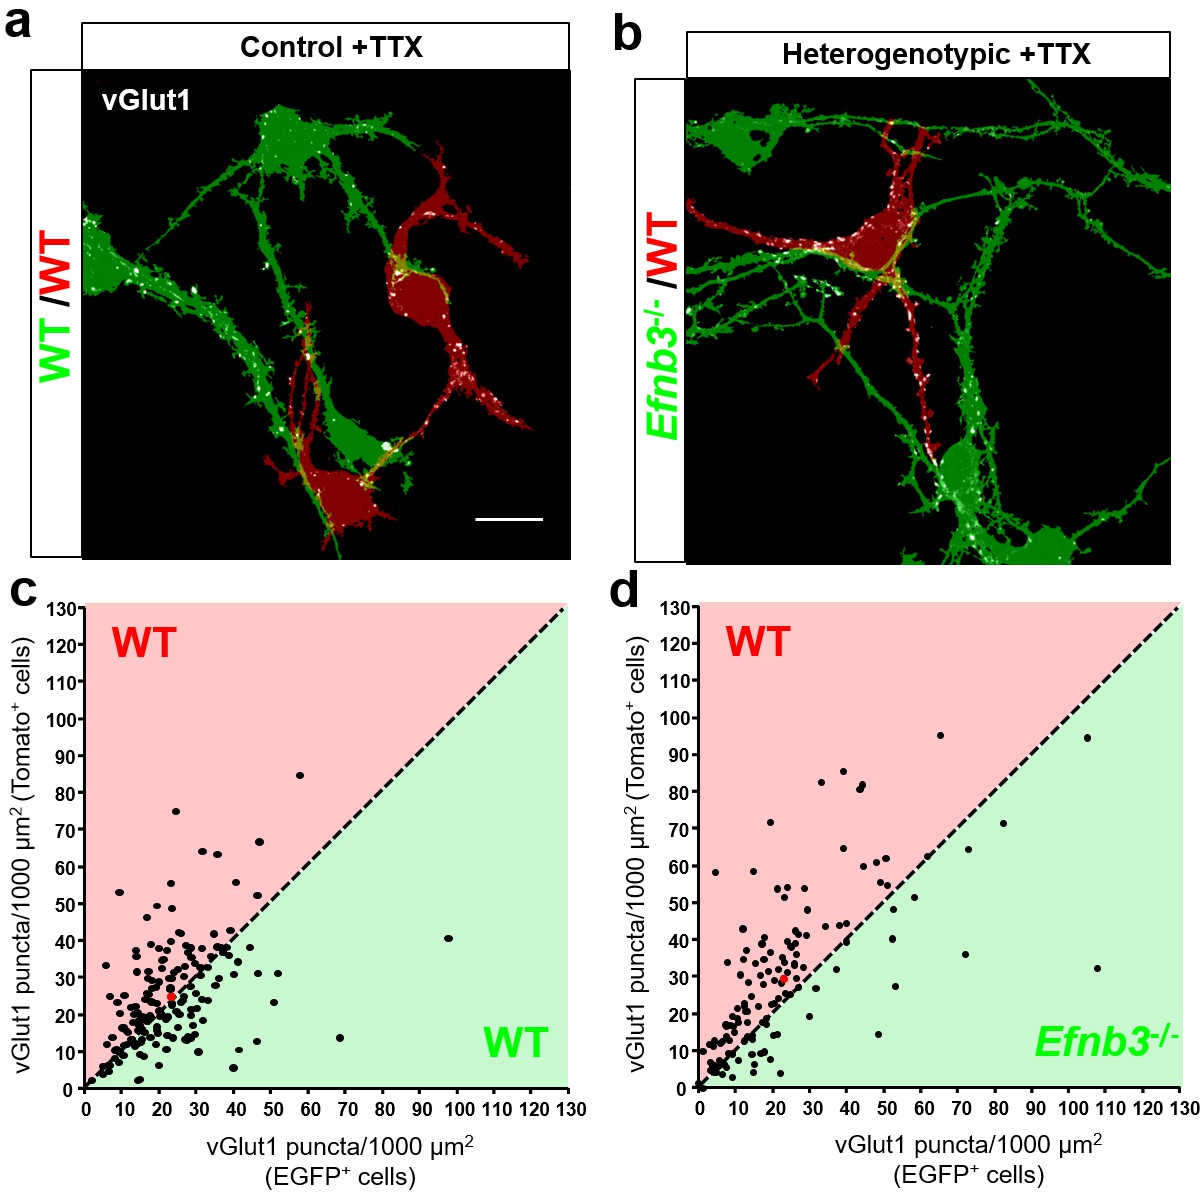
Control of synapse number by ephrin-B3 does not require activity.
(a and b) Representative image fields and corresponding masks used for analysis from control (a) and heterogenotypic (b) DIV11 MADM cultures treated with TTX (1 μm) from DIV3-11. Scale bar, 20 μm. (c and d) Scatter plots in which each point represents the density of vGlut1 + synapses contacting tdTomato+ (y axis) and EGFP+ (x axis) neurons in a single image field. The red point in each graph represents the average of all data points. The proportion of fields in which tdTomato + neurons received a higher fraction of local synaptic contacts than EGFP + neurons is significantly higher in heterogenotypic cultures than control cultures (control, n = 166 fields; heterogenotypic, n = 135 fields; p=0.0036, Fisher’s exact test).
-
Figure 9—source data 1
Control of synapse number by ephrin-B3 does not require activity.
- https://doi.org/10.7554/eLife.41563.029
Tables
Key resources table
| Reagent type (species) or resource | Designation | Source or reference | Identifiers | Additional information |
|---|---|---|---|---|
| Genetic reagent (Mus musculus) | ephrin-B3 knockout (and WT littermates) | Yokoyama et al., 2001, Hruska et al., 2015, Antion et al., 2010. | RRID:MGI:3026744 | |
| Genetic reagent (M. musculus) | MADM-11 TG, eB3+/MADM-11 TG, eB3- (founder line) | This paper. | Progenitor: MADM-11 TG/TG (Hippenmeyer et al., 2010), RRID: IMSR_JAX:013749 | |
| Genetic reagent (M. musculus) | MADM-11 GT/GT; Emx1-Cre | Hippenmeyer et al., 2010, Beattie et al., 2017. | Progenitor: IMSR_JAX:005628 | |
| Genetic reagent (M. musculus) | MADM-11 GT/GT; Nestin-spCre | Hippenmeyer et al., 2010. | ||
| Strain, strain background (Rattus norvegicus domesticus) | Long Evans Rat | Charles River | Strain code: 006: RRID:RGD_2308852 | |
| Aantibody | Rabbit polyclonal anti-GFP | Thermo Fisher Scientific | A6455, RRID:AB_221570 | (1:2500) |
| Aantibody | Mouse monoclonal anti-PSD-95 | NeuroMab (clone 28/43) | Cat. # 75–028, RRID:AB_2292909 | (1:500) |
| Antibody | Guinea pig polyclonal anti-vGlut1 | Millipore | Cat. #AB5905, RRID:AB_2301751 | (1:5000) |
| Antibody | Rabbit polyclonal anti-RFP | Rockland antibodies | Cat. # 600-401-379, RRID:AB_2209751 | (1:500) |
| Antibody | Chicken polyclonal anti-GFP | Abcam | Cat. # ab13970, RRID:AB_300798 | (1:500) |
| Antibody | Rat monoclonal anti-CTIP2 | Abcam | Cat. # ab18465, RRID:AB_10015215 | (1:500) |
| Antibody | Mouse monoclonal anti-SATB2 | Abcam | Cat. # ab51502, RRID:AB_882455 | (1:500) |
| Antibody | Donkey polyclonal anti-rabbit Dylight 488 | Abcam | Cat. # ab96919, RRID:AB_10679362 | (1:500) |
| Antibody | Donkey polyclonal anti-chicken Dylight 488 | Jackson Immunoresearch | Cat. # ab96947, RRID:AB_10681017 | (1:500) |
| Antibody | Donkey polyclonal anti-rabbit Alexafluor 594 | Jackson Immunoresearch | Cat. # 711-585-152, RRID:AB_2340621 | (1:500) |
| Antibody | Donkey polyclonal anti-rat 647 | Jackson Immunoresearch | Cat. # 712-605-153, RRID:AB_2340694 | (1:500) |
| Antibody | Goat polyclonal anti-mouse ATTO 425 | Rockland antibodies | Cat. # 611-151-122, RRID:AB_10893217 | (1:250) |
| Antibody | Donkey polyclonal anti-guinea pig Dylight 649 | Jackson Immunoresearch | Cat. # 706-605-148, RRID:AB_2340476 | (1:500) |
| Recombinant DNA reagent | pFUGW-tdTomato_H1-eB3.2 (plasmid) | Hruska et al., 2015. | Progenitor: pFUGW (RRID:Addgene_14883); pSuper. | |
| Recombinant DNA reagent | pFUGW-tdTomato_H1-pSuper (plasmid) | Hruska et al., 2015. | Progenitor: pFUGW (RRID:Addgene_14883), pSuper. | |
| Recombinant DNA reagent | pSuper (plasmid) | Hruska et al., 2015, McClelland et al., 2010. | ||
| Recombinant DNA reagent | eB3.2 shRNA (plasmid) | Hruska et al., 2015, McClelland et al., 2010. | pSuper | |
| Recombinant DNA reagent | pFUGW (plasmid) | Hruska et al., 2015, McClelland et al., 2010. | RRID:Addgene_14883 | |
| Recombinant DNA reagent | pLL3.7 (plasmid) | Addgene | RRID:Addgene_11795 | |
| Recombinant DNA reagent | ephrin-B3 shRNA lentivirus | Penn Vector Core (University of Pennsylvania) | Progenitor: pLL3.7 vector (RRID:Addgene_11795) | |
| Peptide, recombinant protein | Recombinant human EphB2 Fc chimera | R and D systems | Cat. # 5189-B2 | |
| Peptide, recombinant protein | Recombinant Fc control fragment | R and D systems | 110-HG-100 | |
| Commercial assay or kit | RNAscope fluorescent multiplex kit | Advanced Cell Diagnostics | 320850 | |
| Commercial assay or kit | RNAscope probe- Mm-Bcl11b (CTIP2) | Advanced Cell Diagnostics | Cat. # 413271-C3 | |
| Commercial assay or kit | RNAscope probe- Mm-Satb2-C2 | Advanced Cell Diagnostics | Cat. # 413261-C2 | |
| Commercial assay or kit | RNAscope probe- Mm-Efnb3 | Advanced Cell Diagnostics | Cat. # 526771 | |
| Chemical compound, drug | Tetrodotoxin (TTX) | Tocris | Cat. #1078 | |
| Software, algorithm | NIH ImageJ | McClelland et al., 2009, Hruska et al., 2015. | RRID:SCR_003070 |
Additional files
-
Transparent reporting form
- https://doi.org/10.7554/eLife.41563.030
Download links
A two-part list of links to download the article, or parts of the article, in various formats.
Downloads (link to download the article as PDF)
Open citations (links to open the citations from this article in various online reference manager services)
Cite this article (links to download the citations from this article in formats compatible with various reference manager tools)
Ephrin-B3 controls excitatory synapse density through cell-cell competition for EphBs
eLife 8:e41563.
https://doi.org/10.7554/eLife.41563


