Fish-hunting cone snail venoms are a rich source of minimized ligands of the vertebrate insulin receptor
- University of Utah School of Medicine, United States
- University of Utah, United States
- La Trobe University, Australia
- Flinders University, Australia
Figures
Figure 1 with 2 supplements

Species and insulin sequences analysed in this study.
(A) Cone snail species analyzed in this study and their collection sites in the Philippines. (B) Alignment of the A and B chains of venom insulins with insulin from human and zebrafish. Amino acid numbering for venom insulins was adapted from human insulin (shown on top of sequences). Residues in venom insulins that differ from those in Con-Ins G1 are shown in blue. The sequence logo shows conservation/variability at each position in venom insulins (generated using Geneious vs 11.1.2 software). Cysteines are shown in bold and the disulfide connectivity is depicted as connecting lines between cysteines. Post-translational modifications were identified for Con-Ins G1 and Con-Ins G3 (8) and predicted for all other insulins. Modifications are provided in their single letter code. y: y-carboxylated glutamate; O: hydroxyproline, *: C-terminal amidation. Residues of human insulin involved in binding to sites 1 and 2 of the insulin receptor are indicated by a single (site 1) or double (site 2) green rectangle below the hIns sequence (De Meyts, 2015). B chain region involved in dimerization and receptor activation in human and fish insulin and positions of residues previously suggested to compensate for the loss of this region in venom insulins are highlighted in gray. (C) The endogenous cone snail signaling insulin was sequenced from the circumoesophageal nerve ring of C. geographus (Safavi-Hemami et al., 2016). Additional disulfide bond missing in venom insulins is shown as dashed lines between cysteines. Image of C.tulipa: courtesy of Jason Biggs.
Figure 1—figure supplement 1
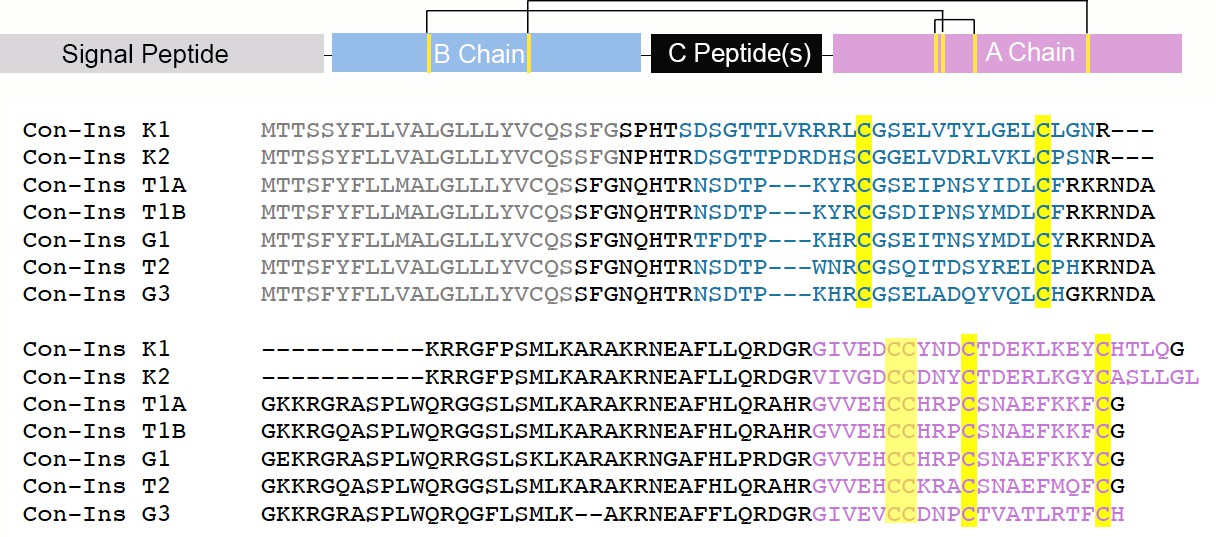
Full-length precursors sequences of venom insulins characterized in this study.
All insulins belong to the same gene family of venom-specific genes as apparent by their highly conserved N-terminal signal sequence (gray) (Safavi-Hemami et al., 2016). The predicted A and B chains are shown in pink and blue, respectively. Cysteines are highlighted in yellow. The location of the A and B chains and C-peptide(s) was predicted based on comparison with known insulin sequences and predicted protease cleavage sites. Mature Con-Ins G1 and Con-Ins G3 were previously identified in the venom of C. geographus (Safavi-Hemami et al., 2015).
Figure 1—figure supplement 2
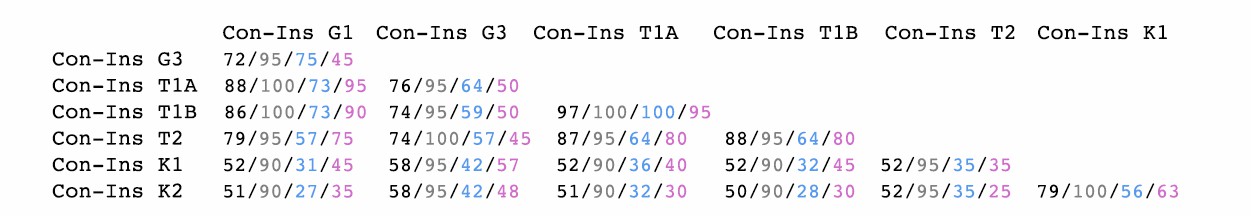
Identity matrix of venom insulins studied here.
Percentage identities are shown for the full-length precursors (black), the signal sequence (gray), the B chain (blue) and A chain (pink). Signal sequences are highly conserved while A and B chains are hypervariable in comparison.
Figure 2
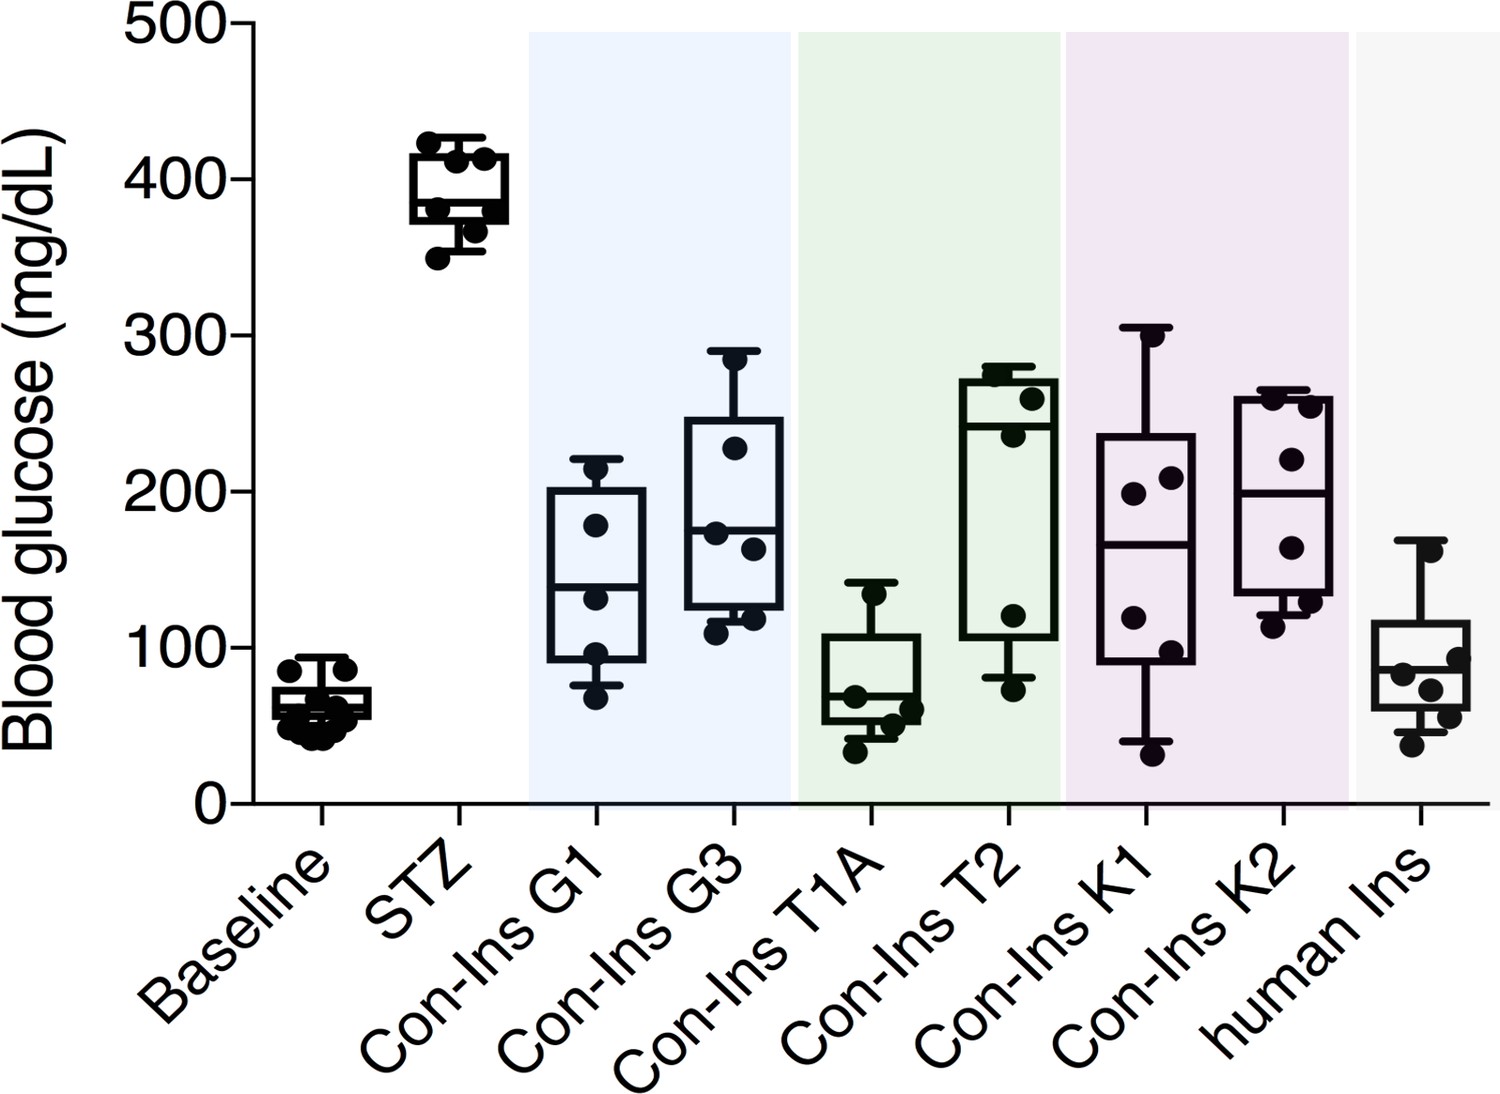
Venom insulins significantly lower blood glucose in a zebrafish model of T1D.
Insulin activity was determined using the streptozotocin (STZ)-induced model of hyperglycemia. Hyperglycemia was successfully reversed on administration of 65 ng/g of each venom insulin with most significant reduction of blood glucose observed for Con-Ins T1A (p<0.0001, n = 5). Data for human Ins (65 ng/g, n = 6) was replotted from (Safavi-Hemami et al., 2015). Data were analyzed in Graphpad Prism software (version 7.0) using unpaired t tests with Welch’s correction. Plotted data represent individual fish (black circles), median values (horizontal black bars), first and third quartile (boxes) and minimum and maximum values (error bars). Raw blood glucose values are provided in Source File 1 (Figure 2—source data 1.Zebrafish.STZ.Assay).
-
Figure 2—source data 1
Zebrafish.STZ.Assay: Data plotted in Figure 2.
- https://cdn.elifesciences.org/articles/41574/elife-41574-fig2-data1-v2.xlsx
Figure 3

Competition binding analysis to hIR-B of venom insulins (n = 2 independent measurements, each comprising three technical replicates).
Results are expressed as a percentage of binding in the absence of competing ligand (%B/B0). Plotted values represent means ± s.d. Curve fitting was performed using Prism seven using nonlinear regression (one-site) analysis. IC50 values indicate half-maximal inhibitory concentration and are provided on the right (95% confidence intervals (CI)). Plotted values are provided in Source File 2 (Figure 3—source data 1.IR-B.binding).
-
Figure 3—source data 1
IR-B.binding: Data plotted in Figure 3.
- https://cdn.elifesciences.org/articles/41574/elife-41574-fig3-data1-v2.binding.xlsx
Figure 4 with 1 supplement
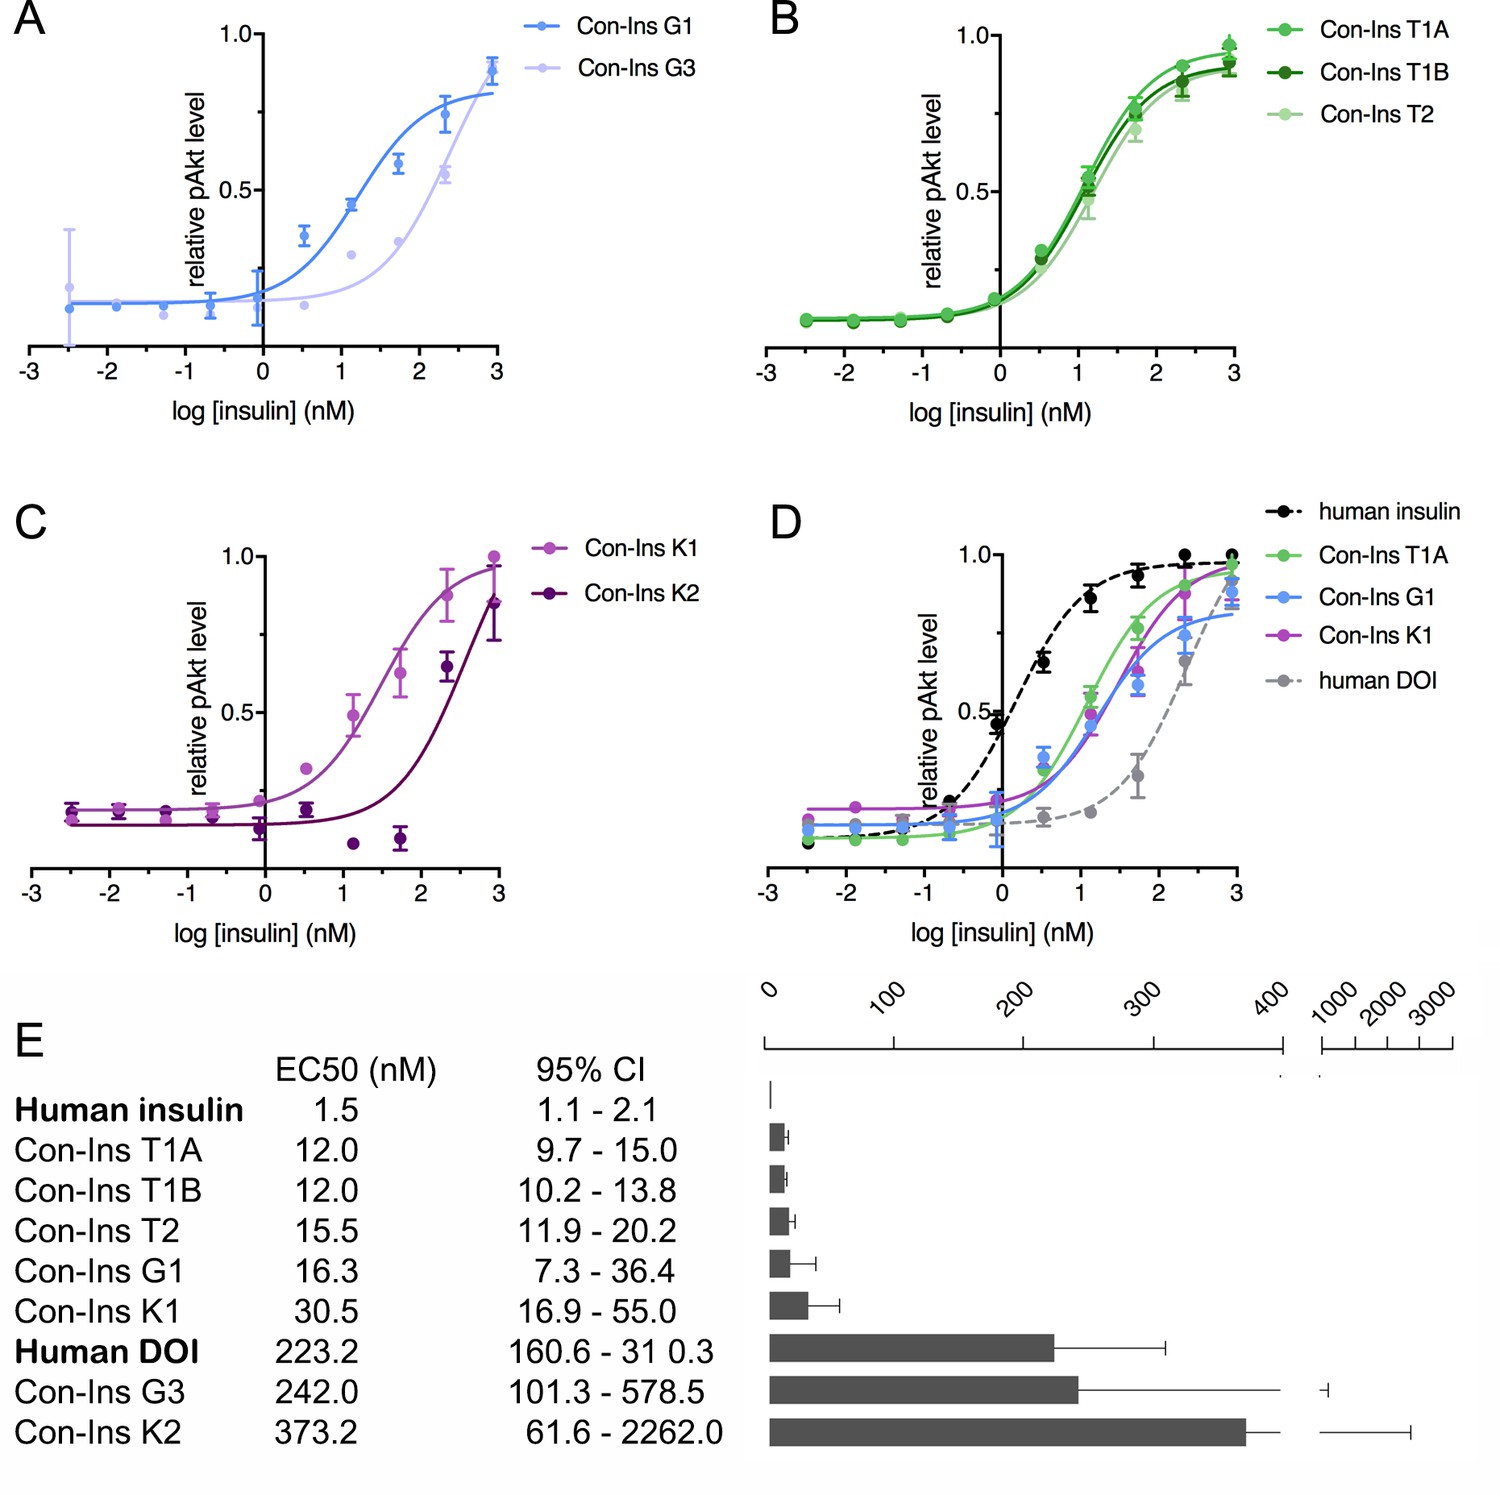
Human insulin receptor activation data.
Human insulin receptor isoform B (hIR-B) activation (Akt phosphorylation) analysis of venom insulins from (A) C. geographus, (B) C. tulipa and (C) C. kinoshitai. Plotted values represent means ± s.e.m. Curve fitting was performed using Prism seven using nonlinear regression (one-site) analysis. (D) Comparison between the most active venom insulin from each species (Con-Ins T1A, Con-Ins G1 and Con-Ins K1) to native human insulin (dotted black line) and the human des-octa peptide insulin analog (DOI). (E) EC50 (nM) values and 95% confidence intervals (CI) for all insulins tested in this study. Plotted values are provided in Source File 3 (Figure 4—source data 1.IR-B.activation).
-
Figure 4—source data 1
IR-B.activation: Data plotted in Figure 4.
- https://cdn.elifesciences.org/articles/41574/elife-41574-fig4-data1-v2.activation.xlsx
Figure 4—figure supplement 1
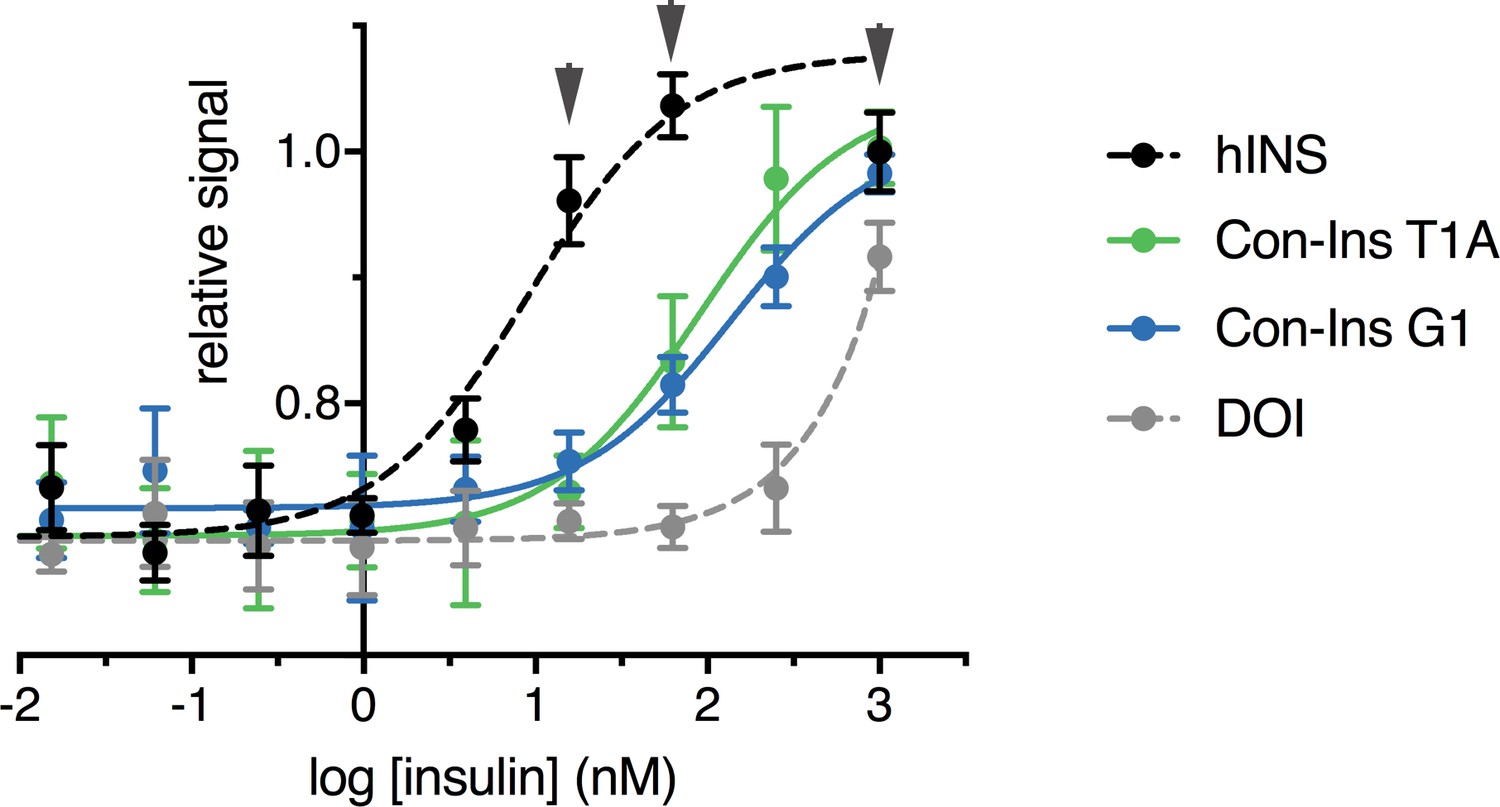
Human IR-B autophosphorylation.
Phospho-hIR-B cell-based assay measuring the endogenous levels of hIR-B only when phosphorylated at Tyr 1150/1151 when stimulated by human insulin versus Con-Ins T1A, Con-Ins G1 and hDOI in NIH 3T3 cells overexpressing the human insulin receptor (human insulin EC50 = 9.01 nM (95 % CI: 3.1–26.3 nM), Con-Ins T1A EC50 = 89.4 nM (95% CI: 40.5–197.6 nM), Con-Ins G1 EC50 = 135.5 nM (95% CI: 64.3–285.7 nM). In our hands, assay was very sensitive to ligand treatment time with an optimum incubation of 15 min (signal was very low at 20 min and variability was very high at 10 min or less). Even at 15 min signal variability eas very high and the signal for hIns plateaued at the three highest concentrations (gray arrows, 1 μM, 250 nM and 62.5 nM).
Figure 5
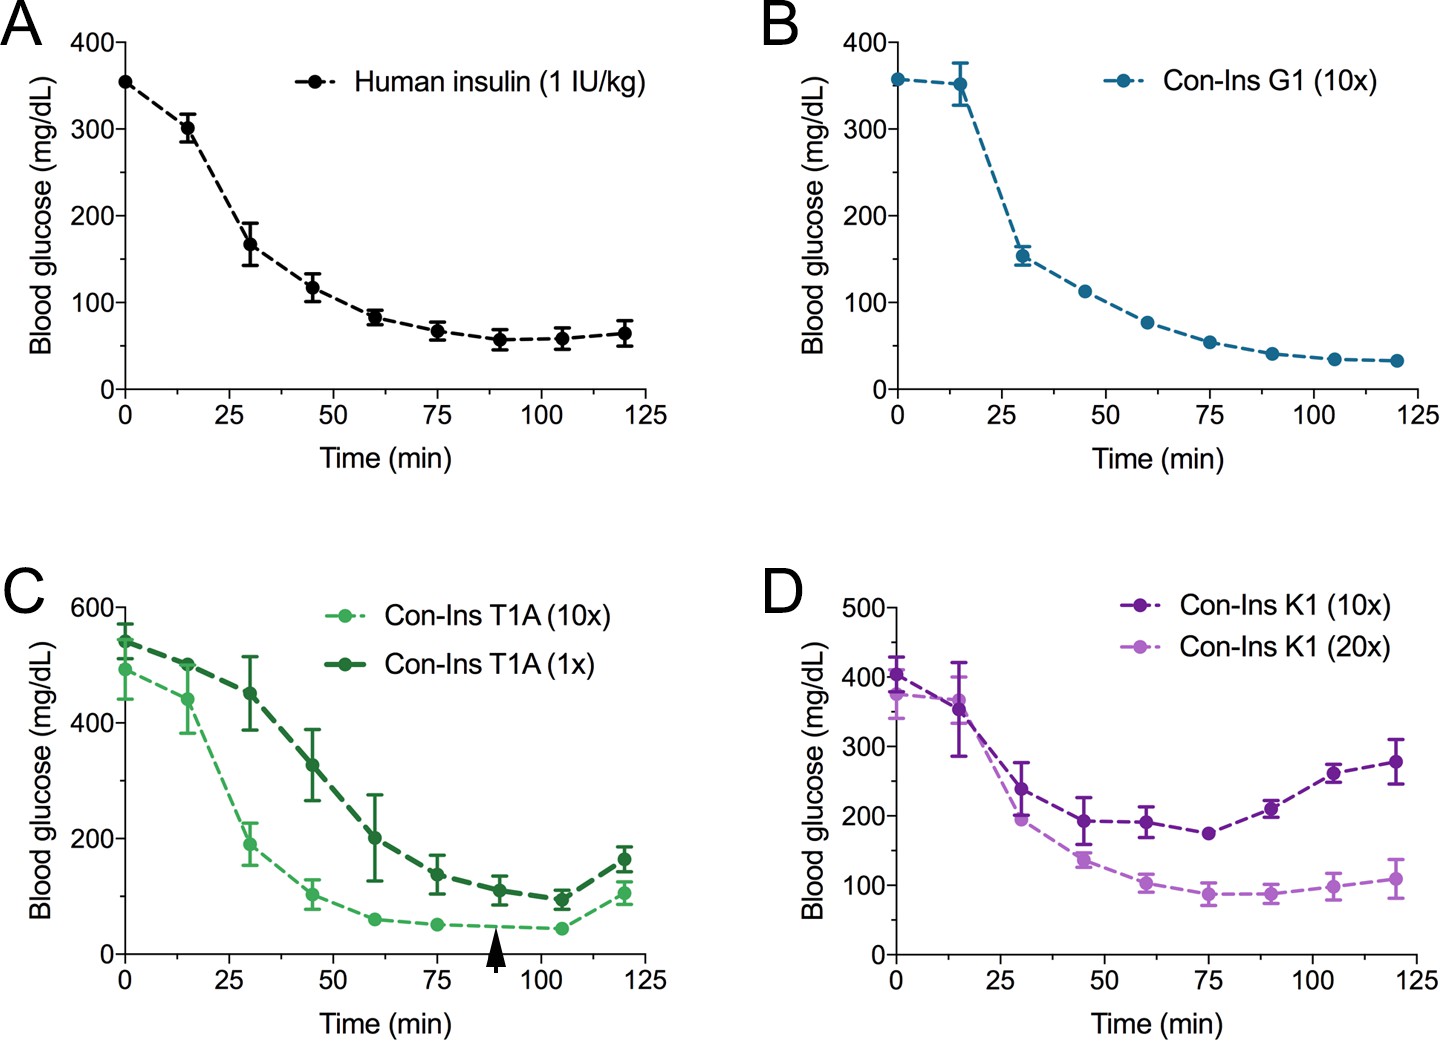
The three venom insulins Con-Ins G1, Con-Ins T1A and Con-Ins K1 lower blood glucose in a mouse model of T1D.
Insulin activity was determined using the streptozotocin (STZ)-induced model of hyperglycemia. Injection of 0.1 g/kg STZ into adult mice caused hyperglycemia as evident by a high level of blood glucose (~350–580 mg/dL) prior to insulin administration. Hyperglycemia was successfully reversed on administration of 1 unit/kg of human insulin and a 10-times equivalent of Con-Ins G1 and Con-Ins T1A. Given its high potency, mice injected with Con-Ins T1A were fed at 90 min post-injection (black arrow) and Con-Ins T1A was also administered at the same concentration as human insulin. Compared to Con-Ins G1 and Con-Ins T1A, Con-Ins K1 was less potent at 10-times and transiently reduced blood glucose from 404 (±25) mg/dL to 278 (±32) mg/dL. At 20-times Con-Ins K1 showed similar effects to human insulin at 1X. This is consistent with its lower potency at the hIR-B. Plotted data represent mean ±s.e.m (n = 3). Plotted values are provided in Source File 4 (Figure 5—source data 1Mouse.STZ.Assay).
-
Figure 5—source data 1
Mouse.STZ.Assay: Data plotted in Figure 5.
- https://cdn.elifesciences.org/articles/41574/elife-41574-fig5-data1-v2.xlsx
Figure 6
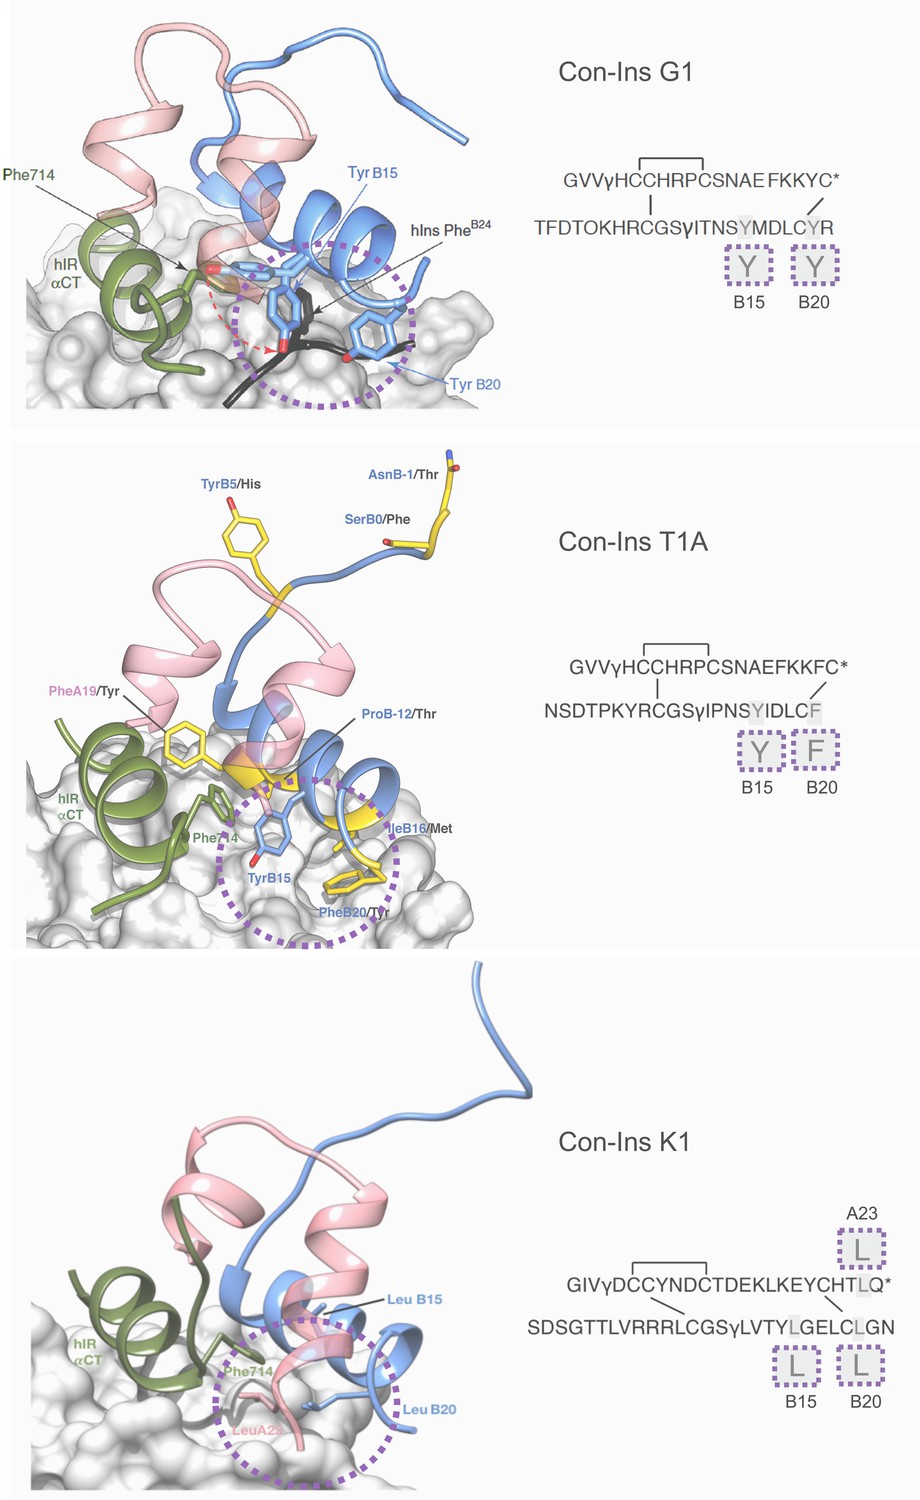
Three-dimensional molecular model of Con-Ins G1 (top panel), Con-Ins T1A (middle) and Con-Ins K1 (bottom) in the context of the primary binding site of the human insulin receptor.
A and B chains are shown in pink and blue, respectively. hIns residues B22–B27 (in their hIR-bound form) are overlaid in black in the top panel. Sequences of venom insulins are shown below models. Molecular models illustrate how the side chains of B15, B20 and A23 (shown enlarged in sequence representation below models) may act as surrogates for the absence of hIns PheB24 by interacting with αCT Phe714. Residues that differ between Con-Ins G1 and Con-Ins T1A are shown in yellow in the model of Con-Ins T1A bound to the receptor (middle panel); labelling of amino acids reflects the residues in T1A (blue) and G1 (black). Modifications are provided in their single letter code. γ: γ-carboxylated glutamate; O: hydroxyproline, *: C-terminal amidation. A chains are transparent for clarity. Top panel was adapted from Figure 3 in Menting et al., 2016 (Menting et al., 2016).
-
Figure 6—source data 1
Three-dimensional molecular model of Con-Ins T1A in the context of the primary binding site of the human insulin receptor.
- https://cdn.elifesciences.org/articles/41574/elife-41574-fig6-data1-v2.zip
-
Figure 6—source data 2
Three-dimensional molecular model of Con-Ins K1 in the context of the primary binding site of the human insulin receptor.
- https://cdn.elifesciences.org/articles/41574/elife-41574-fig6-data2-v2.zip
-
Figure 6—source data 3
.Three-dimensional model of the Con-Ins T1A monomer.
- https://cdn.elifesciences.org/articles/41574/elife-41574-fig6-data3-v2.zip
Additional files
Download links
A two-part list of links to download the article, or parts of the article, in various formats.
Downloads (link to download the article as PDF)
Open citations (links to open the citations from this article in various online reference manager services)
Cite this article (links to download the citations from this article in formats compatible with various reference manager tools)
Fish-hunting cone snail venoms are a rich source of minimized ligands of the vertebrate insulin receptor
eLife 8:e41574.
https://doi.org/10.7554/eLife.41574


