Alcoholism gender differences in brain responsivity to emotional stimuli
- VA Healthcare System, United States
- Boston University School of Medicine, United States
- Massachusetts General Hospital, United States
- Sawyer Scientific, LLC, United States
- San Diego State University, United States
- Dartmouth College, United States
Figures
Figure 1 with 1 supplement
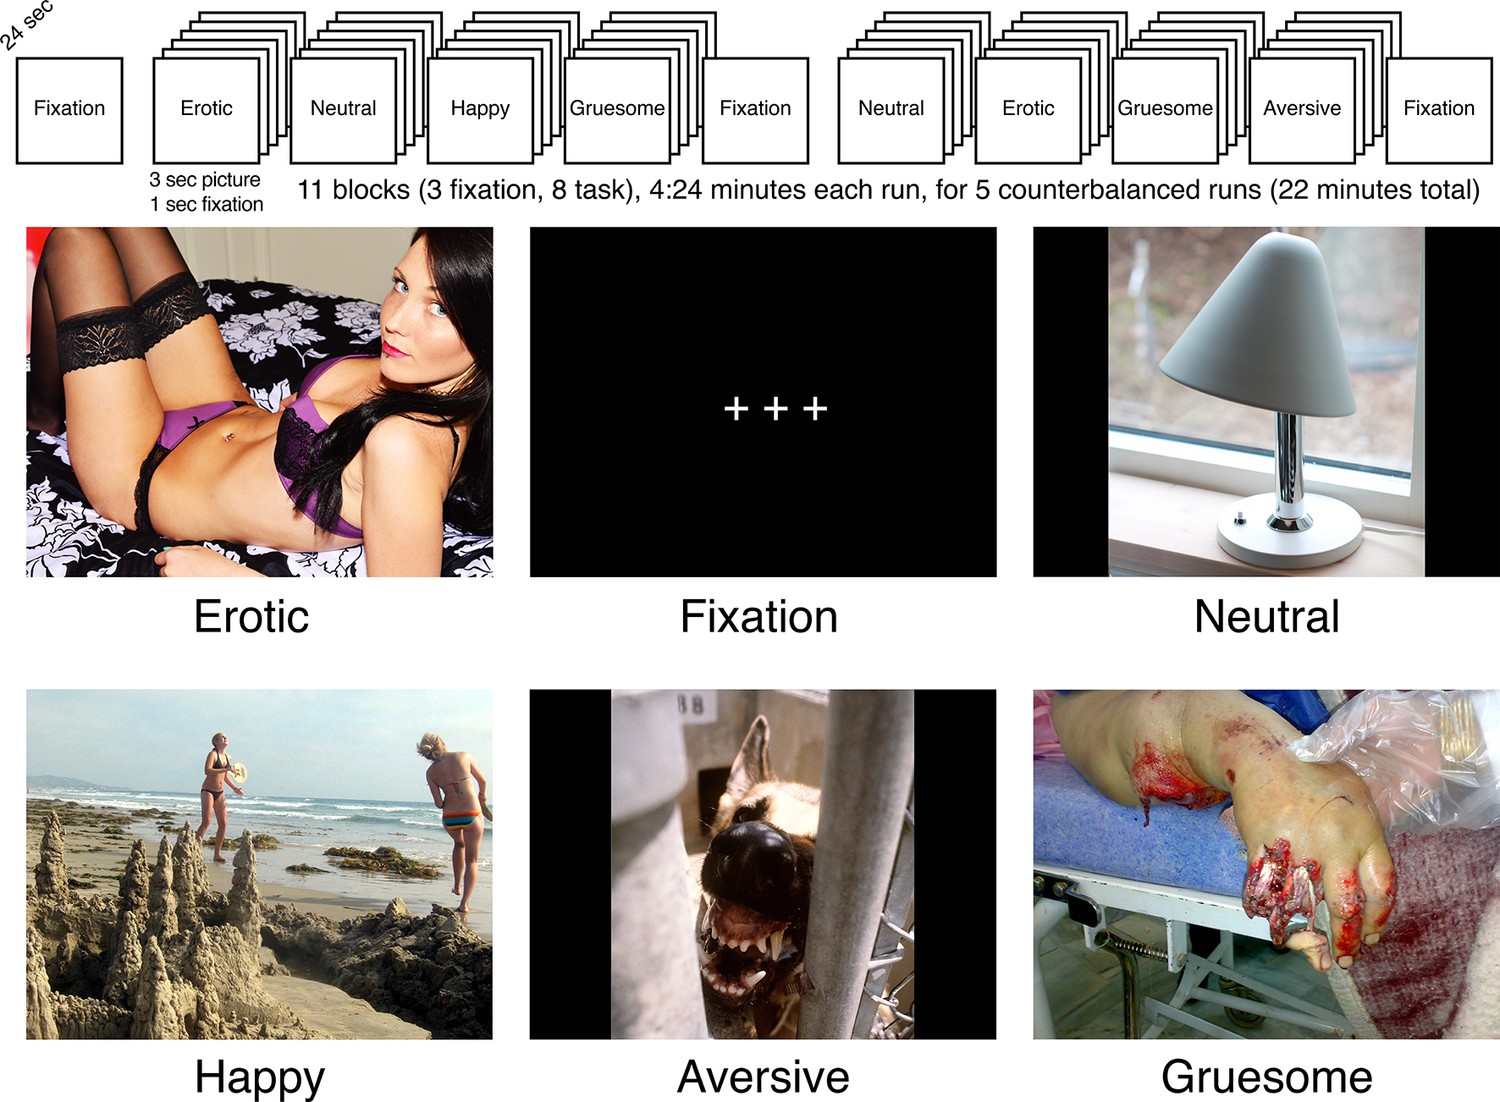
Schematic of task presentation, and examples of stimuli.
As described in the text, participants were shown pictures from the International Affective Picture System (Lang et al., 1988) and asked to report how the pictures made them feel (good, bad, or neutral). Note the pictures in this figure are not the exact pictures shown to participants from the International Affective Picture System as these are not to be made available online (https://csea.phhp.ufl.edu/media/iapsmessage.html). The erotic (https://www.flickr.com/photos/103039225@N05/14964085720) and happy (https://www.flickr.com/photos/moonjazz/2684228420) images are in the public domain and are reproduced here under a Public Domain Mark 1.0 licence (https://creativecommons.org/publicdomain/mark/1.0/). The gruesome (https://commons.wikimedia.org/wiki/File:Amputation_surgery_01.JPG) and neutral (https://commons.wikimedia.org/wiki/File:Herstal_Y1944_med_tiltbar_skjerm-1.JPG) images are in the public domain and are reproduced here under a CC0 1.0 Universal (CC0 1.0) Public Domain Dedication (https://creativecommons.org/publicdomain/zero/1.0/deed.en). The aversive image was taken from the National Archives Catalog (https://catalog.archives.gov/id/6366489) where it was made available with no restrictions on its use.
Figure 1—figure supplement 1
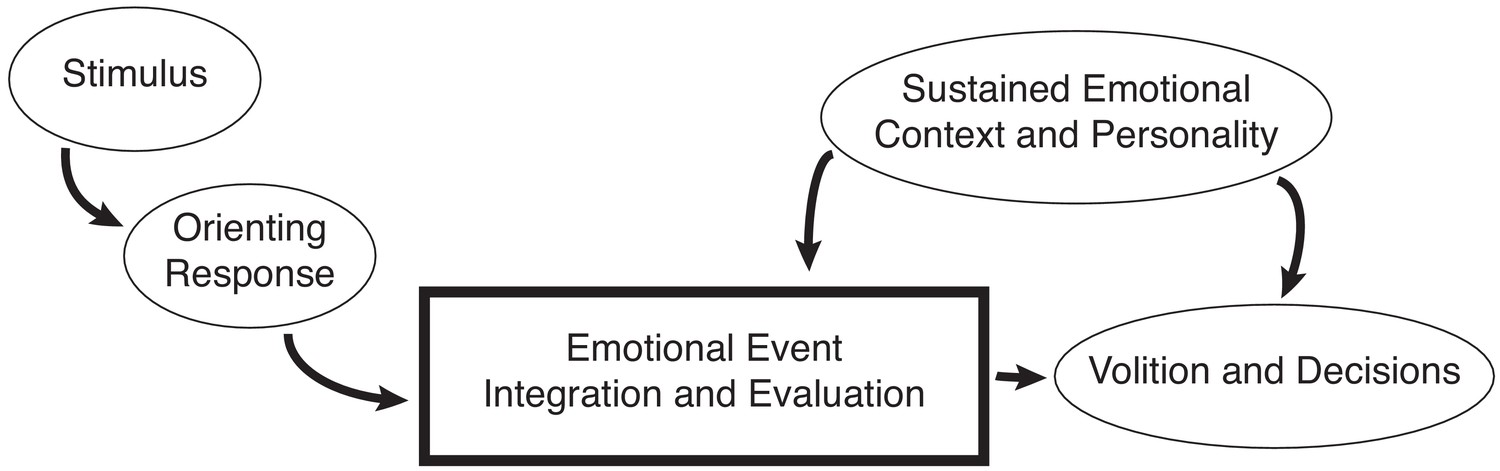
Conceptual model of emotional integration and evaluation, adapted from Halgren and Marinković (1995), and informed more recently by results of a meta-analytic analysis by Riedel et al. (2018).
Widespread and focal dynamic corticolimbic neural networks embody a broad scope of circuitries linked to distinct functional systems for amalgamating cognitive with feeling aspects of emotions: Attention and orientation to a salient stimulus occurs in insular, anterior cingulate, prefrontal, and posterior parietal cortices; Emotional event appraisal, integration, and evaluation (as influenced by the ongoing emotional context and the perceiver’s personality), takes place in posterior cingulate, orbital and medial prefrontal cortex, and other neocortical sites (e.g., fusiform gyrus and superior temporal sulcus), and limbic structures (hippocampus and amygdala); Volition and decisions, which determine response choice, are generated in cingulate, precentral, premotor, and supplementary cortices.
Figure 2
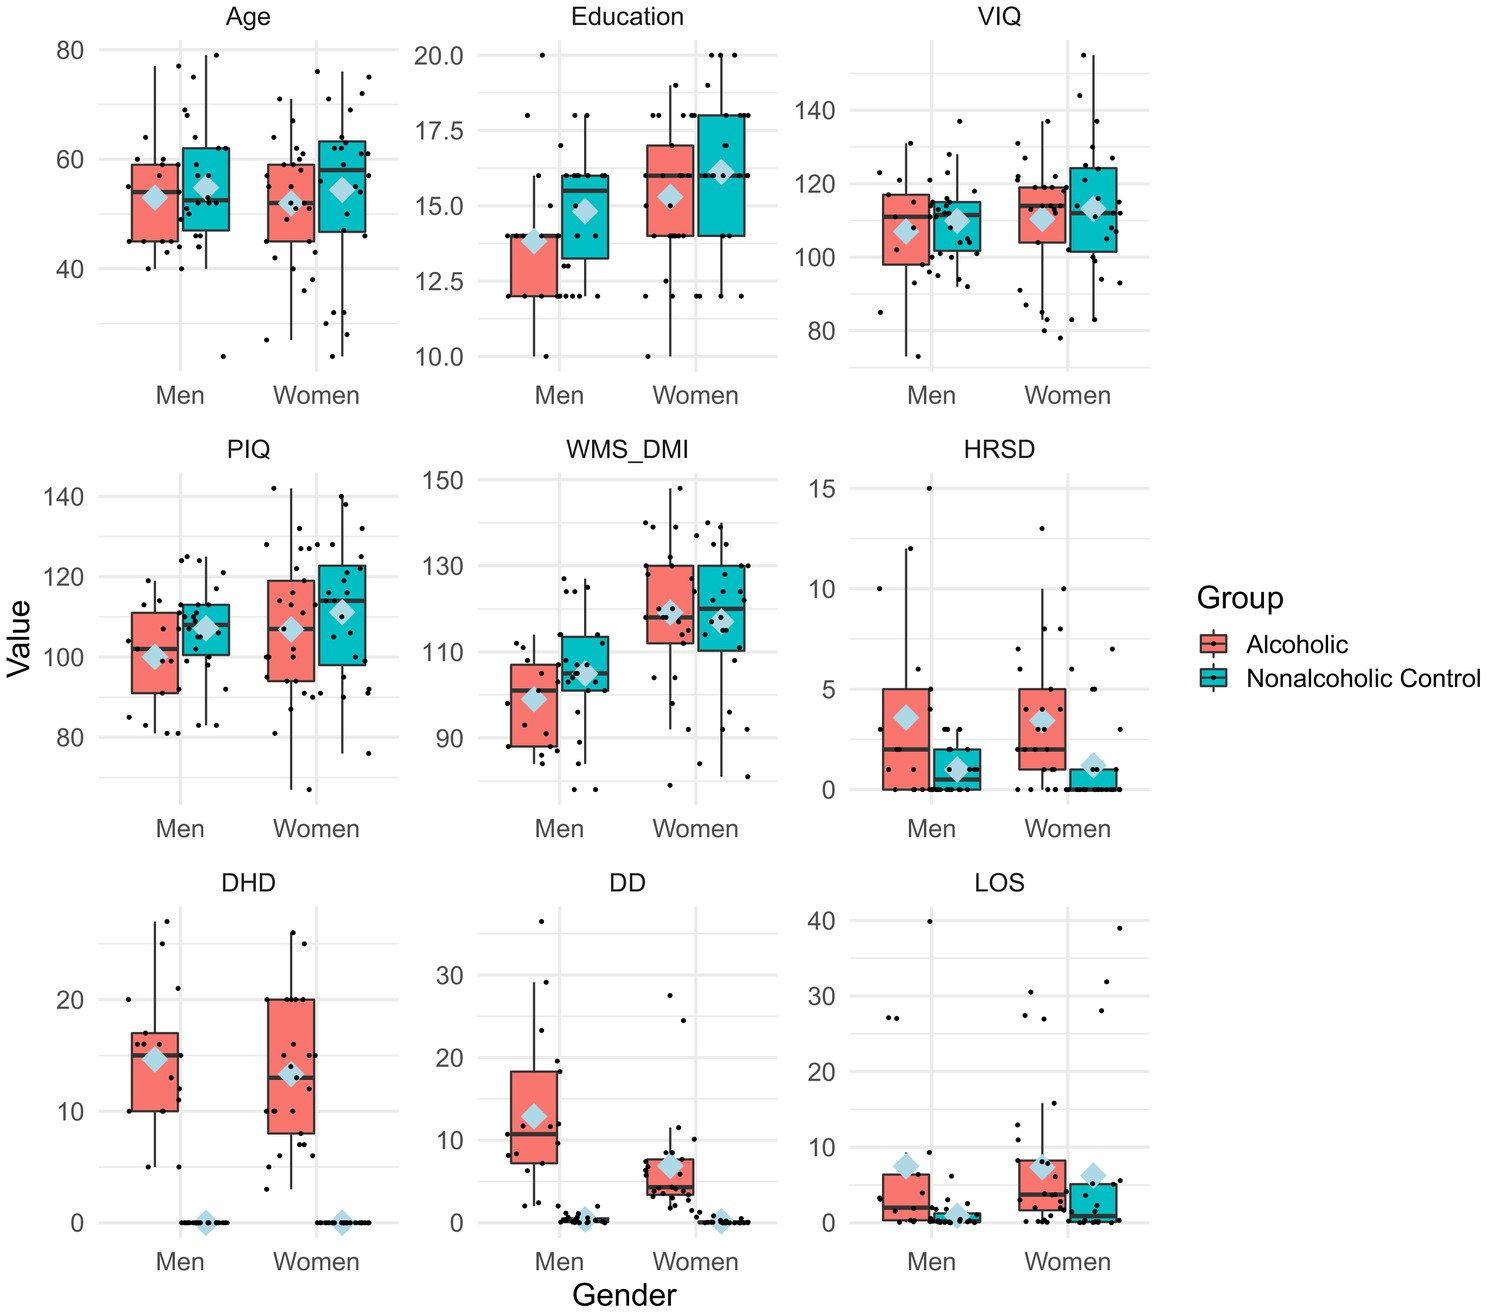
Participants’ characteristics and drinking measures.
The boxplot represents participant characteristics. Appendix 1—table 1 shows the means, standard deviations, and significant differences. In the boxplot above, blue diamonds indicate mean values. Age, education, DHD, and LOS are expressed in years and DD is in ounces of ethanol per day (approximating daily drinks). LOS values were not applicable for two nonalcoholic control men and four nonalcoholic control women who reported never drinking. Abbreviations: DHD = Duration of Heavy Drinking (>21 drinks per week) in years; DD = Daily drinks; LOS = Length of sobriety in years. HRSD = Hamilton Rating Scale for Depression (Hamilton, 1960); VIQ = Wechsler Adult Intelligence Scale, 3rd ed. Verbal Intelligence Quotient; PIQ = Wechsler Adult Intelligence Scale, 3rd ed. Performance Intelligence Quotient; WMS_DMI = Wechsler Memory Scale, 3rd ed. Delayed (General) Memory Index.
Figure 3 with 1 supplement
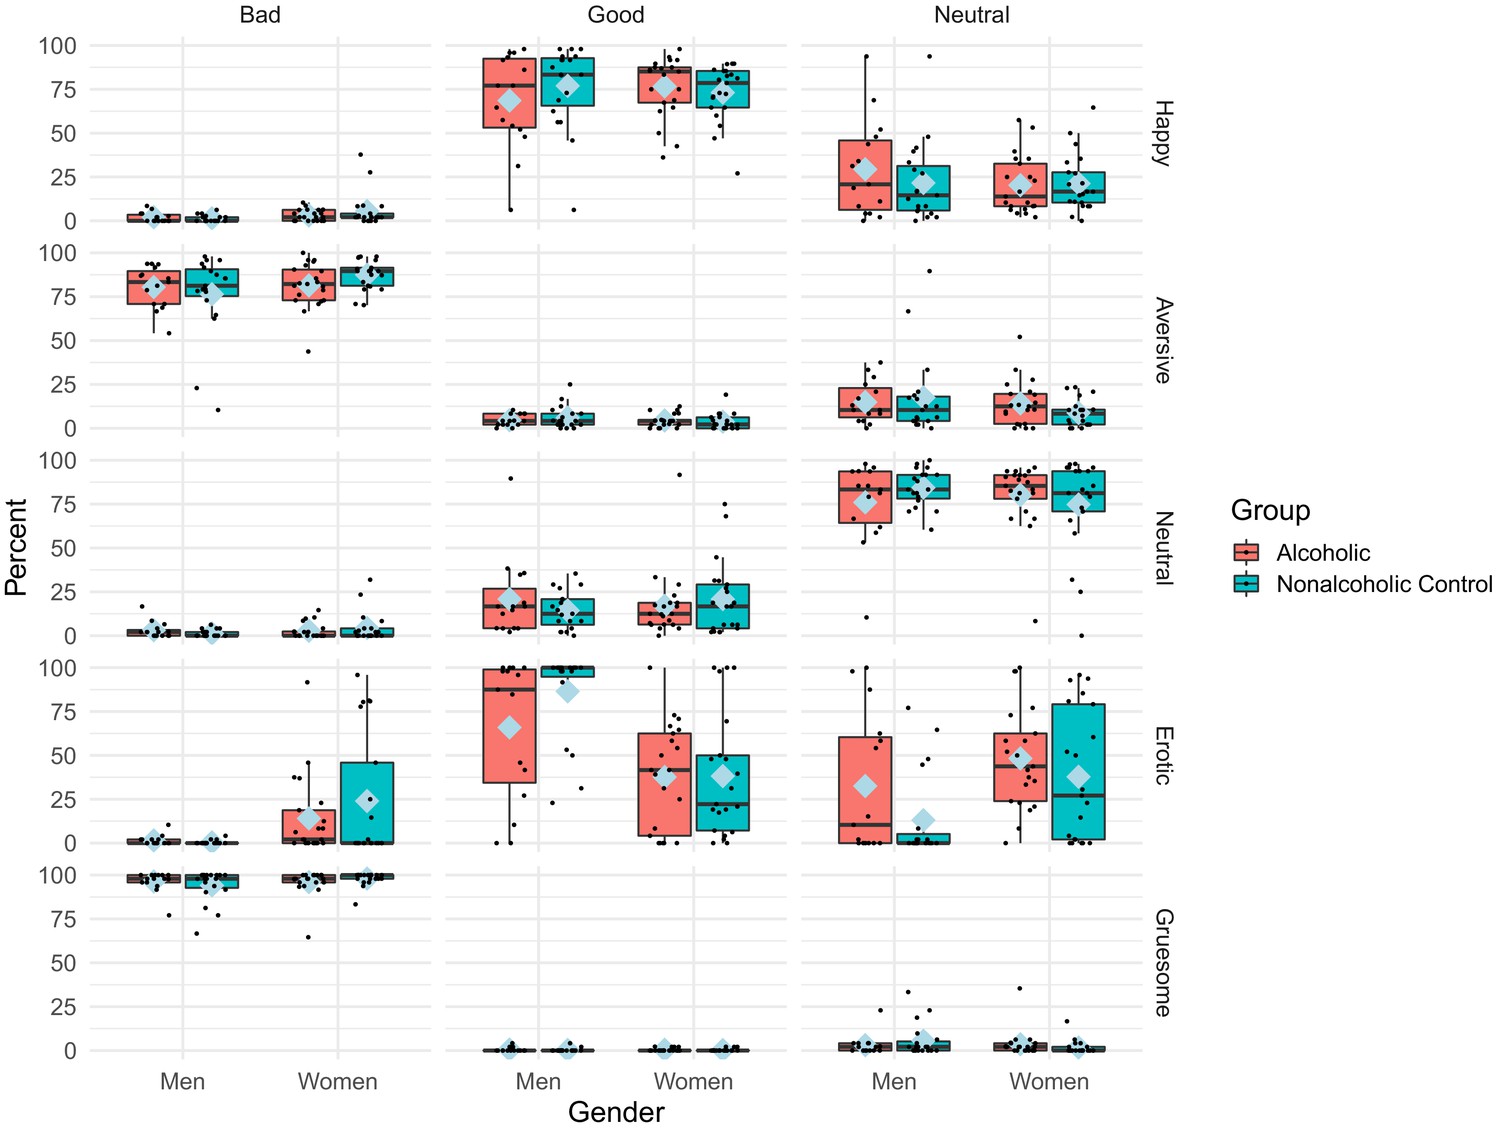
Percentage of behavioral ratings by condition, rating, group, and gender.
The boxplot represents the significant condition x rating x group interaction, and the significant condition x rating x gender interaction, for percentage rating of the pictures p<0.05 (Appendix 1—table 3). The group interaction is most clearly evident for the difference in the good and neutral ratings of the erotic pictures, with the alcoholic participants rating the pictures good less frequently; other picture types were rated more similarly by both the alcoholic and control groups. The gender interaction indicated that men rated erotic pictures as good more frequently than women. Blue diamonds indicate mean values. Figure 3—figure supplement 1 shows the reaction times. Abbreviations: ALC = Alcoholic participants; NC = Nonalcoholic Control participants.
Figure 3—figure supplement 1
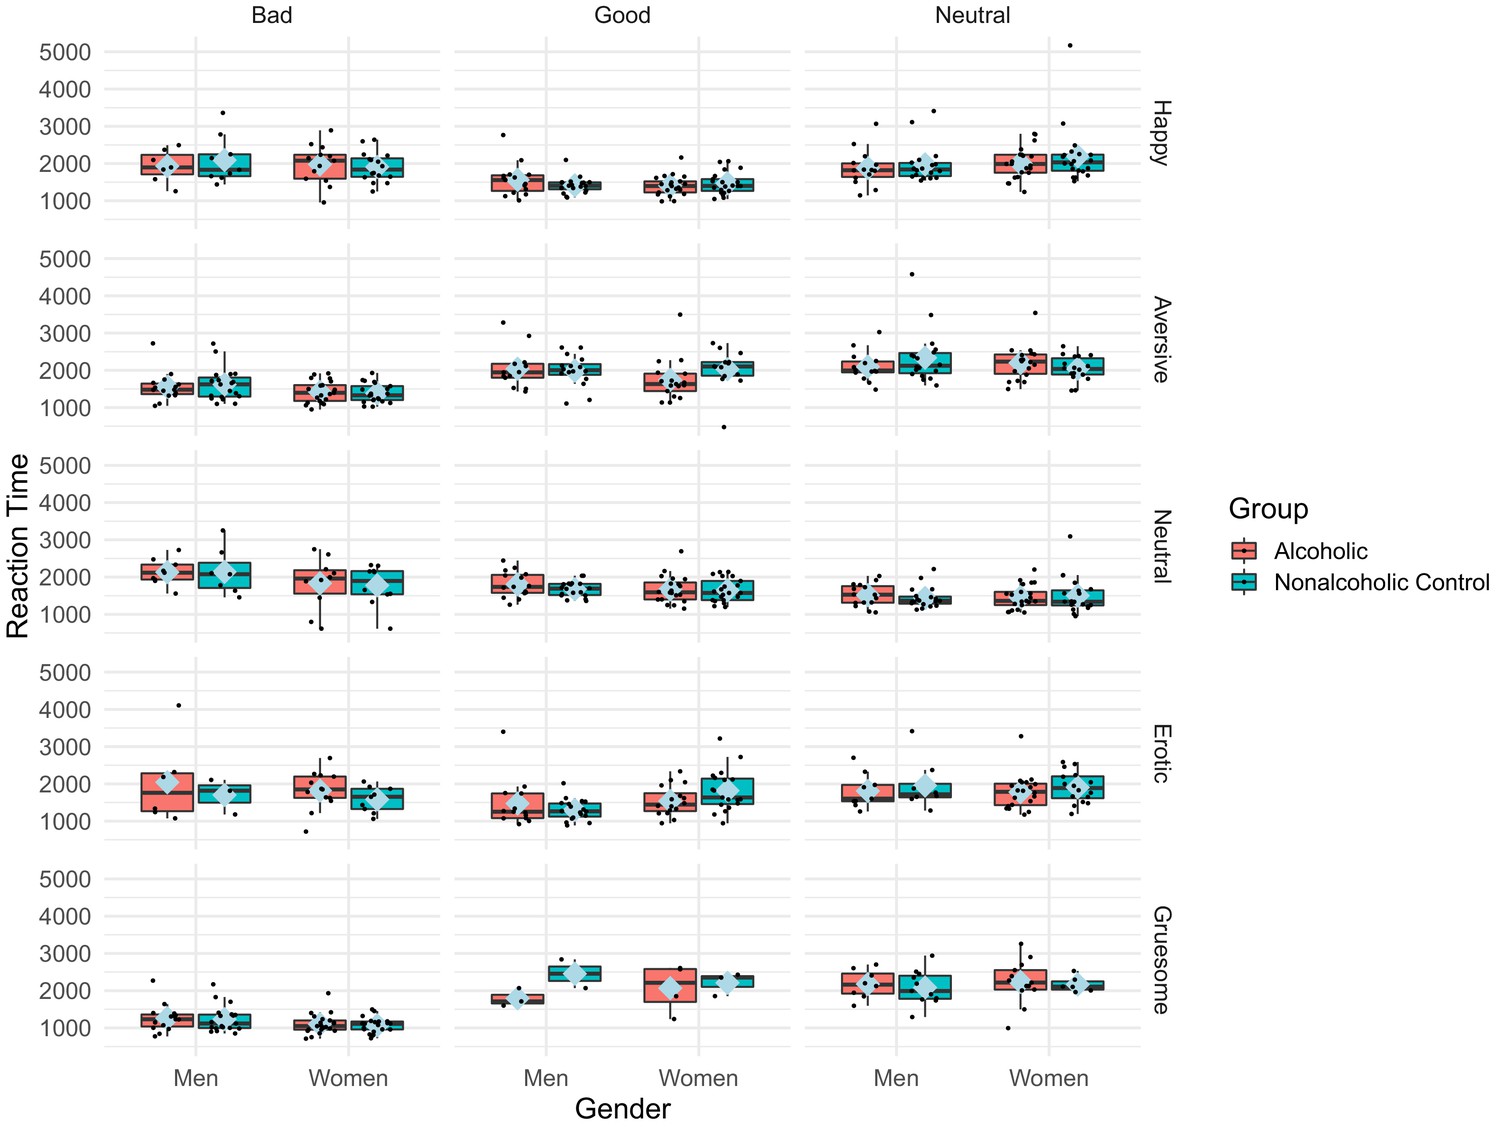
Reaction times of behavioral ratings by condition, rating, group, and gender.
The boxplot represents the significant rating x gender interaction for reaction times of the pictures p<0.05 (Appendix 1—table 4). The difference in the good rating of the erotic pictures by alcoholics vs. nonalcoholic controls. The ratings for other conditions were qualitatively similar for alcoholics and nonalcoholic control subjects. Blue diamonds indicate mean values. Figure 3 shows the reaction times. ALC = alcoholic participants; NC = nonalcoholic control participants.
Figure 4 with 3 supplements
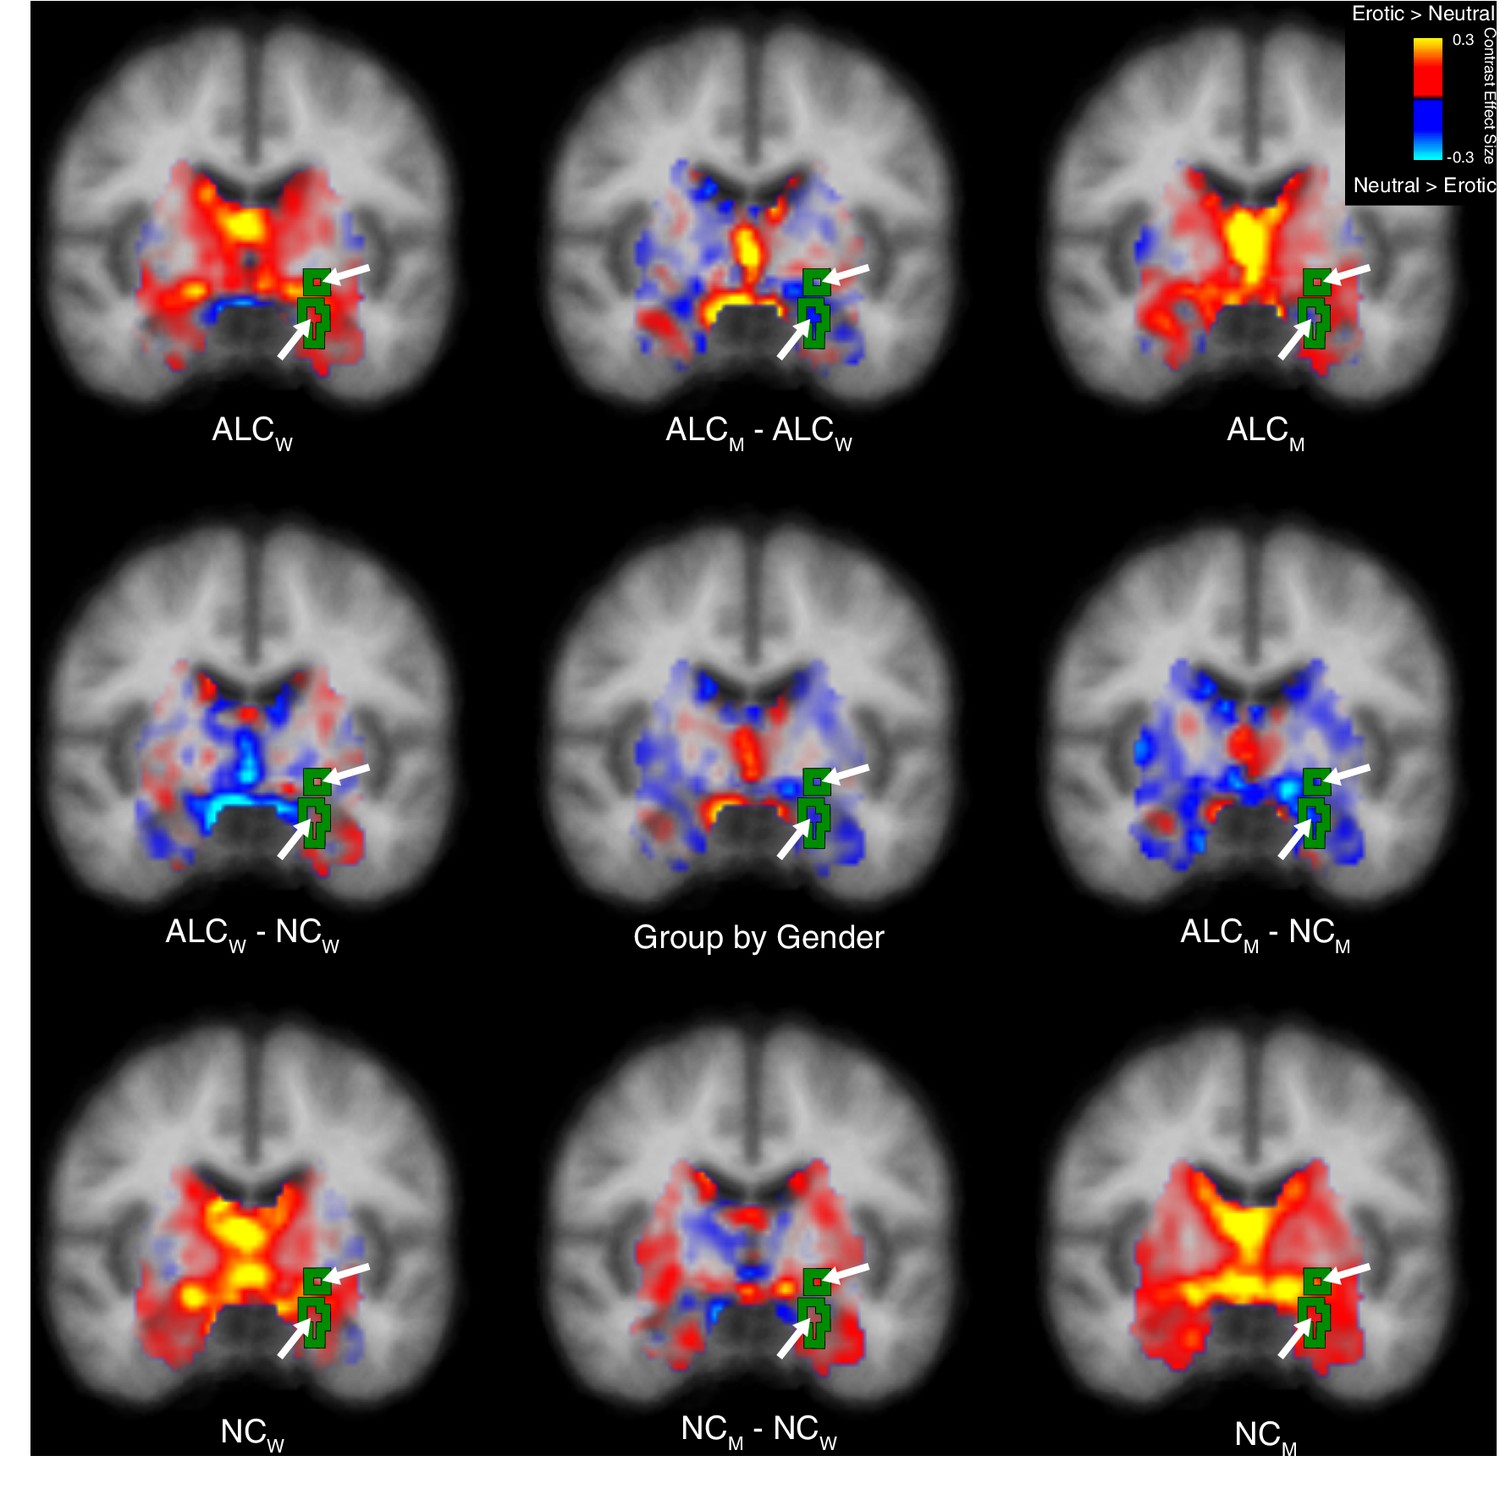
Erotic vs. neutral stimuli elicited abnormal activation of the limbic system and cerebellum in alcoholic men.
A significant group x gender interaction in response to erotic vs. neutral stimuli was identified and is displayed as a green outline indicated by arrows. All inferior arrows designate the amygdala. Group mean contrast values are displayed in the four brain images located in the corners of the figure, and group comparisons are indicated by minus signs. Contrast values are overlaid on coronal cross sections. Images are displayed in radiological convention with the right hemisphere shown on the left. (Sagittal and axial views are shown in Figure 4—figure supplement 1 and Figure 4—figure supplement 2; Figure 4—figure supplement 3 shows the magnitude of cluster differences.) Abbreviations: ALCM = Alcoholic men; ALCW = Alcoholic women; NCM = Nonalcoholic men; NCW = Nonalcoholic women.
Figure 4—figure supplement 1
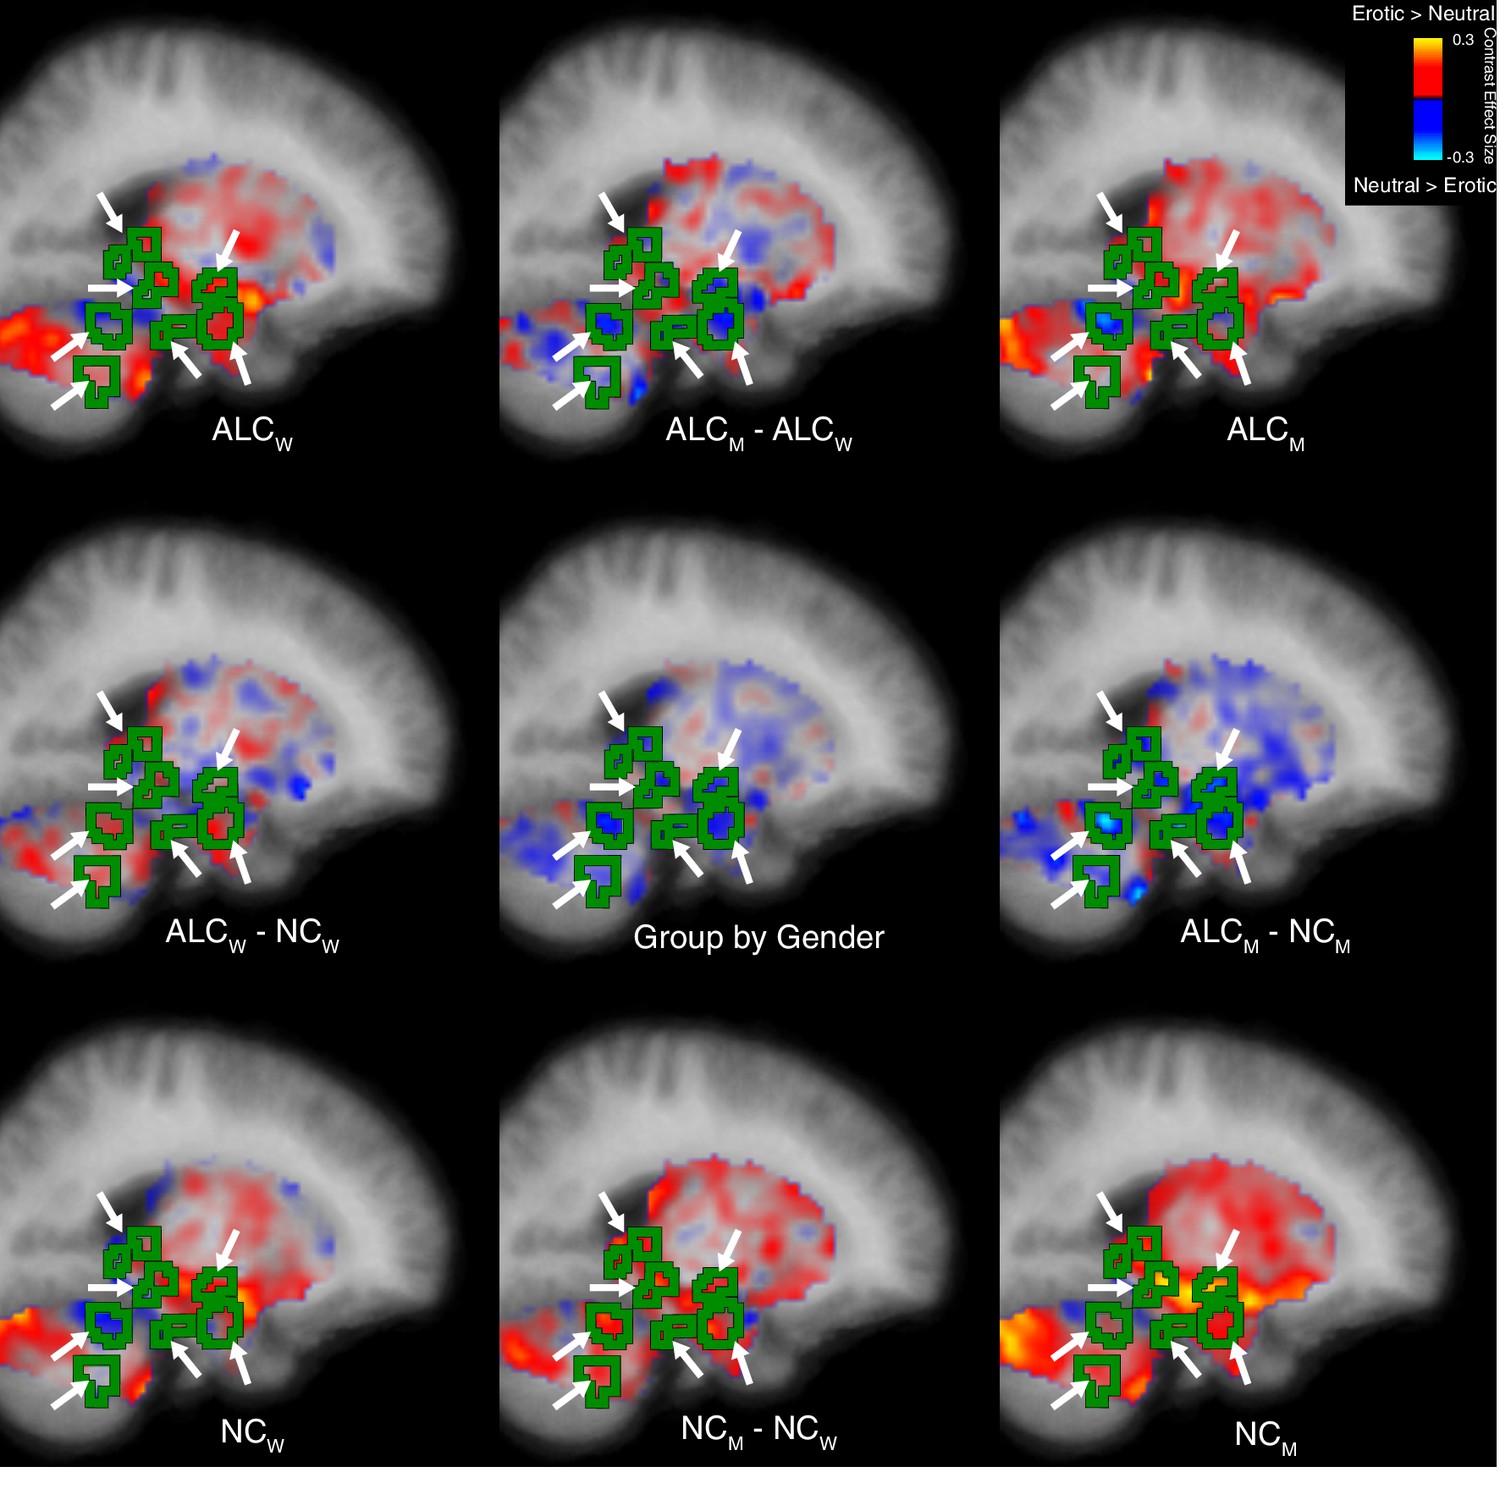
Erotic vs. neutral stimuli elicited abnormal activation of the limbic system and cerebellum in alcoholic men (sagittal view).
A group x gender interaction in response to erotic vs. neutral stimulation was identified and is displayed as a green outline. Group mean values are displayed in the four brain images located in the corners of the figure, and group comparisons are indicated by minus signs. Contrast effect sizes are overlaid on sagittal cross sections. (Coronal and axial views are shown in Figure 4 and Figure 4—figure supplement 2; Figure 4—figure supplement 3 shows the magnitude of cluster differences.) Abbreviations: ALCM = alcoholic men; ALCW = alcoholic women; NCM = nonalcoholic men; NCW = nonalcoholic women.
Figure 4—figure supplement 2
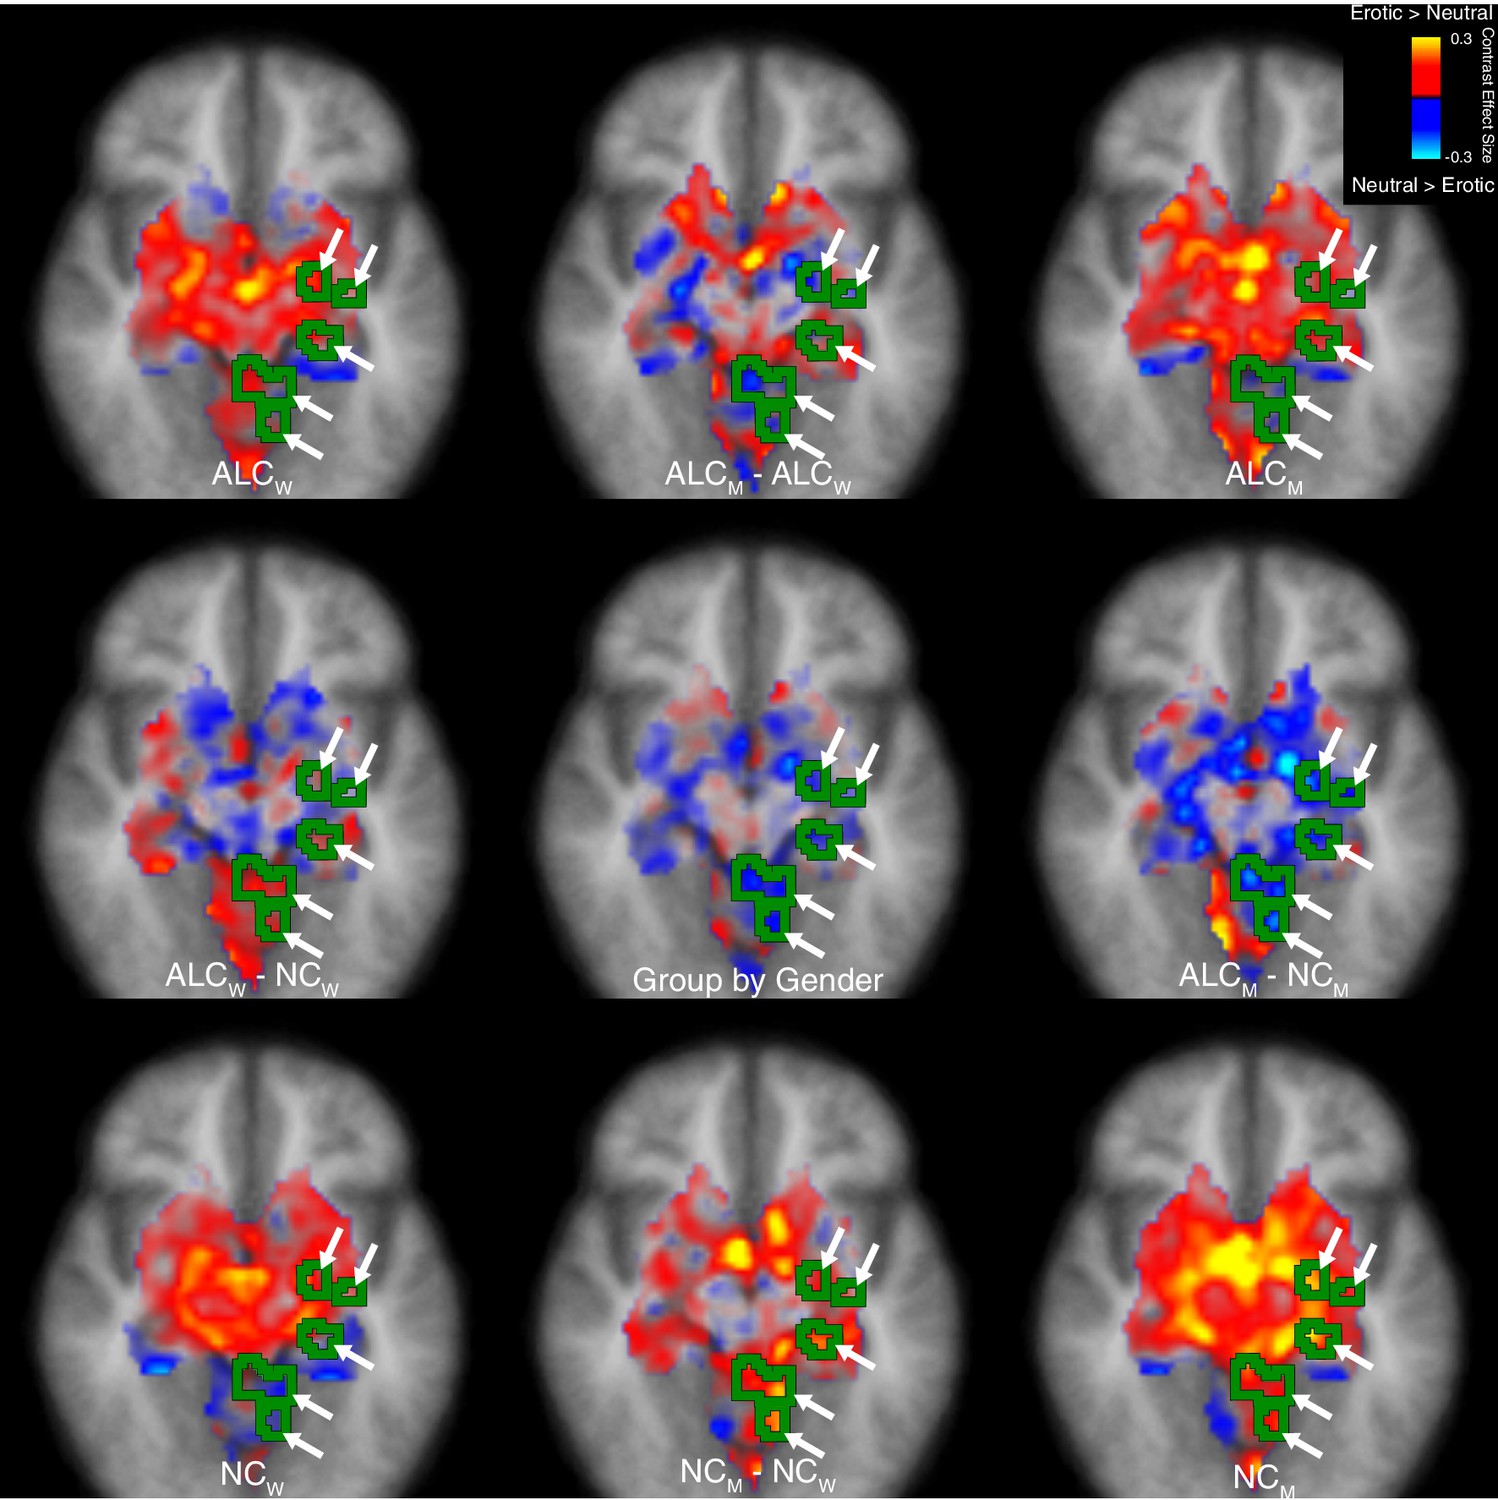
Erotic vs. neutral stimuli elicited abnormal activation of the limbic system and cerebellum in alcoholic men (axial view).
A group x gender interaction in response to erotic vs. neutral stimulation was identified and is displayed as a green outline. Group mean values are displayed in the four brain images located in the corners of the figure, and group comparisons are indicated by minus signs. Contrast effect sizes are overlaid on axial cross sections. Images are displayed in radiological convention with the right hemisphere shown on the left. (Coronal and sagittal views are shown in Figure 4 and Figure 4—figure supplement 1; Figure 4—figure supplement 3 shows the magnitude of cluster differences.) Abbreviations: ALCM = alcoholic men; ALCW = alcoholic women; NCM = nonalcoholic men; NCW = nonalcoholic women.
Figure 4—figure supplement 3
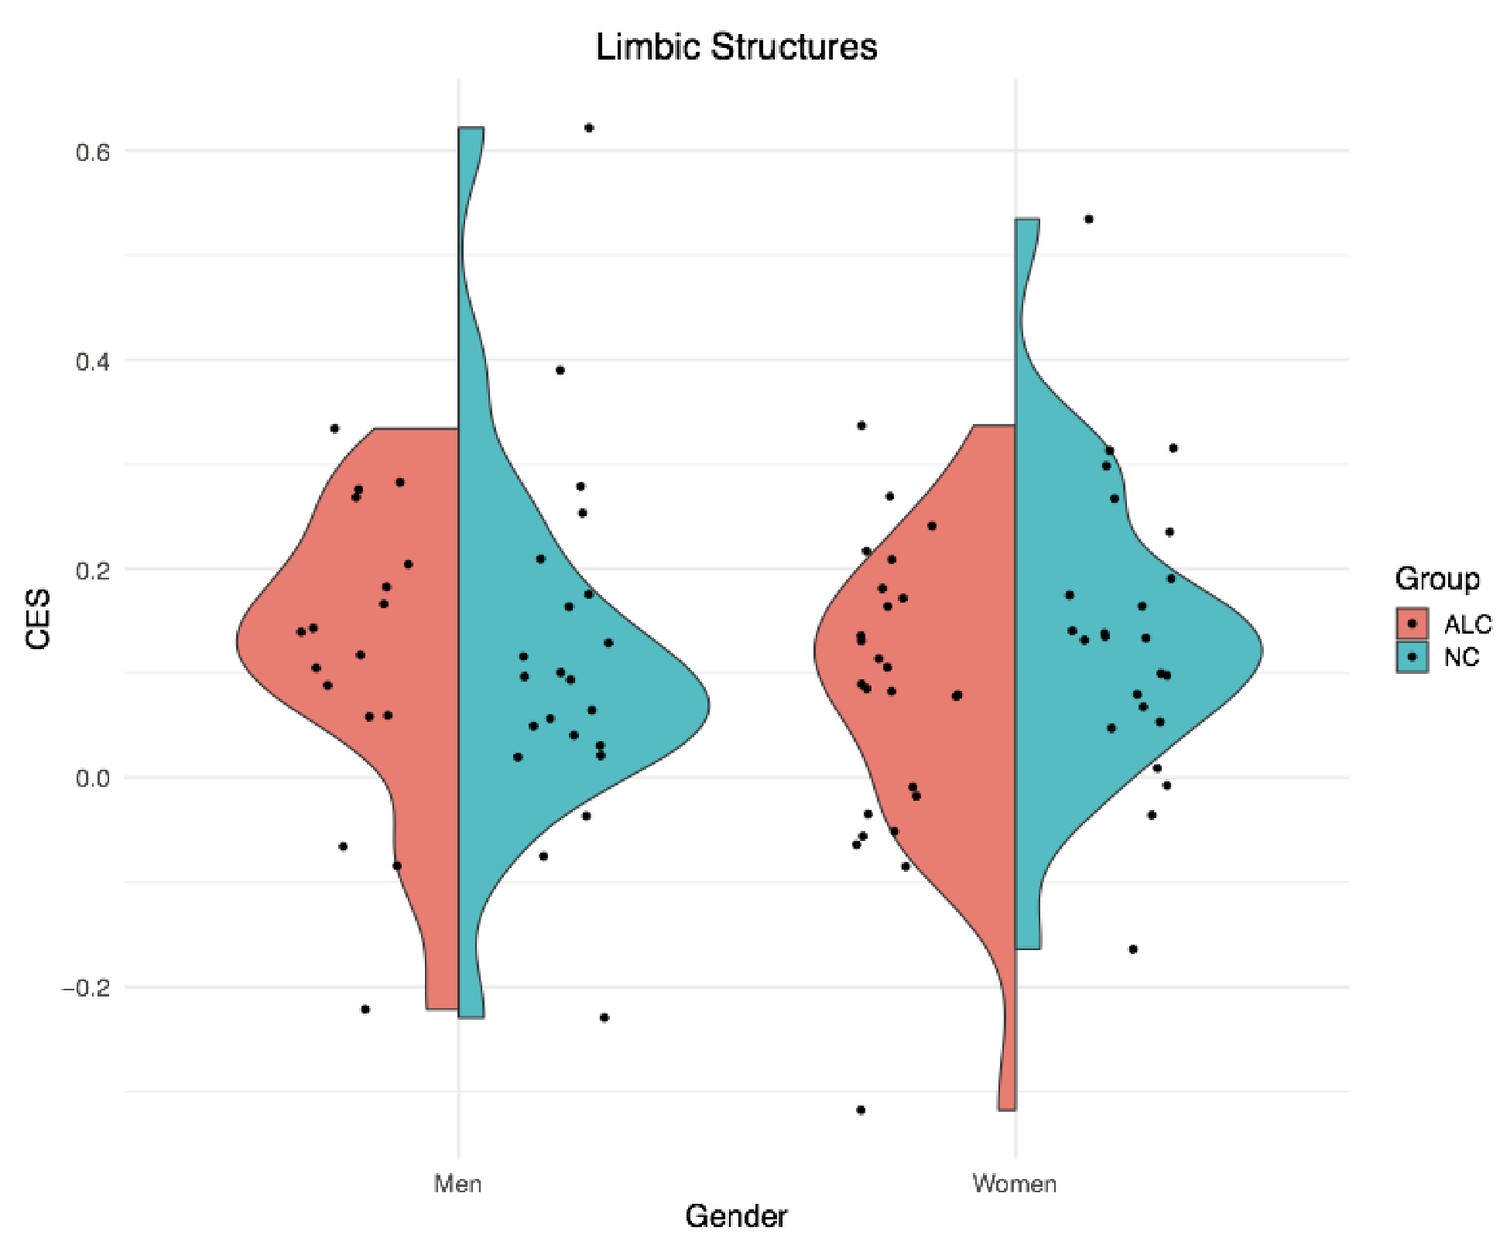
Contrast values observed in the cluster for erotic vs. neutral conditions.
The split violin plot represents the Contrast Effect Size (CES; equivalent to ‘CON’ in SPM or ‘COPE’ in FSL) for the cluster in which a significant group x gender interaction was identified for the erotic vs. neutral contrast (p<0.05 after correction for multiple comparisons). Positive values indicate erotic >neutral, while negative values indicate erotic <neutral. Each point represents a single participant’s average CES for vertices within the cluster. This figure is meant to convey the variability in CES across participants that is not visible in Figure 4. Nonalcoholic control men had greater activation to erotic stimuli than neutral stimuli, and the contrast was more positive than was observed for alcoholic men. The pattern was reversed for women: Alcoholic women had lower contrast values than nonalcoholic women. Abbreviations: ALC = alcoholic participants; NC = nonalcoholic control participants.
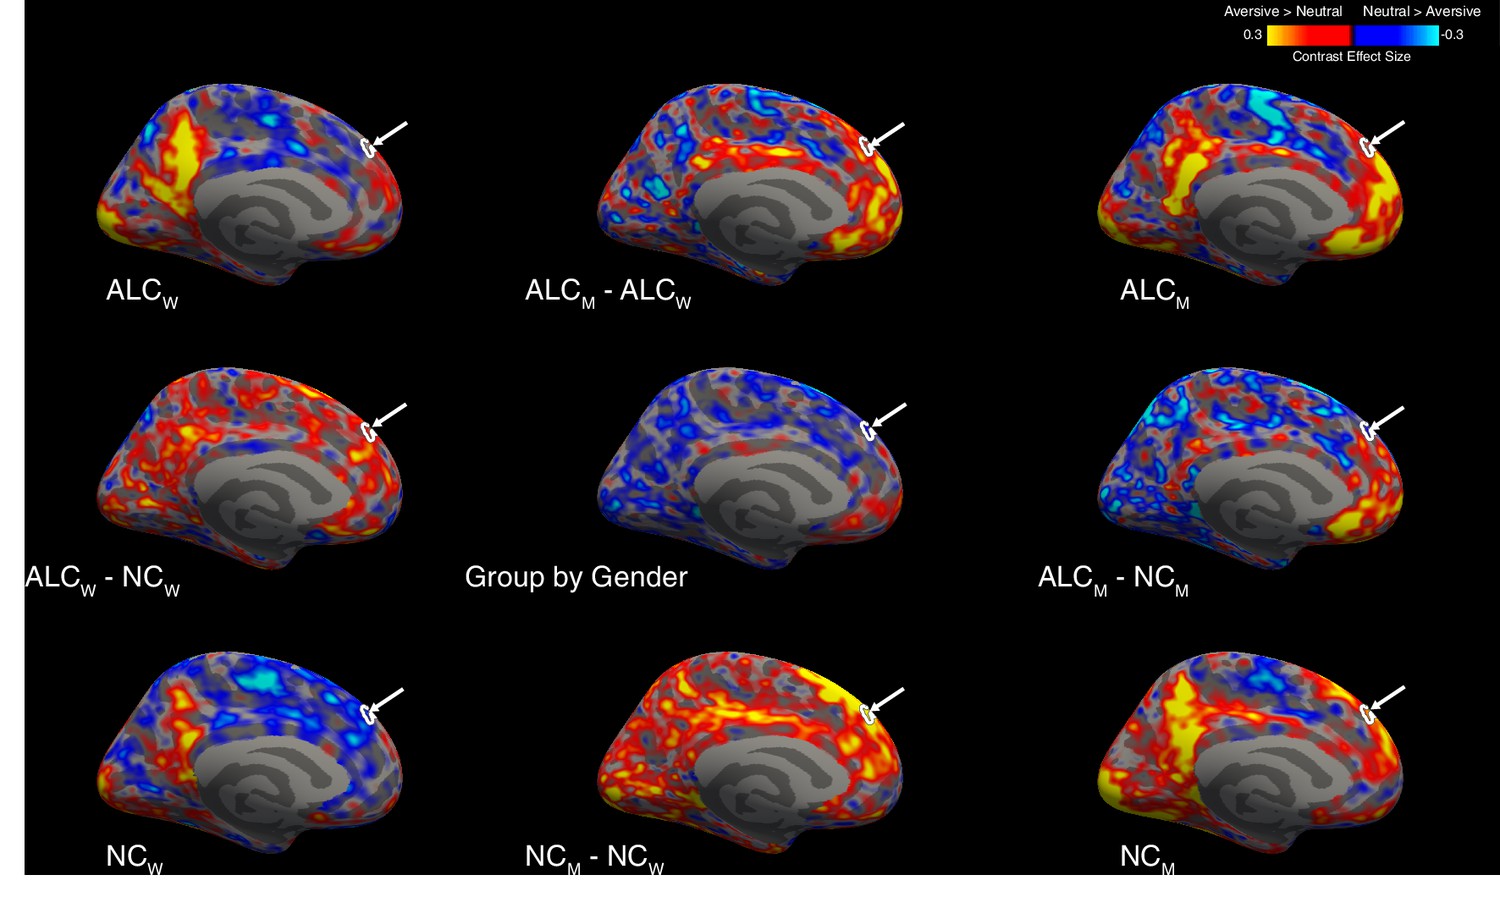
Figure 5 with 6 supplements
Aversive vs. neutral stimuli elicited more abnormally negative responses in alcoholic men.
A significant group x gender interaction revealed several clusters (see Appendix 1—table 6), which are indicated by arrows on the lateral surface of the left hemisphere, overlaid on contrast values between aversive and neutral stimuli. Group mean contrast values (for aversive vs. neutral) are displayed in the four brain images located in the corners of the figure, and group comparisons are indicated by minus signs. (Figure 5—figure supplement 1 shows the medial surface, while the right hemisphere is shown in Figure 5—figure supplement 2 for the lateral and Figure 5—figure supplement 3 for the medial surface; Figure 5—figure supplement 4 shows the magnitude of cluster differences.) Although not shown here, the activation patterns across the four subgroups for contrasts of other emotional stimuli (i.e., happy, gruesome, and erotic) with neutral stimuli were similar to those shown above, and likewise, the general locations of the activation regions were similar for the four subgroups. Abbreviations: ALCM = Alcoholic men; ALCW = Alcoholic women; NCM = Nonalcoholic men; NCW = Nonalcoholic women.
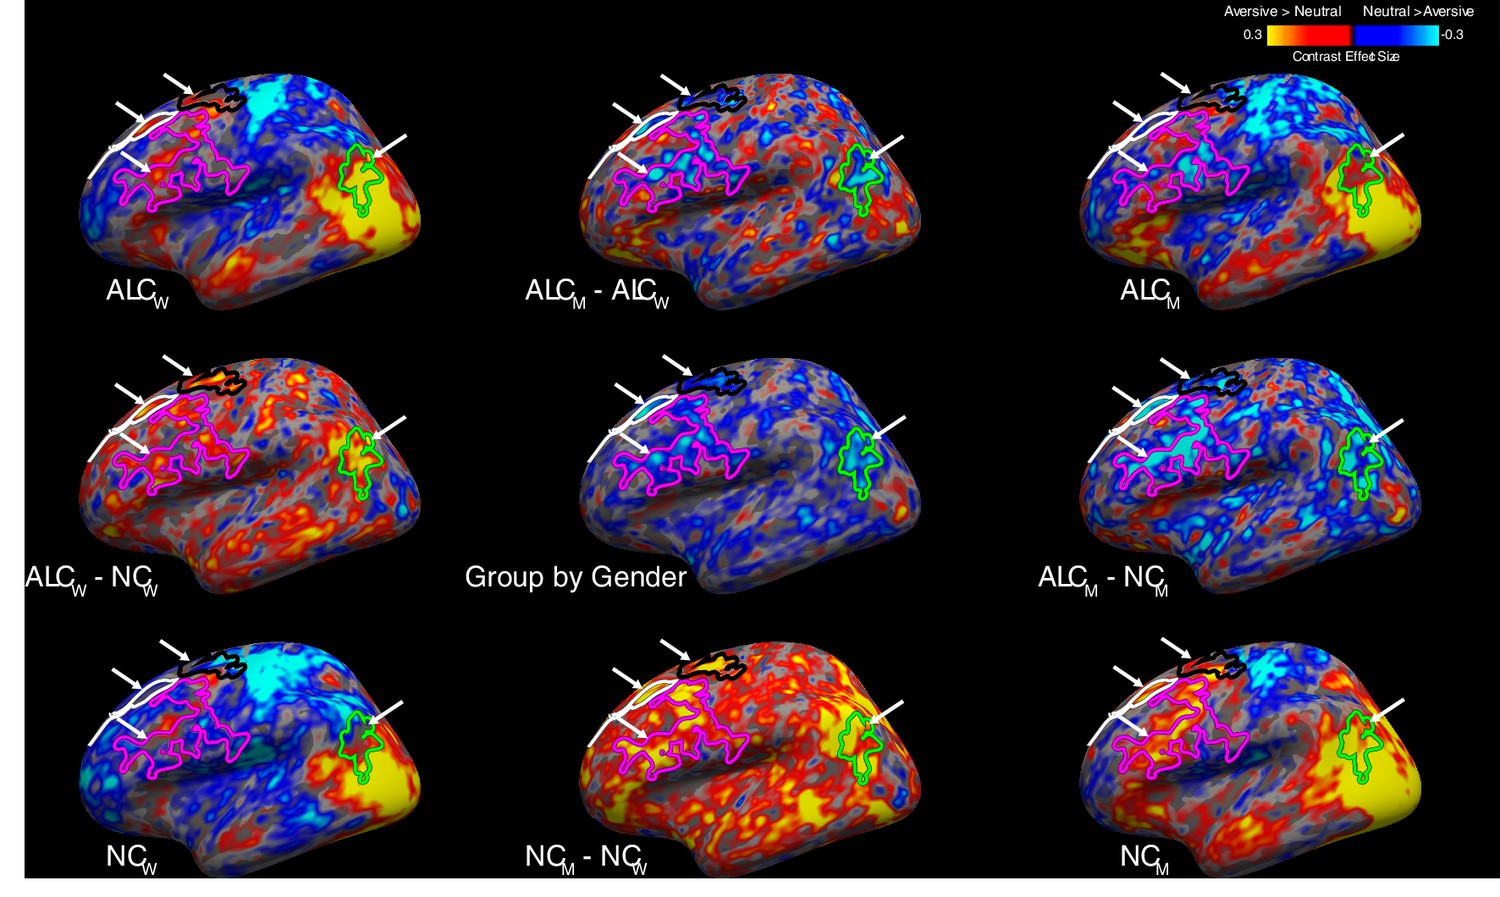
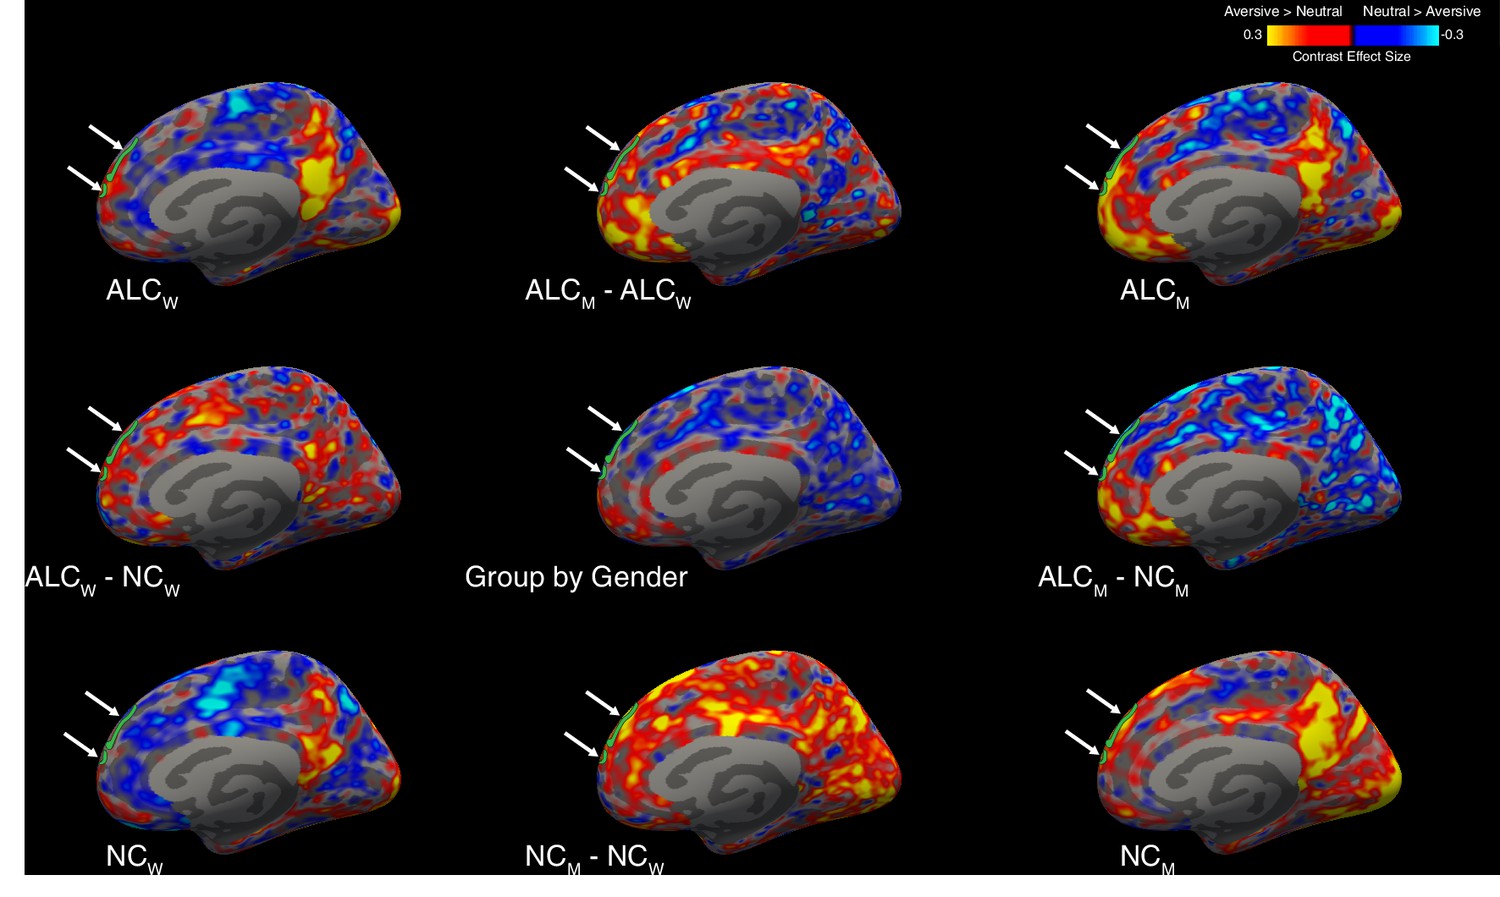
Figure 5—figure supplement 1
Aversive vs. neutral stimuli elicited more abnormally negative responses in alcoholic men (left medial surface).
A group x gender interaction revealed several clusters (see Appendix 1—table 6), which are displayed as outlines and indicated by arrows on the medial surface of the left hemisphere, overlaid on contrast values between aversive and neutral stimuli. Group mean values (for aversive vs. neutral) are displayed in the four brain images located in the corners of the figure, and group comparisons are indicated by minus signs. (Figure 5 shows the lateral surface, while the right hemisphere is shown in Figure 5—figure supplement 2 for the lateral and Figure 5—figure supplement 3 for the medial surface; Figure 5—figure supplement 4 shows the magnitude of cluster differences.) Although not shown here, the activation patterns across the four subgroups for contrasts of other emotional stimuli (i.e., happy, gruesome, and erotic) with neutral stimuli were similar to those shown above, and likewise, the general locations of the activation regions were similar for the four subgroups. Abbreviations: ALCM = alcoholic men; ALCW = alcoholic women; NCM = nonalcoholic men; NCW = nonalcoholic women.
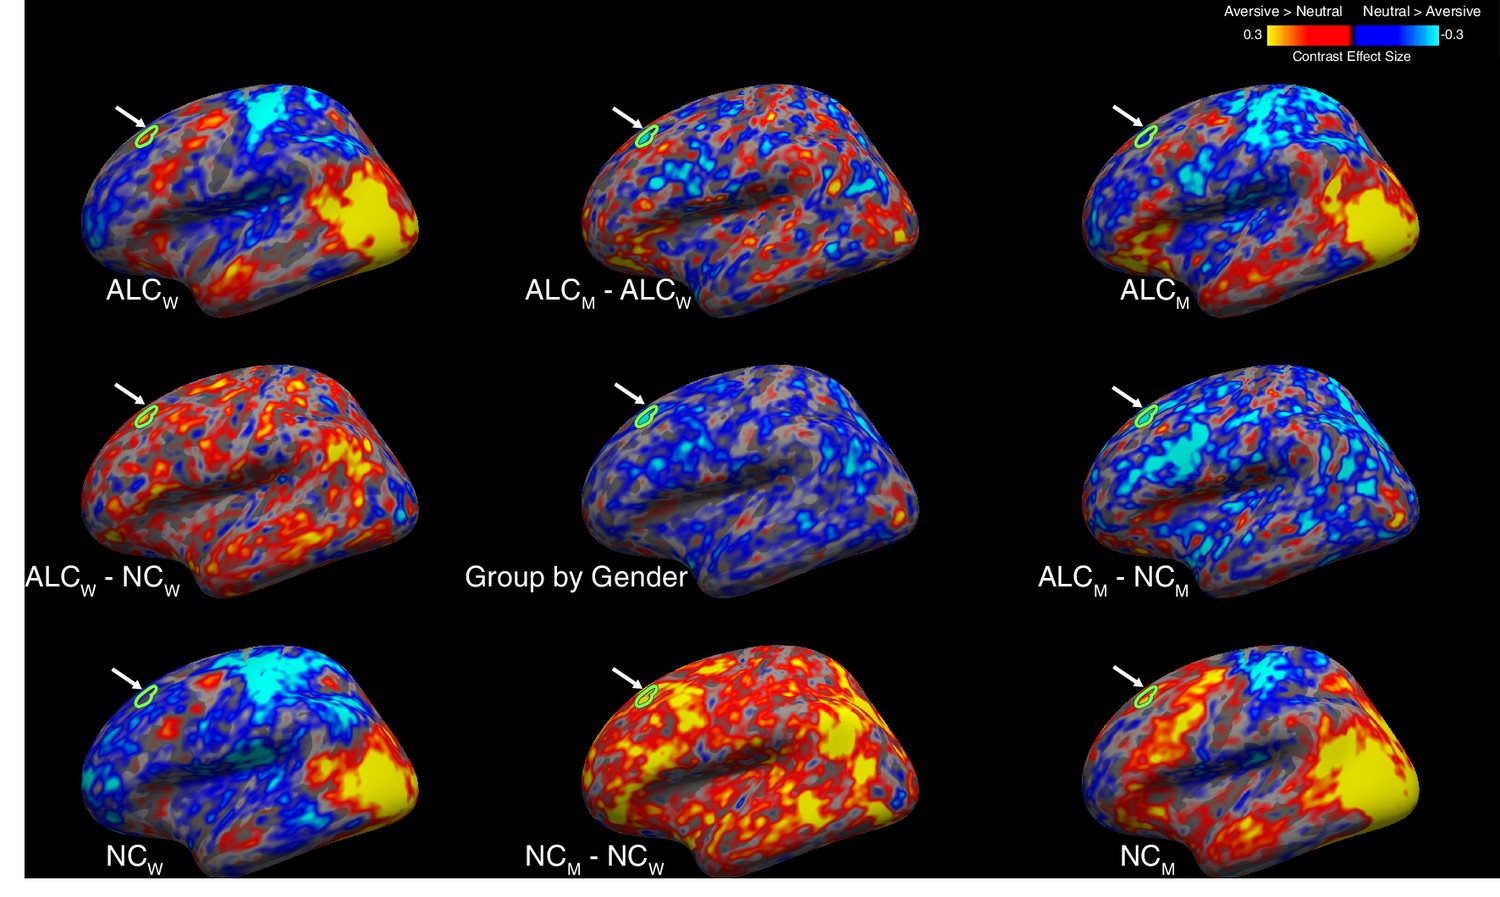
Figure 5—figure supplement 2
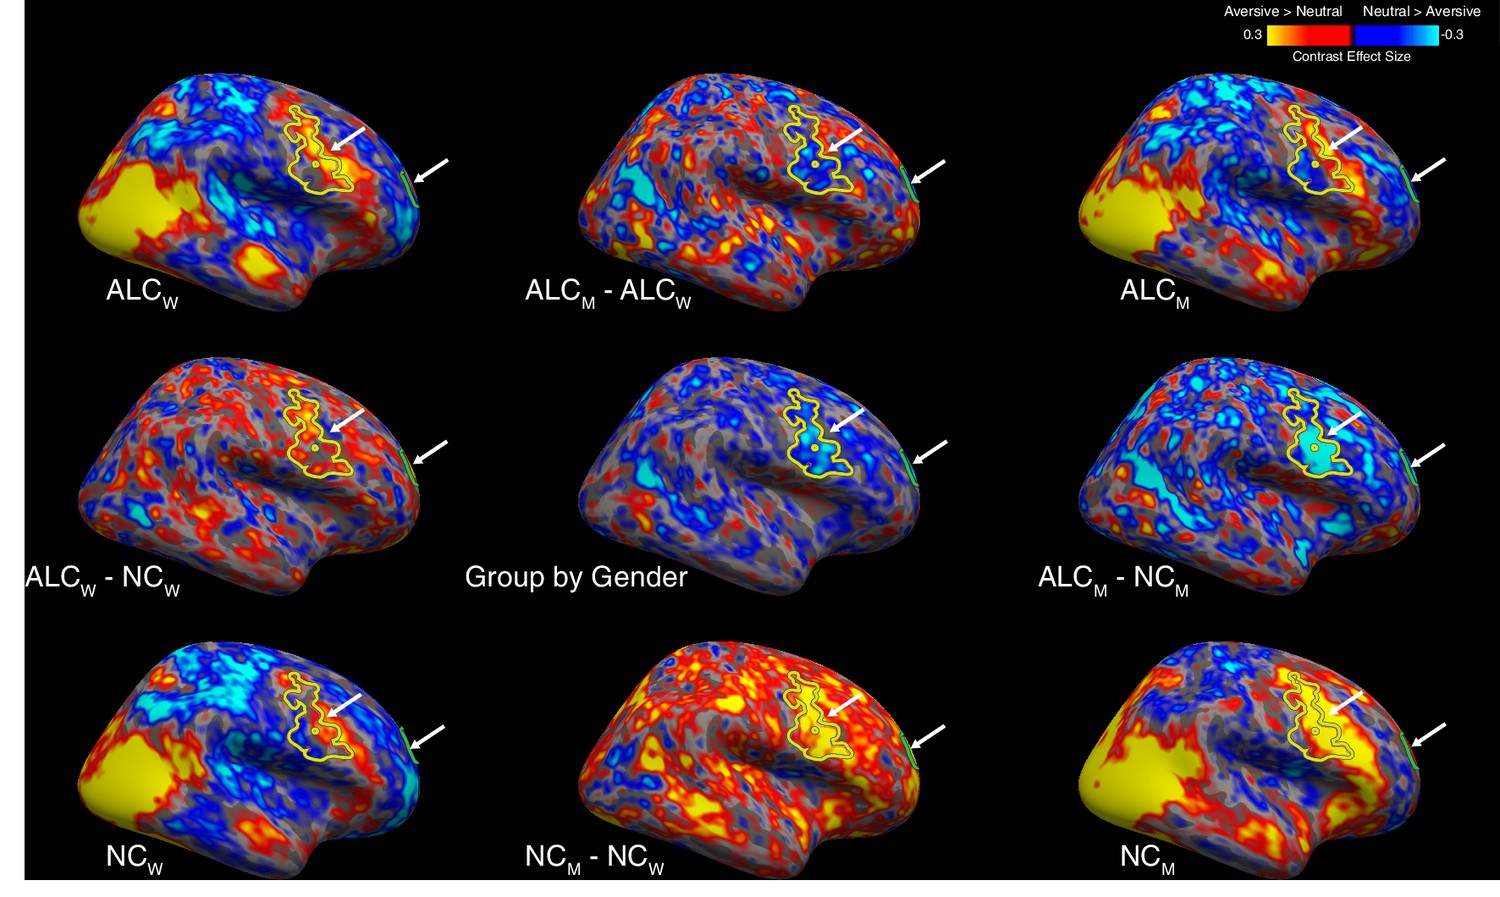
Aversive vs. neutral stimuli elicited more abnormally negative responses in alcoholic men (right lateral surface).
A group x gender interaction revealed several clusters (see Appendix 1—table 6), which are displayed as outlines and indicated by arrows on the lateral surface of the right hemisphere, overlaid on contrast values between aversive and neutral stimuli. Group mean values (for aversive vs. neutral) are displayed in the brain images located in the four corners of the figure, and group comparisons are indicated by minus signs. (Figure 5 and Figure 5—figure supplement 1 show the lateral and medial surfaces of the left hemisphere, while the medial surface of the right hemisphere is shown in Figure 5—figure supplement 3; Figure 5—figure supplement 4 shows the magnitude of cluster differences.) Although not shown here, the activation patterns across the four subgroups for contrasts of other emotional stimuli (i.e., happy, gruesome, and erotic) with neutral stimuli were similar to those shown above, and likewise, the general locations of the activation regions were similar for the four subgroups. Abbreviations: ALCM = alcoholic men; ALCW = alcoholic women; NCM = nonalcoholic men; NCW = nonalcoholic women.
Figure 5—figure supplement 3
Aversive vs. neutral stimuli elicited more abnormally negative responses in alcoholic men (right medial surface).
A group x gender interaction revealed several clusters (see Appendix 1—table 6), which are displayed as outlines and indicated by arrows on the medial surface of the right hemisphere, overlaid on contrast values between aversive and neutral stimuli. Group mean values (for aversive vs. neutral) are displayed in the brain images located in the four corners of the figure, and group comparisons are indicated by minus signs. (Figure 5 and Figure 5—figure supplement 1 show the lateral and medial surfaces of the left hemisphere, while the lateral surface of the right hemisphere is shown in Figure 5—figure supplement 2; Figure 5—figure supplement 4 shows the magnitude of cluster differences.) Although not shown here, the activation patterns across the four subgroups for contrasts of other emotional stimuli (i.e., happy, gruesome, and erotic) with neutral stimuli were similar to those shown above, and likewise, the general locations of the activation regions were similar for the four subgroups. Abbreviations: ALCM = alcoholic men; ALCW = alcoholic women; NCM = nonalcoholic men; NCW = nonalcoholic women.
Figure 5—figure supplement 4
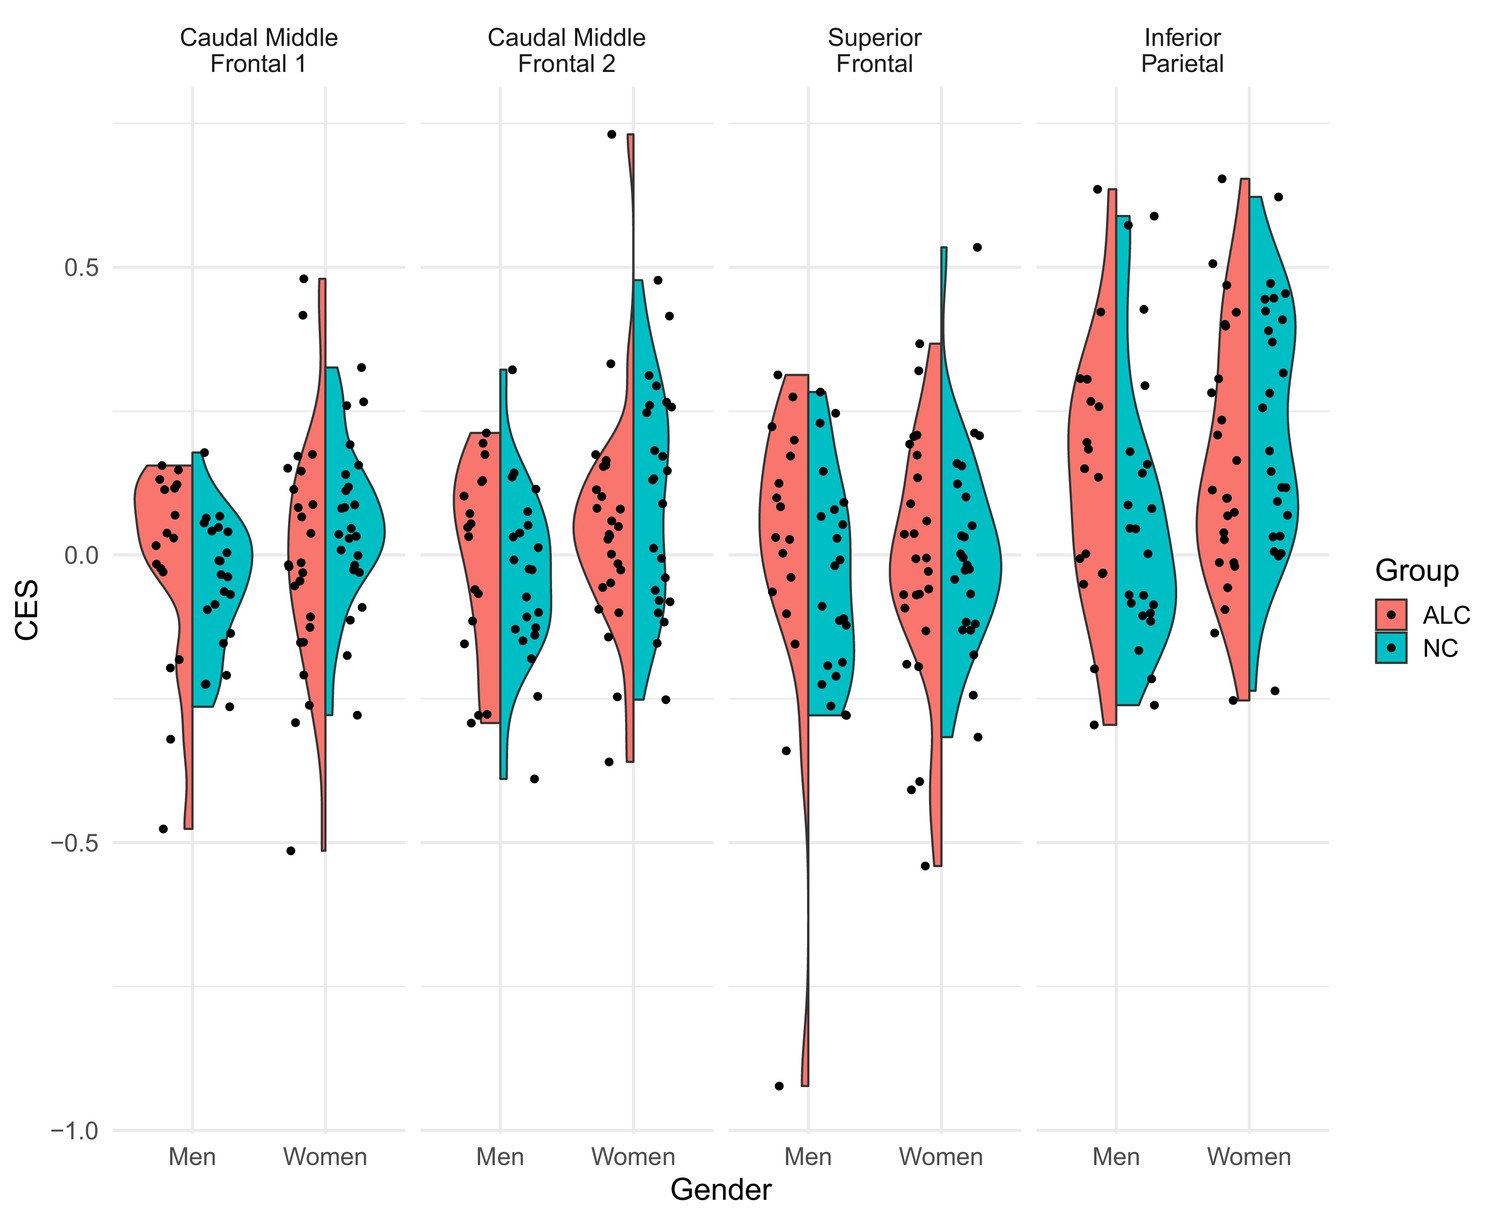
Contrast values observed in each cluster for aversive vs. neutral conditions.
The split violin plot represents the Contrast Effect Size (CES; equivalent to ‘CON’ in SPM or ‘COPE’ in FSL) for left hemisphere clusters in which a significant group x gender interaction was identified for the aversive vs. neutral contrast (p<0.05 after correction for multiple comparisons). Positive values indicate aversive >neutral, while negative values indicate aversive <neutral. Each point represents a single participant’s average CES for vertices within the cluster. This figure is meant to convey the variability in CES across participants that is not visible in Figure 5. In each of the four clusters, nonalcoholic control men had greater activation to aversive stimuli than neutral stimuli, and the contrast was more positive than was observed for alcoholic men. The pattern was reversed for women: Alcoholic women had higher contrast values than nonalcoholic women. Abbreviations: ALC = alcoholic participants; NC = nonalcoholic participants.
Figure 5—figure supplement 5
Aversive vs.neutral stimuli elicited more abnormally negative responses in alcoholic men (left lateral surface), cluster-forming threshold p<0.001.
A group x gender interaction revealed two clusters (see Appendix 1—table 8), which are displayed as outlines and indicated by arrows on the lateral surface of the left hemisphere, overlaid on contrast values between aversive and neutral stimuli. Group mean values (for aversive vs. neutral) are displayed in the four brain images located in the corners of the figure, and group comparisons are indicated by minus signs. (The lateral surface of the right hemisphere is shown in Figure 5—figure supplement 6; no clusters were visible on medial surfaces). Abbreviations: ALCM = alcoholic men; ALCW = alcoholic women; NCM = nonalcoholic men; NCW = nonalcoholic women.
Figure 5—figure supplement 6

Aversive vs.neutral stimuli elicited more abnormally negative responses in alcoholic men (right lateral surface), cluster-forming threshold p<0.001.
A group x gender interaction revealed two clusters (see Appendix 1—table 8), which are displayed as outlines and indicated by arrows on the lateral surface of the right hemisphere, overlaid on contrast values between aversive and neutral stimuli. Group mean values (for aversive vs. neutral) are displayed in the four brain images located in the corners of the figure, and group comparisons are indicated by minus signs. (The lateral surface of the left hemisphere is shown in Figure 5—figure supplement 5; no clusters were visible on medial surfaces). Abbreviations: ALCM = alcoholic men; ALCW = alcoholic women; NCM = nonalcoholic men; NCW = nonalcoholic women.
Figure 6
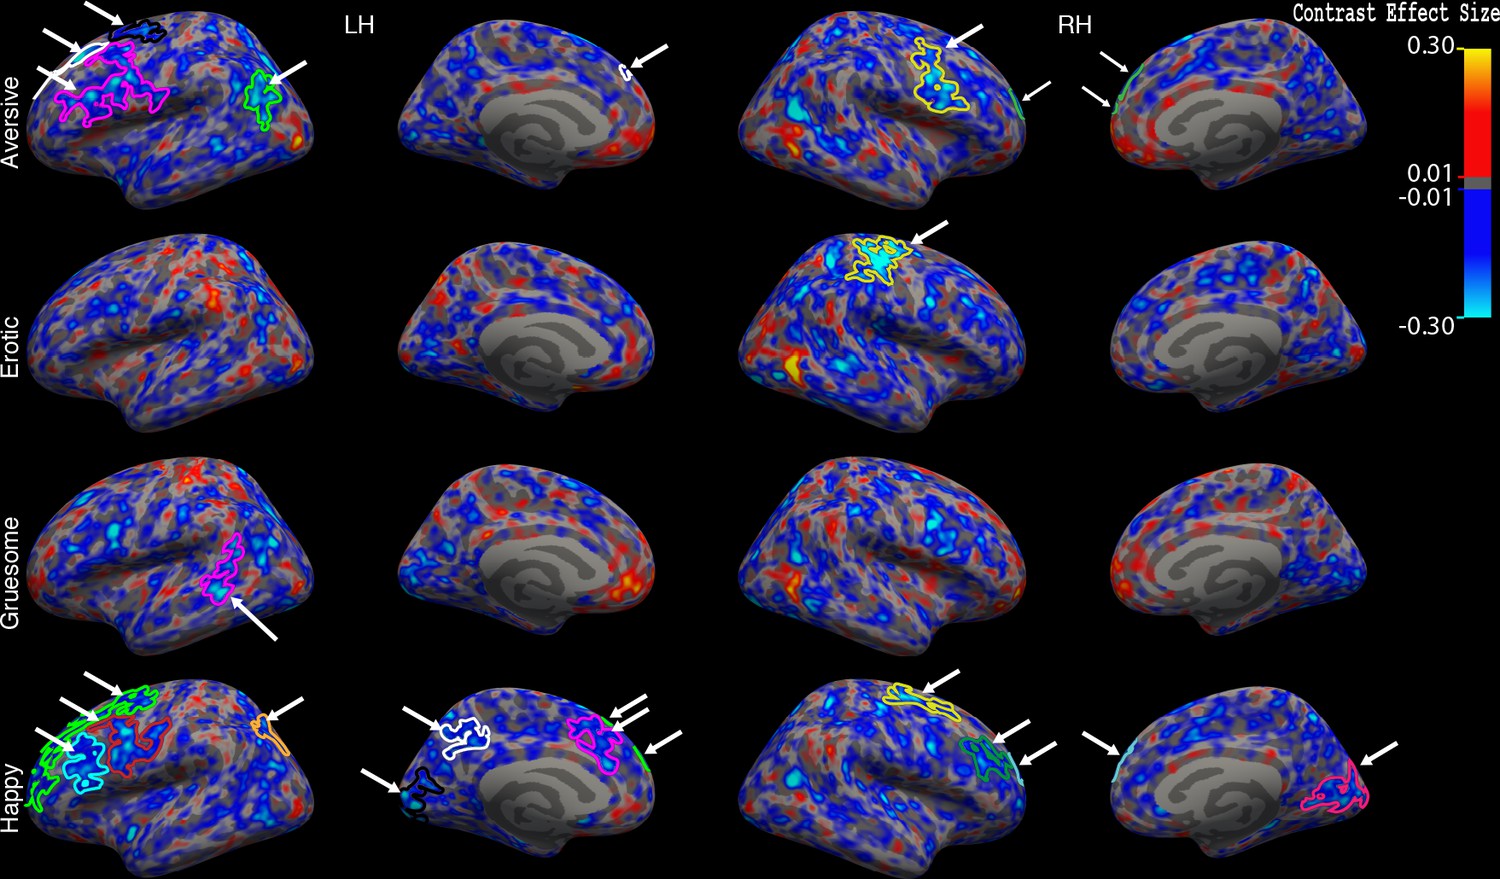
Interaction of group x gender for aversive, erotic, gruesome, and happy stimuli vs. neutral stimuli.
Significant clusters are indicated by arrows shown on interaction maps of contrast values for each of the four emotions vs. neutral (similar to the center image in Figure 4 and Figure 5). All four brain surfaces are shown (from left: left lateral, left medial, right lateral, and right medial). Blue regions indicate less activation contrast (emotion vs. neutral) for ALCM relative to NCM vs. ALCW relative to NCW. Abbreviations: RH = Right Hemisphere; LH = Left Hemisphere.
Tables
Table 1
Peak voxel or vertex labels of significant clusters for group contrasts of each emotion vs. neutral condition.
Significant clusters (p<0.05 after correction for multiple comparisons) were observed for comparisons between alcoholic and control groups (for the entire sample and for men and women separately), along with group x gender interactions, for each of the four contrasts between each emotion condition compared to the neutral condition. Cortical regions were determined from the peak voxel or vertex. Overall, the table shows that the ALCM had widespread abnormalities in response to emotional stimuli, and that these effects were significantly different than the effects for the ALCW. Details are described in the text, Figure 4, Figure 5, and Figure 6, and in Appendix 1—tables 5, 6 and 7. Abbreviations: ACC = anterior cingulate cortex; L = left hemisphere; R = right hemisphere; ALCW = alcoholic women; ALCM = alcoholic men; NCW = nonalcoholic control women; NCM = nonalcoholic control men; ns = not significant; BanksSTS = banks, superior temporal sulcus.
| Lobe | Region at peak | ALC vs. NC | ALCW vs. NCW | ALCM vs. NCM | Interaction |
|---|---|---|---|---|---|
| Frontal | Caudal Middle Frontal | ns | ns | ns | aversive (L) |
| Medial Orbitofrontal | ns | ns | ALCM > NCM: aversive (R) | ns | |
| Rostral ACC | ALC > NC: aversive (L) | ns | ALCM > NCM: aversive (L) | ns | |
| Rostral Middle Frontal | ns | ns | ALCM < NCM: happy (R) | happy (L,R), aversive (R) | |
| Precentral | ns | ns | ALCM < NCM: aversive (L,R), happy (L,R), erotic (R) | aversive (L), happy (L,R), erotic (R) | |
| Superior Frontal | ns | ALCW > NCW: happy (L) | ALCM < NCM: aversive (R), erotic (R) | aversive (L), happy (R) | |
| Caudal ACC | ns | ns | ns | happy (L) | |
| Parietal | Inferior Parietal | ALC < NC: happy (L) | ns | ALCM < NCM: aversive (L,R), happy (L) | aversive (L), happy (L) |
| Postcentral | ALC > NC: erotic (L) | ns | ns | ns | |
| Precuneus | ns | ns | ns | happy (L) | |
| Superior Parietal | ns | ns | ALCM < NCM: happy (R) | ns | |
| Supramarginal | ns | ALCW > NCW: aversive (L) | ns | ns | |
| Temporal | BanksSTS | ns | ns | ALCM < NCM: gruesome (L) | gruesome (L) |
| Parahippocampal | ns | ns | ns | erotic (L) | |
| Cuneus | ns | ns | ns | happy (R) | |
| Pericalcarine | ns | ns | ns | happy (L) | |
| Subcortical | Thalamus | ns | ns | ALCM < NCM: happy (R) | ns |
| Cerebellum | Cerebellum | ns | ns | ns | happy (L), aversive (L) |
Appendix 1—table 1
Participants’ characteristics and drinking measures.
Values presented as mean ± standard deviation. Abbreviations: ALCW = Alcoholic women; ALCM = Alcoholic men; NCW = Nonalcoholic control women; NCM = Nonalcoholic control men; DHD = Duration of Heavy Drinking (>21 drinks per week) in years; DD = Daily drinks; LOS = Length of sobriety in years. HRSD = Hamilton Rating Scale for Depression (Hamilton, 1960); VIQ = Wechsler Adult Intelligence Scale, 3rd ed. Verbal Intelligence Quotient; PIQ = Wechsler Adult Intelligence Scale, 3rd ed. Performance Intelligence Quotient; WMS DMI = Wechsler Memory Scale, 3rd ed. Delayed (General) Memory Index. Significant differences: a(ALCM > NCM, p<0.05); b(ALCM > NCM, p<0.001); c(ALCW > NCW, p<0.01); d(ALCW > NCW, p<0.001); e(ALCW > ALCM, p<0.001); f(ALCM > ALCW, p<0.05); g(NCW >NCM, p<0.05); h(NCW >NCM, p<0.01); i(group x gender interaction, p<0.05). jLOS values were not applicable for two NCM and four NCW who reported never drinking.
| Measure | ALCW N = 25 | ALCM N = 17 | NCW N = 24 | NCM N = 22 | ||||||||
|---|---|---|---|---|---|---|---|---|---|---|---|---|
| Age | 52.0 | ± | 10.6 | 53.2 | ± | 9.7 | 54.4 | ± | 15.4 | 55.0 | ± | 12.4 |
| Educationg | 15.3 | ± | 2.3 | 13.8 | ± | 2.5 | 16.1 | ± | 2.6 | 14.8 | ± | 1.9 |
| VIQ | 110.4 | ± | 16.6 | 107.0 | ± | 15.0 | 113.2 | ± | 17.8 | 109.9 | ± | 11.1 |
| PIQ | 106.9 | ± | 17.7 | 100.1 | ± | 12.5 | 111.2 | ± | 16.9 | 107.1 | ± | 11.8 |
| WMS DMIe,h | 119.1 | ± | 15.9 | 99.0 | ± | 10.3 | 117 | ± | 17.3 | 105.0 | ± | 14.0 |
| HRSDa,c | 3.4 | ± | 3.5 | 3.6 | ± | 4.7 | 1.2 | ± | 2.2 | 1.0 | ± | 1.2 |
| DHDb,d | 13.3 | ± | 6.4 | 14.6 | ± | 6.2 | 0.0 | ± | 0.0 | 0.0 | ± | 0.0 |
| DDb,d,f,i | 6.9 | ± | 6.3 | 12.9 | ± | 9.6 | 0.2 | ± | 0.3 | 0.4 | ± | 0.5 |
| LOSj | 7.3 | ± | 8.9 | 7.5 | ± | 11.9 | 6.2 | ± | 11.8 | 0.9 | ± | 1.5 |
Appendix 1—table 2
Neuropsychological and affect scores for alcoholic men and women.
Values presented as mean ± standard deviation. Abbreviations: ALCW = alcoholic women; ALCM = alcoholic men; NCW = nonalcoholic control women; NCM = nonalcoholic control men; Abbreviations: FSIQ = Wechsler Adult Intelligence Scale, 3rd ed. Full Scale Intelligence Quotient; WMS IMI = Wechsler Memory Scale, 3rd ed. Immediate Memory Index; WMS WMI = Wechsler Memory Scale, 3rd ed. Working Memory Index; POMS = Profile of Mood States (McNair, 1971); MAACL = Multiple Affective Adjective Checklist (Zuckerman and Lubin, 1985). Significant differences: a(ALCM >NCM, p<0.05); b(ALCW > NCW, p<0.05); c(ALCW > ALCM, p<0.05); d(ALCW < ALCM, p<0.05); e(ALCM <ALCW, p<0.001); f(NCM >NCW, p<0.05); g(NCM <NCW, p<0.05); h(NCM <NCW, p<0.01).
| Measure | ALCW N = 25 | ALCM N = 17 | NCW N = 24 | NCM N = 22 | ||||||||
|---|---|---|---|---|---|---|---|---|---|---|---|---|
| FSIQ | 109.7 | ± | 17.2 | 104.3 | ± | 13.5 | 113.5 | ± | 17.6 | 109.4 | ± | 10.3 |
| WMS IMIe,h | 117.4 | ± | 17.4 | 94.8 | ± | 11.0 | 116.2 | ± | 17.5 | 102.9 | ± | 14.2 |
| WMS WMI | 103.9 | ± | 15.9 | 104.6 | ± | 11.3 | 110.2 | ± | 15.0 | 102.9 | ± | 10.3 |
| POMS Tensiona,b | 38.7 | ± | 9.3 | 39.1 | ± | 6.4 | 33.6 | ± | 6.3 | 34.9 | ± | 5.9 |
| POMS Depressiona,b,f | 38.9 | ± | 8.2 | 42.4 | ± | 7.0 | 34.5 | ± | 4.2 | 37.5 | ± | 4.1 |
| POMS Angera,b | 43.1 | ± | 6.8 | 44.5 | ± | 7.3 | 39.8 | ± | 3.5 | 39.9 | ± | 4.0 |
| POMS Vigorb | 59.4 | ± | 11.3 | 60.8 | ± | 7.7 | 66.3 | ± | 10.2 | 61.9 | ± | 7.7 |
| POMS Fatigue | 44.1 | ± | 9.2 | 46.4 | ± | 8.5 | 41.0 | ± | 6.6 | 42.7 | ± | 5.6 |
| POMS Confusionb | 41.3 | ± | 8.2 | 42.3 | ± | 7.6 | 36.7 | ± | 5.2 | 38.6 | ± | 6.6 |
| MAACL Anxiety | 51.6 | ± | 17.0 | 47.1 | ± | 11.8 | 44.3 | ± | 13.0 | 44.1 | ± | 6.8 |
| MAACL Depression | 56.9 | ± | 26.6 | 57.4 | ± | 32.2 | 47.5 | ± | 12.9 | 46.8 | ± | 7.7 |
| MAACL Hostility | 49.4 | ± | 12.3 | 45.3 | ± | 6.2 | 46.9 | ± | 13.0 | 43.5 | ± | 3.2 |
| MAACL Positive Affectc,g | 62.2 | ± | 8.4 | 57.6 | ± | 4.6 | 64.9 | ± | 7.0 | 60.6 | ± | 6.9 |
| MAACL Sensation Seekingd | 51.4 | ± | 6.8 | 49.1 | ± | 8.1 | 55.5 | ± | 6.8 | 50.3 | ± | 6.8 |
| MAACL Dysphoria | 53.8 | ± | 22.8 | 47.6 | ± | 17.4 | 44.7 | ± | 16.3 | 42.7 | ± | 6.5 |
| MAACL Positive Affect Sensation Seekingc,f | 59.7 | ± | 8.0 | 55.5 | ± | 4.7 | 63.3 | ± | 6.6 | 58.5 | ± | 6.3 |
Appendix 1—table 3
Analysis of variance for percentage of pictures rated.
Abbreviations: DF = degrees of freedom. Significance codes: ***p<0.001; *p<0.05
| Sum of squares | Mean square | Numerator DF | Denominator DF | F | p-value | ||
|---|---|---|---|---|---|---|---|
| Condition | 0 | 0 | 4 | 1080 | 0 | 1.00 | |
| Rating | 16152 | 8076 | 2 | 1080 | 24.47 | 4.04E-11 | *** |
| Group | 0 | 0 | 1 | 1080 | 0 | 1.00 | |
| Gender | 0 | 0 | 1 | 1080 | 0 | 1.00 | |
| Condition x Rating | 1208715 | 151089 | 8 | 1080 | 457.84 | 2.20E-16 | *** |
| Condition x Group | 0 | 0 | 4 | 1080 | 0 | 1.00 | |
| Rating x Group | 1880 | 940 | 2 | 1080 | 2.85 | 0.06 | |
| Condition x Gender | 0 | 0 | 4 | 1080 | 0 | 1.00 | |
| Rating x Gender | 8326 | 4163 | 2 | 1080 | 12.62 | 3.84E-06 | *** |
| Group x Gender | 0 | 0 | 1 | 1080 | 0 | 1.00 | |
| Condition x Rating x Group | 5200 | 650 | 8 | 1080 | 1.97 | 0.02 | * |
| Condition x Rating x Gender | 34694 | 4337 | 8 | 1080 | 13.14 | 2.20E-16 | *** |
| Condition x Group x Gender | 0 | 0 | 4 | 1080 | 0 | 1.00 | |
| Rating x Group x Gender | 1525 | 762 | 2 | 1080 | 2.31 | 0.10 | |
| Condition x Rating x Group x Gender | 4762 | 595 | 8 | 1080 | 1.8 | 0.07 |
Appendix 1—table 4
Analysis of variance for reaction times of pictures rated.
Abbreviations: DF = degrees of freedom. Significance codes: ***p<0.001
| Sum of squares | Mean square | Numerator DF | Denominator DF | F | p-value | ||
|---|---|---|---|---|---|---|---|
| Condition | 2614420 | 653605 | 4 | 746.22 | 4.843 | 7.34E-04 | *** |
| Rating | 7536931 | 3768465 | 2 | 750.69 | 27.921 | 2.01E-12 | *** |
| Group | 46807 | 46807 | 1 | 80.48 | 0.347 | 0.56 | |
| Gender | 119106 | 119106 | 1 | 80.48 | 0.882 | 0.35 | |
| Condition x Rating | 49431086 | 6178886 | 8 | 744.53 | 45.779 | 2.20E-16 | *** |
| Condition x Group | 540297 | 135074 | 4 | 746.22 | 1.001 | 0.41 | |
| Rating x Group | 428401 | 214201 | 2 | 750.69 | 1.587 | 0.20 | |
| Condition x Gender | 900660 | 225165 | 4 | 746.22 | 1.668 | 0.15 | |
| Rating x Gender | 2152290 | 1076145 | 2 | 750.69 | 7.973 | 3.75E-04 | *** |
| Group x Gender | 3721 | 3721 | 1 | 80.48 | 0.028 | 0.87 | |
| Condition x Rating x Group | 1230435 | 153804 | 8 | 744.53 | 1.14 | 0.33 | |
| Condition x Rating x Gender | 1950493 | 243812 | 8 | 744.53 | 1.806 | 0.07 | |
| Condition x Group x Gender | 286187 | 71547 | 4 | 746.22 | 0.53 | 0.71 | |
| Rating x Group x Gender | 220441 | 110221 | 2 | 750.69 | 0.817 | 0.44 | |
| Condition x Rating x Group x Gender | 1248592 | 156074 | 8 | 744.53 | 1.156 | 0.32 |
Appendix 1—table 5
Cortical brain activation differences between alcoholic and nonalcoholic control participants.
MNI305 coordinates for peak voxel within significant clusters of activation showing difference between alcoholic and nonalcoholic control participants determined by surface-based whole brain analyses in (a) all subjects, (b) women only, and (c) men only. Abbreviations: LH = left hemisphere; RH = right hemisphere; Max = maximum −log10(p-value) in the cluster; VtxMax = vertex number at the maximum; size = surface area of cluster; XYZ = the MNI coordinates of the maximum; CWP = clusterwise p-value further corrected for the three spaces of left cortex, right cortex, and volume; CWPLow and CWPHi = 90% confidence interval for CWP; NVtxs = number of vertices in the cluster; ALC = alcoholic participants; NC = nonalcoholic Control participants.
| Structure | Max | VtxMax | Size (mm2) | X | Y | Z | CWP | CWPLow | CWPHi | NVtxs | Contrast | Comparison |
|---|---|---|---|---|---|---|---|---|---|---|---|---|
| A. All Participants | ||||||||||||
| Inferior Parietal Gyrus (LH) | −3.307 | 104494 | 876.17 | −40.6 | −76.1 | 21.6 | 0.00180 | 0.00090 | 0.00270 | 1560 | happy | ALC < NC |
| Rostral Anterior Cingulate (LH) | 3.497 | 37787 | 784.55 | −6.6 | 24.1 | −9.7 | 0.01106 | 0.00867 | 0.01344 | 1397 | aversive | ALC > NC |
| Postcentral Gyrus (LH) | 4.460 | 29054 | 798.38 | −48.8 | −25.1 | 47.1 | 0.01046 | 0.00838 | 0.01284 | 1852 | erotic | ALC > NC |
| B. Women | ||||||||||||
| Superior Frontal Gyrus (LH) | 4.392 | 73009 | 838.05 | −7.4 | 39.1 | 30.0 | 0.00659 | 0.00479 | 0.00838 | 2333.2 | happy | ALCW > NCW |
| Supramarginal Gyrus (LH) | 3.399 | 6263 | 662.10 | −51.5 | −52.8 | 25.6 | 0.03469 | 0.03058 | 0.03879 | 1457 | aversive | ALCW > NCW |
| C. Men | ||||||||||||
| Inferior Parietal (LH) | −4.829 | 117735 | 640.53 | −26.7 | −63.2 | 34.5 | 0.04287 | 0.0385 | 0.04724 | 1366 | aversive | ALCM < NCM |
| Inferior Parietal (LH) | −4.124 | 47811 | 1371.62 | −40.1 | −75 | 22.2 | 0.0003 | 0 | 0.0006 | 2633 | happy | ALCM < NCM |
| Inferior Parietal Gyrus (RH) | −3.35 | 157480 | 916.21 | 30.7 | −63 | 39.6 | 0.00389 | 0.0027 | 0.00539 | 1717 | aversive | ALCM < NCM |
| Inferior Parietal (RH) | −4.212 | 68984 | 714.12 | 44.1 | −57 | 14.7 | 0.02322 | 0.01997 | 0.02646 | 1489 | aversive | ALCM < NCM |
| Medial Orbitofrontal (RH) | 3.771 | 125131 | 874.65 | 11.8 | 45.8 | −4.1 | 0.00509 | 0.0036 | 0.00659 | 1476 | aversive | ALCM > NCM |
| Precentral (LH) | −4.165 | 30289 | 1617.73 | −40.8 | 0.9 | 27.5 | 0.0003 | 0 | 0.0006 | 3248 | aversive | ALCM < NCM |
| Precentral (LH) | −4.782 | 66552 | 1845.52 | −39.5 | 1.4 | 26.3 | 0.0003 | 0 | 0.0006 | 3529 | happy | ALCM < NCM |
| Precentral (RH) | −4.265 | 60264 | 808 | 51.2 | 3.9 | 30.9 | 0.01046 | 0.00838 | 0.01284 | 1668 | aversive | ALCM < NCM |
| Precentral (RH) | −2.771 | 118687 | 831.46 | 23.6 | −6.5 | 46.4 | 0.00927 | 0.00718 | 0.01136 | 1810 | happy | ALCM < NCM |
| Precentral (RH) | −3.442 | 92562 | 1459.97 | 40.3 | −9.3 | 60 | 0.0003 | 0 | 0.0006 | 3278 | erotic | ALCM < NCM |
| Rostral Anterior Cingulate (LH) | 3.937 | 117327 | 739.44 | −6.3 | 33.3 | −7.8 | 0.01789 | 0.01493 | 0.02085 | 1373 | aversive | ALCM > NCM |
| Rostral Middle Frontal (RH) | −3.615 | 116765 | 1340.96 | 33.6 | 30.1 | 32.8 | 0.0003 | 0 | 0.0006 | 2268 | happy | ALCM < NCM |
| Rostral Middle Frontal (RH) | −4.17 | 103943 | 775.78 | 22.4 | 62.2 | 2 | 0.01284 | 0.01046 | 0.01522 | 996 | happy | ALCM < NCM |
| Superior Frontal (RH) | −5.827 | 93897 | 1018.4 | 25.8 | 24.1 | 38.9 | 0.0009 | 0.0003 | 0.0015 | 2033 | aversive | ALCM < NCM |
| Superior Frontal (RH) | −3.971 | 35035 | 639.33 | 17.7 | 56.2 | 17.3 | 0.04636 | 0.04171 | 0.05101 | 977 | aversive | ALCM < NCM |
| Superior Frontal (RH) | −3.718 | 35035 | 774.08 | 17.7 | 56.2 | 17.3 | 0.01374 | 0.01106 | 0.01641 | 1212 | erotic | ALCM < NCM |
| Superior Parietal (RH) | −4.14 | 74265 | 791.49 | 24.9 | −77.7 | 34.2 | 0.01136 | 0.00897 | 0.01374 | 1313 | happy | ALCM < NCM |
| Banks, Superior Temporal Sulcus (LH) | −3.174 | 27674 | 637.52 | −55.7 | −46 | −1.4 | 0.04375 | 0.03937 | 0.0484 | 1387 | gruesome | ALCM < NCM |
Appendix 1—table 6
Cortical brain activation regions corresponding to the interactions between gender and alcoholism.
MNI305 coordinates for peak voxel within significant clusters of activation showing group x gender interaction for emotion (happy, aversive, gruesome, and erotic vs. neutral) from surface-based, and volumetric whole brain analyses. Abbreviations: LH = left hemisphere; RH = right hemisphere; Max = maximum −log10(p-value) in the cluster; VtxMax = vertex number at the maximum; Size = surface area of cluster; XYZ = Montreal Neurological Institute (MNI) coordinates of the maximum; CWP = clusterwise p-value further corrected for the three spaces of left cortex, right cortex, and volume; CWPLow and CWPHi = 90% confidence interval for CWP; NVtxs = number of vertices in the cluster.
| Structure | Max | VtxMax | Size (mm2) | X | Y | Z | CWP | CWPLow | CWPHi | NVtxs | Contrast |
|---|---|---|---|---|---|---|---|---|---|---|---|
| Superior Frontal (LH) | −2.349 | 152510 | 675.48 | −19.7 | 6.8 | 57.1 | 0.03293 | 0.02911 | 0.03703 | 1451 | aversive |
| Superior Frontal (RH) | −3.900 | 67995 | 825.33 | 16.4 | 58.5 | 14.1 | 0.00957 | 0.00748 | 0.01165 | 1204 | happy |
| Rostral Middle Frontal (LH) | −4.069 | 3407 | 3086.86 | −25.8 | 47.0 | 15.3 | 0.00030 | 0.00000 | 0.00060 | 5250 | happy |
| Rostral Middle Frontal (LH) | −3.467 | 4907 | 1022.51 | −40.3 | 28.4 | 20.7 | 0.00090 | 0.00030 | 0.00150 | 1907 | happy |
| Rostral Middle Frontal (RH) | −3.254 | 116765 | 984.31 | 33.6 | 30.1 | 32.8 | 0.00210 | 0.00120 | 0.00300 | 1677 | happy |
| Rostral Middle Frontal (RH) | −4.624 | 42522 | 753.58 | 22.9 | 54.4 | 17.0 | 0.01522 | 0.01255 | 0.01789 | 1119 | aversive |
| Caudal Middle Frontal (LH) | −4.250 | 76029 | 2047.63 | −43.1 | 2.8 | 47.2 | 0.00030 | 0.00000 | 0.00060 | 4069 | aversive |
| Caudal Middle Frontal (LH) | −6.084 | 47079 | 957.26 | −27.3 | 21.3 | 36.0 | 0.00180 | 0.00090 | 0.00270 | 1728 | aversive |
| Inferior Parietal (LH) | −3.003 | 68612 | 660.83 | −38.8 | −55.1 | 21.4 | 0.03733 | 0.03323 | 0.04141 | 1423 | aversive |
| Inferior Parietal (LH) | −2.822 | 12076 | 689.53 | −29.4 | −65.2 | 40.4 | 0.02794 | 0.02440 | 0.03146 | 1405 | happy |
| Precentral (LH) | −4.363 | 80254 | 1602.74 | −46.4 | −2.0 | 38.6 | 0.00030 | 0.00000 | 0.00060 | 3292 | happy |
| Precentral (RH) | −4.268 | 26942 | 1245.03 | 50.9 | 3.4 | 31.0 | 0.00030 | 0.00000 | 0.00060 | 2436 | aversive |
| Precentral (RH) | −3.352 | 1446 | 923.39 | 23.5 | −5.5 | 46.5 | 0.00389 | 0.00270 | 0.00539 | 2049 | happy |
| Precentral (RH) | −3.211 | 145233 | 1749.60 | 36.1 | −20.1 | 52.8 | 0.00030 | 0.00000 | 0.00060 | 3917 | erotic |
| Pericalcarine (LH) | −5.885 | 12910 | 1431.93 | −5.0 | −69.9 | 11.4 | 0.00030 | 0.00000 | 0.00060 | 1866 | happy |
| Precuneus (LH) | −2.594 | 69252 | 653.39 | −16.0 | −47.8 | 34.8 | 0.03937 | 0.03498 | 0.04375 | 1285 | happy |
| Cuneus (RH) | −3.366 | 86177 | 1658.66 | 5.4 | −84.3 | 19.6 | 0.00030 | 0.00000 | 0.00060 | 2305 | happy |
| Caudal Anterior Cingulate (LH) | −3.722 | 37463 | 670.38 | −6.7 | 29.1 | 22.1 | 0.03352 | 0.02970 | 0.03762 | 1297 | happy |
| Banks, Superior Temporal Sulcus (LH) | −4.428 | 86543 | 625.34 | −56 | −44.7 | −2.6 | 0.04782 | 0.04316 | 0.05246 | 1361 | gruesome |
Appendix 1—table 7
Significant brain activation differences determined through volumetric based comparisons.
MNI305 coordinates for peak voxel within significant clusters of activation determined through volumetric whole brain analyses. Abbreviations: LH = left hemisphere; RH = right hemisphere; Max = maximum −log10(p-value) in the cluster; XYZ = Montreal Neurological Institute (MNI) coordinates of the maximum; CWP = clusterwise p-value further corrected for the three spaces of left cortex, right cortex, and volume.
| Structure | Size (mm3) | X | Y | Z | CWP | Max | Comparison | Contrast |
|---|---|---|---|---|---|---|---|---|
| Parahippocampal Cortex (LH) | 15920 | −34 | −23 | −27 | 0.0007912 | −5.62445 | Group x Gender | erotic |
| Accumbens (LH) | 50016 | −10 | 5 | -9 | 0.000000 | 5.49738 | Control: male vs. female | erotic |
| Cerebellum Cortex (LH) | 15960 | −14 | −39 | −23 | 0.00020 | −3.790 | Group x Gender | happy |
| Cerebellum Cortex (LH) | 7224 | -8 | −45 | −13 | 0.0467673 | 3.25617 | Control: male vs. female | happy |
| Thalamus (RH) | 12384 | 6 | −19 | 11 | 0.0016394 | −3.93561 | Male: alc vs. control | happy |
| Cerebellum Cortex (LH) | 18648 | −22 | −79 | −29 | 0.0000831 | 4.05785 | Control: male vs. female | aversive |
| Cerebellum Cortex (LH) | 15240 | -6 | −41 | −19 | 0.00049 | −3.409 | Group x Gender | aversive |
Appendix 1—table 8
Brain activation clusters identified using a cluster forming threshold of p<0.001.
MNI305 coordinates for peak voxel within significant clusters of activation for emotion (happy, aversive, gruesome, and erotic vs. neutral) from surface-based and volumetric whole brain analyses. Abbreviations: LH = left hemisphere; RH = right hemisphere; Max = maximum −log10(p-value) in the cluster; VtxMax = vertex number at the maximum; Size = surface area of cluster; XYZ = Montreal Neurological Institute (MNI) coordinates of the maximum; CWP = clusterwise p-value further corrected for the three spaces of left cortex, right cortex, and volume; CWPLow and CWPHi = 90% confidence interval for CWP; NVtxs = number of vertices in the cluster; NC = nonalcoholic control group; ALC = alcoholic group.
| Structure | Max | VtxMax | Size (mm2) | X | Y | Z | CWP | CWPLow | CWPHi | NVtxs | Comparison | Contrast |
|---|---|---|---|---|---|---|---|---|---|---|---|---|
| Superior Frontal (RH) | 4.346 | 132708 | 151.42 | 8 | 46.6 | 43.5 | 0.00629 | 0.00449 | 0.00808 | 243 | NC: Men > Women | aversive |
| Caudal Middle Frontal (RH) | 4.129 | 37195 | 128.86 | 38.6 | 9.5 | 43.7 | 0.01641 | 0.01374 | 0.01937 | 191 | NC: Men > Women | aversive |
| Supramarginal (RH) | 4.118 | 74592 | 112.55 | 54.4 | −28.8 | 41.4 | 0.0344 | 0.03029 | 0.0385 | 283 | NC: Men > Women | aversive |
| Rostral Middle Frontal (RH) | −4.624 | 42522 | 108.77 | 22.9 | 54.4 | 17 | 0.03381 | 0.03 | 0.03791 | 144 | Group x Gender | aversive |
| Caudal Middle Frontal (LH) | −6.084 | 47079 | 106.95 | −27.3 | 21.3 | 36 | 0.04462 | 0.03996 | 0.04927 | 230 | Group x Gender | aversive |
| Inferior Parietal (LH) | −3.86 | 112079 | 107.78 | −28.8 | −65.7 | 40.3 | 0.04287 | 0.0385 | 0.04724 | 193 | Men: ALC < NC | happy |
Additional files
-
Transparent reporting form
- https://doi.org/10.7554/eLife.41723.021
Download links
A two-part list of links to download the article, or parts of the article, in various formats.
Downloads (link to download the article as PDF)
Open citations (links to open the citations from this article in various online reference manager services)
Cite this article (links to download the citations from this article in formats compatible with various reference manager tools)
Alcoholism gender differences in brain responsivity to emotional stimuli
eLife 8:e41723.
https://doi.org/10.7554/eLife.41723


