Quantitative proteomics reveals key roles for post-transcriptional gene regulation in the molecular pathology of facioscapulohumeral muscular dystrophy
- Fred Hutchinson Cancer Research Center, United States
Figures
Figure 1 with 1 supplement
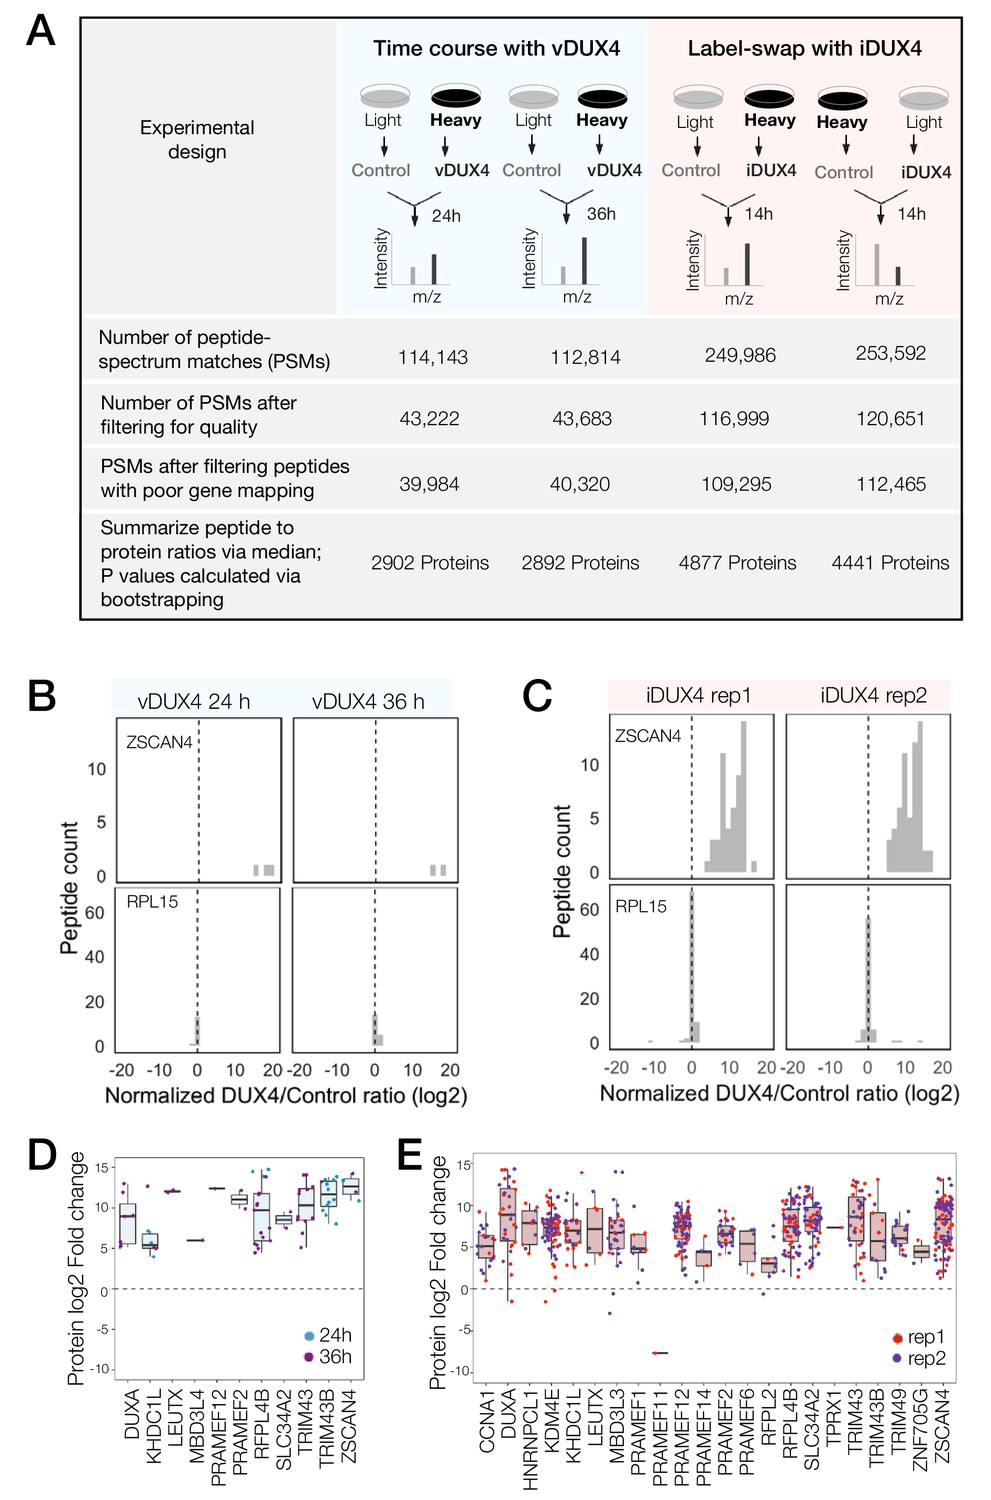
Quantitative mass spectrometry of DUX4-expressing cells.
(A) Schematic of the experimental set up and the subsequent data analysis steps used to measure protein fold change in cells expressing vDUX4 or iDUX4. (B) Histogram of normalized, log2-transformed DUX4/Control ratios for all peptides mapping to ZSCAN4, a DUX4 target gene (top panels), and for RPL15, a housekeeping gene (bottom panels), following 24 and 36 hr of vDUX4 expression. (C) Histogram of normalized, log2-transformed DUX4/Control ratios for all peptides mapping to ZSCAN4, a DUX4 target gene (top panels), and for RPL15, a housekeeping gene (bottom panels), in the two label-swap replicates of iDUX4 expression. (D) Box plot of normalized, log2-transformed DUX4/Control ratio for peptides corresponding to the FSHD biomarker transcripts identified by Yao et al. (2014) in the vDUX4 dataset. Each dot refers to an individual peptide that was quantified and the color represents the time point of vDUX4 expression (24 hours in blue and 36 hours in purple). (E) Box plot of normalized, log2-transformed DUX4/Control ratio for peptides corresponding to the FSHD biomarker transcripts identified by Yao et al. (2014) in the vDUX4 dataset. Each dot refers to an individual peptide that was quantified and the color denotes replicate 1 (red) or replicate 2 (purple) of iDUX4 expression.
Figure 1—figure supplement 1
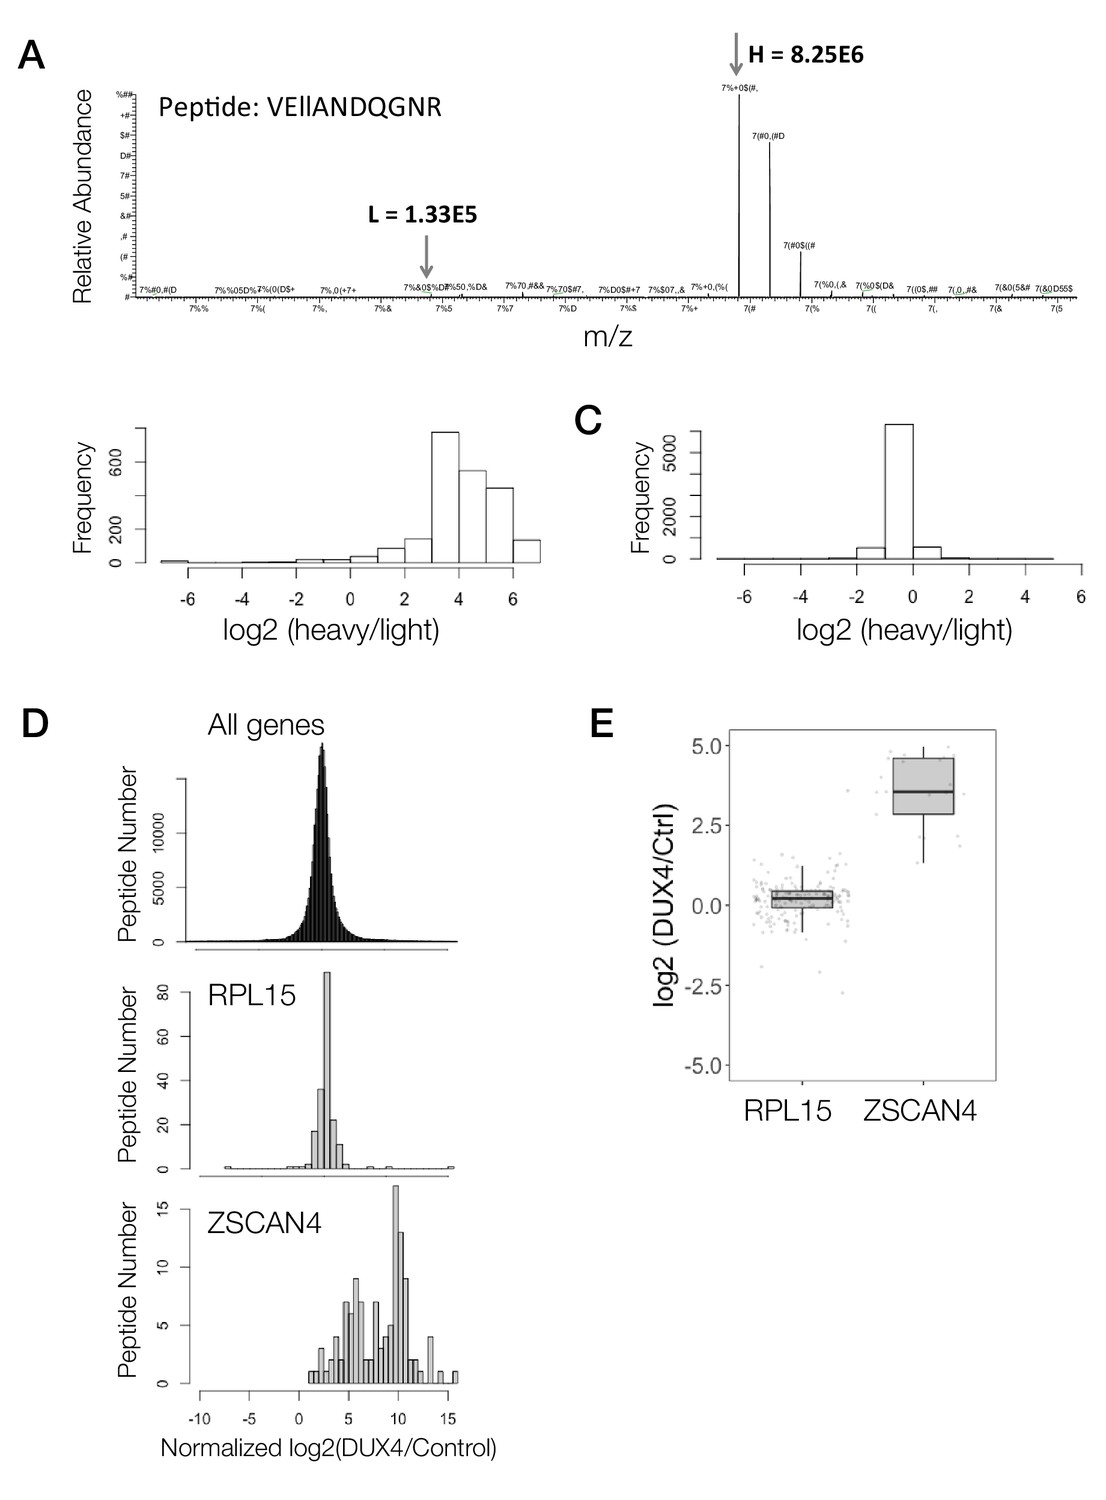
Demonstration of peptide to protein summarization for two candidate genes.
(A) The mass spectra for a representative peptide from a heavy-labeled sample. (B) Histogram of log2-ransformed heavy to light ratio of peptides from cells labeled with heavy amino acids for 1 week. (C) Histogram of log2-transformed heavy to light ratio of peptides from an equal mixture of unlabeled cells with cells labeled with heavy amino acids for 1 week. (D) Histogram shows the DUX4/Control ratios (log2) for all peptides in the iDUX4 dataset (top panel), for peptides mapping to RPL15 (middle panel) or for peptides mapping to ZSCAN4 (bottom panel). (E)Box and whisker plot showing the median log2 DUX4/control ratios for RPL15 and ZSCAN4.
Figure 2

Concordant changes in the RNA and protein abundance of several DUX4 transcriptional targets.
(A) Table showing number of genes with fold changes in their RNA and protein levels in the iDUX4 datasets. (B) Scatter plot of log2 fold change in RNA levels (DUX4/control) versus log2 fold change in protein levels (DUX4/control) for all genes. (C) Gene Ontology analysis of genes that are up- or downregulated > 4-fold at the RNA or protein level. Multiple testing correction was performed using a Benjamini–Hochberg procedure. (D) Fluorescence micrographs of cells with and without DUX4 induction for 14 hr, stained with DAPI (blue), anti-GM130 (Golgi apparatus; in green) and phalloidin-555 (actin; in red). (E) Quantification of the percentage of cells with DUX4-positive nuclei and fragmented Golgi apparatus at 12 hr and 24 hr post doxycycline induction of DUX4 expression. Error bars represent standard deviations.
Figure 3
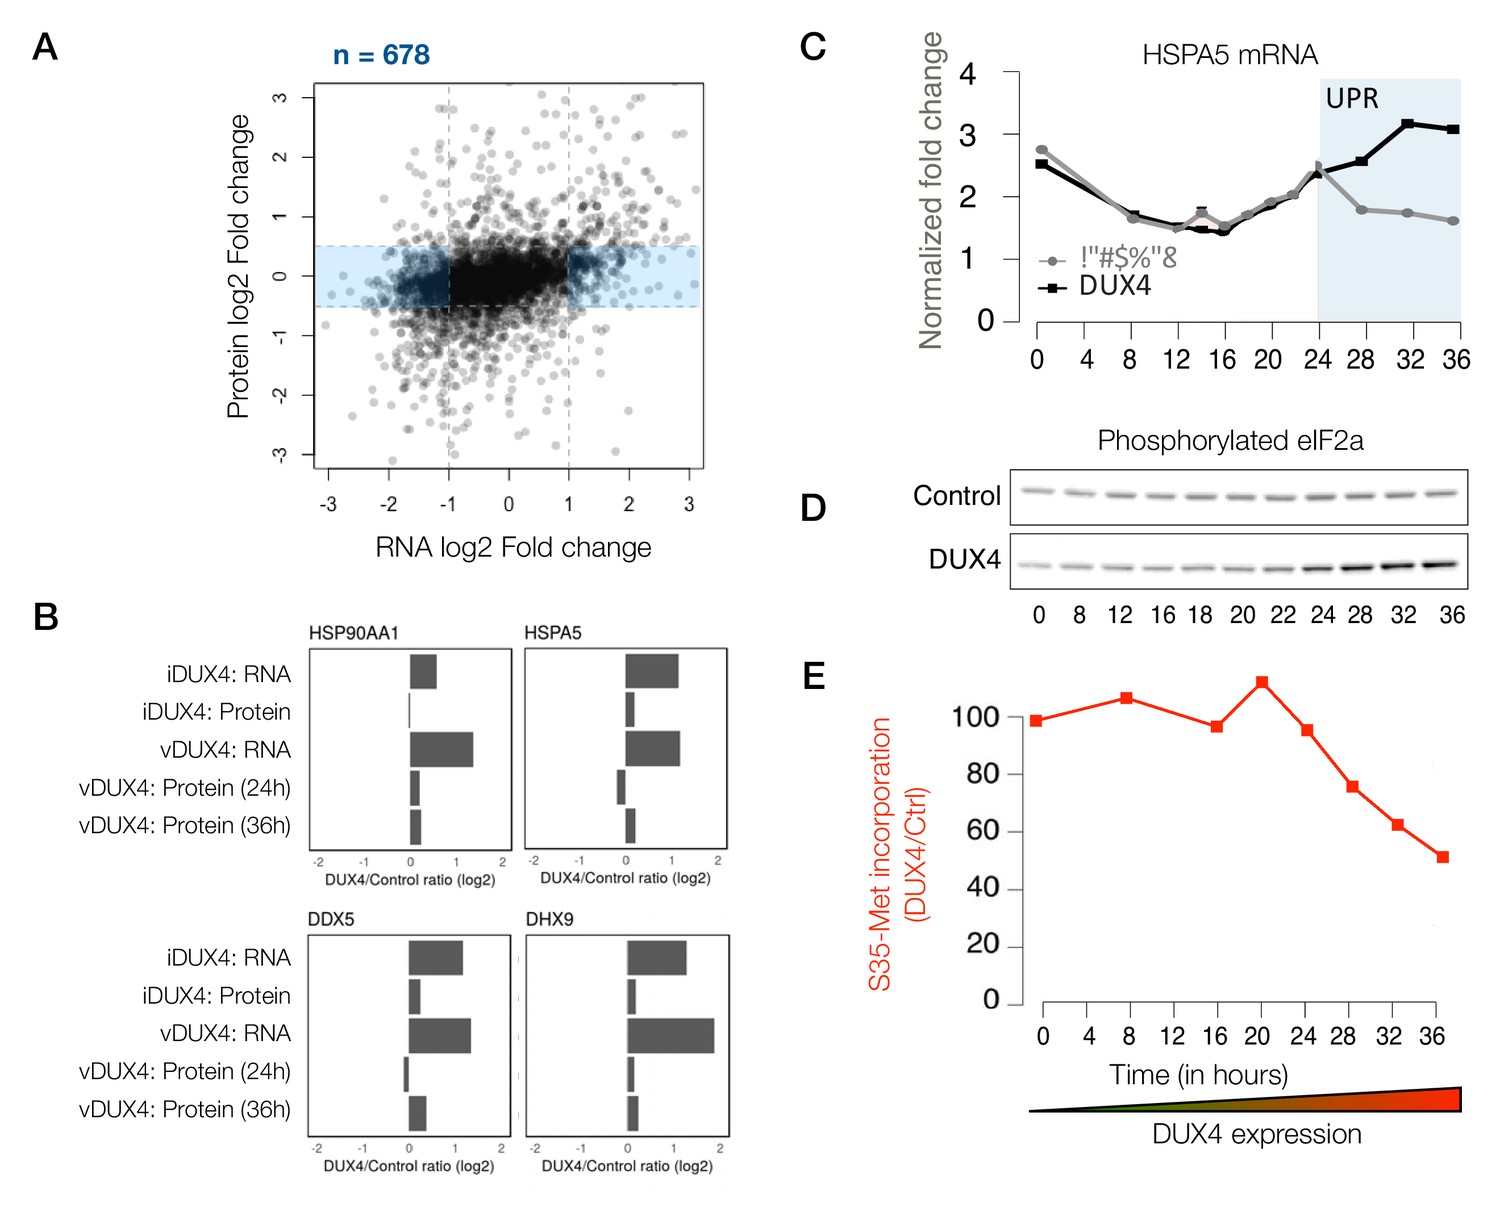
Extensive post-transcriptional buffering of stress-response genes in DUX4-expressing cells.
(A) Scatter plot of log2 fold change in RNA levels (DUX4/control) versus log2 fold change in protein levels (DUX4/control). Genes that are upregulated at the RNA level but no significant change at the protein level fall within the blue rectangle. (B) RNA and protein fold change across the different datasets for representative genes that show post-transcriptional buffering. (C) Changes in the RNA levels of the chaperone HSPA5 over the duration of vDUX4 expression (or control expression) as measured by qRT-PCR. The region shaded in blue represents the region where the vDUX4 sample significantly deviates from the Control because of the induction of the unfolded protein response (UPR). (D) Levels of phosphorylated eIF2α in control cells versus DUX4-expressing cells over an expression time course as detected by immunoblots. (E) Percentage of [35S]-Methionine incorporation (representing translation efficiency) in DUX4-expressing cells normalized over control cells during the time course of DUX4 expression.
Figure 4
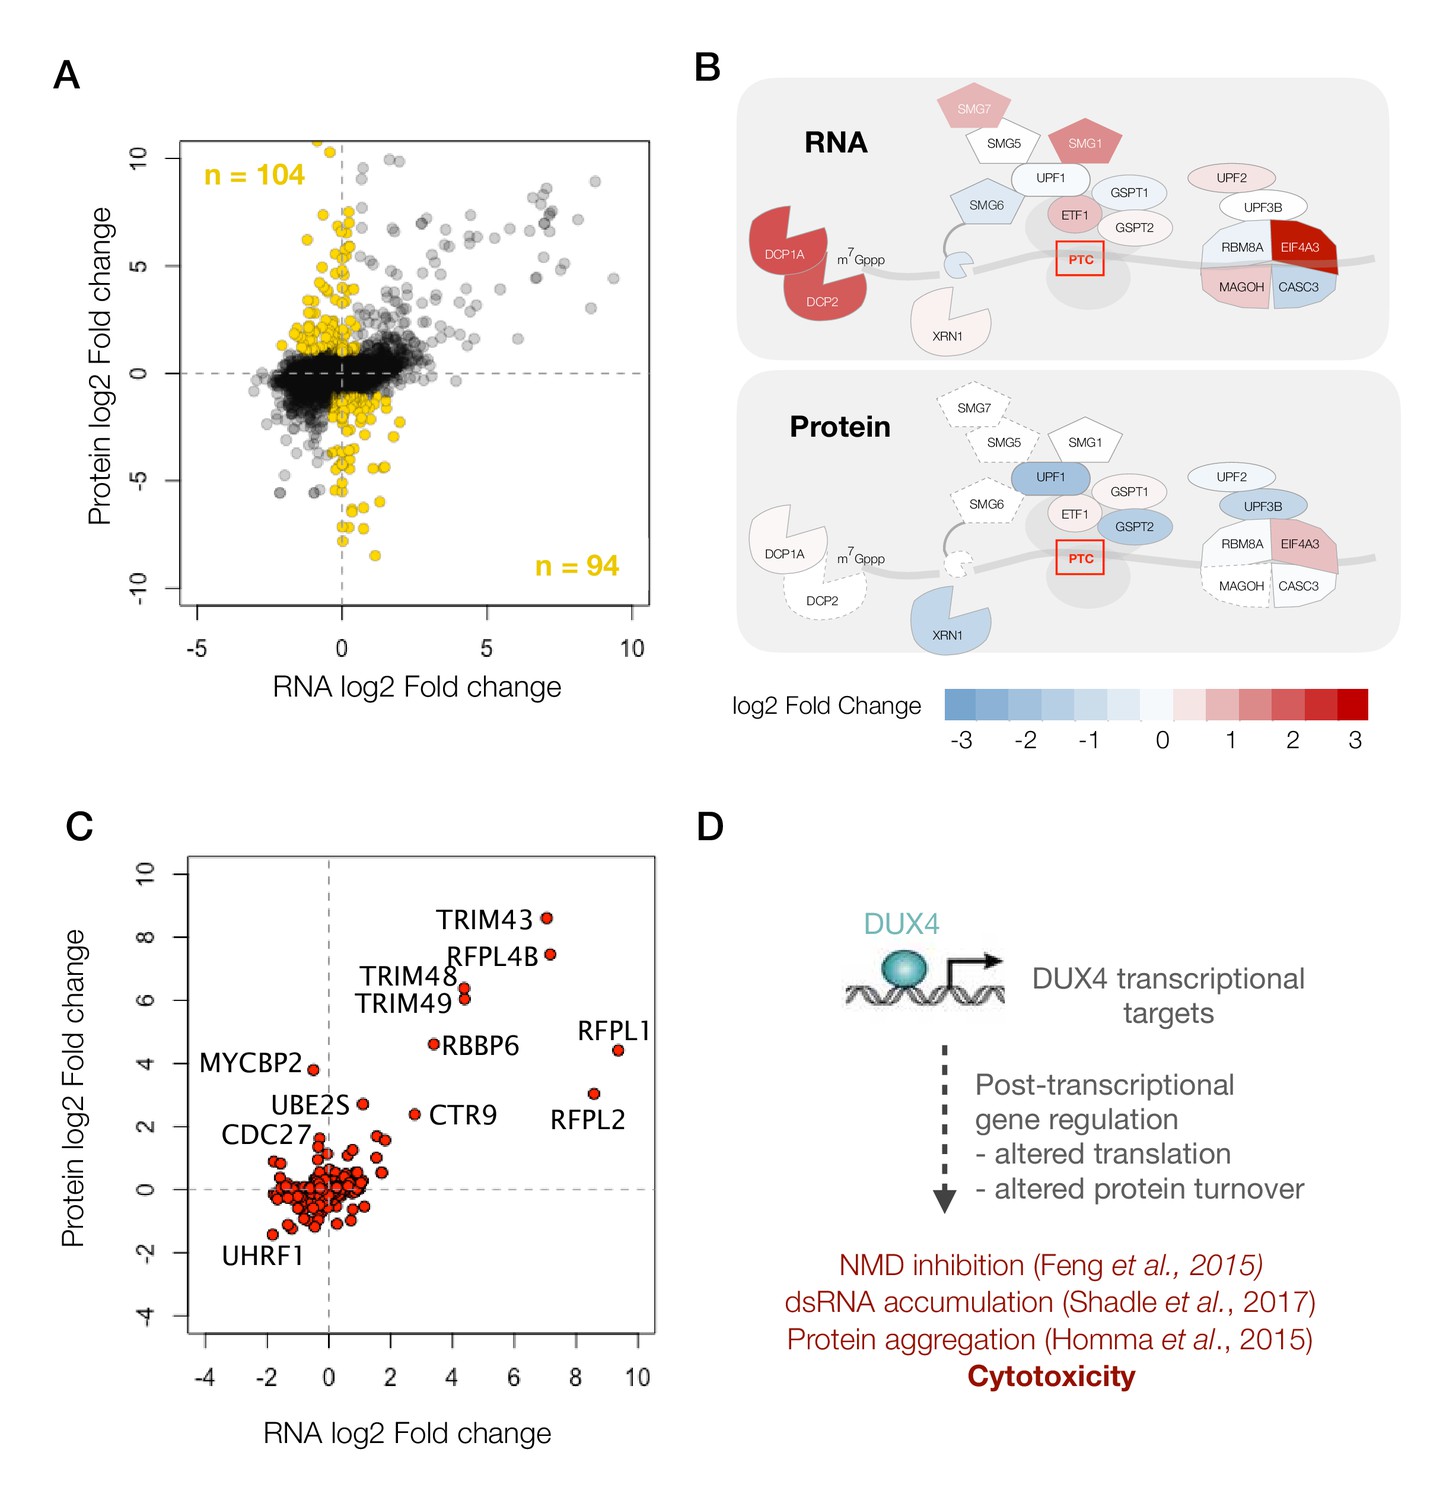
DUX4 induces post-transcriptional gene regulation.
(A) Scatter plot of log2 fold change in RNA levels (DUX4/control) versus log2 fold change in protein levels (DUX4/control). The post-transcriptional regulation of genes results in drastic changes in protein level without major changes in RNA levels (highlighted in gold). (B) Schematic representation of RNA- and protein-level changes for the genes involved in mRNA surveillance. Colors represent a heat map of actual fold changes in RNA levels (top) and in protein levels (bottom). Proteins with fewer than two quantified peptides are outlined by dotted lines. (C) Scatter plot of log2 fold change in RNA levels (DUX4/control) versus log2 fold change in protein levels (DUX4/control) for genes in the ubiquitin proteasome pathway. (D)Model for DUX4-induced post-transcriptional gene regulation.
Figure 5
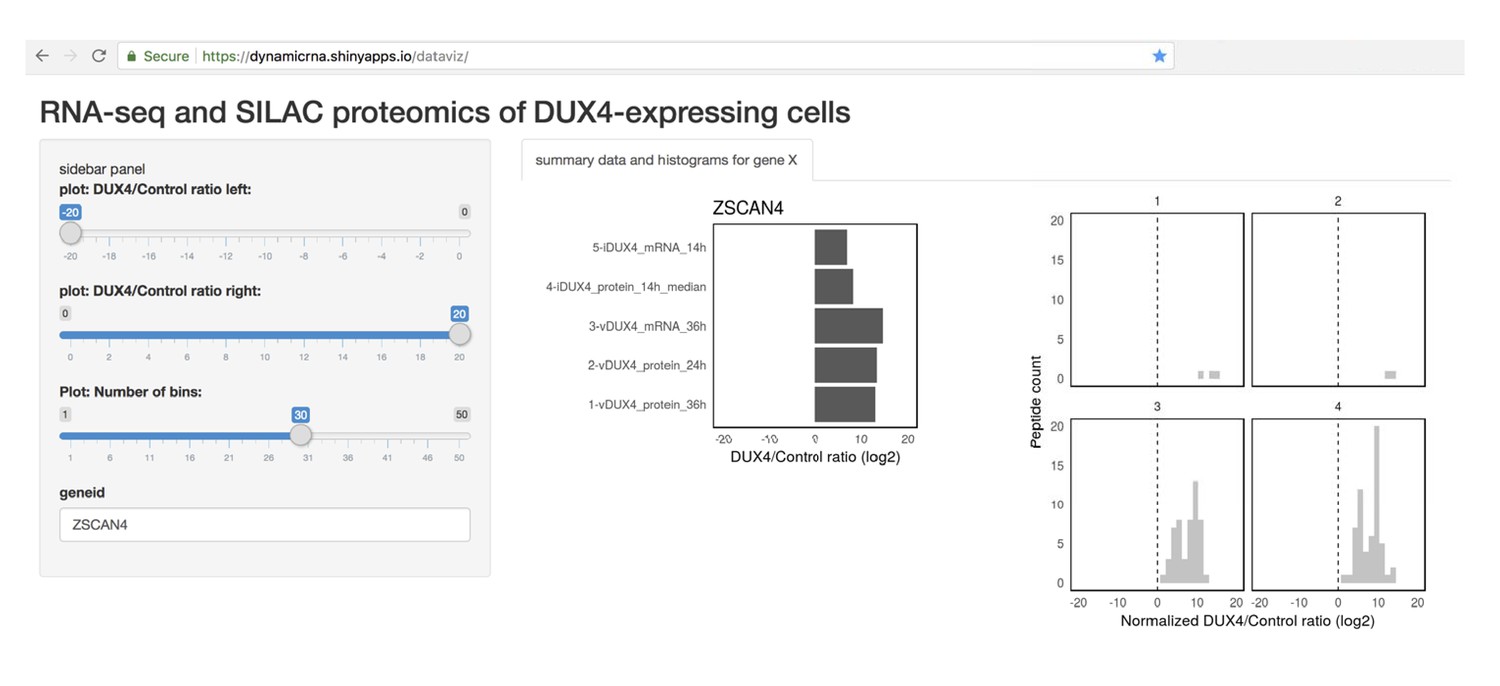
Tool allowing easy access to the data generated in this study.
Screenshot of the Shiny web server showing a sample analysis of the RNA- and protein- level data for a DUX4 transcriptional target, ZSCAN4.
Author response image 1
Author response image 2
Tables
Key resources table
| Reagent type (species) or resource | Designation | Source or reference | Identifiers | Additional information |
|---|---|---|---|---|
| Cell line (Homo sapiens) | MB135 | PMID: 28171552 | ||
| Cell line (Homo sapiens) | MB135-iDUX4 | PMID: 28171552 | ||
| Antibody | Rabbit anti- GM130 antibody | Bethyl Laboratories Inc. | Cat # A303-402A-T | (1:250) |
| Antibody | Rabbit anti- Dux4 antibody | Abcam | Cat # ab124699 | (1:500) |
| Commercial assay, kit | ActinRed 555 ReadyProbes Reagent | ThermoFisher Scientific | Cat # R37112 | |
| Chemical compound, drug | DAPI | Sigma | Cat # D9542 | (1:1000) |
| Chemical compound, drug | L-LYSINE:2HCL UNLABELED | Cambridge Isotope Laboratories Inc. | Cat # ULM-8766-0.1 | |
| Chemical compound, drug | L-ARGININE:HCL UNLABELED | Cambridge Isotope Laboratories Inc. | Cat # ULM-8347-0.1 | |
| Chemical compound, drug | L-LYSINE:2HCL (13C6, 99%; 15N2, 99%) | Cambridge Isotope Laboratories Inc. | Cat # CNLM-291-H-0.05 | |
| Chemical compound, drug | L-ARGININE:HCL (13C6, 99%; 15N4, 99%) | Cambridge Isotope Laboratories Inc. | Cat # CNLM-539-H-0.05 | |
| Other | Ham's F12 for SILAC | Pierce | Cat # 88424 | |
| Other | Dialysed FBS for SILAC | Pierce | Cat # 88212 |
Additional files
-
Supplementary file 1
Gene-level log2 fold change values for RNA and protein in iDUX4 MB135 cells.
- https://doi.org/10.7554/eLife.41740.008
-
Transparent reporting form
- https://doi.org/10.7554/eLife.41740.009
Download links
A two-part list of links to download the article, or parts of the article, in various formats.
Downloads (link to download the article as PDF)
Open citations (links to open the citations from this article in various online reference manager services)
Cite this article (links to download the citations from this article in formats compatible with various reference manager tools)
Quantitative proteomics reveals key roles for post-transcriptional gene regulation in the molecular pathology of facioscapulohumeral muscular dystrophy
eLife 8:e41740.
https://doi.org/10.7554/eLife.41740


