Live-cell imaging reveals enhancer-dependent Sox2 transcription in the absence of enhancer proximity
- University of California, San Francisco, United States
- Chan Zuckerberg Biohub, United States
- Columbia University, United States
Figures
Figure 1 with 3 supplements
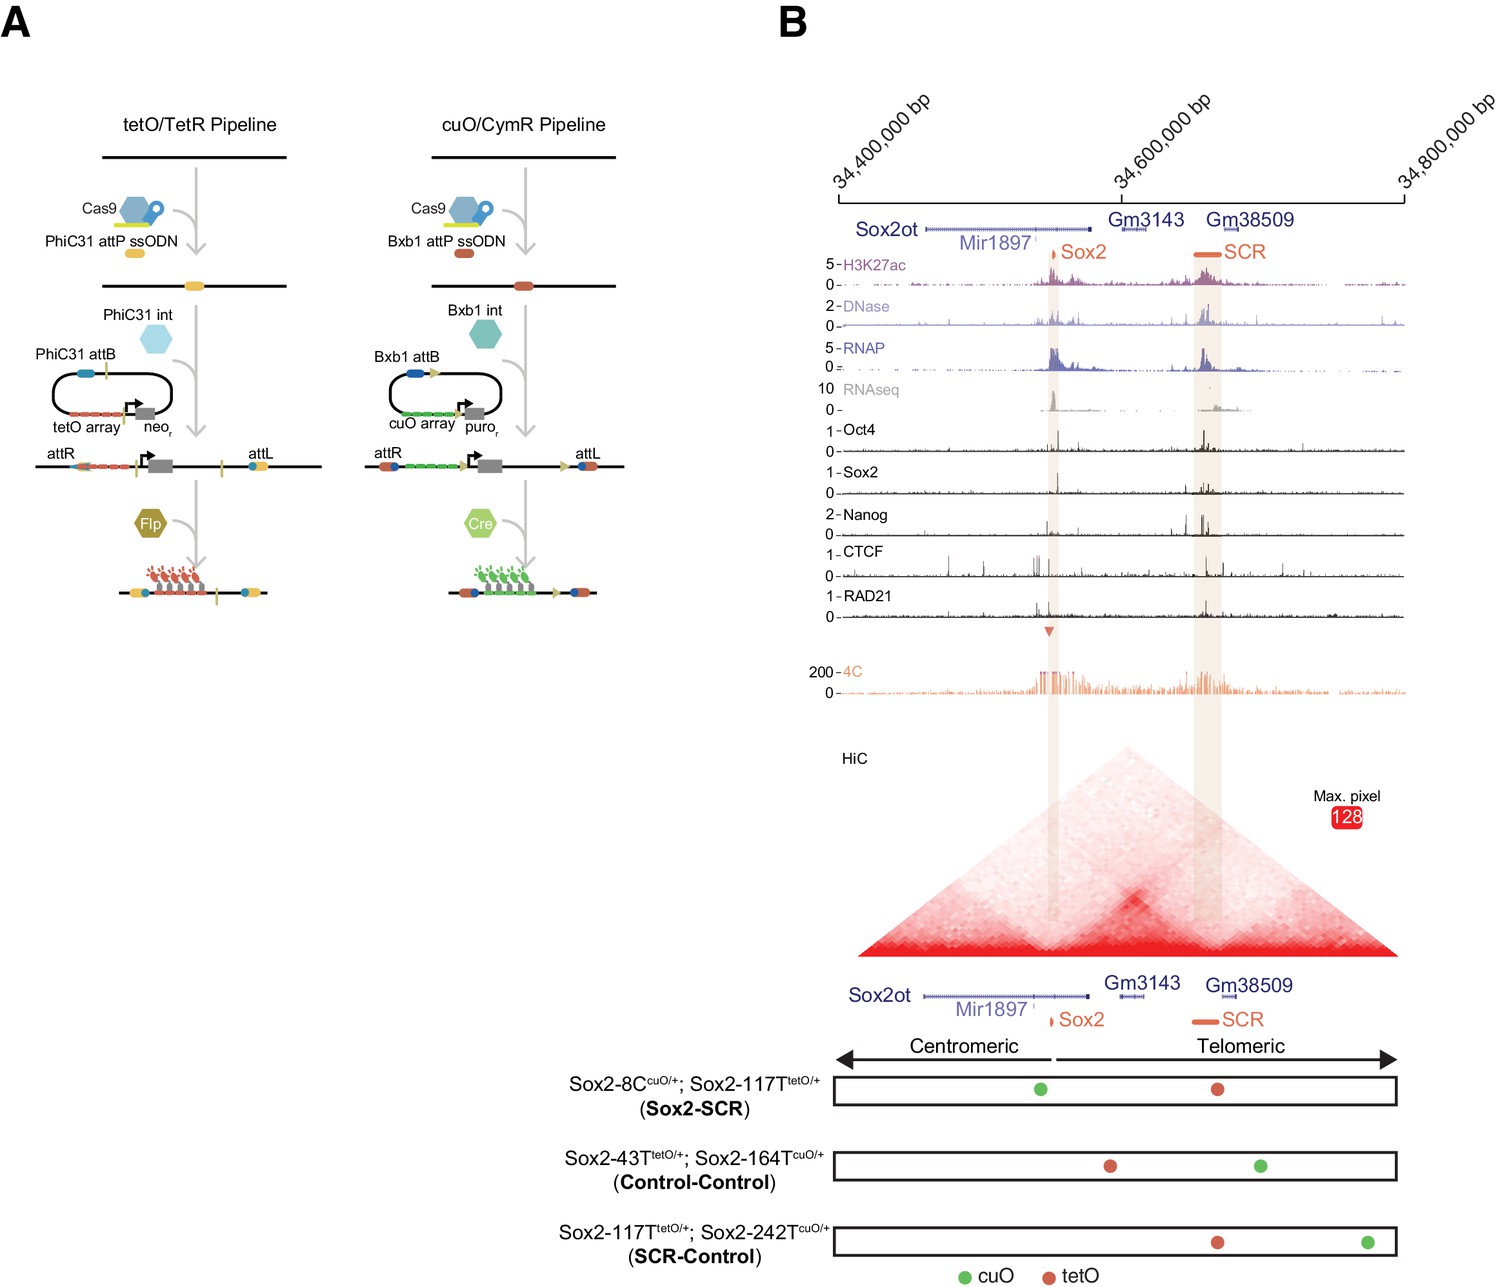
The Sox2 Locus As a Model for Visualization of Enhancer-Promoter Regulation in Mouse Embryonic Stem Cells.
(A) To visualize chromosome loci in living cells, we have used tetO/TetR and cuO/CymR genetic labels. Our pipeline for insertion of these labels into the mouse genome is shown. First, CRISPR-Cas9 is used to place an attP integrase landing site. Second, a targeting plasmid bearing the compatible attB sequence, the tetO or cuO array, and a selection cassette is introduced along the integrase (Int) to mediate site-specific integration. The selection cassette can then be subsequently removed by Cre/Flp recombinase. (B) The Sox2 locus in mouse ESCs. Genomic browser tracks of epigenomic and expression data demonstrate high levels of histone acetylation, RNA polymerase II, and transcription factor (OCT4, SOX2, NANOG, CTCF) and cohesin (RAD21) occupancy at Sox2 and the distal Sox2 Control Region enhancer (tan boxes). Data from 4C and HiC experiments demonstrate chromosomal contacts at the Sox2 locus. For 4C data, read density indicates contact frequency with a fixed position near the Sox2 promoter (red triangle). Y-axis for browser tracks is reads per million. For HiC, all pairwise contact frequencies are shown using a heatmap. The intensity of each pixel represents the normalized number of contacts detected between a pair of loci. The maximum intensity is indicated in red square. At bottom, locations of the cuO- and tetO-arrays for the three cell lines utilized for this study. Sox2-8CcuO/+; Sox2-117TtetO/+ (Sox2-SCR) ESCs were used to track Sox2/SCR location. Two control lines, Sox2-43TtetO/+; Sox2-164TcuO/+ (Control-Control) and Sox2-117TtetO/+; Sox2-242TcuO/+ (SCR-Control) were analyzed for comparison. H3K27ac, RNA polymerase II (RNAP), and RNAseq data from GSE47949 (Wamstad et al., 2012); DNase data from GSE51336 (Vierstra et al., 2014); SOX2, OCT4, NANOG, CTCF data from GSE11431 (Chen et al., 2008b), and RAD21 data from GSE90994 (Hansen et al., 2017); 4C data from GSE72539 (de Wit et al., 2015); and HiChIP data from GSE96107 (Bonev et al., 2017).
Figure 1—figure supplement 1
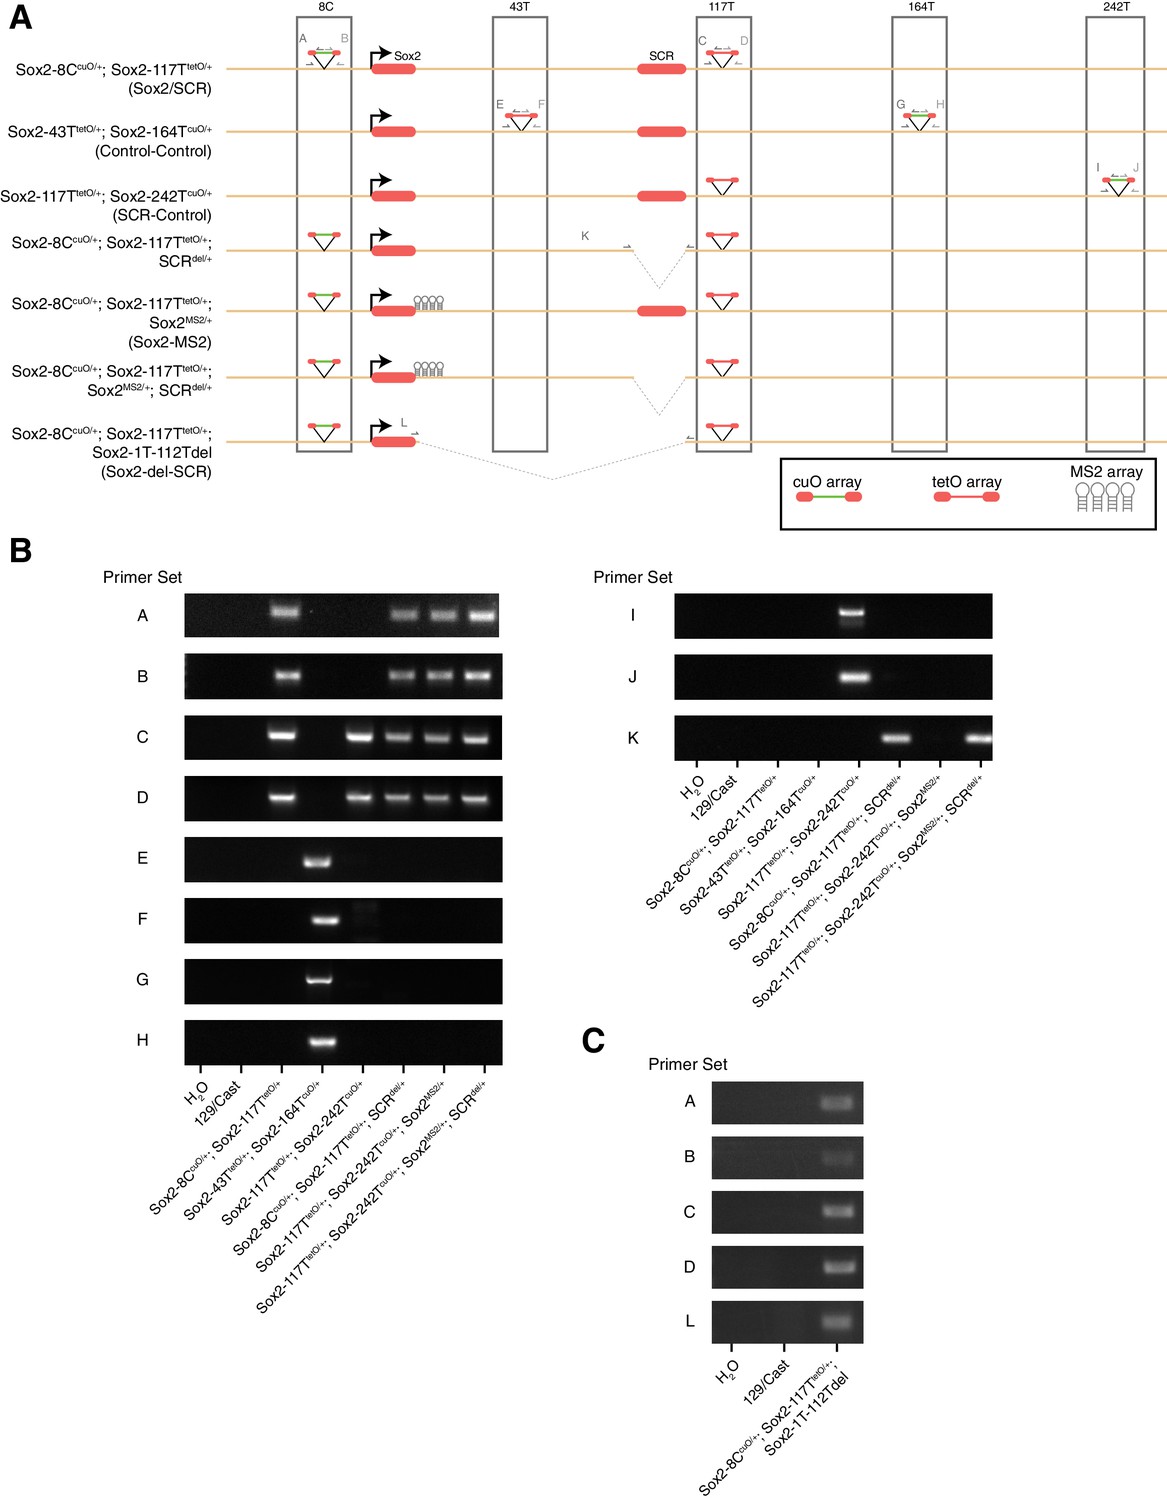
Characterization of Modified Embryonic Stem Cell Lines.
(A) Schematic of modified cell lines used in this study. Primer sets used to amplify recombination arms for tetO- and cuO- integration are shown. (B,C) PCR genotyping of ESC lines shown in A.
Figure 1—figure supplement 2
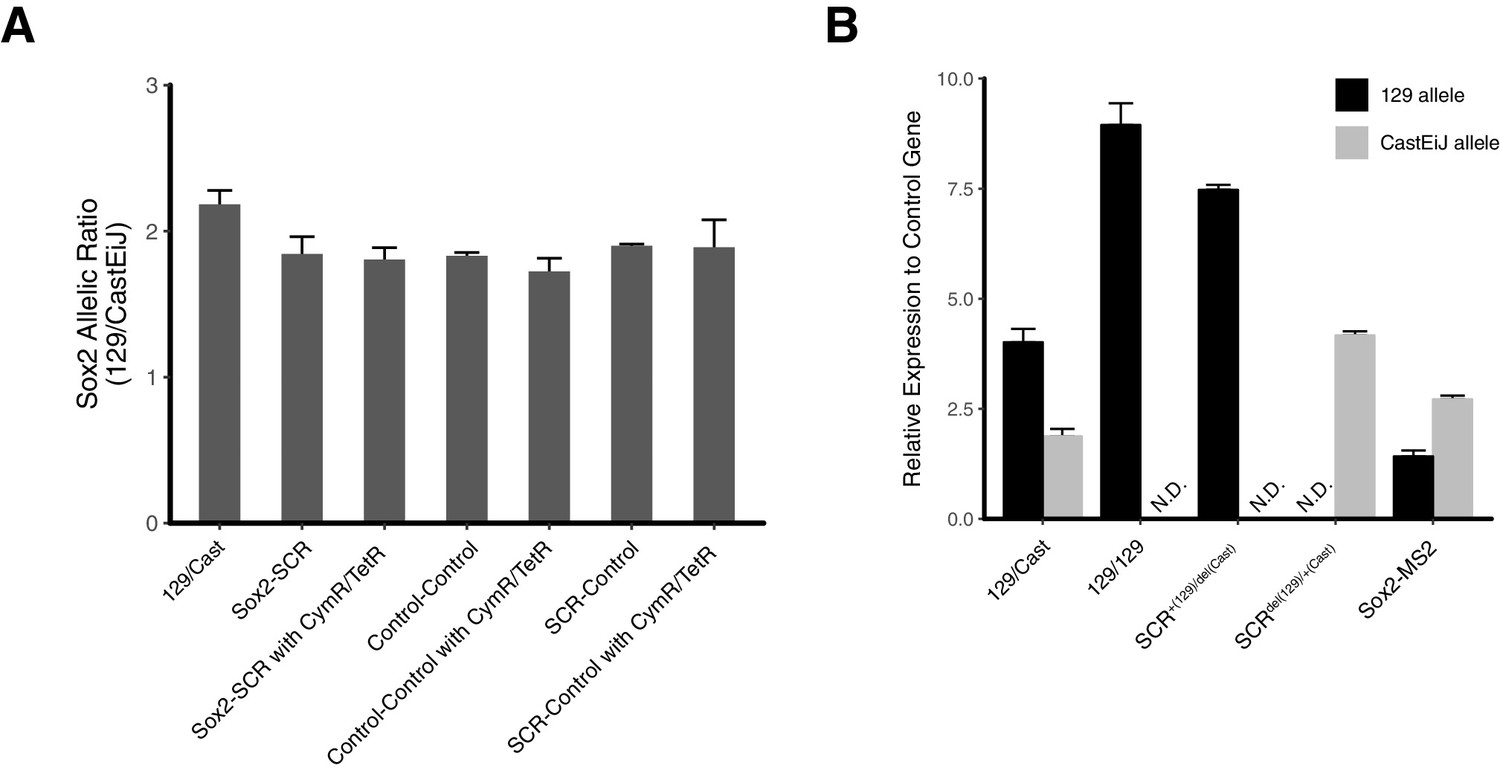
Sox2 Expression Characterization for Modified Embryonic Stem Cell Lines.
(A) Ratio of Sox2 expression from the 129 allele and the CastEiJ allele measured by qPCR for modified ESC lines. Sox2-SCR cell line has cuO array inserted 8 kb centromeric to Sox2 TSS and tetO array inserted 5 kb telomeric to SCR. Control-Control cell line has cuO and tetO located 43 kb and 164 kb telomeric to Sox2 TSS. SCR-Control has tetO inserted 5 kb telomeric to SCR and cuO located 242 kb telomeric to Sox2 TSS. Samples labeled with CymR/TetR coexpress CymR-GFP and TetR-tdTom. (B) Sox2 expression relative to control gene (Tbp) for various cell lines. E14 (129/129) mESCs are included to demonstrate specificity of allele-specific qPCR assay. SCR deletion cell line are in the context of cuO and tetO integrations in the Sox2-SCR configuration. Deletion of SCR region leads to loss of expression from the Sox2 allele in cis. Bars show mean of at least three biological replicates. Error bars show the standard error. N.D. is not detected.
Figure 1—figure supplement 3

Sox2-SCR Contacts Are Maintained in Modified Embryonic Stem Cell Lines.
(A) Near-cis plots of 4C analysis using the Sox2 promoter region (red arrowhead) as bait shows elevated contacts with the SCR region (black arrowhead) in all cell lines investigated. Individual black points show fragment-based raw data, while blue points show a running median. The blue line and grey ribbon shows a loess-smoothed trendline for the data with the 20–80% quantile range. (B) Proportion of 4C reads that can be unambiguously assigned to a parental genome for each allele. These data demonstrate roughly half of Sox2-SCR contacts as measured by 4C come from the modified (129) allele and that our genome modifications do not significantly affect Sox2-SCR interactions.
Figure 2 with 3 supplements

Visualization of the Sox2 Region in ESCs Reveals Minimal Evidence for Sox2/SCR Interactions.
(A) Top, confocal Z slices of CymR-GFP and TetR-tdTom in Sox2-SCR ESCs, labeling the Sox2 promoter and SCR region with bright puncta, respectively. Middle, 3D surface rendering of the ESC nucleus shown above. A single fluorescence channel was rendered white and transparent to outline the nucleus, and GFP and tdTom surfaces were rendered with high threshold to highlight the cuO and tetO arrays, respectively. Bottom, tracking data is rendered for the nucleus shown above. Inset shows example of calculated 3D separation distance between the two labels. Scale bar is 1 µm. (B) Normalized histogram of 3D separation distance for Sox2-SCR ESCs demonstrates a single peak (Hartigan’s Dip Test for multimodality, p=1). Schematic for an hypothetical looping enhancer-promoter pair is shown as an inset, with two peaks. Tan box indicates regime where distance measurement error is expected to be greater than 50%. (C) Cumulative density of 3D separation distance for Sox2-SCR versus control comparisons. Mean distance for each sample shown on bottom right. (D) Mean 3D separation distance per cell for each label pair. Population means and standard deviations are shown for each sample. Mann-Whitney, *p<0.05, **p<0.01, ***p<0.001.
Figure 2—figure supplement 1
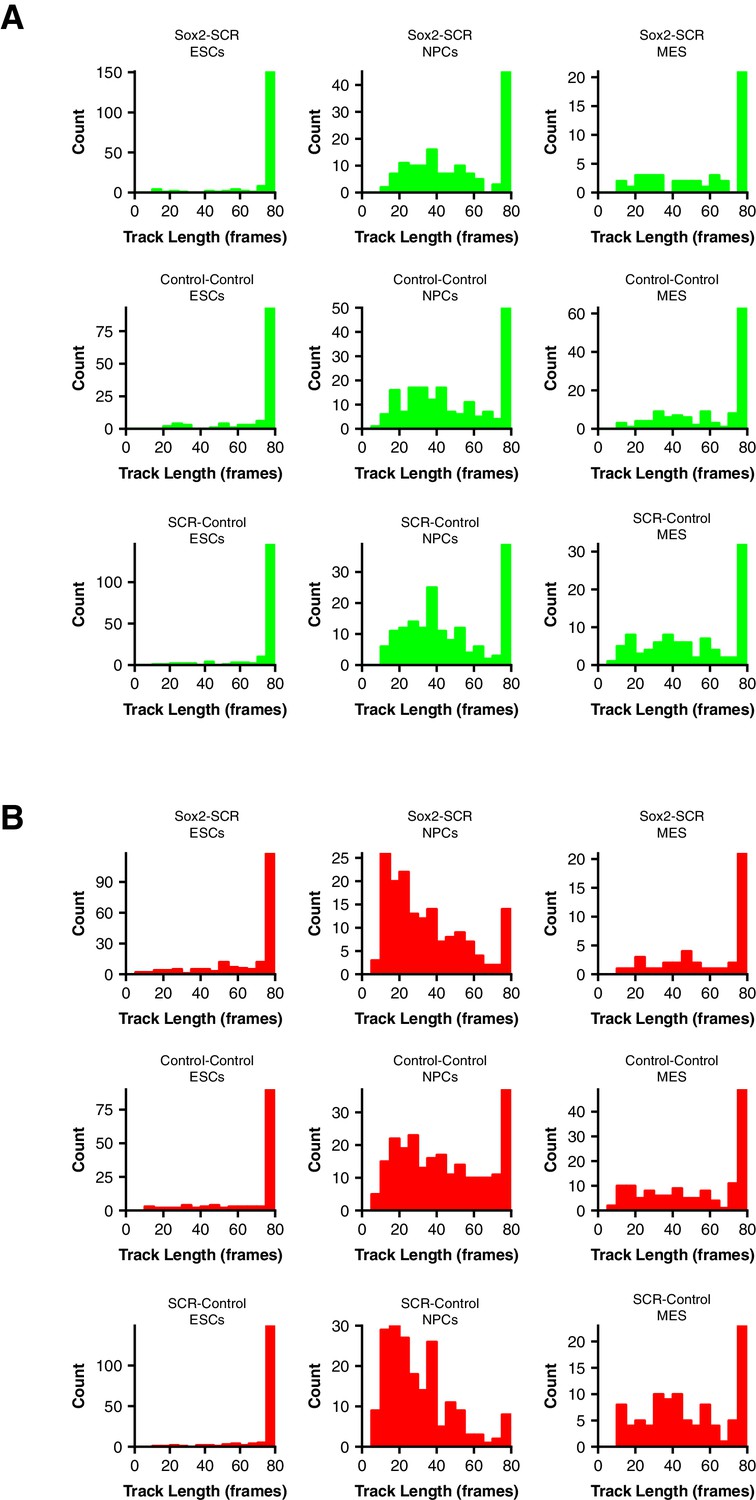
Tracking Lengths for tetO and cuO Spots Across Cell Lines.
(A–B) Histograms of the cuO-array (A) or tetO-array (B) track lengths for cell lines used in the study as ESCs, NPCs, and MES. Tracking lengths were often shorter in NPCs or MES due to increased nuclear movement in these cell types compared to ESCs.
Figure 2—figure supplement 2
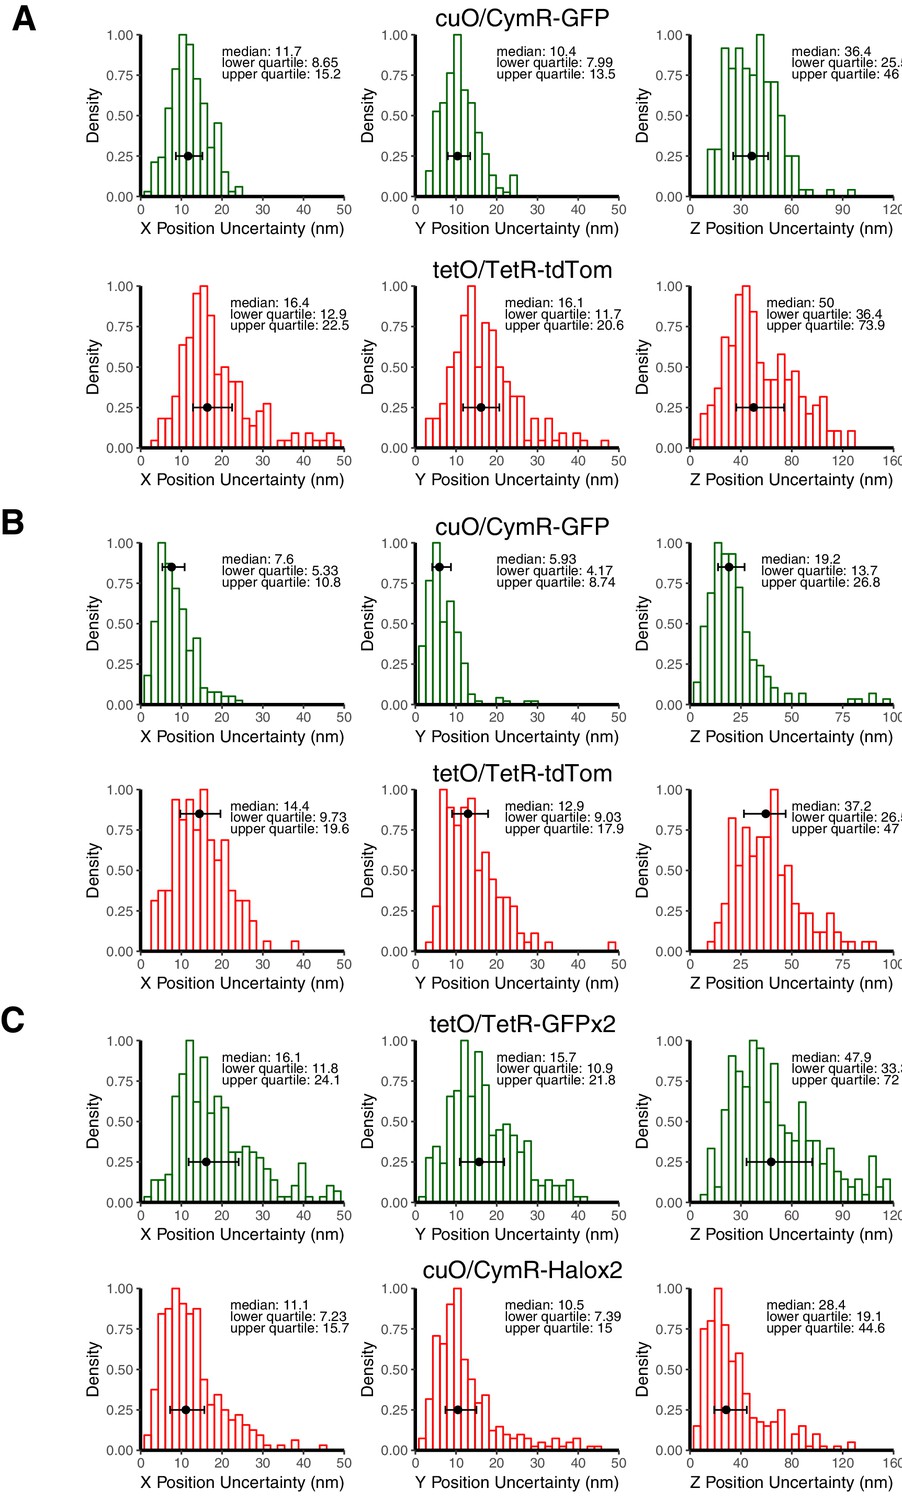
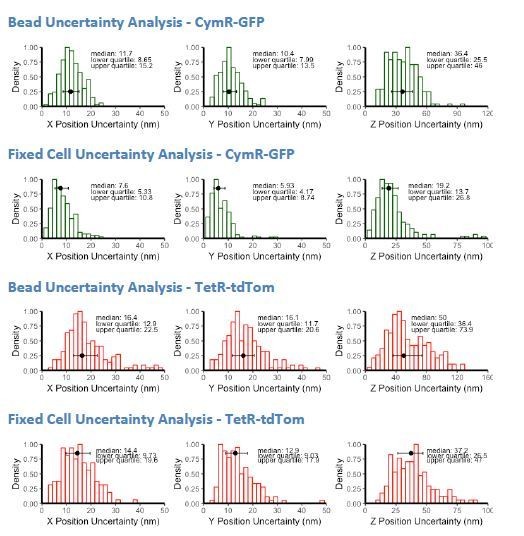
Estimate of Localization Precision for cuO and tetO.
(A) Histograms of X, Y, and Z position uncertainty for fluorescent beads with signal-to-noise ratios comparable to cuO/CymR-GFP or tetO/TetR-tdTom. Data plotted are the standard deviation values measured using five frame sliding windows collected from 9 to 10 beads. (B) Histogram of X, Y, Z position uncertainty derived for tracking cuO/CymR-GFP and tetO/TetR-tdTom position in fixed cells. Data plotted are standard deviations using a five frame sliding window collected for 10 loci. (C) Histogram of X, Y, Z position uncertainty for fluorescent beads with signal-to-noise ratios comparable to cuO/CymR-Halox2 or tetO/TetR-GFPx2. In all cases, error bars show median and interquartile range of the computed position uncertainties, which are reported in the upper right of each panel.
Figure 2—figure supplement 3

Impact of Localization Precision on 3D Distance Measurements.
(A) A plot of true distance versus predicted measured distance after localization error is included demonstrate significant overestimation of very small distances. These values were derived by sampling X, Y, and Z measurements for cuO and tetO from normal distributions centered on positions that are separated by the true distance and standard deviations consistent with estimated uncertainty (median values from Figure 2—figure supplement 2 panel A). (B) The interquartile range of stimulated distance measurements after localization error is included demonstrates that measured 3D distance uncertainty is distance dependent and plateaus at approximately 52 nm.
Figure 3 with 2 supplements
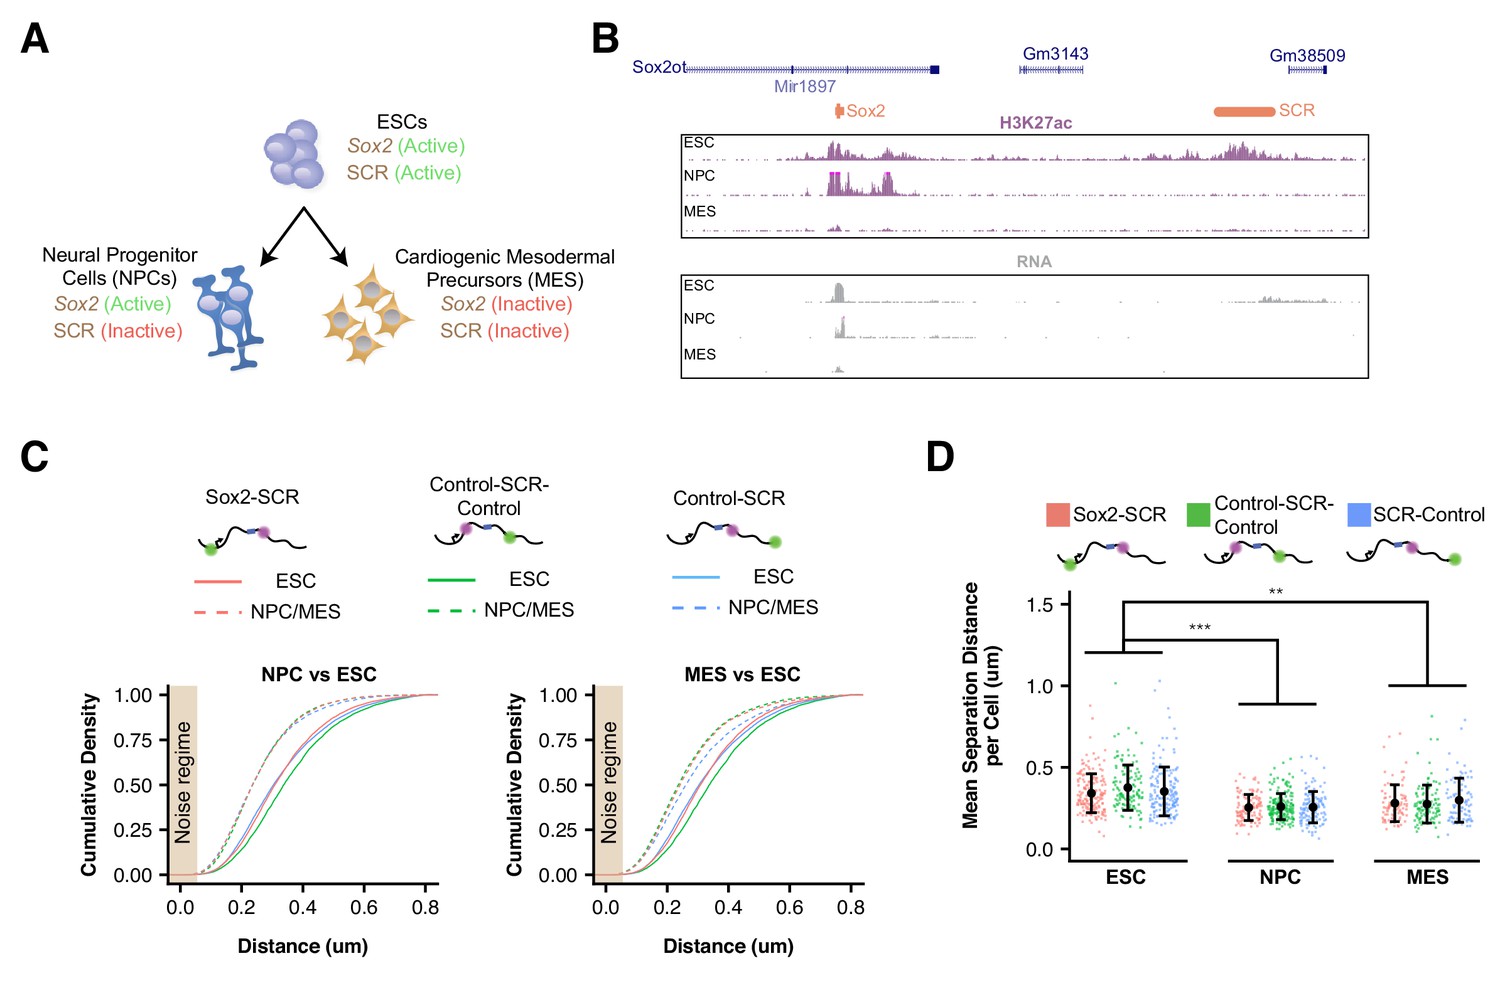
Sox2 Locus Compacts upon ESC Differentiation.
(A) ESCs were differentiated into neural progenitor cells (NPCs), which maintain expression of Sox2 but inactivate the SCR, and cardiogenic mesodermal precursors (MES), which inactivate both Sox2 and the SCR. (B) Browser tracks of H3K27ac and RNA-seq data from ESCs, NPCs, and MES demonstrate the activation status of Sox2 and SCR in each cell type. Y-axis is 0–5 reads per million for H3K27ac data and 0–10 reads per million for RNA-seq data. (C) Cumulative density of 3D separation distance for Sox2-SCR and two control pairs for NPCs (left) and MES (right). ESC data are shown for comparison as solid lines on each graph and reproduced from Figure 2C. Tan box indicates regime where distance measurement error is expected to be greater than 50%. (D) Mean 3D separation distance per cell for each label pair, organized by cell type. Statistical analysis is for each matched pair-wise comparison between cell types. All p-values are below reported value. Mann-Whitney (**p<0.01, ***p<0.001). H3K27ac data from GSE47949 (Wamstad et al., 2012) and GSE24164 (Creyghton et al., 2010). RNAseq data from GSE47949 and GSE44067 (Zhang et al., 2013).
Figure 3—figure supplement 1
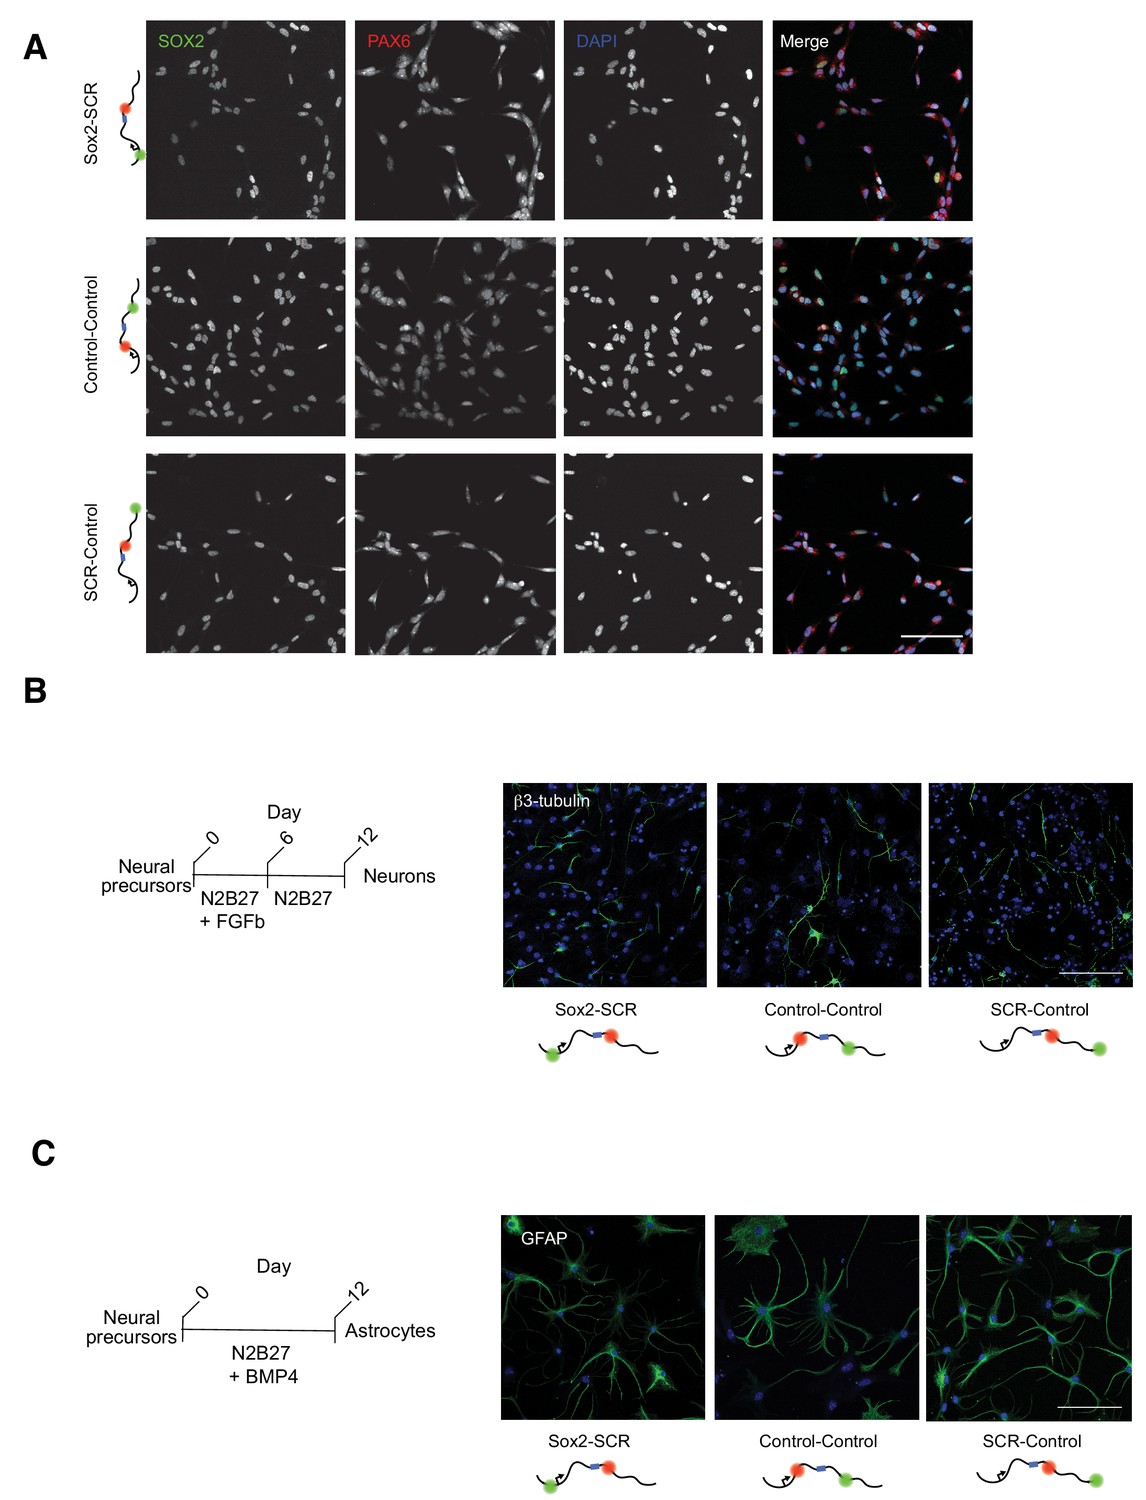
Characterization of ESC-derived Neural Progenitor Cell Lines.
(A) Immunofluorescence of fixed neural progenitor cells (NPCs) for the NPC markers SOX2 and PAX6. (B-C) Immunofluorescence for the neuron marker β3-tubulin (B) or the astrocyte marker GFAP (C) on fixed cultures after 12 days of differentiation towards neurons or astrocytes, respectively. Scale bar is 100 µm.
Figure 3—figure supplement 2
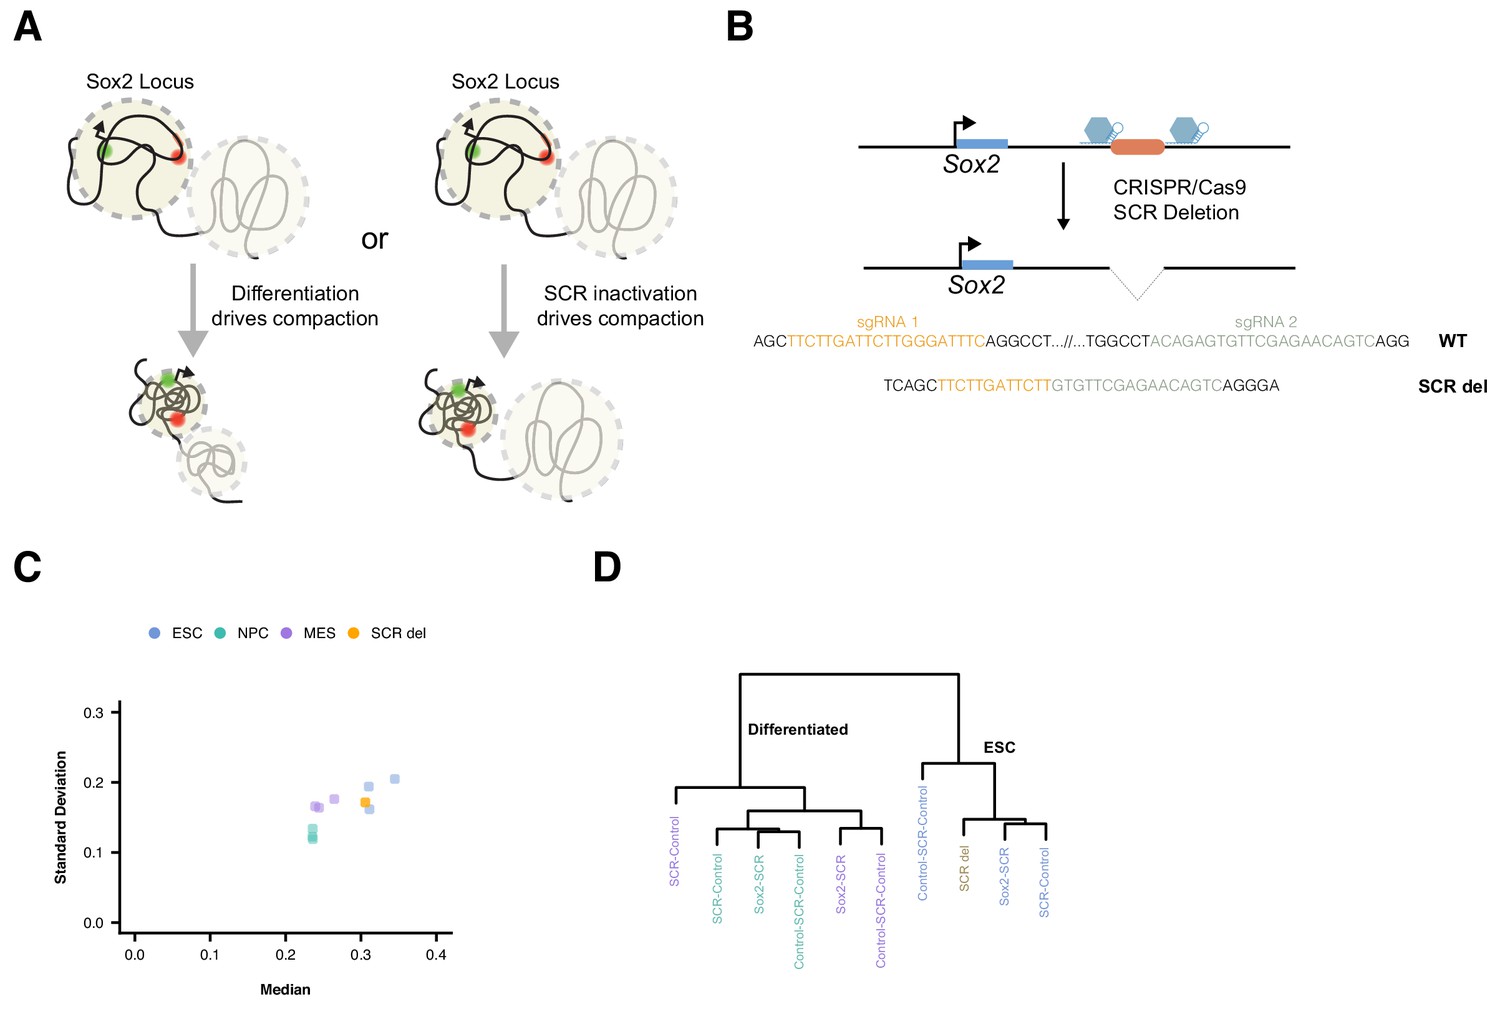
SCR Inactivation Does Not Drive Locus Compaction Upon Differentiation.
(A) Potential models for Sox2 locus compaction observed upon differentiation to NPCs or MES. At left, cellular differentiation may lead to global changes in chromatin structure that are not dependent of Sox2/SCR activation status. Alternatively, Sox2 and SCR inactivation could lead to changes to chromatin structure within the Sox2 locus, driving locus-specific compaction. (B) Strategy for CRISPR/Cas9-mediated SCR deletion. Two gRNAs were designed to flank the SCR region and generate a deletion of SCR. Below, the SCR deletion allele shows a novel junction near the locations of expected Cas9 cutting, indicating a loss of the intervening SCR sequence. (C) Scatterplot of mean and standard deviation of 3D distance measurements for each cell line visualizes similarity between Sox2 label pairs across cell types. (D) Dendrogram visualizing hierarchical clustering of Earth Mover’s distances between 3D separation distance histograms of distinct Sox2 label pairs across cell types. SCR-deleted ESCs show greatest similarity to other ESCs as opposed to differentiated cells with inactivation of the SCR element.
Figure 4 with 1 supplement
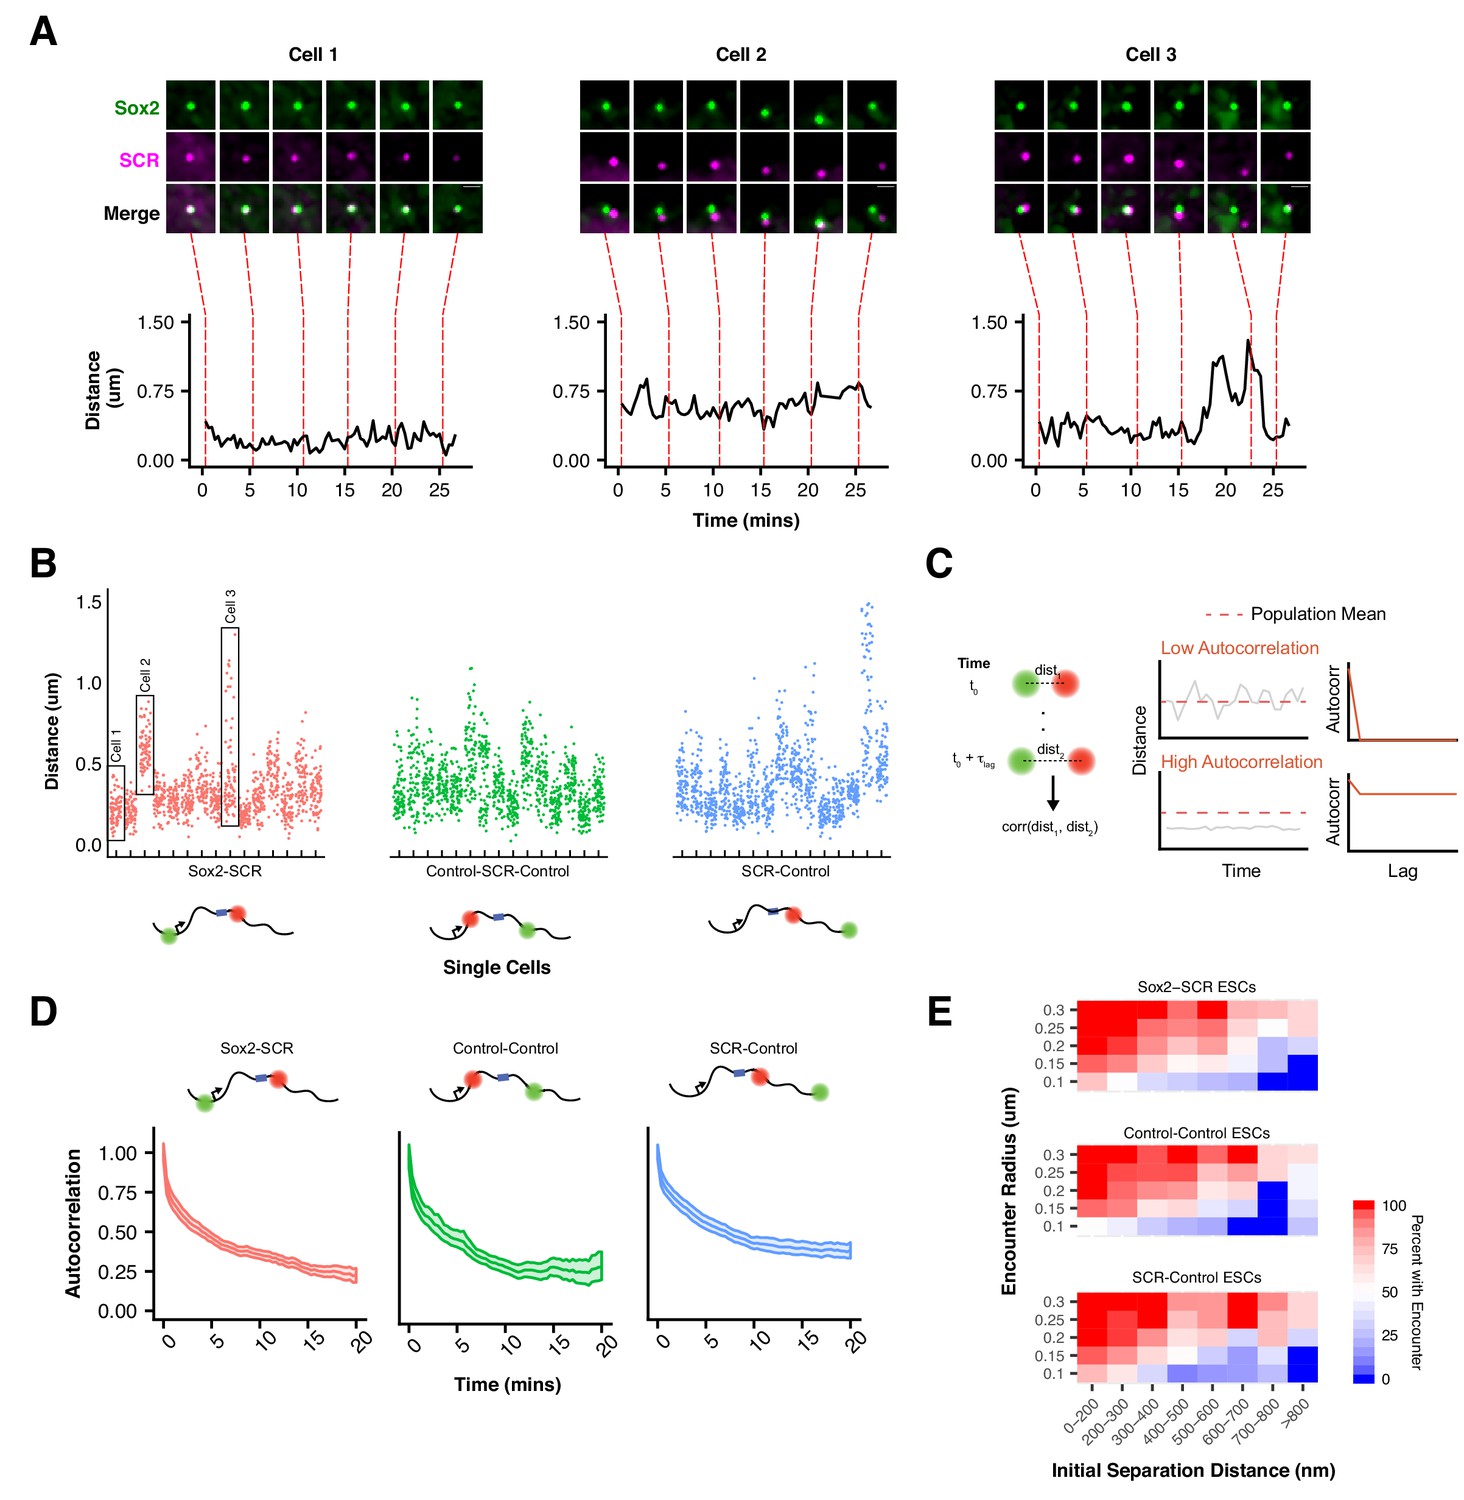
Slow Sox2 Locus Conformation Dynamics Lead to Limited Exploration and Variable Encounters.
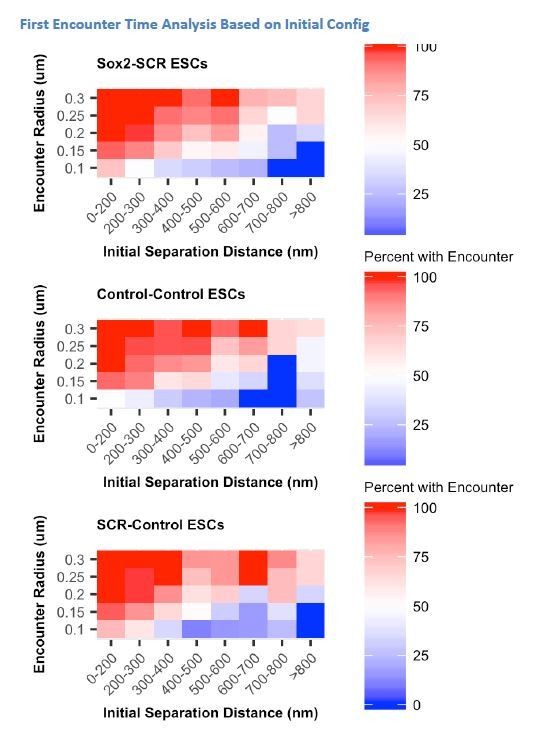
(A) Maximum-intensity projection images (top) centered on the Sox2 locus and associated 3D distance measurements (bottom) highlight distinct conformations and dynamics of the Sox2 locus across cells. Scale bar is 1 µm. (B) 3D separation distance measurements for individual cells for Sox2-SCR, Control-Control, and SCR-Control highlight the heterogeneity of Sox2 locus organization across the cell population. The three cells depicted in A are boxed. (C) Cartoon description of autocorrelation analysis. Distance measurement between two time points are correlated using population statistics, revealing the time scale over which local measurements diverge from the population mean. A cell with low autocorrelation will randomly fluctuate around the population mean, leading the autocorrelation function to quickly decay to zero. A cell with high autocorrelation will deviate substantially from the expected value, only slowly relaxing back to the population mean. In this case, the autocorrelation function will stay significantly above zero for large lag times. (D) Autocorrelation function for Sox2-SCR, Control-Control, and SCR-Control pairs demonstrates significant autocorrelation at large lag times, indicating significant memory in 3D conformation across a 20 min window. The plotted values are mean ± 95% CI. E) Percent of cells with an encounter between tetO and cuO labels shown as a function of the initial separation distance measured for the cell. Likelihood of an encounter depends on the initial conformation of the locus across all label pairs and encounter thresholds.
Figure 4—figure supplement 1
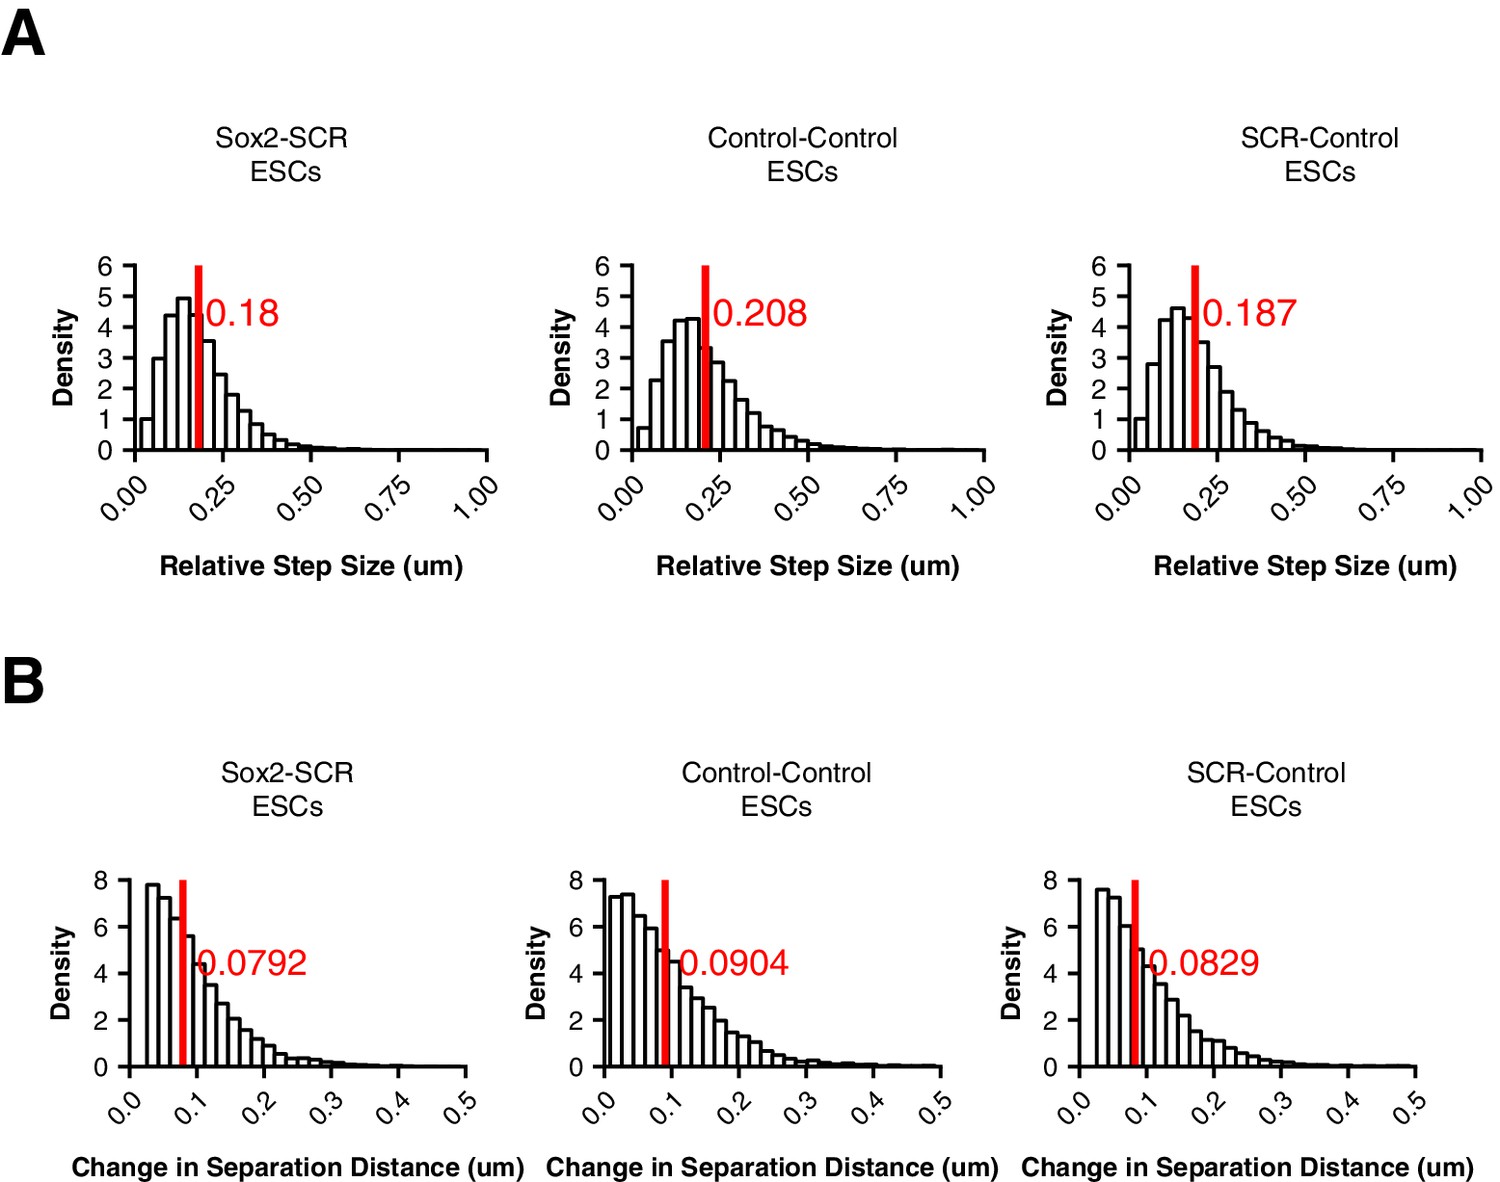
Dynamics Statistics for Each Sox2 Locus Pair in ESCs.
(A–B) Normalized histograms of relative step size (A) and change in 3D separation distance (B) for adjacent frames. Mean value is highlighted by a red line.
Figure 5 with 1 supplement
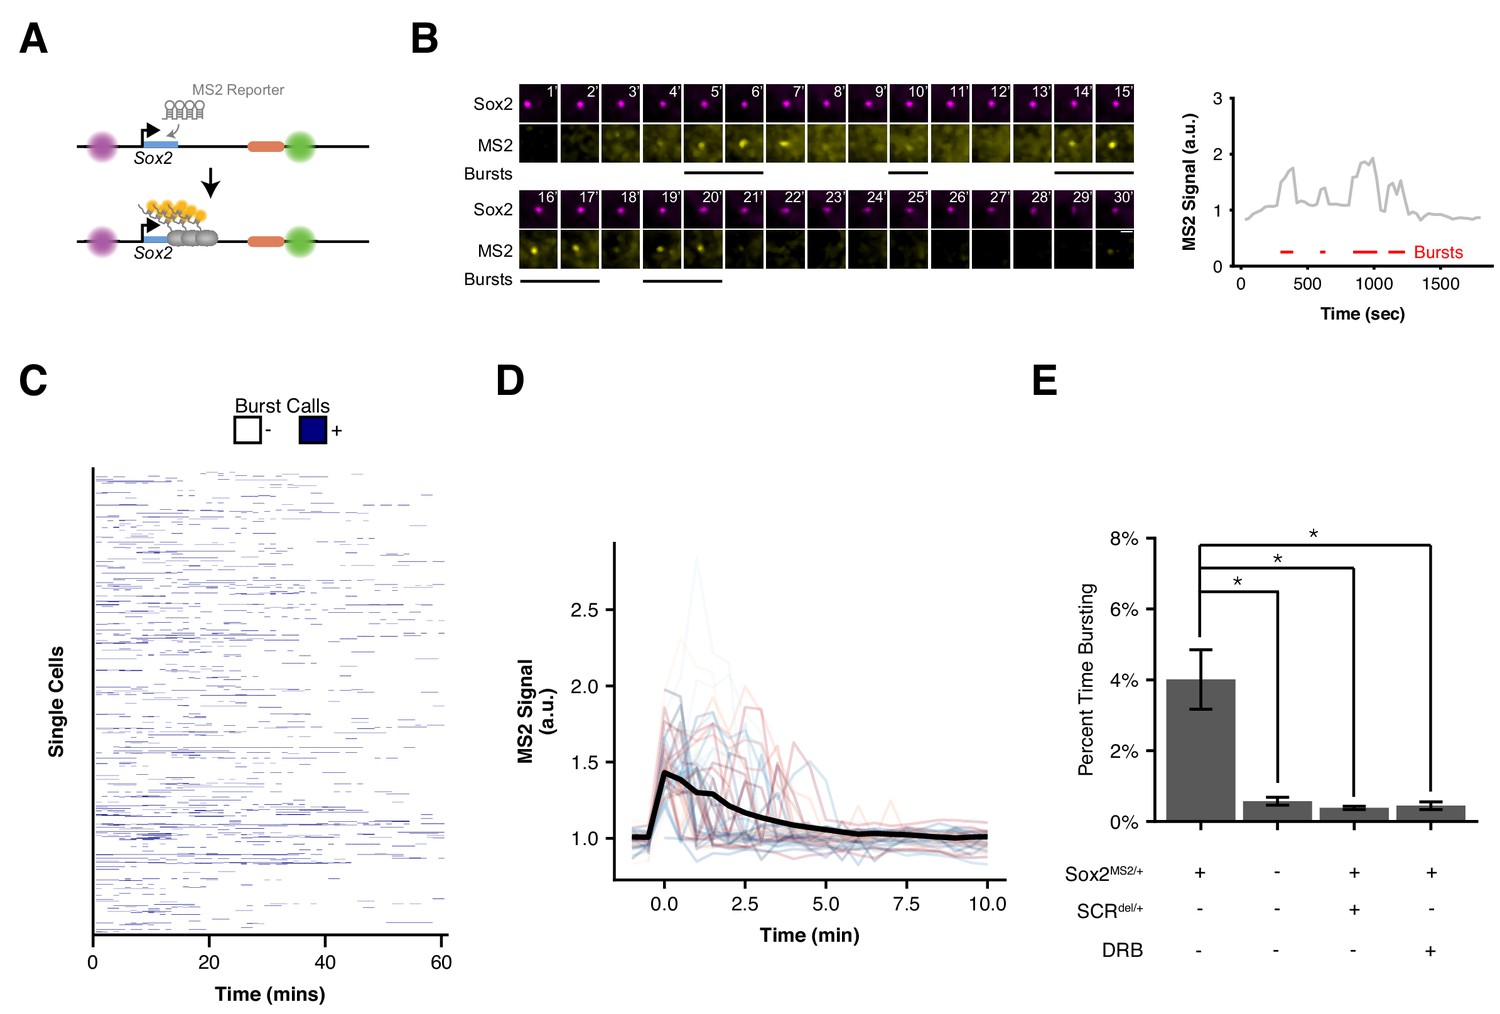
Visualizing Sox2 Expression in Single Living ESCs Reveals Intermittent Bursts of Transcription.
(A) Sox2 locus with cuO-labeled Sox2 promoter and tetO-labeled SCR was further modified to introduce an MS2 transcriptional reporter cassette into the Sox2 gene. Transcription of Sox2 leads to visible spot at the Sox2 gene due to binding and clustering of MS2 coat protein to the MS2 hairpin sequence. (B) Maximum-intensity projection images centered on the Sox2 promoter (cuO) show intermittent bursts of MS2 signal, which are quantified on the right. Scale bar is 1 µm. (C) Single cell trajectories of Sox2 transcriptional bursts as representatively shown in B. (D) Aligned Sox2 transcriptional bursts. Randomly selected Sox2 bursts are shown as color traces (n = 50). Black line is mean MS2 signal for all annotated bursts. (E) Percent time Sox2 transcriptional bursting for various experimental conditions. Bars are mean ± standard error of ≥3 independent experiments. Sox2MS2/+ indicates cell line harbors the Sox2-MS2 reporter allele. SCRdel/+ indicates presence of an SCR deletion in cis with the Sox2-MS2 reporter. DRB indicates treatment with the transcriptional inhibitor 5,6-Dichloro-1-β-D-ribofuranosylbenzimidazole (DRB).
Figure 5—figure supplement 1
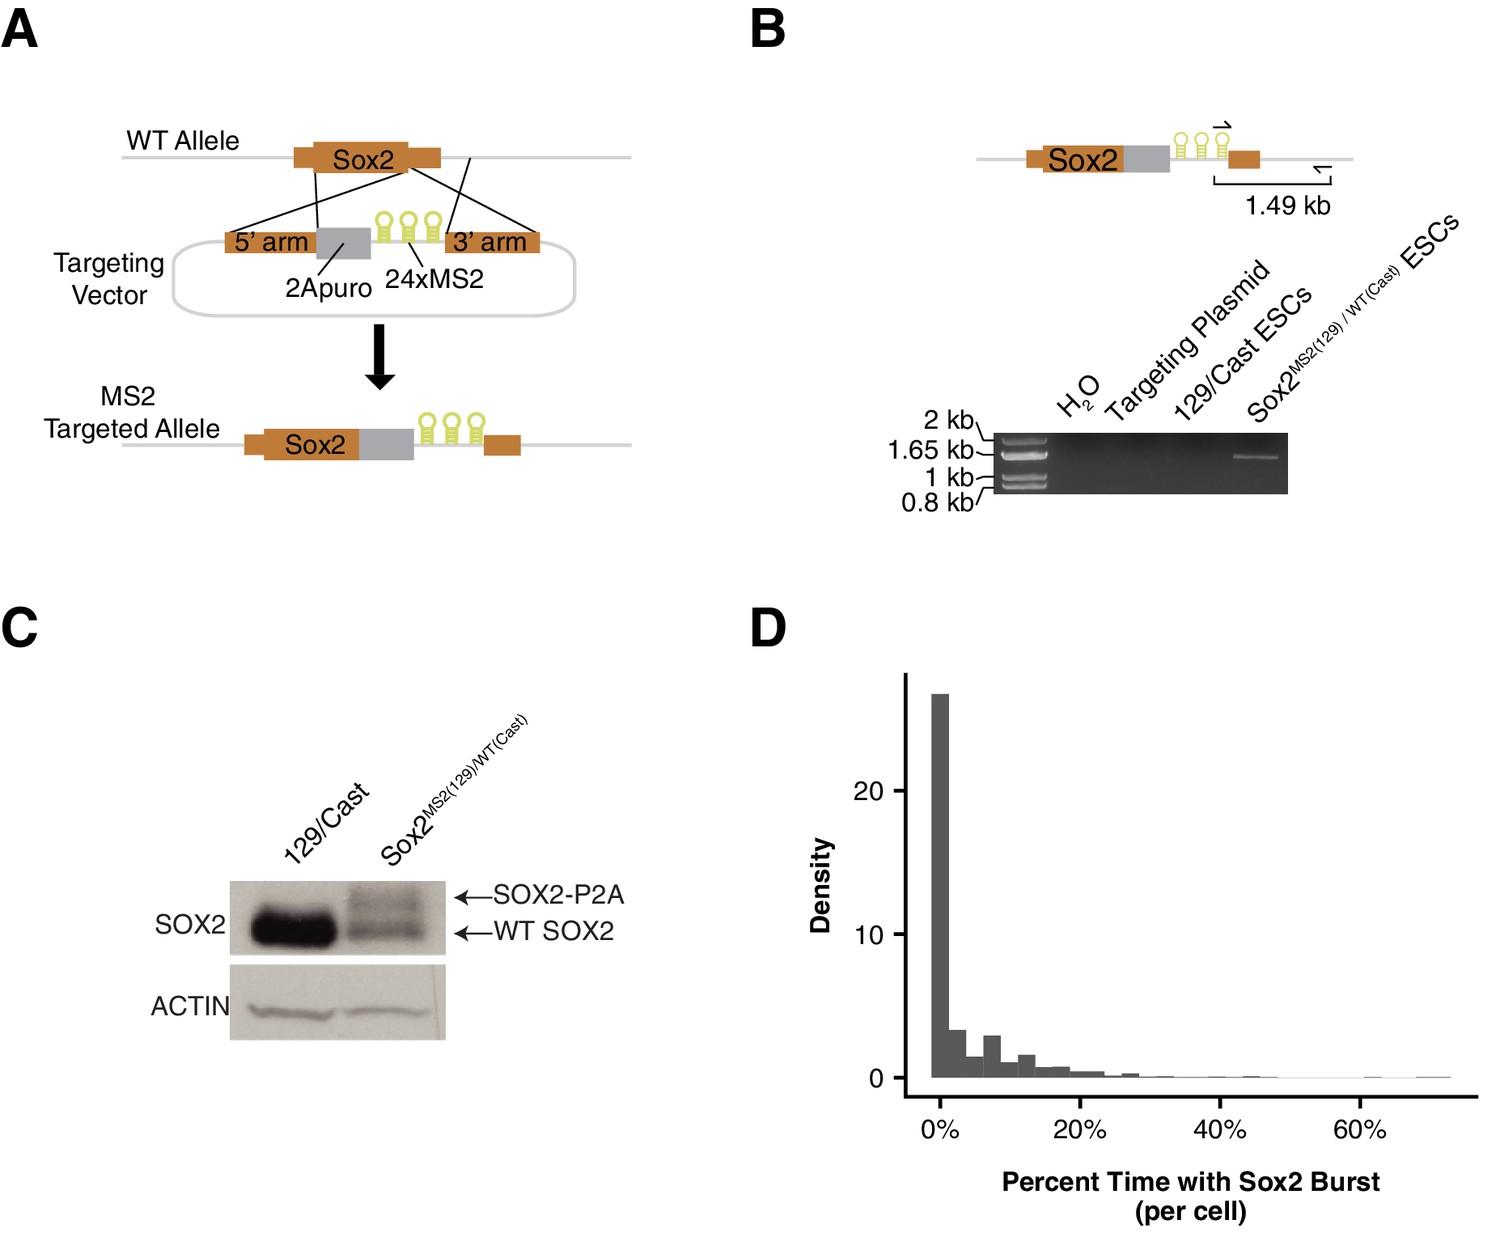
Generation and Characterization of Sox2-MS2 Transcriptional Reporter ESCs.
(A) Targeting strategy for Sox2 transcriptional reporter. A targeting plasmid was used with Sox2 homology arms and a P2A peptide puromycin resistance gene cassette (2Apuro) inserted in frame with Sox2. Downstream of 2A puro is a 24x MS2 stem loop array, which is inserted into the 3’ UTR. (B) PCR genotyping assay to identify a targeted Sox2 allele. A primer set was used that recognized the MS2 stem loop array and a genomic region downstream of the 3’ homology arm. (C) Western blotting for SOX2 protein in parental 129/CastEiJ ESCs or ESCs heterozygous for the Sox2-MS2 allele. Actin was used as a loading control. (D) Normalized histogram of the percentage of time each individual cell has a detectable Sox2 transcriptional burst.
Figure 6 with 1 supplement
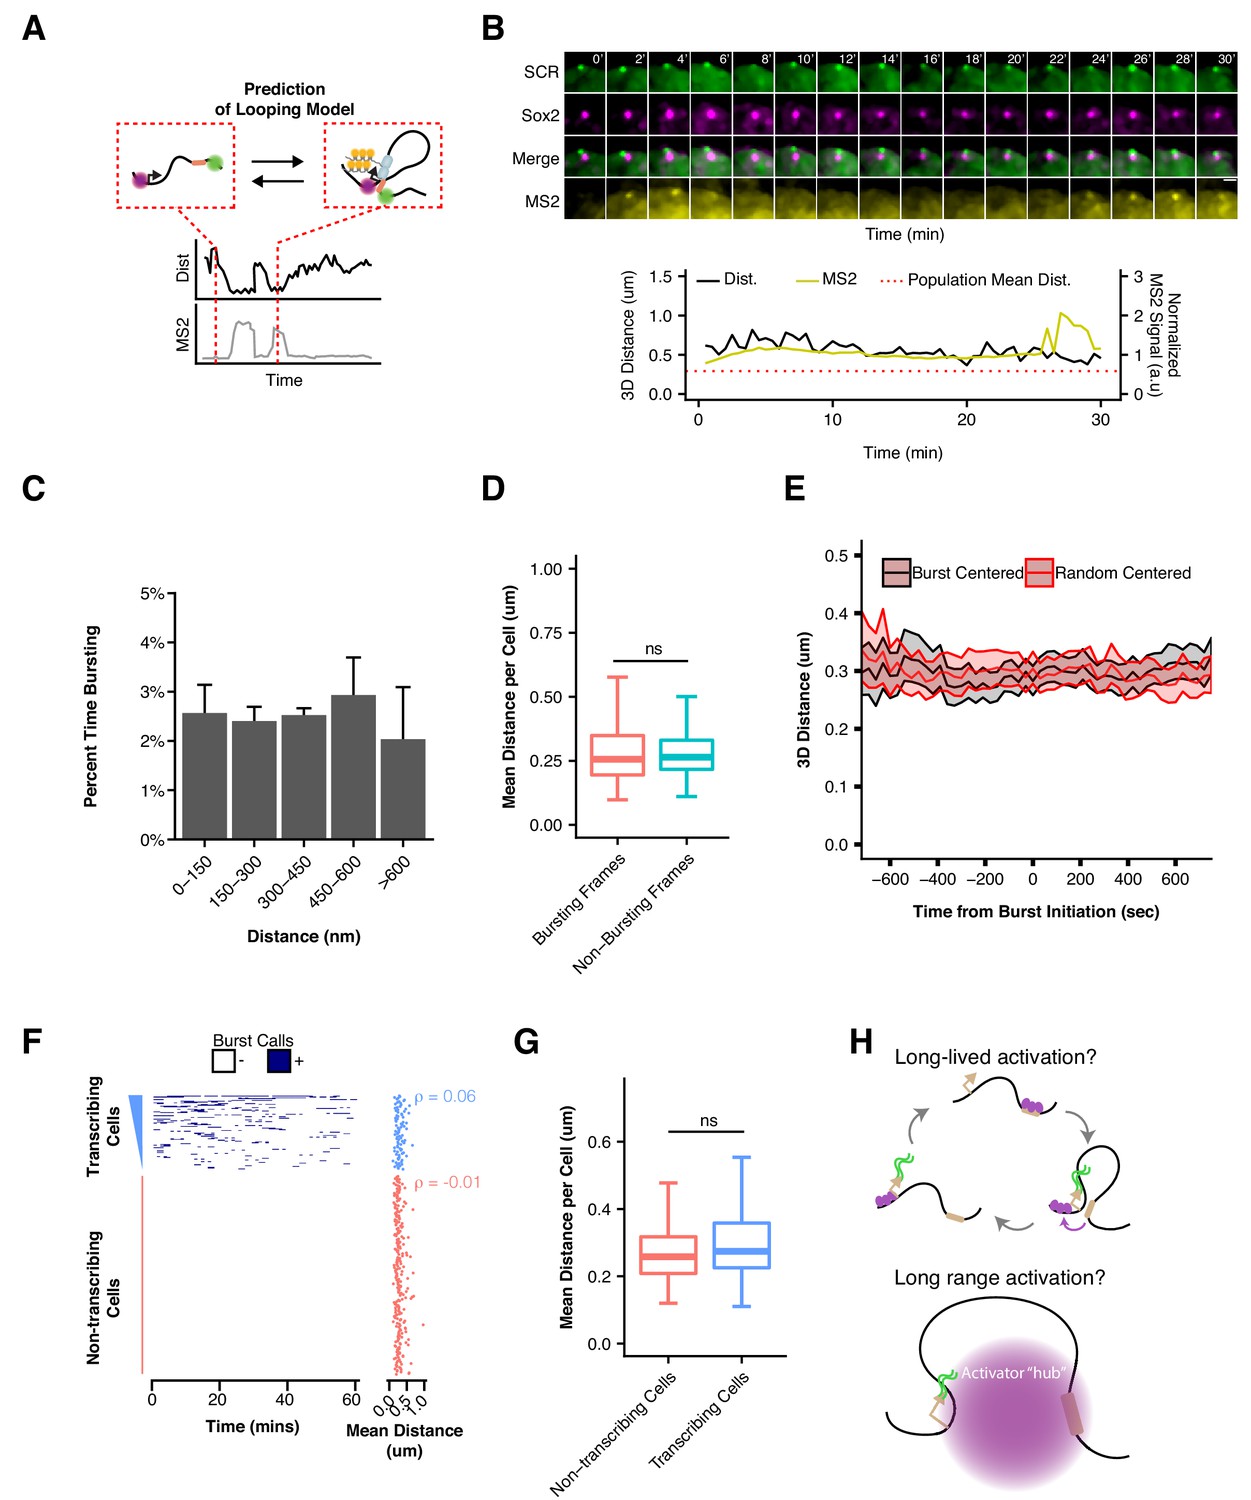
Sox2 Transcription Is Not Associated with SCR Proximity.
(A) Schematic illustrating the expected relation between Sox2/SCR distance and MS2 transcription for a looping enhancer model. (B) Maximum-intensity projection images centered on the Sox2 promoter (cuO) show transcriptional activity without correlation to Sox2/SCR distance changes. The measured distance and MS2 signal are shown at bottom. The mean separation distance across the cell population is shown as a dotted red line. Scale bar is 1 µm. (C) Percent time with Sox2 transcriptional burst as a function of Sox2/SCR distance. Weighted mean + SE for seven experiments are shown. Weights were determined based on the proportion of frames in each bin contributed by individual experiments. (D) Mean separation distance per cell, separated into bursting and non-bursting frames. (Mann-Whitney, p=0.68). (E) Mean separation distance across a 25 min window for all transcriptional bursts (black) or randomly select time points (red), aligned according the burst initiation frame. Values plotted are mean ± 95% CI. (F) Single cell trajectories of Sox2 transcriptional bursts ranked by number of bursting frames per cell. At right, matched mean separation distances for each cell shown at left. Spearman’s correlation coefficient for each is shown. (G) Mean separation distance per cell for transcribing and non-transcribing cells. (Mann-Whitney, p=0.15). (H) Potential models of SCR regulation of Sox2 that would uncouple Sox2/SCR proximity from transcriptional activity. Above, SCR leads to long-lived activation of the Sox2 promoter that can persist long after Sox2/SCR contact is disassembled. Below, SCR nucleates a large hub of activator proteins that can modify the Sox2 promoter environment despite large distances between Sox2 and SCR.
Figure 6—figure supplement 1
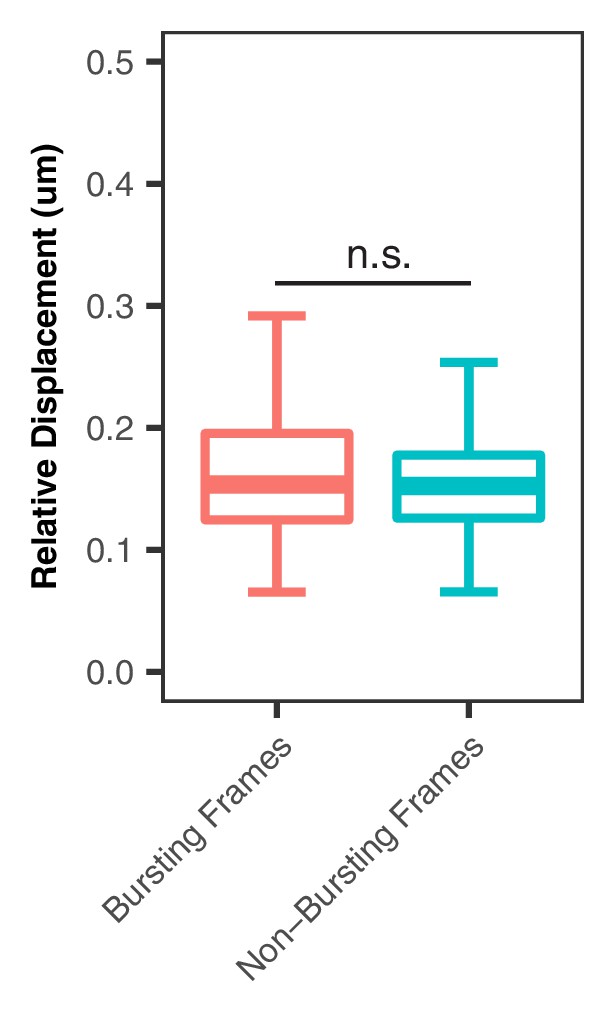
Relative Displacement between Frames for Bursting and Non-Burst Time Points.
(A) Displacement of the SCR element (tetO/TetR) relative to the Sox2 promoter (cuO/CymR) between successive frames shows no difference between bursting and non-bursting time points (Mann-Whitney, p=0.4172).
Author response image 1
Author response image 2
Author response image 3
Author response image 4
Author response image 5
Author response image 6
Videos
Video 1
Visualization of Sister Chromatids at Sox2 Locus.
Maximum-intensity Z projection of 3D confocal Z-stacks of cuO/CymR-GFP (left) and tetO/TetR-tdTom (middle) labeling the Sox2 promoter region and SCR, respectively demonstrate two clear spots for the SCR label, suggesting cells in S/G2. These cells were excluded from analysis. Scale bar is 1 µm.
Video 2
Variability in Sox2 Locus Organization Across Cells.
Maximum-intensity Z projection of 3D confocal Z-stacks of cuO/CymR (green) and tetO/TetR (magenta) labeling the Sox2 promoter region and SCR, respectively for three individual cells highlighted in Figure 3. The distance range explored by Cell1 and Cell2 is limited, while Cell3 shows large, abrupt changes in distance. Scale bar is 1 µm.
Video 3
Identification of Sox2 Transcriptional Bursts in mESCs.
Maximum-intensity Z projection of 3D confocal Z-stacks of a tandem dimer of MS2 coat protein fused with two copies of tagRFP-T. The dashed yellow box highlights the ROI used for burst detection in our automated analysis pipeline, centered on the location of the Sox2 promoter (cuO/CymR location, not shown). Detected bursts are highlighted by red circles centered on the burst location, with color intensity indicating burst intensity. Scale bar is 1 µm.
Video 4
High Transcriptional Output from Sox2 Locus.
Maximum-intensity Z projection of 3D confocal Z-stacks of a tandem dimer of MS2 coat protein fused with two copies of tagRFP-T demonstrate a period of high transcriptional activity for the highlighted Sox2 gene. The dashed yellow box highlights the ROI used for burst detection in our automated analysis pipeline, centered on the location of the Sox2 promoter (cuO/CymR location, not shown). Detected bursts are highlighted by red circles centered on the burst location, with color intensity indicating burst intensity. Scale bar is 1 µm.
Video 5
Sox2 Transcriptional Bursts in the Absence of SCR Proximity.
Maximum-intensity Z projection of 3D confocal Z-stacks of cuO/CymR (green) and tetO/TetR (magenta) labeling the Sox2 promoter region and SCR, respectively (left), and MS2 coat protein highlighting Sox2 transcriptional activity (right). We detect clear Sox2 transcriptional bursts despite no colocalization of the Sox2/SCR labels. Scale bar is 1 µm.
Tables
Key resources table
| Reagent type (species) or resource | Designation | Source or reference | Identifiers | Additional information |
|---|---|---|---|---|
| Cell line (M. musculus) | 129/Cast F1 ESCs | PMID: 9298902 | ||
| Cell line (M. musculus) | E14 ESCs | PMID: 3821905 | RRID:CVCL_C320 | |
| Cell line (M. musculus) | Sox2-SCR ESCs | this paper | 129/Cast F1 ESCs with cuO array inserted 8 kb centromeric to Sox2 TSS and tetO array inserted 117 kb telomeric to Sox2 TSS on the 129 allele | |
| Cell line (M. musculus) | Sox2-SCR ESCs; CymR-GFP; TetR-tdTom | this paper | 129/Cast F1 ESCs with cuO array inserted 8 kb centromeric to Sox2 TSS and tetO array inserted 117 kb telomeric to Sox2 TSS on the 129 allele. Cells stably express ePiggyBac vectors epB-UbC-CymRV5 -nls-GFP-DEx2 and epB- CAG-TetRFlag-nls-tdTom-DEx4 | |
| Cell line (M. musculus) | Control-Control ESCs | this paper | 129/Cast F1 ESCs with tetO array inserted 43 kb telomeric to Sox2 TSS and cuO array inserted 164 kb telomeric to Sox2 TSS on the 129 allele | |
| Cell line (M. musculus) | Control-Control ESCs | this paper | 129/Cast F1 ESCs with tetO array inserted 43 kb telomeric to Sox2 TSS and cuO array inserted 164 kb telomeric to Sox2 TSS on the 129 allele. Cells stably express ePiggyBac vectors epB-UbC-CymRV5-nls-GFP-DEx2 and epB-CAG-TetRFlag-nls- tdTom-DEx4 | |
| Cell line (M. musculus) | SCR-Control ESCs | this paper | 129/Cast F1 ESCs with tetO array inserted 117 kb telomeric to Sox2 TSS and cuO array inserted 242 kb telomeric to Sox2 TSS on the 129 allele | |
| Cell line (M. musculus) | SCR-Control ESCs | this paper | 129/Cast F1 ESCs with tetO array inserted 117 kb telomeric to Sox2 TSS and cuO array inserted 242 kb telomeric to Sox2 TSS on the 129 allele. Cells stably express ePiggyBac vectors epB-UbC-CymRV5-nls-GFP-DEx2 and epB-CAG-TetRFlag-nls-td Tom-DEx4 | |
| Cell line (M. musculus) | SCR deletion ESCs | this paper | 129/Cast F1 ESCs with cuO array inserted 8 kb centromeric to Sox2 TSS and tetO array inserted 117 kb telomeric to Sox2 TSS on the 129 allele. SCR deletion (104 kb-112kb from Sox2 TSS) is present on 129 allele | |
| Cell line (M. musculus) | SCR deletion ESCs | this paper | 129/Cast F1 ESCs with cuO array inserted 8 kb centromeric to Sox2 TSS and tetO array inserted 117 kb telomeric to Sox2 TSS on the 129 allele. SCR deletion (104 kb-112kb from Sox2 TSS) is present on 129 allele. Cells stably express ePiggyBac vectors epB-UbC-CymRV5-nls-GFP-DEx2 and epB-CAG-TetRFlag-nls -tdTom-DEx4 | |
| Cell line (M. musculus) | Sox2-MS2 ESCs | this paper | 129/Cast F1 ESCs with cuO array inserted 8 kb centromeric to Sox2 TSS and tetO array inserted 117 kb telomeric to Sox2 TSS on the 129 allele. 129 Sox2 allele has been replaced with Sox2-P2A- puro-24xMS2. | |
| Cell line (M. musculus) | Sox2-MS2 ESCs | this paper | 129/Cast F1 ESCs with cuO array inserted 8 kb centromeric to Sox2 TSS and tetO array inserted 117 kb telomeric to Sox2 TSS on the 129 allele. 129 Sox2 allele has been replaced with Sox2-P2A-puro-24xMS2. Cells stably express ePiggyBac vectors epB-UbC-CymRV5- nls-Halox2-DEx4, epB-CAG- TetRFlag-nls-GFPx2, and epB-UbC-tdMS2cp-tagRFP-Tx2 | |
| Cell line (M. musculus) | Sox2-MS2; SCR deletion ESCs | this paper | 129/Cast F1 ESCs with cuO array inserted 8 kb centromeric to Sox2 TSS and tetO array inserted 117 kb telomeric to Sox2 TSS on the 129 allele. 129 Sox2 allele has been replaced with Sox2-P2A-puro-24xMS2. SCR deletion (104 kb-112kb from Sox2 TSS) is present on 129 allele | |
| Cell line (M. musculus) | Sox2-MS2; SCR deletion ESCs | this paper | 129/Cast F1 ESCs with cuO array inserted 8 kb centromeric to Sox2 TSS and tetO array inserted 117 kb telomeric to Sox2 TSS on the 129 allele. 129 Sox2 allele has been replaced with Sox2-P2A- puro-24xMS2. SCR deletion (104 kb-112kb from Sox2 TSS) is present on 129 allele. Cells stably express ePiggyBac vectors epB-UbC -CymRV5-nls-Halox2-DEx4, epB-CAG-TetRFlag-nls-GFPx2, and epB-UbC-tdMS2cp- tagRFP-Tx2 | |
| Cell line (M. musculus) | Sox2-del-SCR ESCs | this paper | 129/Cast F1 ESCs with cuO array inserted 8 kb centromeric to Sox2 TSS and tetO array inserted 117 kb telomeric to Sox2 TSS on the 129 allele. Large deletion (1 kb-112kb from Sox2 TSS) is present on 129 allele. All genetic distances based on reference genome. | |
| Cell line (M. musculus) | Sox2-del-SCR ESCs | this paper | 129/Cast F1 ESCs with cuO array inserted 8 kb centromeric to Sox2 TSS and tetO array inserted 117 kb telomeric to Sox2 TSS on the 129 allele. Large deletion (1 kb-112kb from Sox2 TSS) is present on 129 allele. All genetic distances based on reference genome. Cells stably express ePiggyBac vectors epB-UbC-CymRV5 -nls-GFP-DEx2 and epB-CAG -TetRFlag-nls-tdTom-DEx4. | |
| Cell line (M. musculus) | Sox2-SCR NPCs | this paper | Neural progenitor cells derived from Sox2-SCR ESCs. Cells stably express ePiggyBac vectors epB-UbC -CymRV5-nls-GFP-DEx2 and epB-CAG-TetRFlag-nls -tdTom-DEx4. | |
| Cell line (M. musculus) | Sox2-SCR NPCs | this paper | Neural progenitor cells derived from Sox2-SCR ESCs | |
| Cell line (M. musculus) | Control-Control NPCs | this paper | Neural progenitor cells derived from Control-Control ESCs. Cells stably express ePiggyBac vectors epB-UbC-CymRV5-nls-GFP-DEx2 and epB-CAG-TetRFlag- nls-tdTom-DEx4. | |
| Cell line (M. musculus) | SCR-Control NPCs | this paper | Neural progenitor cells derived from SCR-Control ESCs | |
| Cell line (M. musculus) | SCR-Control NPCs | this paper | Neural progenitor cells derived from SCR-Control ESCs. epB-UbC-CymRV5 -nls-GFP-DEx2 and epB-CAG-TetRFlag-nls-td Tom-DEx4. | |
| Antibody | rat monoclonal PE-conjugated anti-PDGFRα | Thermo Fisher | 12-1401-81; RRID:AB_657615 | Flow 1:400 |
| Antibody | mouse monoclonal anti-SOX2 | Santa Cruz | sc-365823; RRID:AB_10842165 | WB 1:1000, IF 1:100 |
| Antibody | rabbit polyclonal anti-PAX6 | Biolegend | 901301; RRID:AB_2565003 | IF 1:100 |
| Antibody | mouse monoclonal anti-TUBB3 | Biolegend | 801201; RRID:AB_2313773 | IF 1:100 |
| Antibody | mouse monoclonal anti-GFAP | Sigma | G3893; RRID:AB_477010 | IF 1:400 |
| Antibody | rabbit polyclonal anti-βactin | Abcam | ab8227; RRID:AB_2305186 | WB 1:2000 |
| Antibody | anti-Flk1 biotin | PMID: 17084363 | Hybridoma clone D218 Flow 1:100 | |
| Recombinant DNA reagent | pCAGGS-Bxb1o-nlsFlag | this paper | Addgene: 119901 | Expresses Bxb1 integrase in mammalian cells |
| Recombinant DNA reagent | pDEST-tetOx224 _PhiC31attB_loxP- PGKpuro-loxP | this paper | Addgene: 119902 | PhiC31 integration plasmid for tetO array with Neo selection cassette |
| Recombinant DNA reagent | pDEST-cuOx144 _Bxb1attB_loxP- PGKpuro-loxP | this paper | Addgene: 119903 | Bxb1 integration plasmid for cuO array with Puro selection cassette |
| Recombinant DNA reagent | pDEST-tetOx224 _PhiC31attB_FRT- EF1a-GFP-FRT | this paper | Addgene: 119904 | PhiC31 integration plasmid for tetO array with GFP expression cassette |
| Recombinant DNA reagent | pDEST-cuOx144_ Bxb1attB_loxP- EF1a-tagRFP-T-loxP | this paper | Addgene: 119905 | Bxb1 integration plasmid for cuO array with RFP expression cassette |
| Recombinant DNA reagent | epB-UbC_CymRV5 -nls-GFP-DEx2 | this paper | Addgene: 119906 | ePiggyBac mammalian expression plasmid for CymR-GFP fusion |
| Recombinant DNA reagent | epB-UbC_CymRV5 -nls-Halox2_DEx4 | this paper | Addgene: 119907 | ePiggyBac mammalian expression plasmid for CymR-Halo fusion |
| Recombinant DNA reagent | epB-UbC_tdMS2cp -tagRFP-Tx2 | this paper | Addgene: 119908 | ePiggyBac mammalian expression plasmid for tandem dimer MS2cp-tagRFP-T fusion |
| Recombinant DNA reagent | epB_CAG_TetRFlag- nls-tdTom-DEx4 | this paper | Addgene: 119909 | ePiggyBac mammalian expression plasmid for TetR-tdTom fusion |
| Recombinant DNA reagent | epB_CAG_TetRFlag-nls_GFPx2_DEx2 | this paper | Addgene: 119910 | ePiggyBac mammalian expression plasmid for TetR-GFP fusion |
| Recombinant DNA reagent | ePiggyBac-Transposase | this paper | Addgene: 119911 | Mammalian expression plasmid for the ePiggy Bac transposes |
| Recombinant DNA reagent | pKS_Sox2-P2A-puro- 24xMS_targeting_ vector_NoPAM | this paper | Targeting vector for generating Sox2-MS2 allele | |
| Recombinant DNA reagent | pX330-Sox2_3' UTR_gRNA | this paper | Cas9/sgRNA expression vector with gRNA that targets the Sox2 3' UTR | |
| Recombinant DNA reagent | pX330-Sox2- 8C_gRNA | this paper | Cas9/sgRNA expression vector with gRNA that targets 8 kb centromeric to Sox2 TSS | |
| Recombinant DNA reagent | pX330-Sox2- 43T_gRNA | this paper | Cas9/sgRNA expression vector with gRNA that targets 43 kb telomeric to Sox2 TSS | |
| Recombinant DNA reagent | pX330-Sox2- 117T_gRNA | this paper | Cas9/sgRNA expression vector with gRNA that targets 117 kb telomeric to Sox2 TSS | |
| Recombinant DNA reagent | pX330-Sox2- 164T_gRNA | this paper | Cas9/sgRNA expression vector with gRNA that targets 164 kb telomeric to Sox2 TSS | |
| Recombinant DNA reagent | pX330-Sox2- 104T_gRNA | this paper | Cas9/sgRNA expression vector with gRNA that targets 104 kb telomeric to Sox2 TSS | |
| Recombinant DNA reagent | pX330-Sox2- 112T_gRNA | this paper | Cas9/sgRNA expression vector with gRNA that targets 112 kb telomeric to Sox2 TSS | |
| Recombinant DNA reagent | pX330-Sox2- 242T_gRNA | this paper | Cas9/sgRNA expression vector with gRNA that targets 242 kb telomeric to Sox2 TSS | |
| Sequence-based reagent | Sox2 qPCR Forward Primer | this paper | 5'-CTACGCGCACATGAACGG-3' | |
| Sequence-based reagent | Sox2 qPCR Reverse Primer | this paper | 5'-CGAGCTGGTCATGGAGTTGT-3' | |
| Sequence-based reagent | Sox2 qPCR 129 allele Probe | this paper | 5'-/56-FAM/CAACCGATG /ZEN/CACCGCTACGA/ 3IABkFQ/−3' | |
| Sequence-based reagent | Sox2 qPCR Cast allele Probe | this paper | 5'-/56-FAM/CAGCCGATG /ZEN/CACCGATACGA/ 3IABkFQ/−3' | |
| Sequence-based reagent | Tbp qPCR Forward Primer | this paper | 5'-ACACTCAGTTACAGGTGGCA-3' | |
| Sequence-based reagent | Tbp qPCR Reverse Primer | this paper | 5'-AGTAGTGCTGCAGGGTGATT-3' | |
| Sequence-based reagent | Tbp qPCR Pan allele Probe | this paper | 5'-/56-FAM/ACACTGTGT/ ZEN/GTCCTACTGCA/3IABkFQ/−3' | |
| Sequence-based reagent | Genotyping PCR Primers | this paper | see Supplementary file 1 | |
| Sequence-based reagent | CRISPR guide sequences | this paper | see Supplementary file 2 | |
| Peptide, recombinant protein | Leukemia inhibitory factor (Lif) | Peprotech | 250–02 | |
| Peptide, recombinant protein | APC-Streptavidin | BD-Biosciences | 554067; RRID:AB_10050396 | Flow 1:200 |
| Peptide, recombinant protein | Insulin | Sigma | I6634 | |
| Peptide, recombinant protein | Epidermal growth factor (EGF) | Peprotech | 315–09 | |
| Peptide, recombinant protein | Fibroblast growth factor basic (Fgfb) | R and D Systems | 233-FB | |
| Peptide, recombinant protein | Natural mouse laminin | Thermo Fisher | 23017015 | |
| Peptide, recombinant protein | Bone morphogenetic protein 4 (BMP4) | R and D Systems | 314 BP | |
| Peptide, recombinant protein | Vascular endothelial growth factor (VEGF) | R and D Systems | 293-VE | |
| Peptide, recombinant protein | Activin A | R and D Systems | 338-AC | |
| peptide, recombinant protein | Fibroblast growth factor 10 (Fgf10) | R and D Systems | 345-FG | |
| Peptide, recombinant protein | Laminin-511 | iWaichem | N-892011 | |
| Chemical compound, drug | Prolong Live Antifade Reagent | Thermo Fisher | P36975 | |
| Chemical compound, drug | ascorbic acid | Sigma | A45-44 | |
| Chemical compound, drug | 1-thioglycerol | Sigma | M6145 | |
| Chemical compound, drug | PD03259010 | Selleckchem | S1036 | |
| Chemical compound, drug | CHIR99021 | Selleckchem | S2924 | |
| Chemical compound, drug | 5,6-Dichlorobenzimidazole 1-β-D-ribofuranoside | Sigma | D1916 | |
| Chemical compound, drug | JF646 | PMID: 28869757 | ||
| Software, algorithm | MS2Reporter AnalysisPipeline_knn Model.py | this paper | Python scripts can be accessed on github (Alexander, 2018; copy archived at https://github.com/elifesciences-publications/2018_eLife_Alexander_et_al) | |
| Other | Tetraspeck fluorescent beads | Thermo Fisher | T7279 | |
| Commerical assay, kit | KAPA Library Quantification Kit | Roche | KK4854 | |
| Commerical assay, kit | SPRIselect | Beckman Coulter | B23319 |
Additional files
-
Supplementary file 1
Protocol for insert of cuO-/tetO-arrays into mouse ESCs.
Protocols for targeting the cuO and/or tetO array(s) into genomic regions of interest in mouse ESCs.
- https://doi.org/10.7554/eLife.41769.024
-
Supplementary file 2
Primer sequences used in cell line characterization.
List of PCR primer sequences and expected amplicon size used in the study. Brief description of the purpose of each primer pair is included.
- https://doi.org/10.7554/eLife.41769.025
-
Supplementary file 3
20 bp guide RNA sequences used in CRISPR/Cas9 genome engineering.
List of 20 bp sequences homologous to the mouse 129 genome designed into CRISPR/Cas9 sgRNAs. Targeted genomic location (mm9 coordinates), genome strand, and brief description of purpose for sgRNA is included.
- https://doi.org/10.7554/eLife.41769.026
-
Supplementary file 4
Data table from 3D tracking of cuO/CymR and tetO/TetR labels.
All data used in the study for cuO/CymR and tetO/TetR localization. C1 refers to Channel 1 (cuO/CymR). C2 refers to Channel2 (tetO/TetR). For examples of raw and denoised data files that were used for this analysis, see doi: 10.5281/zenodo.2658814; https://zenodo.org/record/2658814#.XNDLAhNKjyw. Columns are as follows:
Cell_Line– label used to identify cell line
Batch– unique microscopy session identifier
C1_T_Step-sec– step size between frames
Locus_ID– unique identifier for each Sox2 locus
C1_TrackID– track identifier from TrackMate
C1_Track_Length– track length from TrackMate
C1_SpotID– spot identifier from TrackMate
C1_X_Value_pixel – X position in pixels for C1 spot
C1_Y_Value_pixel – Y position in pixels for C1 spot
C1_Z_Value_slice – Z position in slices for C1 spot
C1_T_Value_frame – frame of measurement
C1_X_Value_um – X position in microns for C1 spot
C1_Y_Value_um – Y position in microns for C1 spot
C1_Z_Value_um – Z position in microns for C1 spot
C1_T_Value_sec – time point in seconds for measurement
C2_TrackID– track identifier from TrackMate
C2_Track_Length– track length from TrackMate
C2_SpotID– spot identifier from TrackMate
C2_X_Value_pixel – X position in pixels for C2 spot
C2_Y_Value_pixel – Y position in pixels for C2 spot
C2_Z_Value_slice – Z position in slices for C2 spot
C2_T_Value_frame – imaging frame
C2_X_Value_um – X position in microns for C2 spot
C2_Y_Value_um – Y position in microns for C2 spot
C2_Z_Value_um – Z position in microns for C2 spot
C2_T_Value_sec – time point in seconds
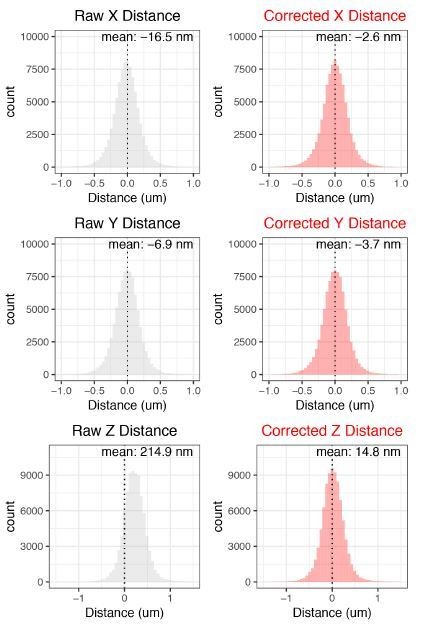
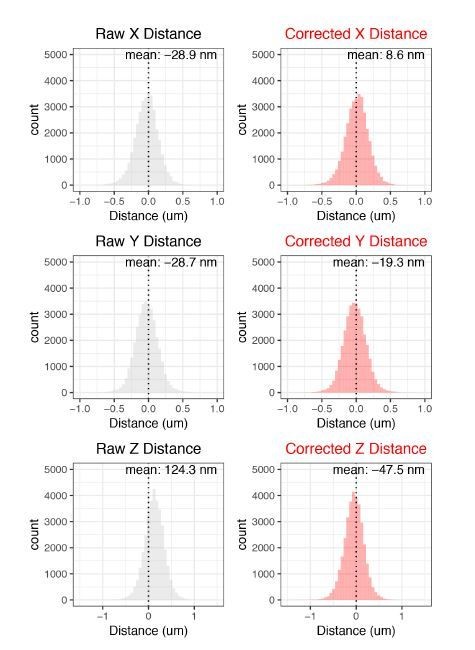
X_Distance_um– X distance between C1 and C2 labels
Y_Distance_um– Y distance between C1 and C2 labels
Z_Distance_um– Z distance between C1 and C2 labels
XY_Distance_um– XY distance between C1 and C2 labels
XYZ_Distance_um–XYZ distance between C1 and C2 labels,
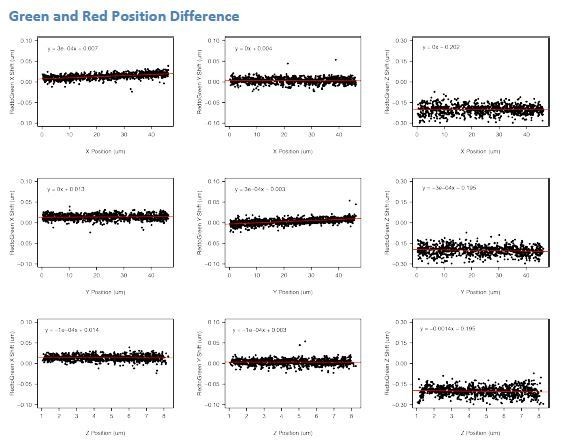
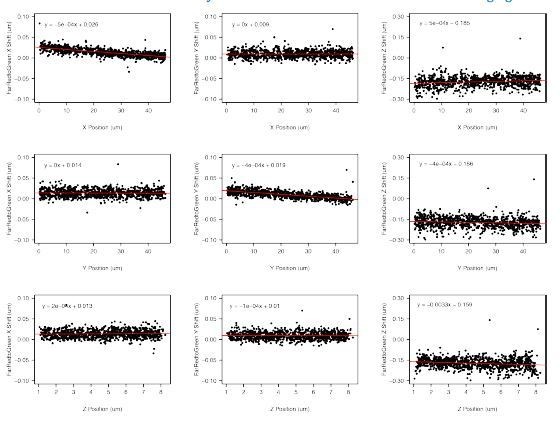
C1_Corrected_X_Value_um – X position in microns for C1 spot after correcting for chromatic aberration,
C1_Corrected Y_Value_um–Y positfion in microns for C1 spot after correcting for chromatic aberration
C1_Corrected Z_Value_um–Z position in microns for C1 spot after correcting for chromatic aberration
Corrected_X_Distance_um–X distance after correcting for chromatic aberration
Corrected_Y_Distance_um – Y distance after correcting for chromatic aberration
Corrected_Z_Distance_um – Z distance after correcting for chromatic aberration
Corrected_XY_Distance_um – XY distance after correcting for chromatic aberration
Corrected_XYZ_Distance_um – XYZ distance after correcting for chromatic aberration
Relative_C1_Corrected_X_Value_um–X position of C1 label relative to the position of C2 in microns
Relative_C1_Corrected_Y_Value_um–Y position of C1 label relative to the position of C2 in microns
Relative_C1_Corrected_Z_Value_um–Z position of C1 label relative to the position of C2 in microns
Relative_XY_Displacement_um–Relative XY distance traveled by the C1 label between adjacent frames
Relative_XYZ_Displacement_um–Relative XYZ distance traveled by the C1 label between adjacent frames
Relative_XY_Angle_radians–Relative angle between two successive displacements for the C1 label in the XY plane
- https://doi.org/10.7554/eLife.41769.027
-
Supplementary file 5
Data table for MS2 transcription analysis for all loci.
All data used in transcriptional analysis of Sox2 locus. Columns are as follows:
Cell_Line– label used to identify cell line
Locus_ID– unique identifier for each Sox2 locus
Gauss_Filter– whether the MS2 Gaussian fit passed the knn filter step
Noise_Filter–whether the MS2 Gaussian fit passed a high frequency noise filter step
Pass_Filter–whether the MS2 signal for the given frame was classified as transcriptional signal. Required both Gauss_Filter = TRUE and Noise_Filter = TRUE
Gaussian_Height_Threshold–minimum relative height above background allowed for Gaussian fit
Gaussian_Width_Threshold–maximum Gaussian variance allowed for Gaussian fit
Background–Offset calculated from Gaussian fit. If no Gaussian fit was found, set to median pixel intensity of ROI
Gaussian Height–Amplitude calculated from Gaussian fit. If no Gaussian fit was found, set to 0
Gaussian_Volume–Volume under fitted Gaussian. If no Gaussian fit was found, set to 0
Local_Median–Median pixel intensity of ROI
Norm_MS2_Signal–Relative height of MS2 gaussian normalized to background. For frames that did not pass filter, local median value was used in pace of gaussian height. See MATERIALS and METHODS for more details.
R_Squared–Coefficient of determination between 2D gaussian fit and experimental data
T_Value_frame– imaging frame
X_Value_pixel– X position in pixels for C2 spot (cuO/CymR)
X_Location– X position of peak of fit Gaussian
X_Sigma– X dimension variance of fit Gaussian
Y_Value_pixel– Y position in pixels for C2 spot (cuO/CymR)
Y_Location– Y position of peak of fit Gaussian
Y_Sigma– Y dimension variance of fit Gaussian
Z_Value_slice– Z position in slices for C2 spot (cuO/CymR)
Batch– unique microscopy session identifier.
- https://doi.org/10.7554/eLife.41769.028
-
Supplementary file 6
Data table for MS2 transcription analysis and 3D localization for Sox2-SCR Singlets.
Data used to compare transcriptional activity of Sox2 locus to 3D distances between Sox2 and SCR. C1 refers to Channel 1 (tetO/TetR). C2 refers to Channel2 (cuO/CymR). Columns are as in Supplementary files 3 and 4 with one additional column: Active_Transcribing– Whether the locus demonstrated any MS2 signal that passed filter during imaging session.
- https://doi.org/10.7554/eLife.41769.029
-
Supplementary file 7
Data table of atatistical comparison of distances centered on transcriptional bursts.
Summary statistics and associated Mann-Whitney p-values for pairwise comparisons between burst centered and random centered distances.
- https://doi.org/10.7554/eLife.41769.030
-
Transparent reporting form
- https://doi.org/10.7554/eLife.41769.031
Download links
A two-part list of links to download the article, or parts of the article, in various formats.
Downloads (link to download the article as PDF)
Open citations (links to open the citations from this article in various online reference manager services)
Cite this article (links to download the citations from this article in formats compatible with various reference manager tools)
Live-cell imaging reveals enhancer-dependent Sox2 transcription in the absence of enhancer proximity
eLife 8:e41769.
https://doi.org/10.7554/eLife.41769


