Human hippocampal CA3 damage disrupts both recent and remote episodic memories
- University of Oxford, United Kingdom
- Royal Free Hospital, United Kingdom
- Monash University, Australia
- Australian National University, Australia
- Imperial College London, United Kingdom
- University Hospitals of Birmingham, United Kingdom
- Queen’s Medical Centre, United Kingdom
- University of Nottingham, United Kingdom
Figures
Figure 1
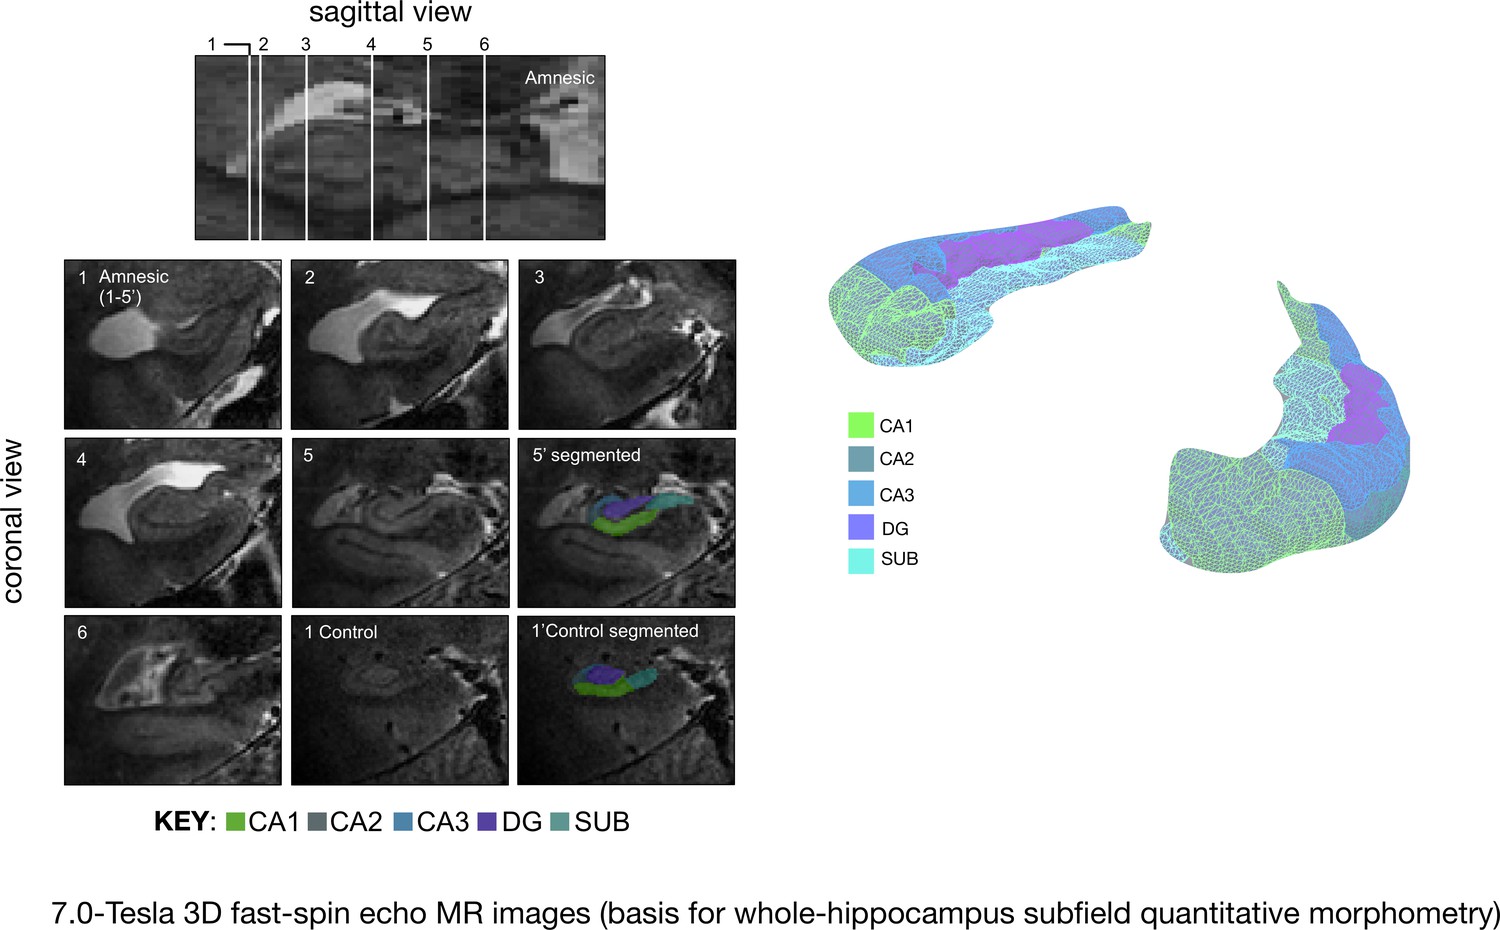
Quantitative three-dimensional whole-hippocampal manual volumetry of five hippocampal subfields (CA1, CA2, CA3, the dentate gyrus, and the subiculum).
Left panel: native coronal images from whole-hippocampal 7.0-Tesla 3-D fast-spin echo sequence (0.39 × 0.39 × 1.0 mm3 spatial resolution). Quantitative three-dimensional whole-hippocampal manual volumetry of five hippocampal subfields (CA1, CA2, CA3, the dentate gyrus, and the subiculum) was conducted along the full longitudinal axis of participants in the amnesic group (N = 15) and control group (N = 15). Colored shading on the coronal images provides examples from applying the manual hippocampal subfield segmentation protocol in a participant at the chronic phase of the LGI1-antibody-complex LE phenotype (5′) and in a control (1′). Each of the white lines (1–6) on the sagittal view of the hippocampus corresponds to six example coronal locations along the anterior–posterior axis. 7.0-Tesla 3-D fast-spin echo scans and results from manual volumetry were reported in our previous study on 18 participants assessing the chronic phase of the LGI1-antibody-complex LE phenotype (Miller et al., 2017). Right panel: example 3-D rendering (Paraview v4.10; www.paraview.org) obtained from the output of hippocampal subfield segmentation generated for a participant from the amnesic group using ITK-SNAP v3.2 (http://www.itksnap.org). The color key under the 3-D FSE coronal images and color key 3-D render corresponds to CA1, CA2, CA3, DG (dentate gyrus), and SUB (subiculum) hippocampal subfields. Adapted from Miller et al. (2017), published under CC BY license, http://creativecommons.org/licenses/by/4.0/.
Figure 2 with 1 supplement
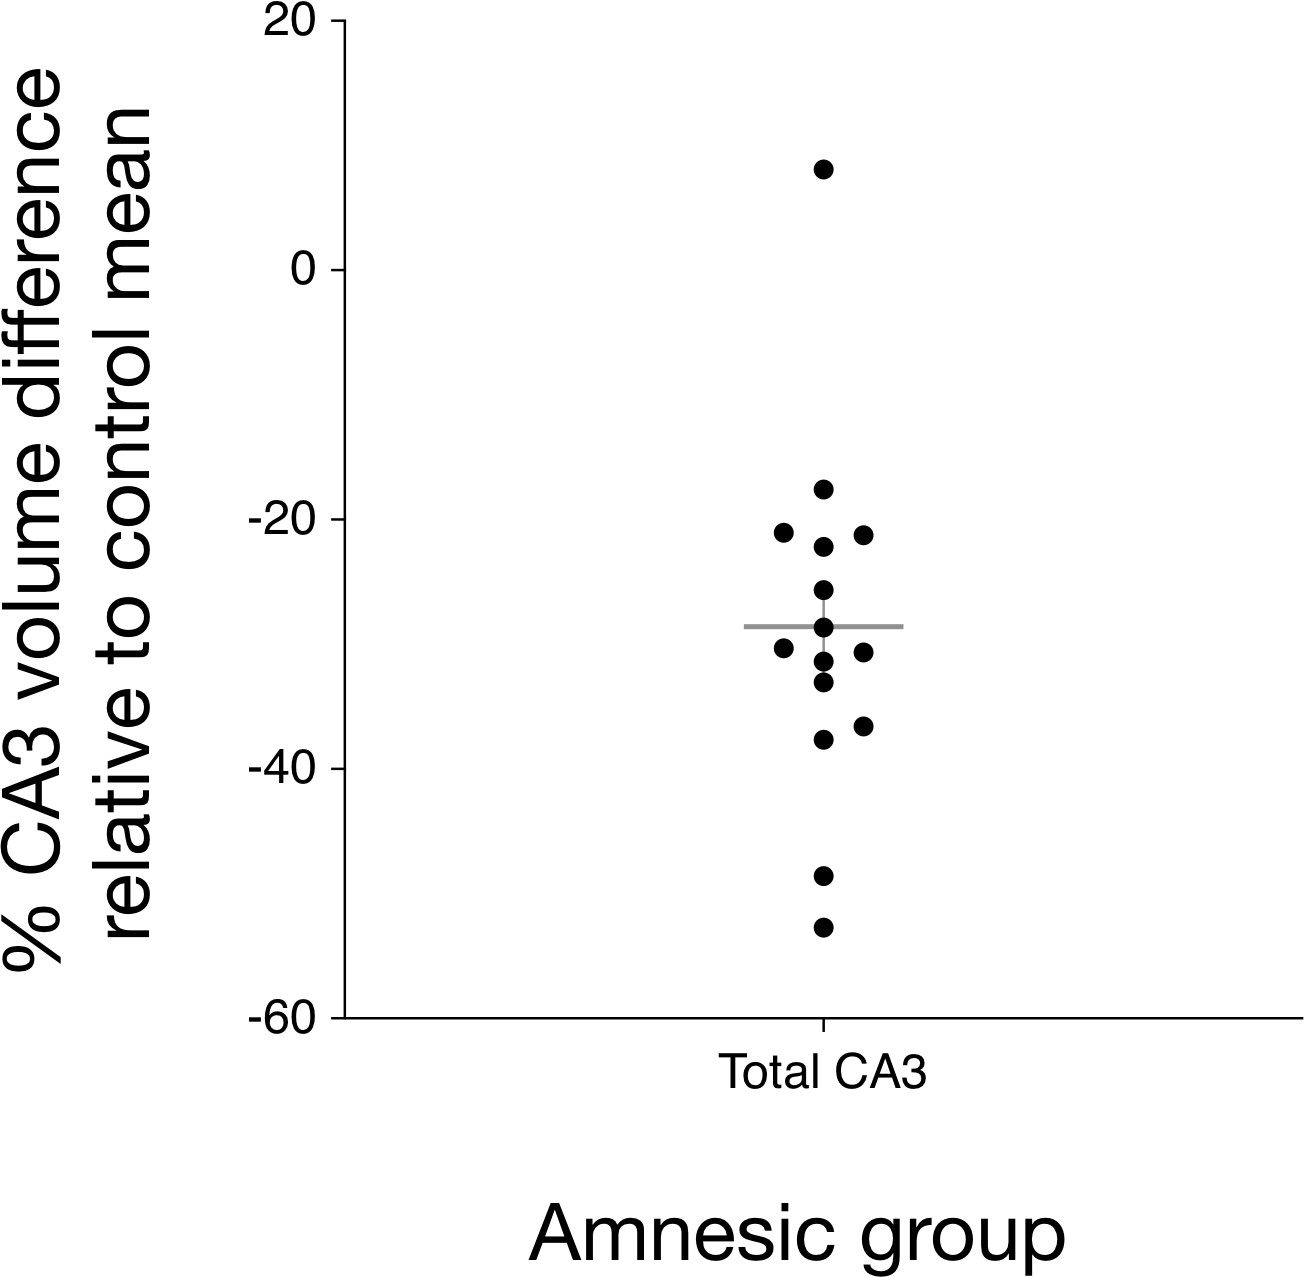
Bilateral hippocampal CA3 volume loss in the amnesic group.
The graph depicts the reduction in CA3 subfield volume (CA3 subfield volume was corrected for total intracranial volume) relative to the control group mean. Error bars correspond to the s.e.m. and the horizontal line corresponds to the mean. A three-way mixed-model ANOVA, with two within-subjects factors (subfield and side) and one between-subjects factor (group), was used to test for differences in hippocampal subfield volumes between the amnesic (N = 15) and control (N = 15) groups. The assumption of sphericity was violated for subfield (χ2(9) = 52.46, p<0.0001) and for the interaction between subfield and side (χ2(9) = 63.48, p<0.0001), so degrees of freedom were corrected using Greenhouse-Geisser correction (ɛ = 0.551). Significant two-way interactions were found between group and subfield (F(5.30,61.74) = 5.30, p=0.006), and between side and subfield (F(2.02,56.55)=14.15, p<0.0001), but not between group and side (F(1,28) = 1.25, p=0.272). The three-way interaction was not significant (F(2.02,56.55) = 0.43, p=0.66). Subfield volumes were collapsed across left and right due to the absence of the significant three-way interaction. Significant bilateral CA3 volume loss was seen in the amnesic group relative to the control group (F(1,28) = 14.52, p=0.001, Cohen’s d = 1.39; mean reduction = –29%), whereas the differences in CA1, CA2, subiculum, and dentate gyrus volumes were not statistically significant at the Holm-Bonferroni alpha criterion corrected for multiple comparisons. Mean normalized total volumes for all segmented subfields are reported in Table 1 and subfield volumes for individual participants are plotted in Figure 2—figure supplement 1. 7.0-Tesla 3-D fast-spin echo scans and results from manual volumetry are a subgroup of those reported in our previous clinical study involving 18 participants at the chronic phase of the LGI1-antibody-complex LE phenotype (Miller et al., 2017).
Figure 2—figure supplement 1
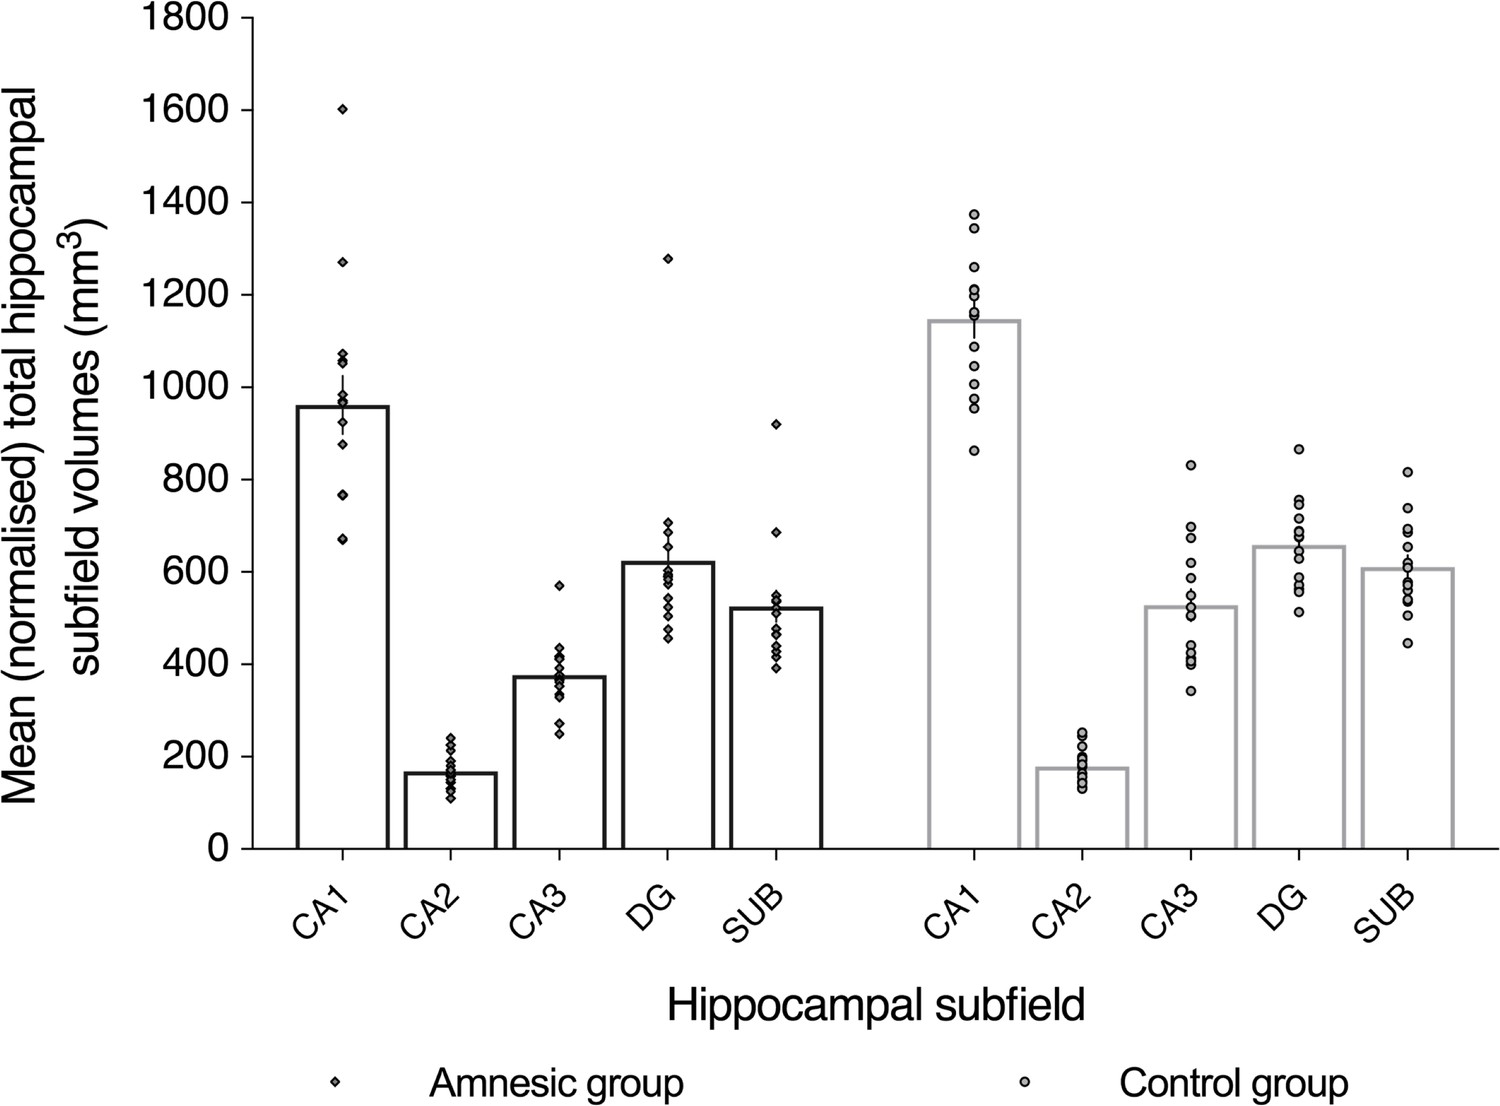
Plot of mean (normalized) total hippocampal subfield volumes (mm3) for participants in the amnesic group and control group.
All subfield volumes were normalized to the total intracranial volumes obtained from the voxel-based morphometry (VBM) analyses. Volumes were collapsed across the left and right hippocampi because there was no significant interaction between group (amnesic, control), side (left, right), and subfield (CA1, CA2, CA3, DG, and SUB) (F(2.02,56.55) = 0.43, p=0.66, η2p = 0.015; Figure 2). CA3 volume was reduced in the amnesic group relative to the control group (F(1,28) = 14.52, p=0.001, Cohen’s d = 1.39; mean reduction = –29%). Volume loss in CA1 was not significant (mean volume loss = -16%, F(1,28) = 5.25, p-uncorrected = 0.019, Cohen’s d = 0.91), when the alpha criterion was Holm-Bonferroni corrected for multiple comparisons. All other subfields were non-significant at the alpha criterion corrected for multiple comparisons. Insufficient contrast for delineation between the subfield boundaries on each coronal slice precluded hippocampal subfield segmentation of one participant who was included in the results from the Autobiographical Interview (AI). Horizontal lines correspond to the mean of each total subfield volume and the corresponding error bars depict the ± standard errors of the mean (s.e.m.). CA1 = cornu ammonis 1, CA2 = cornu ammonis 2, CA3 = cornu ammonis 3, DG = dentate gyrus, and SUB = subiculum. Individual data points are shown as a gray diamond for an amnesic group participant and as a gray circle for a control group participant.
Figure 3
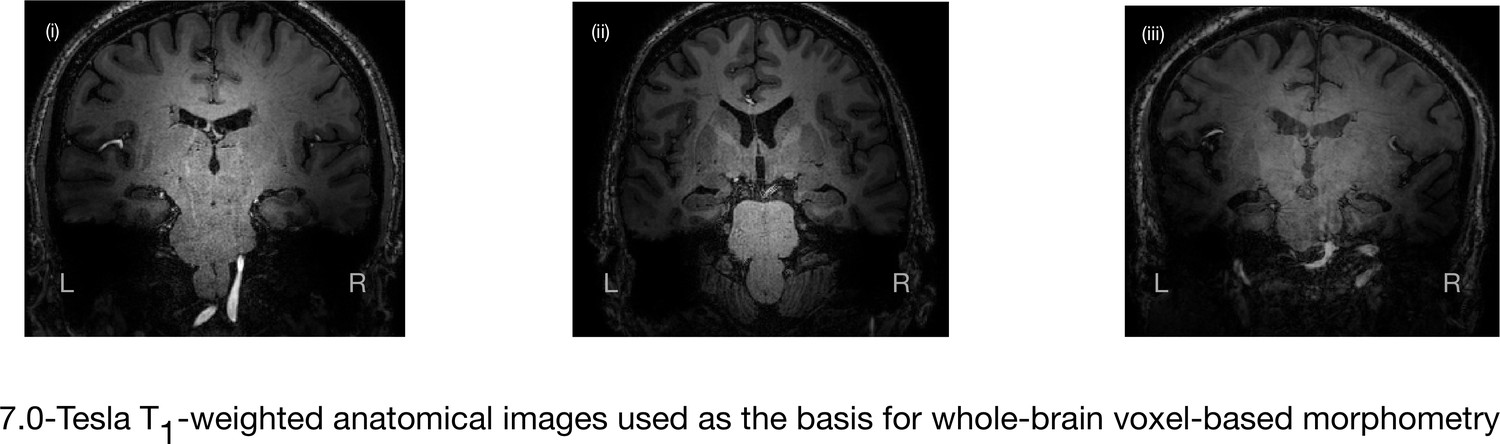
7.0-Tesla whole-brain anatomical magnetic resonance imaging.
Whole-brain 7.0-Tesla T1-weighted anatomical (600 µm isotropic spatial resolution) coronal images from three participants in the amnesic group (i–iii), illustrating significant in vivo volume loss in the hippocampus. T1-weighted anatomical images from participants in the amnesic and control groups were used to conduct whole-brain voxel-based morphometry (VBM). The 7.0-Tesla T1-weighted anatomical images are a subgroup re-analysis of those reported in our previous clinical study involving 18 participants at the chronic phase of the LGI1-antibody-complex LE phenotype (Miller et al., 2017). Normalized gray matter in the amnesic group and in the control group participants, derived from the whole-brain VBM analysis, were contrasted using a two-sample t-test and thresholded at p<0.05 family-wise error corrected for multiple comparisons with SPM12. No evidence of significant gray matter volume loss was found outside of the hippocampus in the amnesic group relative to the control group (see ‘Results’ section), which is in agreement with the results from VBM reported in our previous study (Miller et al., 2017). Adapted from Miller et al. (2017), published under CC BY license, http://creativecommons.org/licenses/by/4.0/.
Figure 4 with 1 supplement
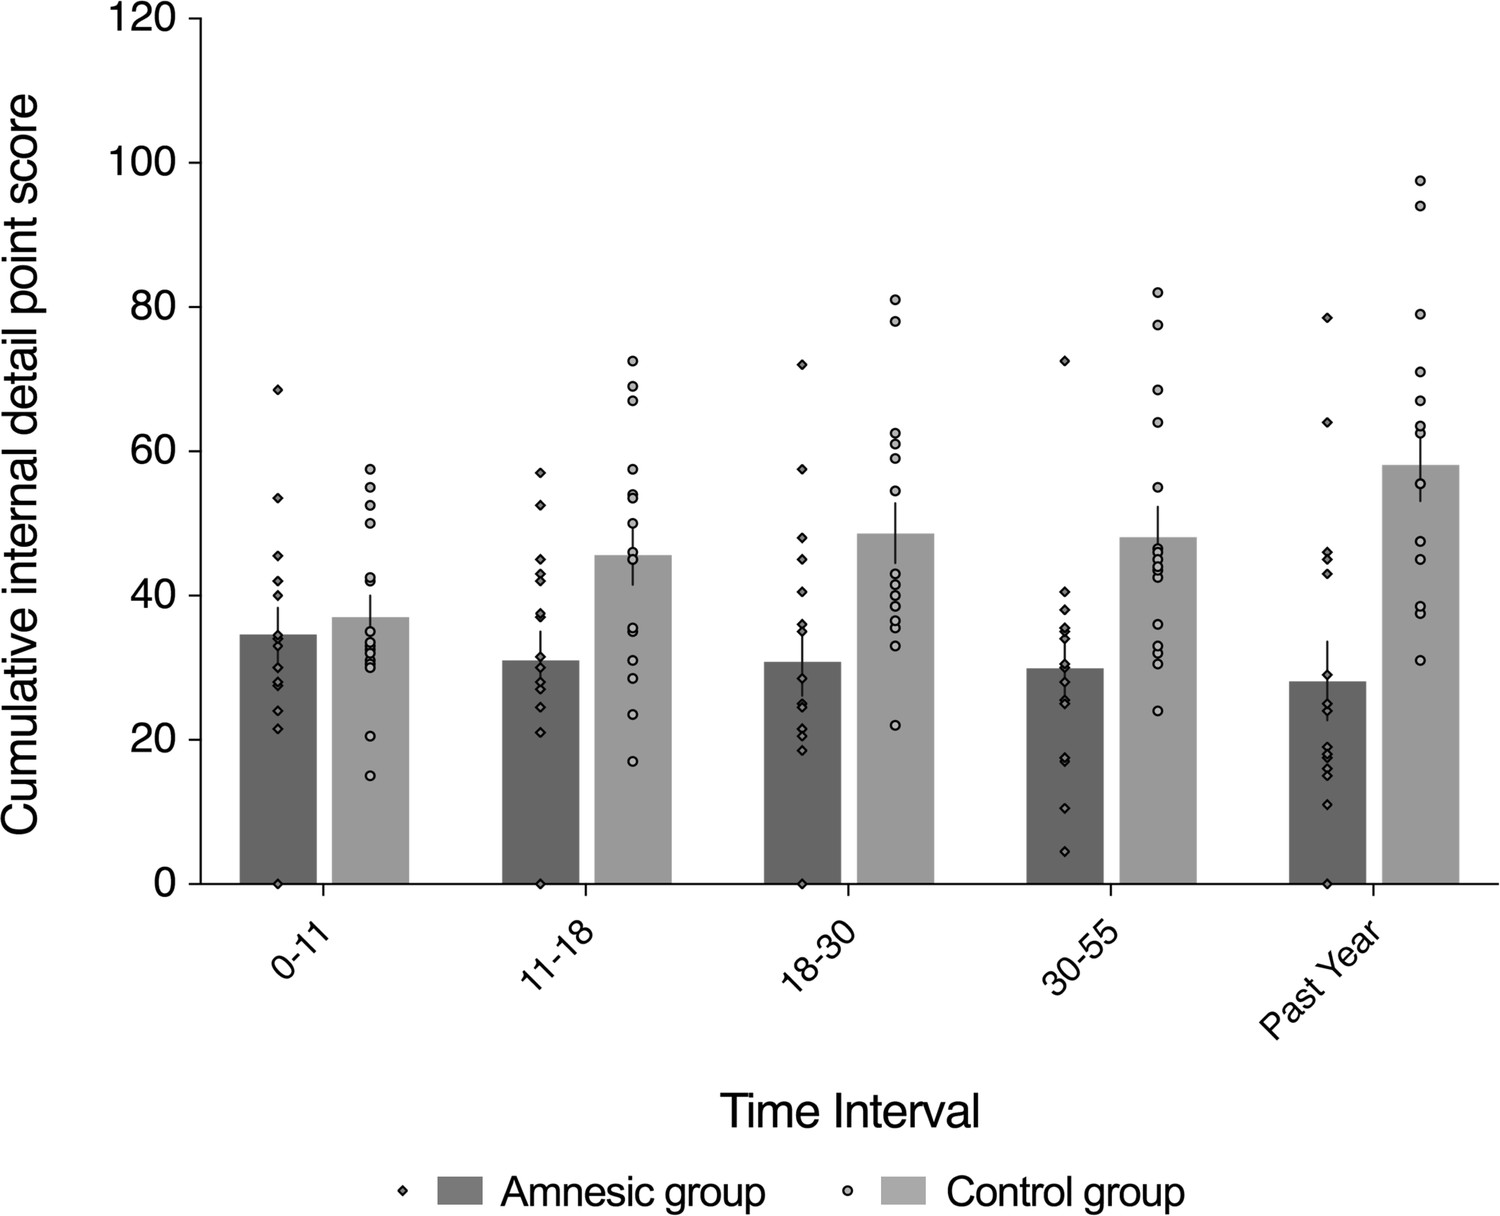
Loss of internal (episodic) detail in the amnesic group for recent and remote memories (up to ~50 years prior to the CA3 damage).
Plot depicts mean cumulative number (summed across the general and specific probes) of internal (episodic) details generated on the AI across the five sampled intervals, as a function of group (amnesic group, N = 16; control group, N = 16). With the exception of the past year, each time interval refers to the age of the participant at the time of the remembered event; for example, 18–30 years refers to an event that occurred when each participant was between 18–30 years-of-age. A significant interaction between group and time (across all five sampled intervals) suggests that the loss of internal (episodic) detail was time-sensitive (F(2.67,80.22) = 3.91, p=0.015, η2p = 0.115). Post hoc analyses revealed that the earliest remote memory (0–11 years) was intact (F(1,30) = 0.250, p=0.621), whereas there was temporally ungraded loss of internal detail across the remaining remote and recent memories (group: F(1,30) = 23.25, p<0.0001, η2p = 0.437; group x time: F(2.62,78.44) = 1.51, p=0.222, η2p = 0.048; time: F(2.62,78.44) = 0.604, p=0.592, η2p = 0.020), extending up to ~50 years prior to the CA3 damage (11–18 year interval for internal detail, F(1,30) = 6.43, p=0.017). Error bars correspond to the s.e.m.
Figure 4—figure supplement 1

Scatterplots of CA3 volume against total internal detail.
CA3 volumes were normalized against the total intracranial volumes obtained from the VBM analyses and were collapsed across the left and right hippocampi because there was no significant interaction term between group (amnesic, control), side (left, right), and subfield (CA1, CA2, CA3, DG, and SUB) (F(2.02,56.55) = 0.43, p=0.66; Figure 2). Insufficient contrast for delineation between the subfield boundaries on each coronal slice precluded the hippocampal subfield segmentation of one participant who was included in results from the AI. (A) At a single group level, the correlation between internal details and CA3 volume was not significant for the amnesic group (Kendall’s τ (15) = −0.018, p=0.961, two-tailed) and for the control group (Kendall’s τ(15) = 0.43, p=0.458, two-tailed),possibly due to the small sample size and variability (15/group) (for individual data points: dark gray diamond = amnesic group participant; gray circle = control group participant); and, (B) significant association between total mean CA3 volume and total internal (episodic) detail, when these variables were collapsed across group (Kendall’s τ(30) = 0.287, p=0.026, two-tailed). The solid black line shows the best-fitting linear regression line and the dashed lines show 95% confidence intervals (β = 0.18, t = 2.05, p=0.049) (for individual data points: gray square = amnesic group or control group participant).
Figure 5

External (non-episodic, mainly personal semantic) detail was intact for recent and remote memories (~1–60 year interval).
The plot depicts mean cumulative (summed across the general and specific probes) number of external details generated on the AI across the five sampled intervals, as a function of group (amnesic group, N = 16; control group, N = 16). With the exception of the past year, each time interval refers to age of the participants at the time of the remembered event; for example, 18–30 years refers to an event that occurred when each participant was between 18 and 30 years-of-age. The specificity of the deficit in internal (episodic) detail was revealed by the absence of a significant between-group difference in the amount of external (semantic) detail remembered over the five internals (F(1,30) = 1.24, p=0.275, η2p = 0.040), and the interaction between group and time was not significant (F(4,120) = 1.46, p=0.218, η2p = 0.046). Evidence for a null group difference in external detail aligns with the more general preservation of associative semantic memory (Camel and Cactus Test) (mean z-score = 0.20, s.e.m. = 0.30, t(14) = 0.67, p=0.514, two-tailed one-sample t-test) (Bozeat et al., 2000). Error bars correspond to the s.e.m.
Figure 6
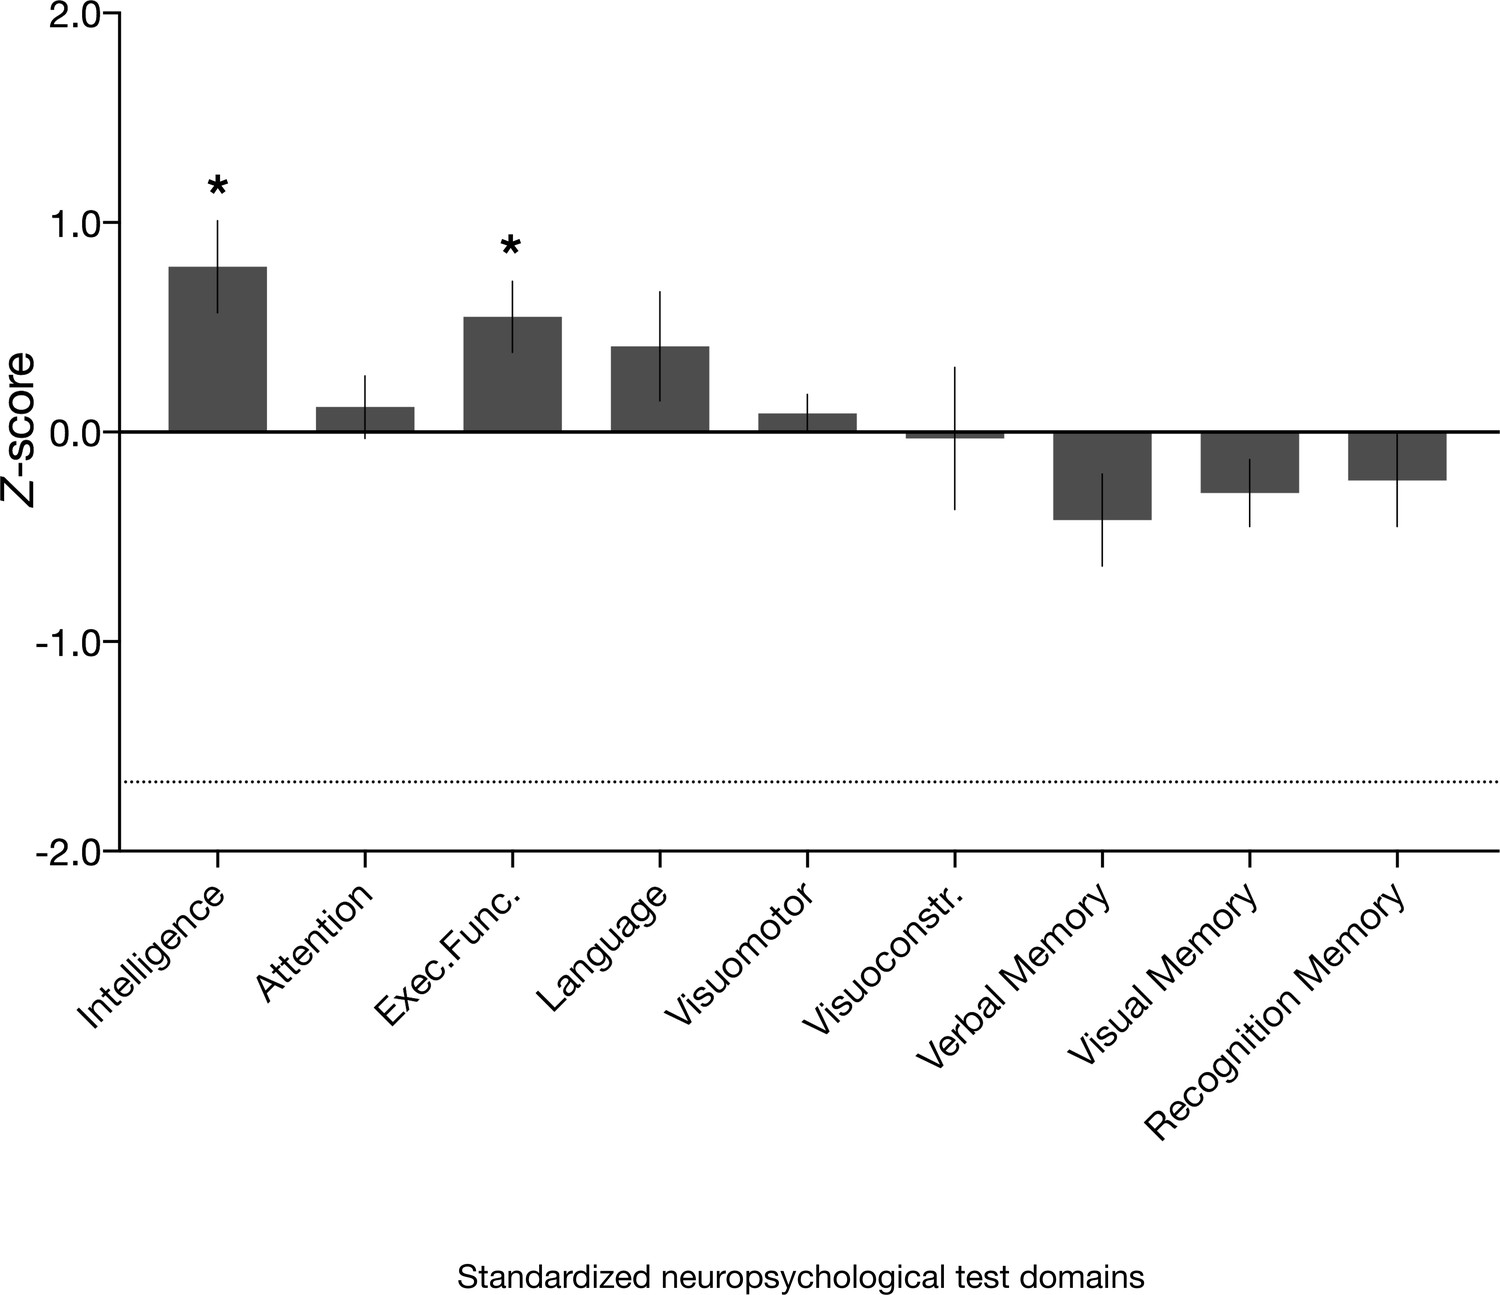
Neuropsychological domain performance in the amnesic group.
Comprehensive assessment using standardized neuropsychological tests revealed that the scores for the amnesic group were comparable or significantly above normative data on composite measures of intelligence, attention, executive function, language, visuomotor skills, visuoconstruction skills, verbal memory, visual memory, and recognition memory (see 'Materials and methods' for individual subtest tests underlying the domain scores; Supplementary file 1a contains detailed results and N for each domain). Delayed verbal recall performance (which contributed to the verbal memory domain) was significantly different from normative data (N = 16, average z-score = −0.77, s.e.m. = 0.24, t(15) = –3.16, p=0.006), but above the threshold that typically indicates severe impairment (−1.67). Delayed verbal recall was comprised of Logical Memory II, Logical Memory II themes and Word Lists II (Wechsler Memory Scale–third edition [WMS-III]) and Doors and People, People Recall Test. By contrast, delayed visual recall (comprised of Rey Delayed Recall) was intact (average z = −0.08, s.e.m. = 0.20, t(15) = 0.41, p=0.685). Visuomotor = visuomotor skils; Visuoconstr. = visuoconstruction skills. Error bars correspond to the s.e.m.
Figure 7 with 2 supplements
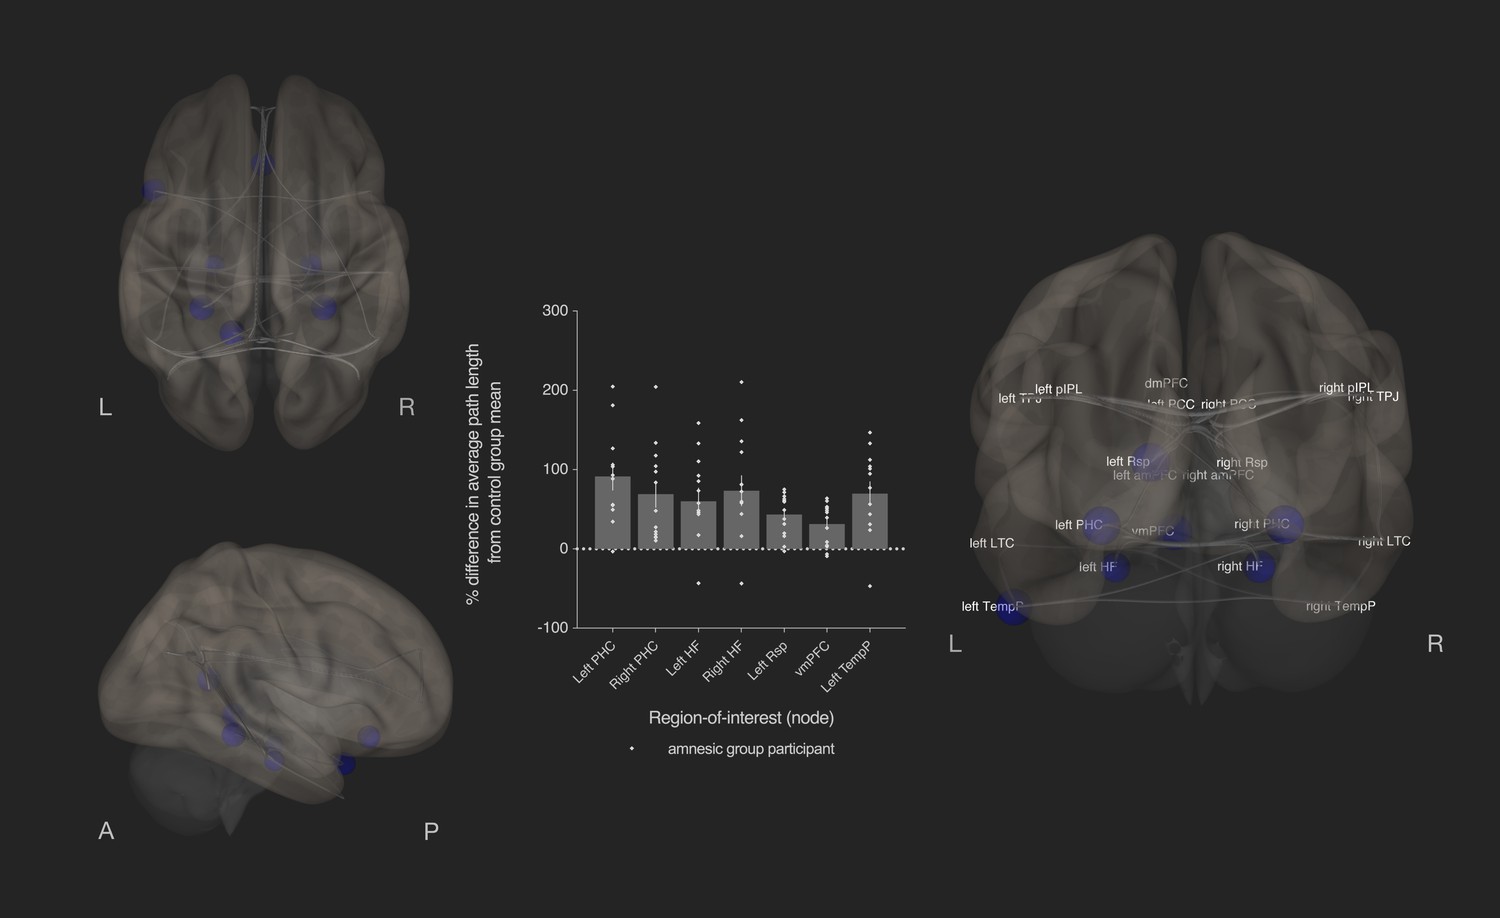
Bilateral damage to human CA3 disrupted integration of the MTL subsystem.
Results from graph theoretic analyses of the DN in the amnesic and control groups, derived from 4-D rs-fMRI EPI images acquired at 7.0-Tesla MRI field strength. 3-D rendered brain depicts nodes (DN vertices/brain regions-of-interest) and their associated edges (paths between nodes) used to define the DN. The size of a node represents the beta values for that node. Network edges (adjacency matrix threshold): z > 0.84, one-sided (positive); analysis threshold: p-FDR corrected <0.05 (two-sided). Increased average path length of left and right parahippocampal cortex (MNI co-ordinates −28,–40,−12, β = −1.41, t = −3.51, p-FDR = 0.013; 28,–40,−12, β = −1.40, t = −3.53, p-FDR = 0.013, respectively), left retrosplenial cortex (MNI co-ordinates -14,-52,8, β = −0.75, t = −3.55, p-FDR = 0.013), left and right hippocampal formation (MNI co-ordinates −22,–20,−26, β = −0.93, t = −2.72, p-FDR = 0.033 and MNI co-ordinates 22,–20,26, β = −1.18, t = −2.99, p-FDR = 0.020, respectively), ventromedial prefrontal cortex (vmPFC) (MNI co-ordinates 0,26,–18, β = −1.52, t = −3.32, p-FDR = 0.020), and left temporal pole of the dmPFC subsystem (MNI co-ordinates −50,14,–40, β = −1.18, t = −3.34, p-FDR = 0.013) in the amnesic group compared to the control group. The plot depicts differences in average path length at these MTL subsystem nodes and at the left temporal pole when comparing the amnesic group participants against the control group mean. Error bars correspond to the s.e.m.. *, p<0.05. The differences in average path length of the left PHC, left hippocampal formation, right hippocampal formation, left retrosplenial cortex, vmPFC, and left temporal pole were predictive of the retrieval of episodic details (i.e., mean composite internal details scored across all intervals). Comparable between-group differences in network topology were observed when an alternate threshold was used to test for functional connections (see section on stability of the effects and Supplementary files 1h–1m). Renders are depicted at the same threshold as those used to assess significance (i.e., p-FDR corrected <0.05 [two-sided]).
Figure 7—figure supplement 1

Between-group hippocampal seed-to-voxel functional connectivity, at a lenient, p-uncorrected <0.05 cluster-size threshold.
Left and right hippocampal seed regions were not associated with significant between-group differences in functional connectivity, when assessed at a cluster-size p-FDR set at <0.05 and height threshold set at p-uncorrected <0.001 (two-sided). Axial image depicts activity in a cluster that exhibited functional connectivity with the left hippocampal seed region at a lenient, p-uncorrected <0.05 cluster-size threshold. There were no significant clusters for the right hippocampal seed region even when between-group differences were assessed at a cluster-size threshold set at p-uncorrected <0.05 (see Supplementary file 1o).
Figure 7—figure supplement 2
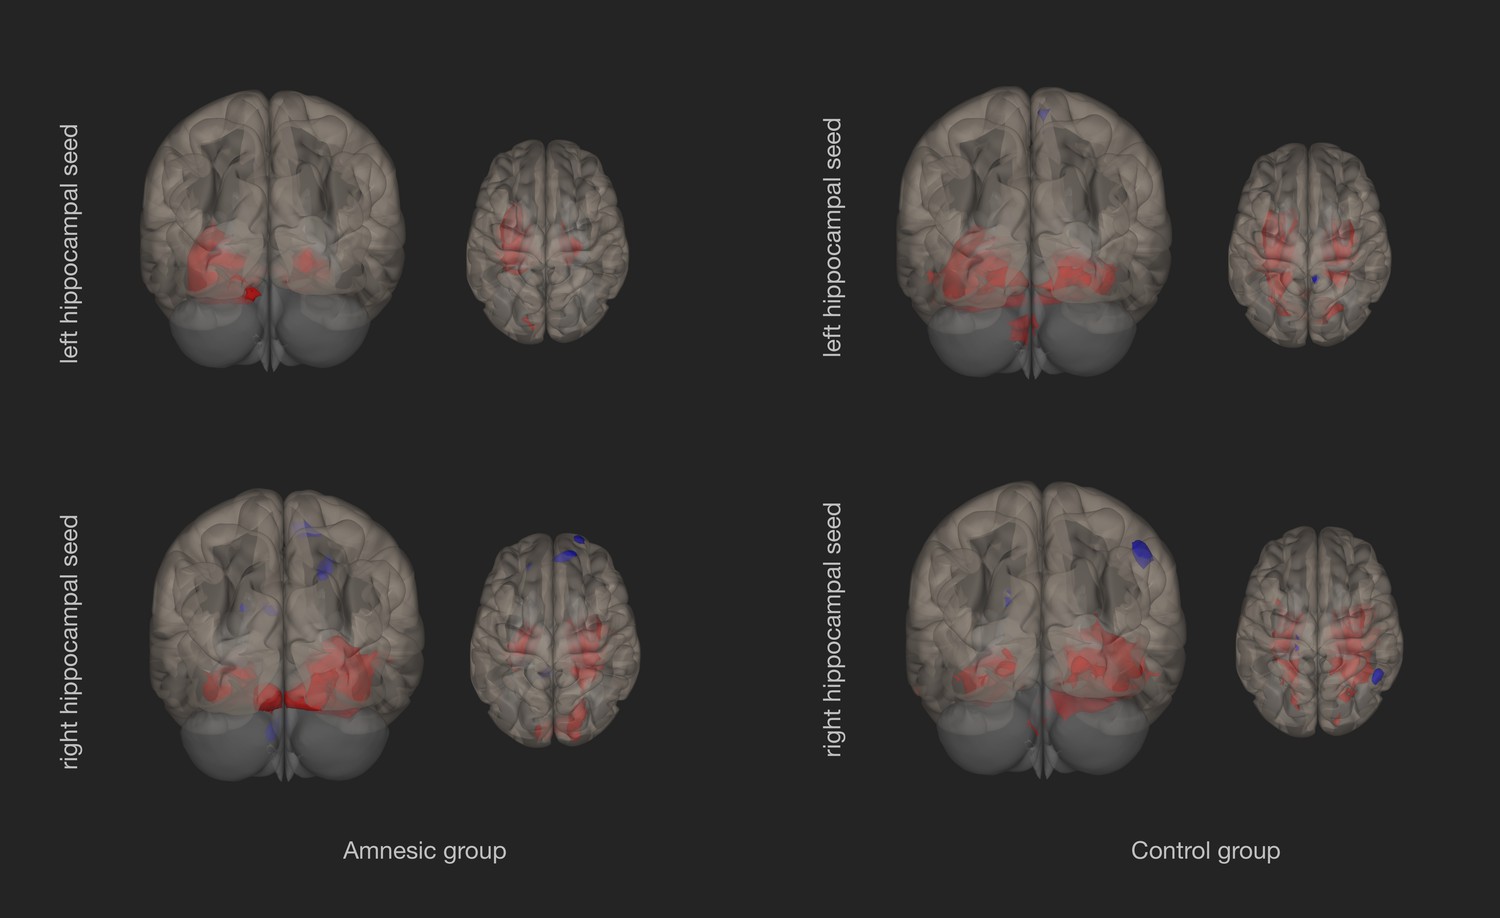
Left and right hippocampal seed-to-voxel functional connectivity, as a function of group.
Left panel: in the amnesic group, functional connectivity of the left hippocampal seed region with the rest of the brain was associated with significant activity in two clusters, whereas the right hippocampal seed was associated with significant activity in seven clusters. Right panel: in the control group, functional connectivity with the left hippocampal seed region was associated with significant activity in three clusters, whereas the right hippocampal seed was associated with significant activity in nine clusters. 3-D rendered brains depict activity at a cluster-size p-FDR threshold set at <0.05 and height threshold set at p-uncorrected <0.001 (two-sided) (see Supplementary file 1p).
Figure 8

Bilateral damage to human CA3 increased local efficiency in three DN nodes.
Results from graph theoretic analyses of the DN in the amnesic and control groups, derived from 4-D rs-fMRI EPI acquired at 7.0-Tesla MRI field strength. 3-D rendered brain depicts nodes (DN vertices/brain regions-of-interest) and their associated edges (paths between nodes) used to define the DN. The size of a node represents the beta value for that node. Network edges (adjacency matrix threshold): z > 0.84, one-sided (positive); and, analysis threshold: two-sided p-FDR corrected <0.05 (two-sided). Local efficiency was significantly increased in three nodes: left posterior cingulate cortex (left PCC) (MNI co-ordinates −8,–56,26, β = 0.35, t = 3.49, p-FDR = 0.020), left parahippocampal cortex (left PHC) (MNI −28,–40,−12, β = 0.45, t = 3.25, p-FDR = 0.037) and right retrosplenial cortex (right Rsp) (MNI 14,–52,8, β = 0.36, t = 3.45, p-FDR = 0.020). Plot depicts differences in local efficiency in amnesic group participants from the mean of the control group. Differences in local efficiency at these nodes from the mean of the control group were not predictive of internal (episodic) detail performance on the AI (i.e., mean composite internal details score across all intervals) (Supplementary file 1q). Renders are depicted at the same threshold as that used to assess significance (i.e., p-FDR corrected <0.05 [two-sided]). Comparable between-group differences in network topology were observed when an alternate threshold was used to test for functional connections (see section on stability of the effects and Supplementary files 1h–1m). Plot depicts mean local efficiency at these three nodes. Error bars correspond to the s.e.m.. *p<0.05.
Tables
Table 1
Hippocampal subfield volumes (means (mm3)), ± standard error of the mean (SEM), standard deviation (SD)) in the amnesic group and control group.
Volumes were normalized to the total intracranial volumes obtained from the VBM analyses. Volumes were collapsed across the left and right hippocampi because there was no significant interaction term between group (amnesic, control), side (left, right), and subfield (CA1, CA2, CA3, DG, and SUB) (F(2.02,56.55) = 0.43, p=0.66, η2p=0.015; Figure 2). See Figure 2—figure supplement 1 for hippocampal subfield volumes for individual participants.
| Mean total subfield volumes (mm3), SEM and SD | ||
|---|---|---|
| Hippocampal subfield | Amnesic (LGI1-complex-antibody LE) group | Control group |
| CA1 | 961 (±63, 243) | 1149 (±41, 157) |
| CA2 | 169 (±9, 37) | 179 (±10, 40) |
| CA3* | 377 (±19, 75) | 528 (±34,134) |
| DG | 625 (±50,194) | 659 (±23,95) |
| SUB | 526 (±34,131) | 611 (±25,95) |
-
*Significant at the alpha criterion based on Holm-Bonferroni correction for multiple comparisons, following mixed model ANOVA. All other subfields were non-significant, when assessed at the alpha criterion corrected for multiple comparisons. CA1, cornu ammonis 1; CA2, cornu ammonis 2; CA3, cornu ammonis 3; DG, dentate gyrus; SUB, subiculum. Total intracranial volume (TIV) was derived by applying the sequence of unified segmentation, as implemented in SPM12, to the whole-brain T1-weighted images that were also acquired from each participant.
Additional files
-
Supplementary file 1
Supplementary tables reporting results from neuropsychological assessments, graph theoretic analyses, seed-to-voxel analyses, ROI-to-ROI analyses, and multiple regression based analyses.
(a) Neuropsychological domain performance in the amnesic group. (b) Results from graph theoretic analyses of the default network (DN). Between-group differences in global efficiency, local efficiency, betweenness centrality, average path length, clustering coefficient, and degree were examined. Network edges (adjacency matrix threshold) were thresholded at a z-score > 0.84 (one-sided, positive) and assessed at a corrected analysis threshold (p-FDR <0.05, two-sided) and, for completeness, at an uncorrected analysis threshold (p-uncorrected <0.05, two-sided). (c) Results from graph theoretic analyses of the somatomotor network. Between-group differences in global efficiency, local efficiency, betweenness centrality, average path length, clustering coefficient, and degree were examined. Network edges (adjacency matrix threshold) were thresholded at a z-score > 0.84 (one-sided, positive) and assessed at a corrected analysis threshold (p-FDR <0.05, two-sided), and, for completeness, at an uncorrected analysis threshold (p-uncorrected <0.05, two-sided). (d) Results from graph theoretic analyses of the visual network. Between-group differences in global efficiency, local efficiency, betweenness centrality, average path length, clustering coefficient, and degree were examined. Network edges (adjacency matrix threshold) were thresholded at a z-score > 0.84 (one-sided, positive) and assessed at a corrected (p-FDR <0.05, two-sided), and, for completeness, at an uncorrected analysis threshold (p-uncorrected <0.05, two-sided). (e) Results from graph theoretic analyses of the salience network. Between-group differences in global efficiency, local efficiency, betweenness centrality, average path length, clustering coefficient, and degree were examined. Network edges (adjacency matrix threshold) were thresholded at a z-score > 0.84 (one-sided, positive) and assessed at a corrected (p-FDR <0.05, two-sided), and, for completeness, at an uncorrected analysis threshold (p-uncorrected <0.05, two-sided). (f) Results from graph theoretic analyses of the ventral attention network. Between-group differences in global efficiency, local efficiency, betweenness centrality, average path length, clustering coefficient and degree were examined. Network edges (adjacency matrix threshold) were thresholded at a z-score > 0.84 (one-sided, positive) and assessed at a corrected analysis threshold (p-FDR <0.05, two-sided), and, for completeness, at an uncorrected analysis threshold (p-uncorrected <0.05, two-sided). (g) Results from graph theoretic analyses of the dorsal attention network. Between-group differences in global efficiency, local efficiency, betweenness centrality, average path length, clustering coefficient, and degree were examined. Network edges (adjacency matrix threshold) were thresholded at a z-score > 0.84 (one-sided, positive) and assessed at a corrected anaylsis threshold (p-FDR <0.05, two-sided), and, for completeness, at an uncorrected analysis threshold (p-uncorrected <0.05, two-sided). (h) Results from graph theoretic stability analyses of default network topology. The amnesic group and the control group were assessed using an adjacency matrix threshold based on cost. The analysis threshold (i.e., p-FDR <0.05, two-sided) was same as when the default network was assessed using the z-score based adjacency matrix threshold. Nodes that were not significant at the FDR-corrected analysis threshold applied to infer significance are reported at an uncorrected analysis threshold (p-uncorrected < 0.05, two-sided). (i) Results from graph theoretic stability analyses of somatomotor network topology. The amnesic group and the control group were assessed using an adjacency matrix threshold based on cost. The analysis threshold (i.e., p-FDR <0.05, two-sided) was same as when the somatomotor network was assessed using the z-score based adjacency matrix threshold. Nodes that were not significant at the p-FDR-corrected analysis threshold applied to infer significance are reported at an uncorrected analysis threshold (p-uncorrected <0.05, two-sided). (j) Results from graph theoretic stability analyses of visual network topology. The amnesic group and the control group were assessed using an adjacency matrix threshold based on cost. The analysis threshold (i.e., p-FDR <0.05, two-sided) was same as when the visual network was assessed using the z-score based adjacency matrix threshold. Nodes that were not significant at the p-FDR-corrected analysis threshold applied to infer significance are reported at an uncorrected analysis threshold (p-uncorrected <0.05, two-sided). (k) Results from graph theoretic stability analyses of the salience network. The amnesic group and the control group were assessed using an adjacency matrix threshold based on cost. The analysis threshold (i.e., p-FDR <0.05, two-sided) was same as when the salience network was assessed using the z-score based adjacency matrix threshold. Nodes that were not significant at the p-FDR-corrected analysis threshold applied to infer significance are reported an uncorrected analysis threshold (p-uncorrected <0.05, two-sided). (l) Results from graph theoretic stability analyses of the ventral attention network. The amnesic group and the control group were assessed using an adjacency matrix threshold based on cost. The analysis threshold (i.e., p-FDR <0.05, two-sided) was same as when the ventral attention network was assessed using the z-score based adjacency matrix threshold. Nodes that were not significant at the p-FDR-corrected analysis threshold applied to infer significance are reported at an uncorrected analysis threshold (p-uncorrected <0.05, two-sided). (m) Results from graph theoretic stability analyses of the dorsal attention network. The amnesic group and the control group were assessed using an adjacency matrix threshold based on cost. The analysis threshold (i.e., p-FDR <0.05, two-sided) was same as when the dorsal attention network was assessed using the z-score based adjacency matrix threshold. Nodes that were not significant at the p-FDR-corrected analysis threshold applied to infer significance are reported at an uncorrected analysis threshold (p-uncorrected <0.05, two-sided). (n) MNI co-ordinates for the nodes used in control network analyses. MNI co-ordinates for the nodes that correspond to the somatomotor network, visual network, salience network, dorsal attention network, and ventral attention network were based on the parcellation scheme proposed by Power et al. (2011). Probabilistic anatomical locations of the MNI co-ordinates are defined using the Harvard-Oxford Cortical and Subcortical Probabilistic Atlases. (o) Results from between-group seed-to-voxel functional connectivity based analyses. No brain regions exhibited significant differences (height threshold, p-uncorrected <0.001 and an extent threshold of p-FDR <0.05 at the cluster level) in functional connectivity between the amnesic group and the control group, when tested with left and right hippocampal seed regions-of-interest, an occipital pole seed within the visual network, and a seed in primary motor cortex within the somatomotor network. Seed regions were spheres with 8 mm radii. For the left hippocampal seed region, a between-group difference in functional connectivity was found only at a lenient, p-uncorrected <0.05 cluster-size threshold. There were no significant clusters for the right hippocampal seed region, even when between-group differences were assessed at a cluster-size threshold set at p-uncorrected <0.05 (see Figure 7—figure supplement 1). (p) Results for left and right hippocampus seed-to-voxel functional connectivity based analyses. MNI co-ordinates of brain regions that exhibited significant functional connectivity with left and right hippocampal seed regions-of-interest shown separately for the amnesic group and the control group (height threshold, p-uncorrected <0.001 and an extent threshold of p-FDR <0.05, at the cluster level). Seed regions were spheres with 8 mm radii (see Figure 7—figure supplement 2). (q) Results from robust multiple linear regression analysis on nodes in the default network with significantly increased average path length (independent variables) relative to the control group and total internal (episodic) detail remembered on the AI. Average path length values entered into the robust multiple regression analysis were based on the difference between each participant and the mean of the control group for each affected ROI/node. (r) Results from multiple linear regression analysis examining link between nodes in the DN that exhibited significantly different local efficiency and internal (episodic) detail remembered on the AI. Local efficiency values entered into the robust multiple regression analysis were based on the difference between each participant and the mean of the control group for each affected ROI/node.
- https://cdn.elifesciences.org/articles/41836/elife-41836-supp1-v1.docx
-
Transparent reporting form
- https://cdn.elifesciences.org/articles/41836/elife-41836-transrepform-v1.pdf
Download links
A two-part list of links to download the article, or parts of the article, in various formats.
Downloads (link to download the article as PDF)
Open citations (links to open the citations from this article in various online reference manager services)
Cite this article (links to download the citations from this article in formats compatible with various reference manager tools)
Human hippocampal CA3 damage disrupts both recent and remote episodic memories
eLife 9:e41836.
https://doi.org/10.7554/eLife.41836


