Cryo-EM structure of the mechanically activated ion channel OSCA1.2
- The Scripps Research Institute, United States
- Howard Hughes Medical Institute, The Scripps Research Institute, United States
- University of Oxford, United Kingdom
Figures
Figure 1 with 6 supplements
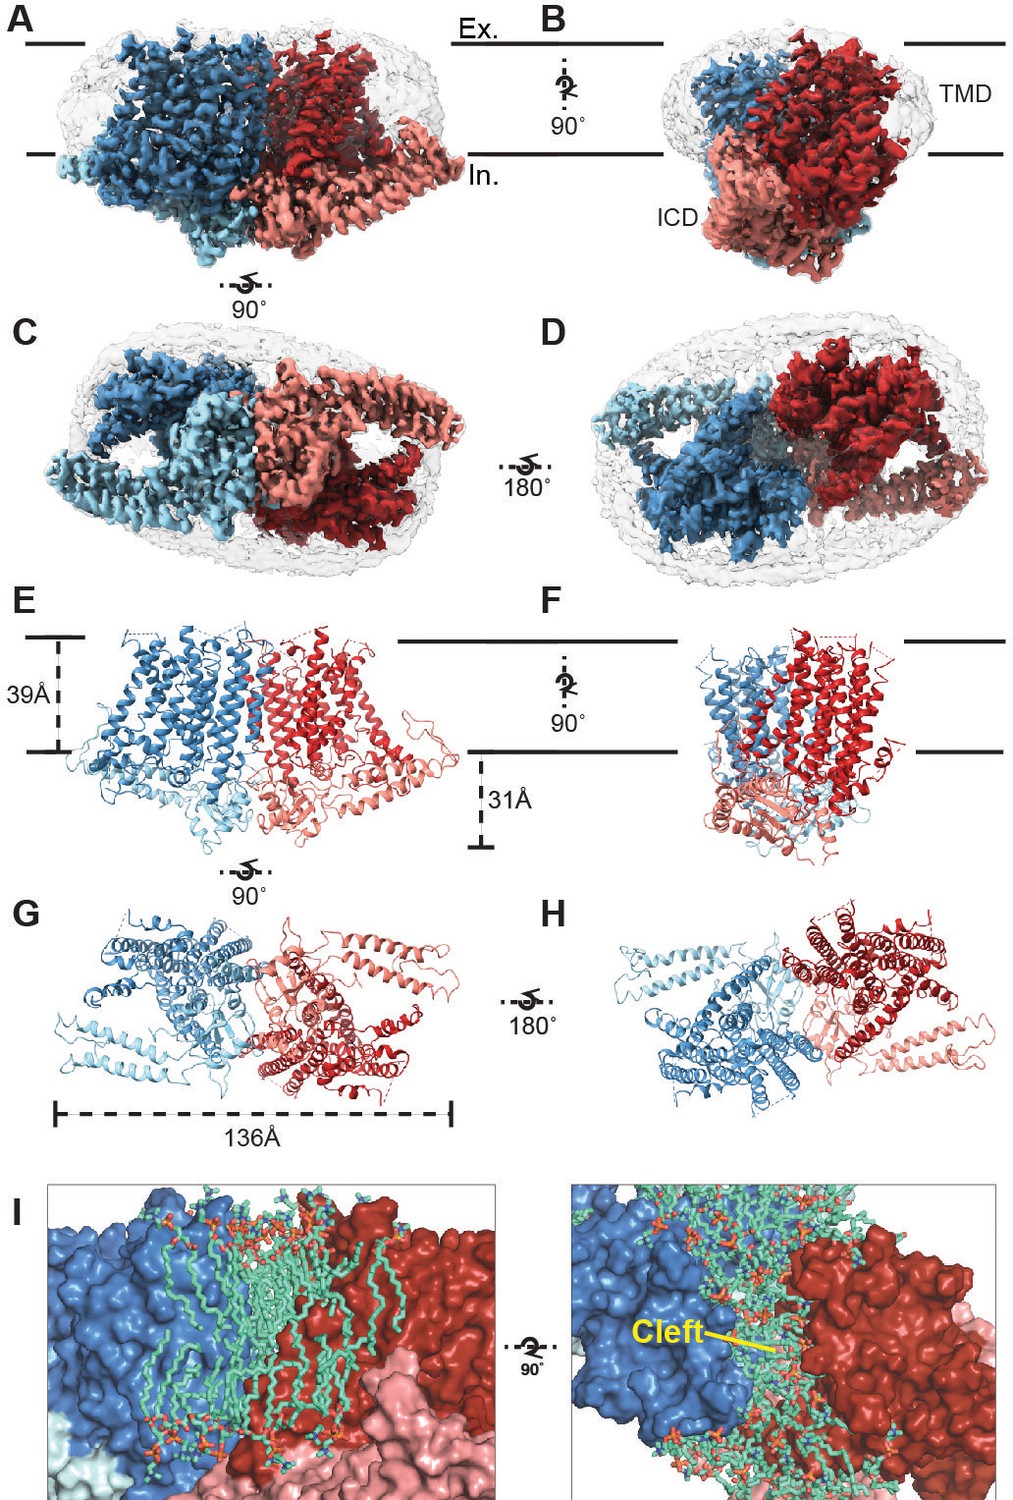
Cryo-EM structure of OSCA1.2 and intersubunit cleft.
Side (A, B), bottom (C), and top (D) views of EM density map of nanodisc-embedded OSCA1.2 dimer (sharpened map, blue and red). Nanodisc density is apparent at lower thresholds (unsharpened map, light grey). The intracellular domain (ICD) of each monomer is colored lighter than the transmembrane domain (TMD). Side (E, F), bottom (G), and top (H) views of OSCA1.2 dimer model. Coloring follows the same scheme used in density map. (I) Molecular dynamics (MD) simulations revealed the inter-subunit cleft to be occupied by phosphatidyl choline (PC) molecules arranged as a bilayer, shown in side (left) and top (right) views (also see Figure 1—figure supplement 5A) Lipid molecules shown are within 6 Å of residues 367–389 of TM3 (partial), 455–490 of TM5 and 616–685 of TM9–10 (also see Video 2).
-
Figure 1—source data 1
Data collection, processing, model refinement, and validation.
- https://doi.org/10.7554/eLife.41845.009
Figure 1—figure supplement 1
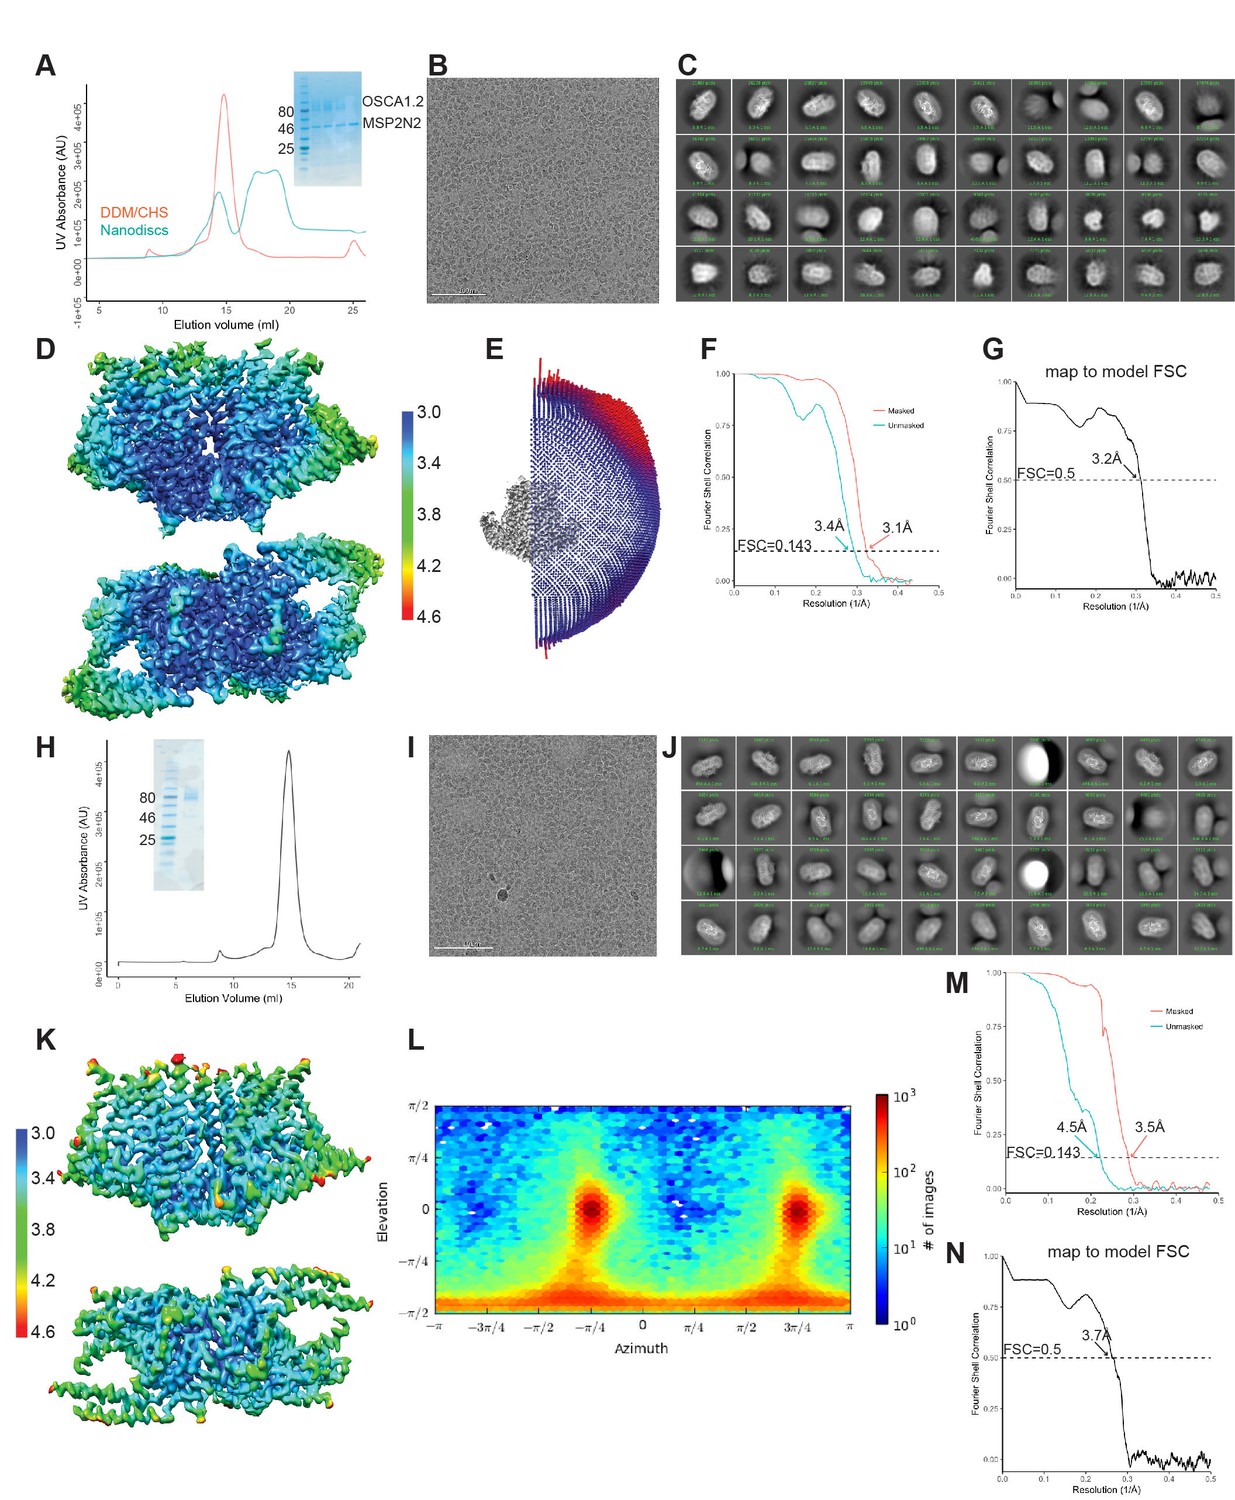
Biochemistry and cryo-EM of OSCA1.2 in nanodiscs and LMNG.
(A–G) Correspond to nanodisc-embedded OSCA1.2, and (H–N) correspond to LMNG solubilized OSCA1.2. (A, H) Representative SEC trace with SDS-PAGE as inset. (B, I) Representative cryo-EM micrograph. (C, J) 2D-class averages. (D, K) Local resolution maps calculated by RELION. Both maps use the same color key, in Å. (E, L) Angular distribution of reconstructed particles in the refined maps. (F, M) FSC plots of unmasked and masked maps. (G, N) FSC of map and model, calculated by phenix.mtriage.
Figure 1—figure supplement 2

Cryo-EM data processing flowchart.
Data processing flowchart for LMNG-solubilized OSCA1.2 map (top) and nanodisc-embedded OSCA1.2 map (bottom).
Figure 1—figure supplement 3
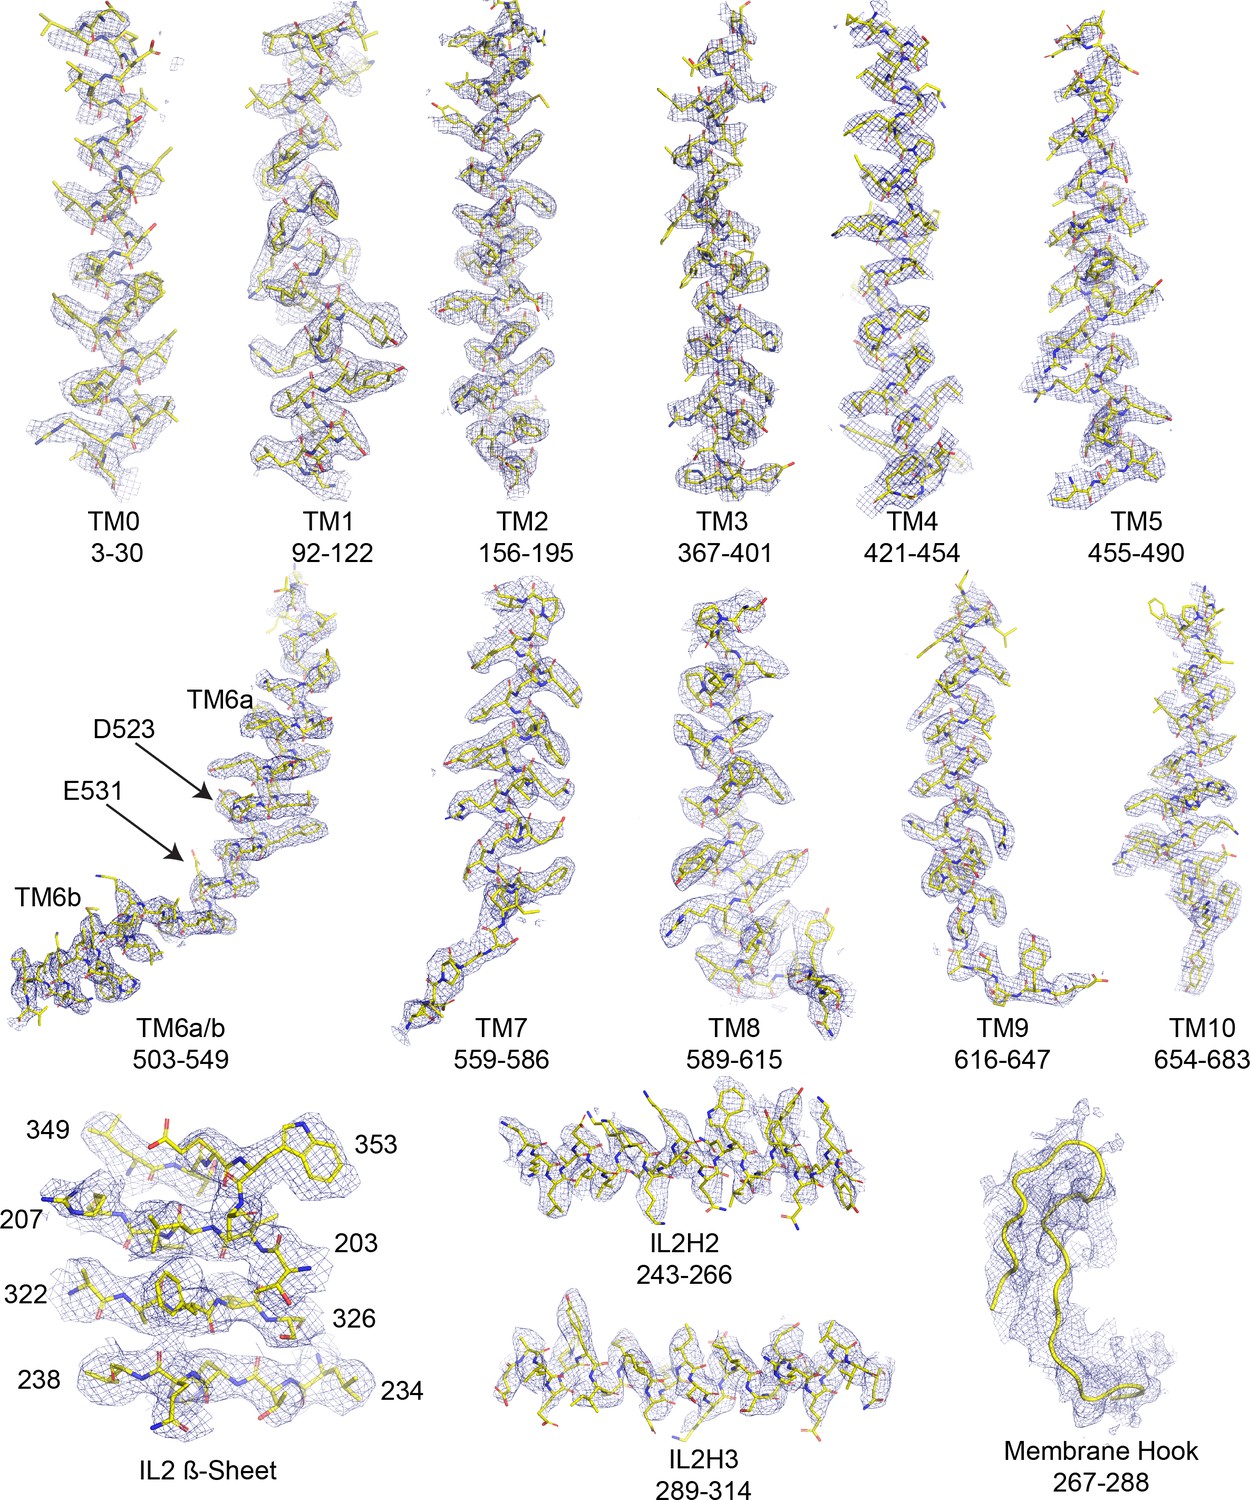
Cryo-EM density and fit to model of OSCA1.2 in nanodisc.
Selected regions of cryo-EM map of OSCA1.2 in nanodiscs sharpened with a b factor of −81 Å2 superimposed onto the atomic model.
Figure 1—figure supplement 4
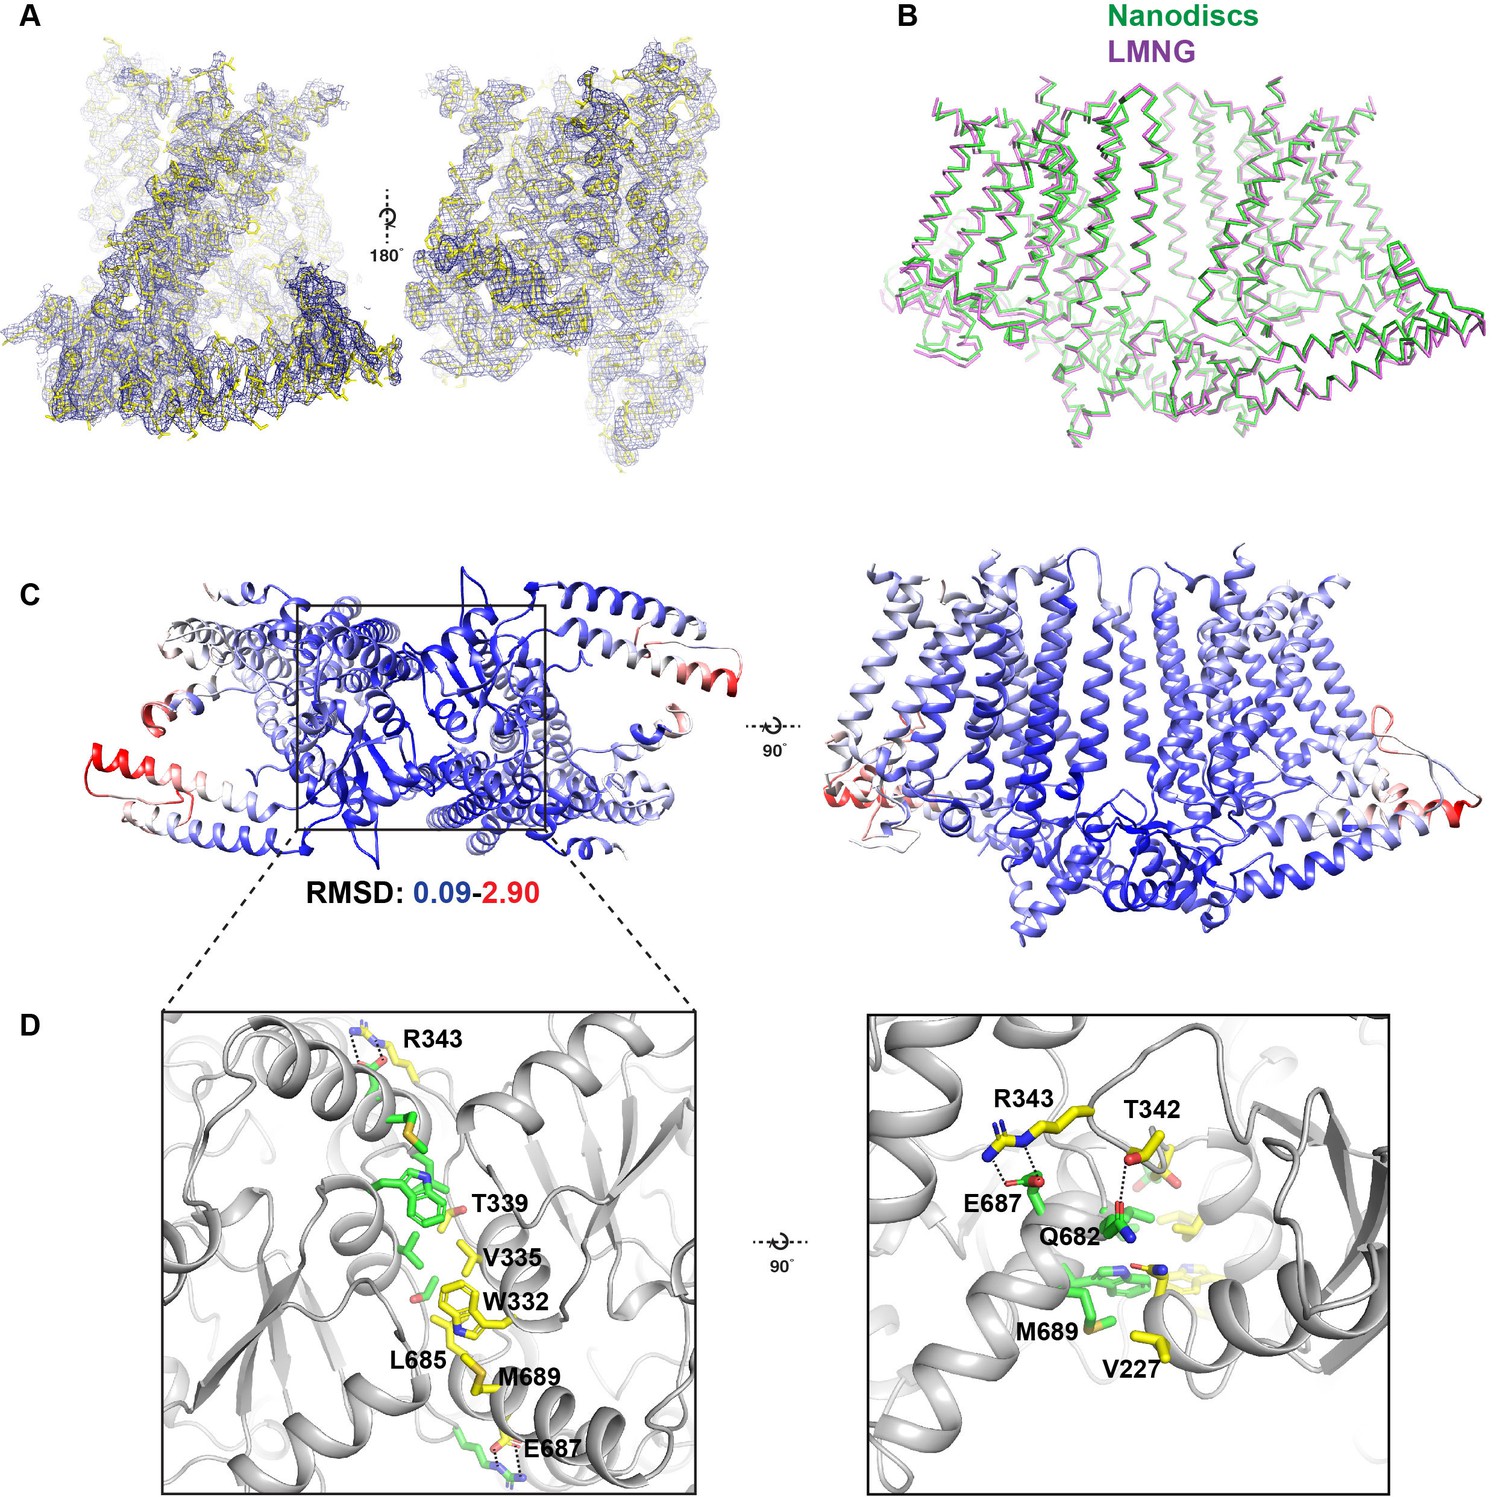
Comparison between detergent and nanodisc-embedded OSCA1.2 and the intracellular dimeric interface.
(A) Cryo-EM map of OSCA1.2 in LMNG sharpened to a b-factor of −170 Å2 superimposed into the atomic model. Two side views of the OSCA1.2 monomer are shown. (B) Ribbon models of OSCA1.2 in LMNG (purple) and nanodiscs (green) aligned and superimposed. (C) Bottom (left) and side (top) views of the OSCA1.2 model colored by backbone RMSD. Blue color represents RMSD values as low as 0.09 Å, while red values represent values as high as 2.9 Å. White values have intermediate RMSD. Note that RMSD values are lowest at and near the intracellular dimeric interface. (D) Expanded bottom (left) and side (right) views of the intracellular dimeric interface. Residues at the interface are shown as sticks and colored by subunit. Dashed lines show apparent salt bridges or hydrogen bonds.
Figure 1—figure supplement 5
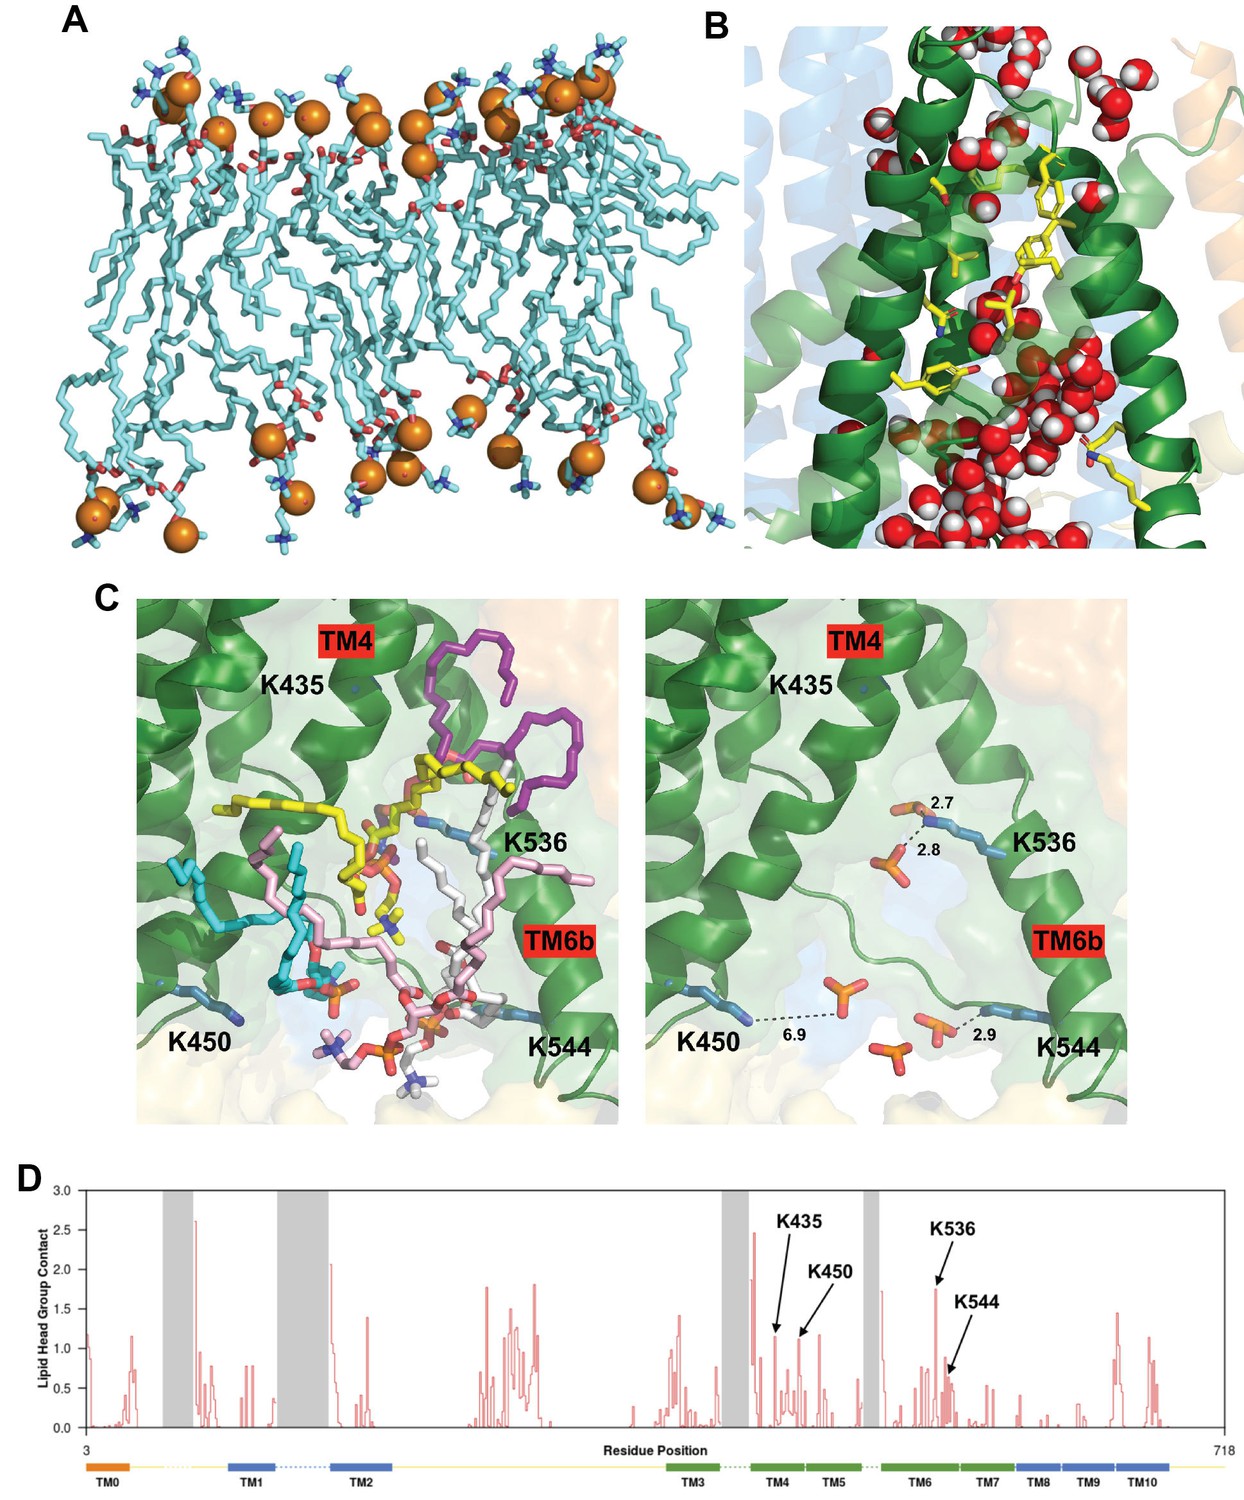
Protein-lipid interactions at the subunit interface and lipid and water molecules within the cytoplasmic region of the pore.
(A) Side view of the PC molecules in contact with both subunits at the dimer interface cleft, revealing an asymmetric bilayer between subunits. The outer leaflet of the bilayer in this region contains 18 PC molecules whilst the inner leaflet contains 14 molecules. (B) Snapshot of an AT-MD simulation at 250 ns illustrating the water molecules (red/white) within the two mouths of the pore which are separated by the hydrophobic constriction (compare with Figure 3C, also see Video 4 and Video 5). The AT-MD simulation has position restraints applied in the first 50 ns only. (C) Left, a snapshot (also see Figure 4C) highlighting five lipids residing at the cytoplasmic side of the pore taken at 250 ns of the AT-MD simulation. Right, the same snapshot with the lipid phosphates highlighted and the lysine amine nitrogen to phosphate oxygen distance measured in Å, suggesting phosphate head groups are within hydrogen-bonding distance of the lysine residues. Also see Video 6 and Video 7. (D) Protein-lipid head group contact analysis showing the number of phosphate head groups within 6 Å plotted against protein residue number. Transmembrane helices are indicated as rectangles at the bottom and dashed lines represent residues not resolved in our structure. The four lysine residues in (C) are highlighted. This analysis is based on 5 repeats of 1-µs CG simulation.
Figure 1—figure supplement 6
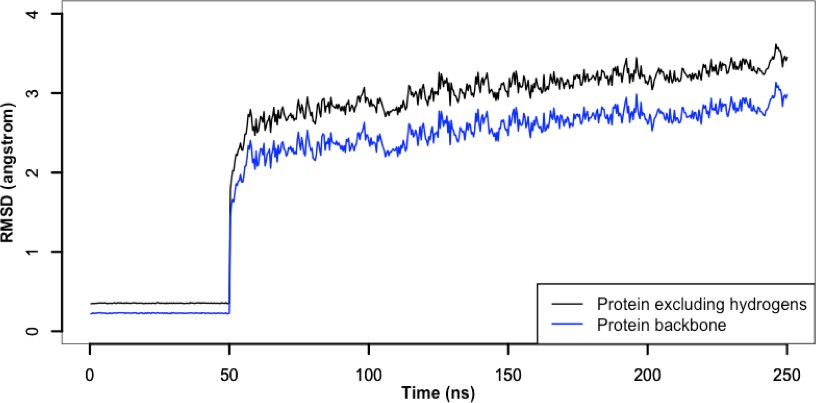
Root-mean-square deviation of protein during the atomistic simulation.
https://doi.org/10.7554/eLife.41845.008
Figure 2 with 4 supplements
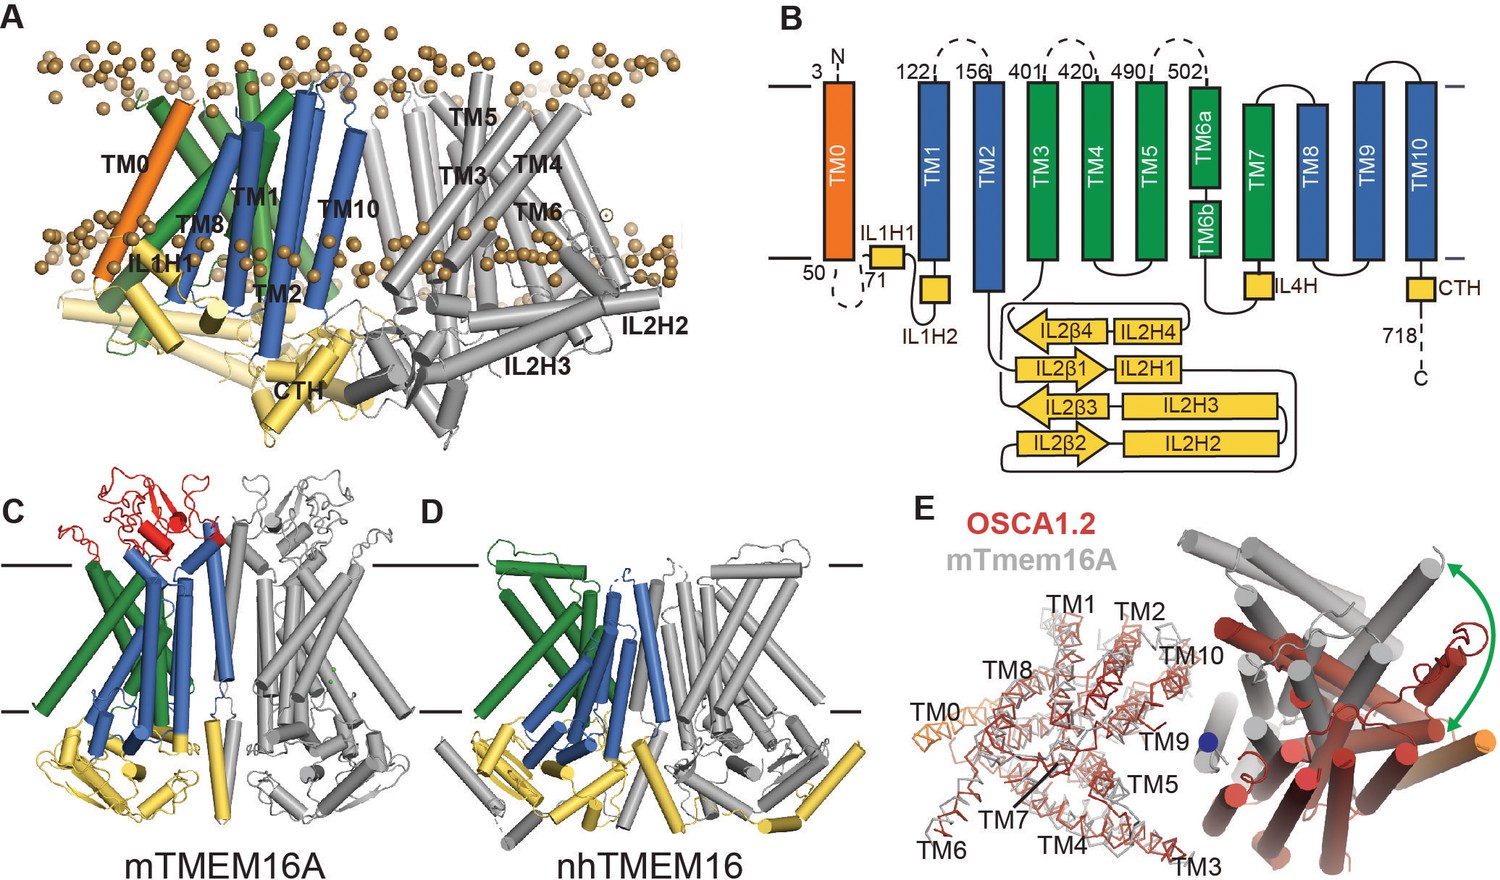
OSCA1.2 topology and comparison to TMEM16.
(A) Structure of OSCA1.2 viewed from the membrane plane. One monomer is colored grey. The other monomer shows intracellular domain in yellow, TM0 in orange, pore lining TM helices in green (TM3–TM7) and TM helices not directly involved in the pore in blue. Phosphorus atoms of POPC molecules within 25 Å of the protein are shown as brown spheres (also see Video 1). (B) Topology diagram illustrating the secondary structure elements of OSCA1.2. Dashed lines represent missing residues in the model. A short coil divides TM6 into TM6a and TM6b. (C, D) Structures of mTMEM16A and nhTMEM16 (PDB: 6BGI and 4WIS, respectively) in the same view as (A). Extracellular domain of mTMEM16A is colored red. (E) Bottom view of the transmembrane domains of OSCA1.2 (red) and mTMEM16A (grey) aligned on one subunit (shown as ribbons). The extracellular and intracellular domains have been removed for clarity. The blue circle marks the symmetry axis of OSCA1.2. The green arrow marks the difference in position of TM6 in the non-aligned subunits (cylinders) between the two structures.
Figure 2—figure supplement 1
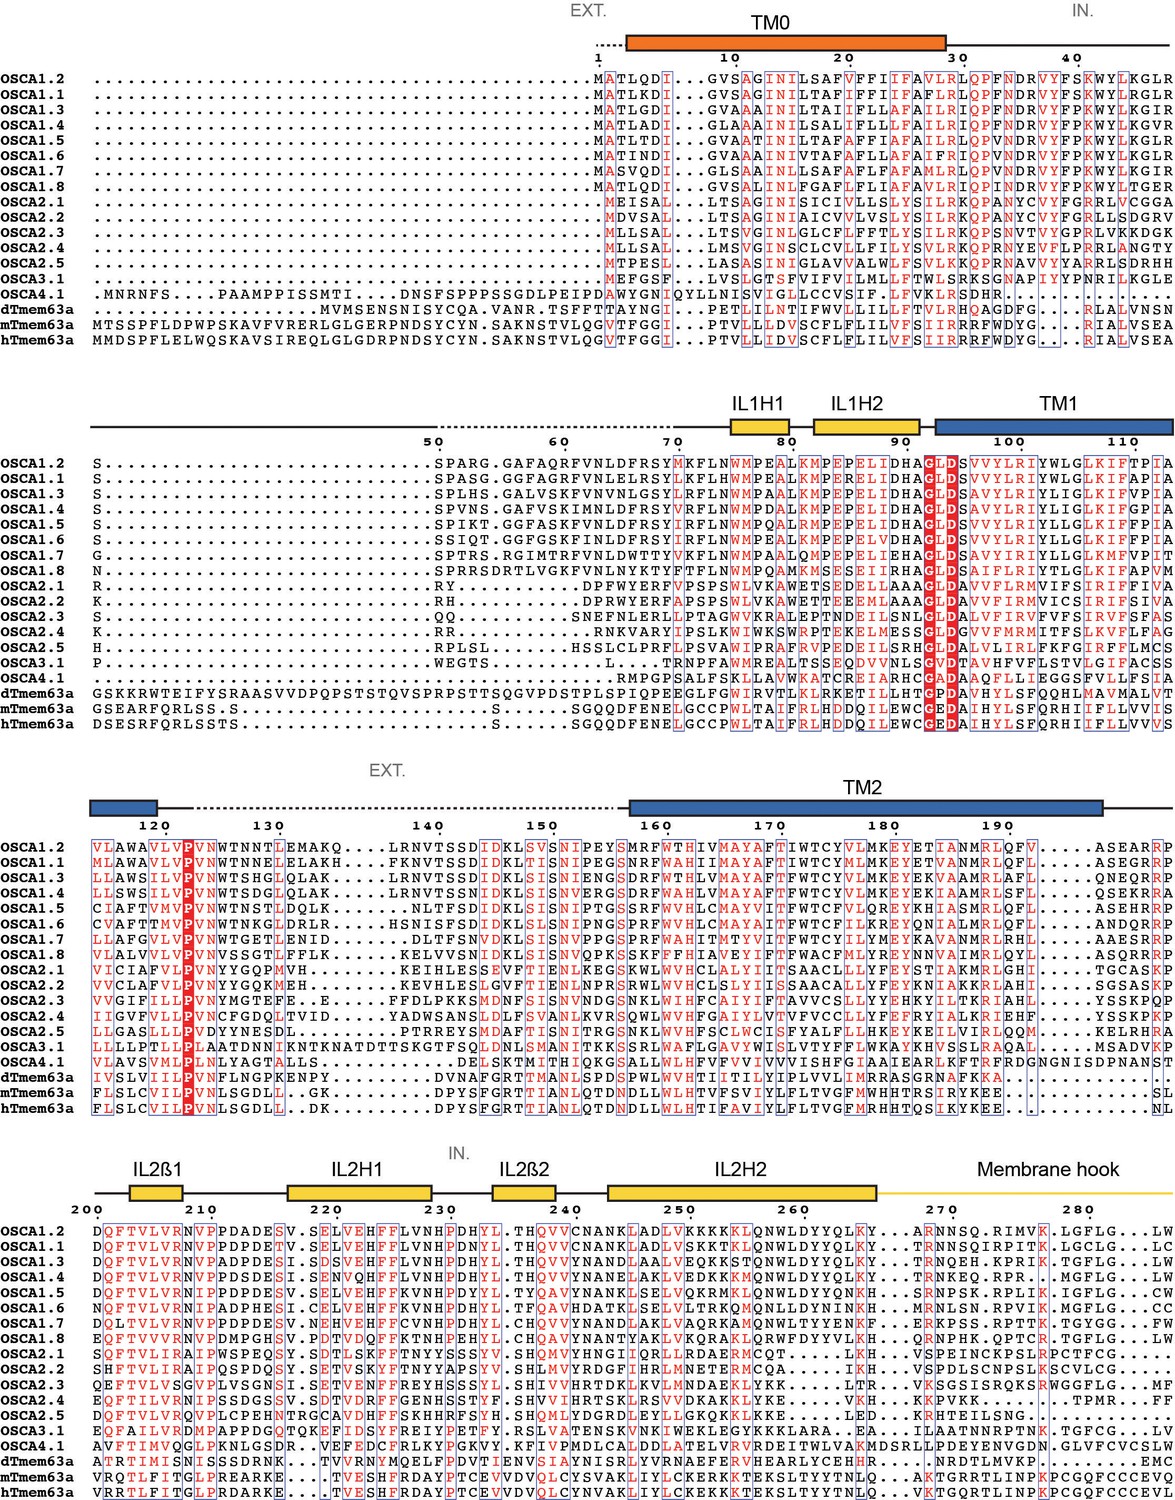
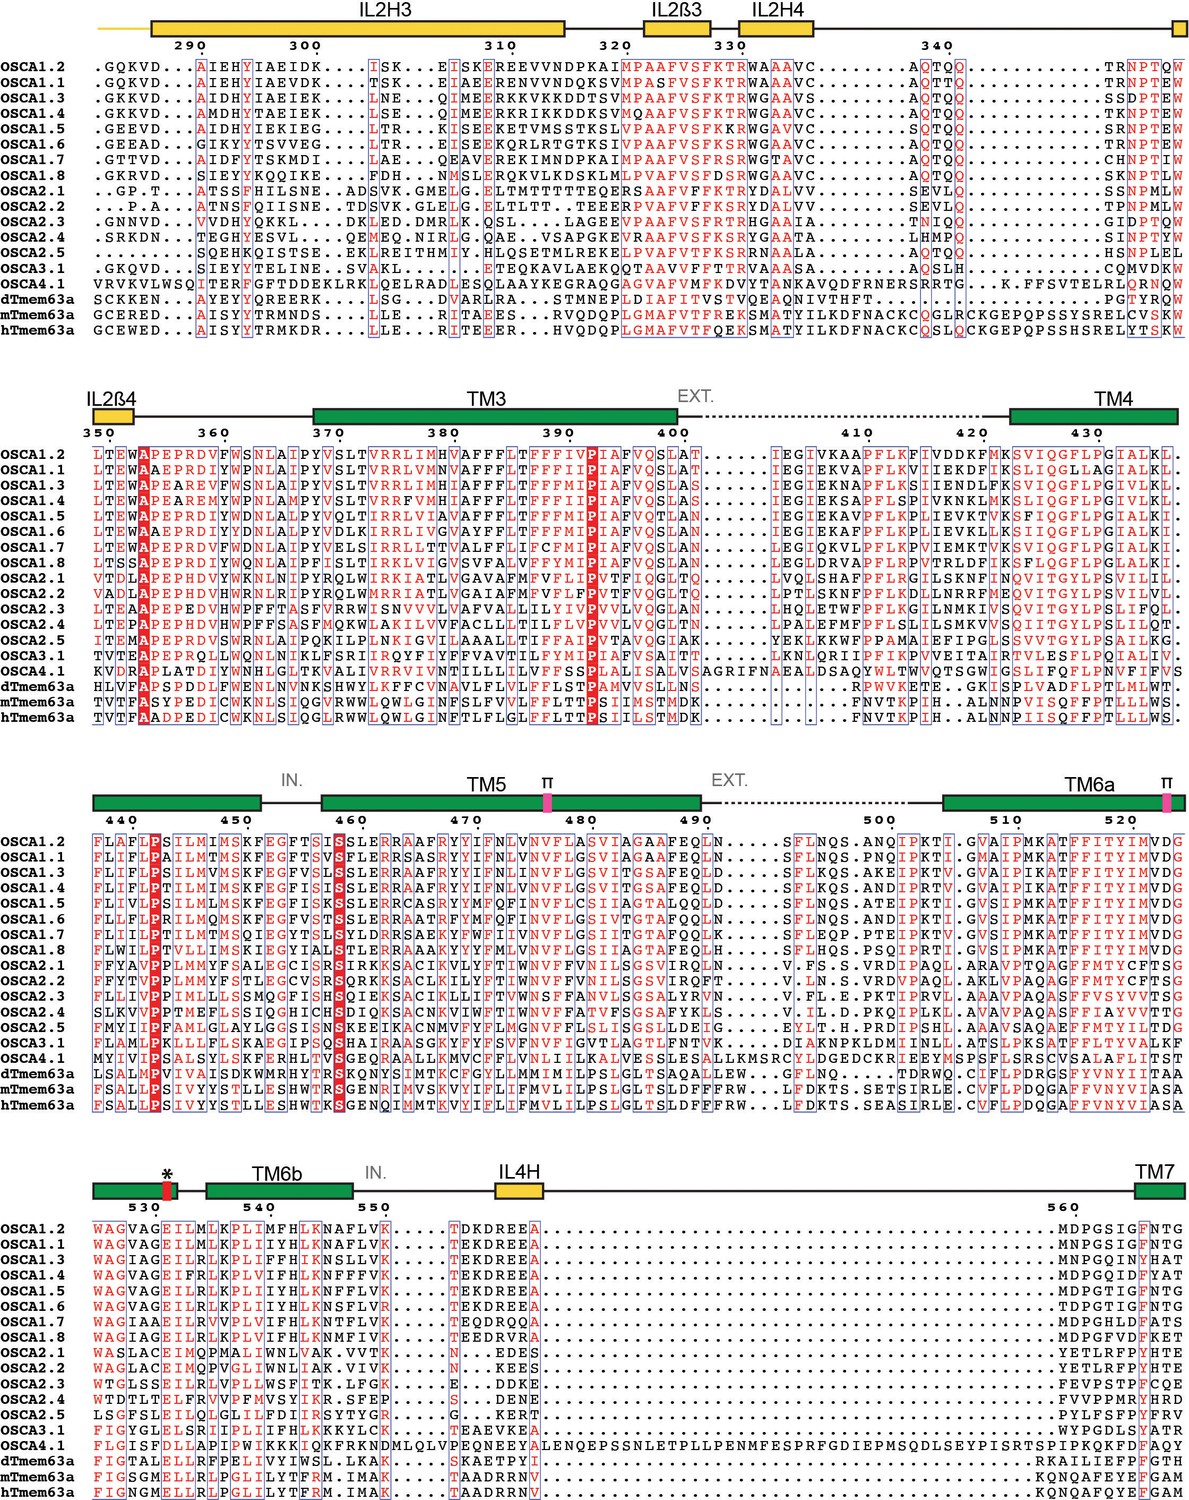
Protein sequence alignment of OSCA/TMEM63 family members.
Sequence alignment of Arabidopsis thaliana OSCA1.1 (UniProt ID: Q9XEA1), OSCA1.2 (A0A097NUP4), OSCA1.3 (A0A097NUP7), OSCA1.4 (A0A097NUQ0), OSCA1.5 (A0A097NUS0), OSCA1.6 (A0A097NUP1), OSCA1.7 (A0A097NUP8), OSCA1.8 (A0A097NUQ2), OSCA2.1 (A0A097NUQ5), OSCA2.2 (A0A097NUS5), OSCA2.3 (A0A097NUP6), OSCA2.4 (A0A097NUQ3), OSCA2.5 (A0A097NUQ7), OSCA3.1 (A0A097NUQ9), OSCA4.1 (A0A097NUT0), Drosophila melanogaster dTMEM63a (Q6NP91), Mus musculus mTMEM63a (Q91YT8) and Homo sapiens hTMEM63a (O94886). Secondary structure of OSCA1.2 represented on top of the alignment: α helices as rectangles, β strands as arrows. Residues not included in OSCA1.2 model are represented as a dashed line. Features are colored and labeled as in Figure 2. π-helices labeled as a pink block on top of the extra residue in the turn. * and red block denote location of residue E531. EXT: Extracellular environment. IN: Intracellular environment.
Figure 2—figure supplement 2
Protein sequence alignment of OSCA/TMEM63 family members (continued).
https://doi.org/10.7554/eLife.41845.014
Figure 2—figure supplement 3
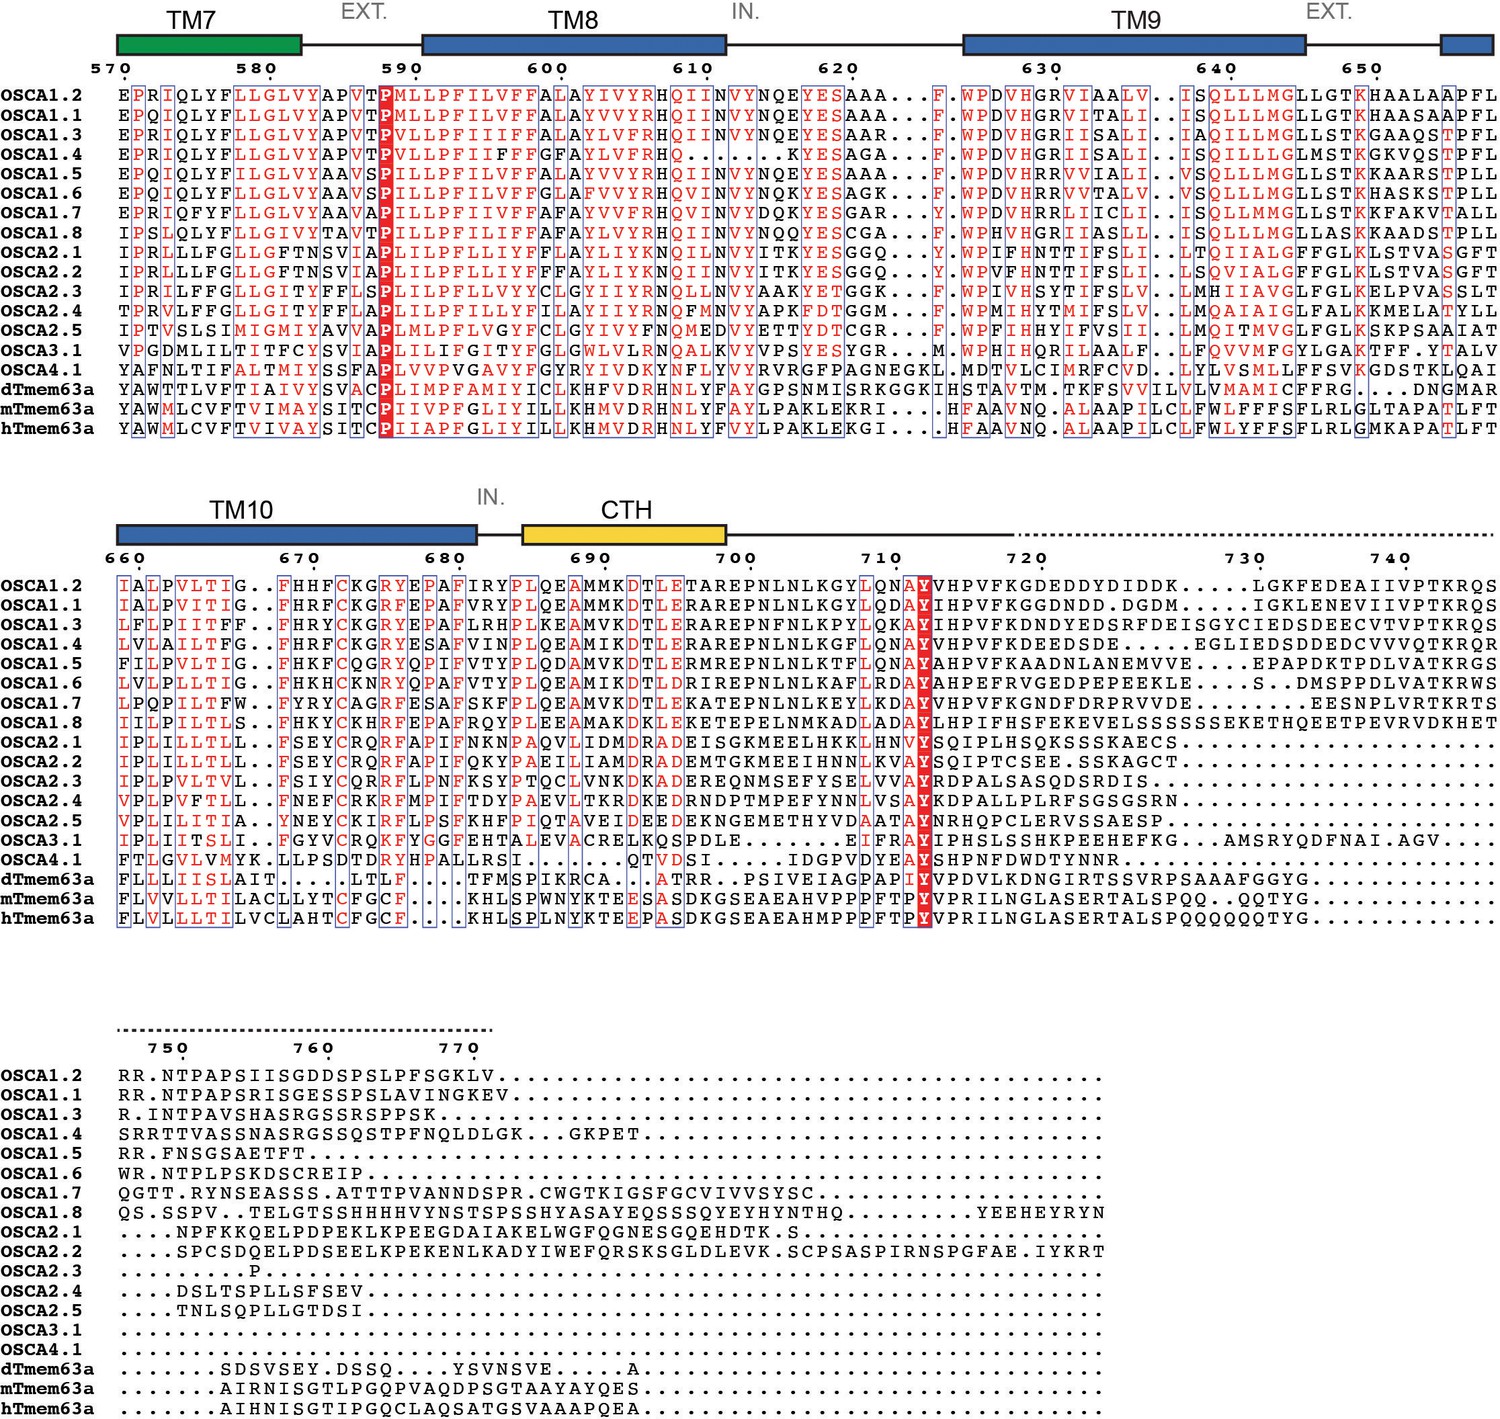
Protein sequence alignment of OSCA/TMEM63 family members (continued).
https://doi.org/10.7554/eLife.41845.015
Figure 2—figure supplement 4

Structural Features of OSCA1.2 and TMEM16 proteins.
(A) Side views of OSCA1.2 (left, red), mTMEM16A (PDB 5OYB, middle, yellow), and nhTMEM16 (PDB 4WIS, right, cyan). Calcium ions are shown as green spheres in mTMEM16A and nhTMEM16. (B) Superposition of TM4 and TM6 of the structures shown in (A). The space between TM4 and TM6 in nhTMEM16 is wider than in OSCA1.2 and mTMEM16A, consistent with the lipid scramblase function of nhTMEM16 and the ion channel functions of TMEM16A and OSCA1.2 (Schroeder et al., 2008). (C) The Ca2+ binding site of TMEM16 proteins formed by residues in the cytoplasmic half of TM6, TM7 and TM8 is not conducive for Ca2+ binding in OSCA1.2 (left, red). Note, E531 in OSCA1.2 is the sole acidic residue in this region. The Ca2+ binding sites of mTMEM16A (middle) and nhTMEM16 (right) are also shown. (D) TM6 in OSCA1.2 (left), Ca2+-bound mTMEM16A (middle, yellow) and Ca2+-bound nhTMEM16 (right) have π-helical turns (pink). In the Ca2+-free structure of mTMEM16A (middle, gray, PDB 5OYG), the π-helix collapses and the helix hinges at a glycine residue of TM6. In OSCA1.2, there is also a glycine at the π-turn in TM6a, raising the possibility of structural similarities in gating transition. The helix break in TM6 of OSCA1.2 could also impart flexibility during mechanical gating.
Figure 3 with 1 supplement
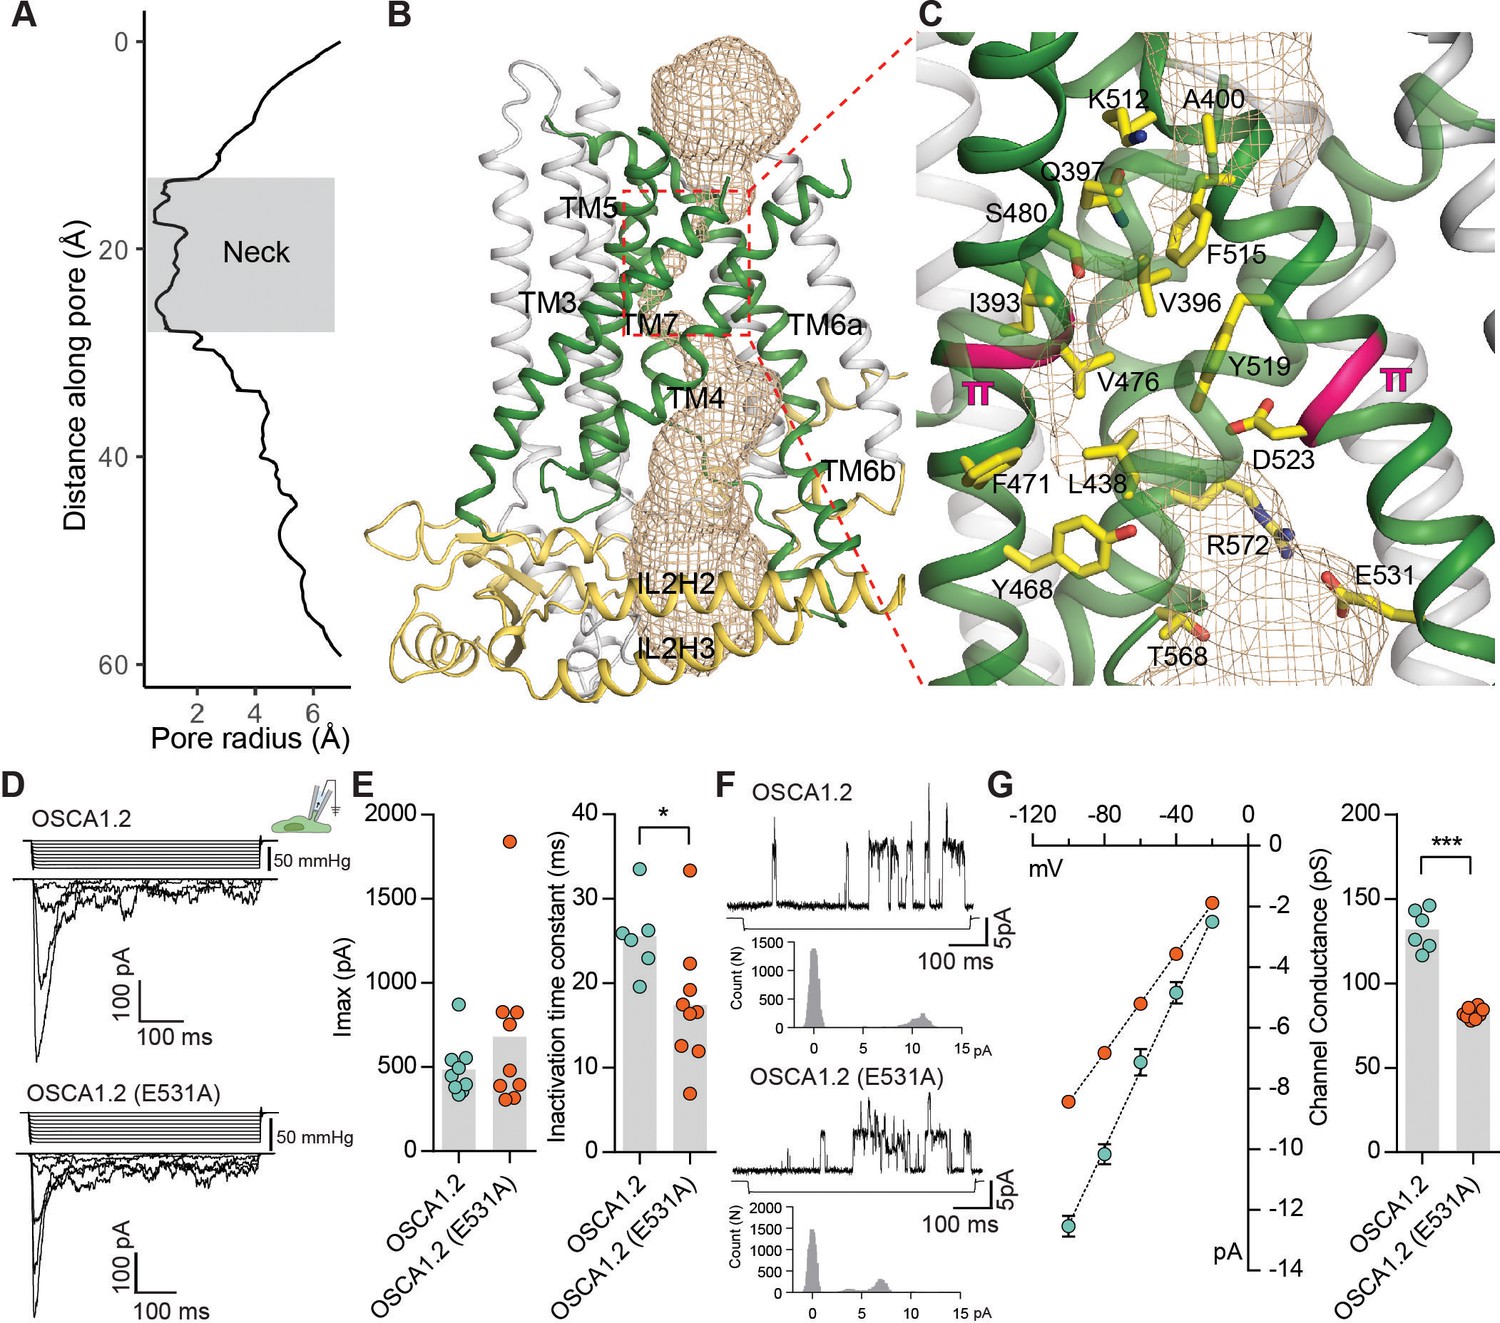
The pore of OSCA1.2.
(A) Van der Waals radii of the pore plotted against axial distance. (B) Location of the pore in the context of the OSCA1.2 subunit. Pore-lining TMs are colored green, and pore pathway is depicted as wheat mesh. (C) Expanded view of the neck, and pore-lining residues. π-helical turns close to the neck are highlighted pink (also see Video 4 and Video 5). (D) Representative traces of stretch-activated currents recorded from OSCA1.2- or OSCA1.2 (E531A)- expressing HEK-P1KO cells. In the cell-attached patch clamp mode, currents were elicited by applying negative pipette pressure in steps of Δ−10 mmHg. The corresponding stimulus trace is illustrated above the current trace. (E) Left, maximal current response from individual cells expressing OSCA1.2 (Imax: 487 ± 55 pA, N = 9) or OSCA1.2 (E531A) (Imax: 681 ± 161 pA, N = 9). Right, Inactivation time constant (ms) for individual cells across the two conditions. Bars represent population mean (OSCA1.2: 25.6 ± 2 ms (N = 6); OSCA1.2 (E531A): 17.4 ± 2 ms (N = 9). *p=0.01, Mann Whitney test). (F) Representative traces of stretch-activated single-channel currents (−80 mV) from wildtype or mutant channels. Channel openings are upward deflections. The negative pressure stimulus is illustrated below the current trace. Amplitude histogram for the representative current trace is represented below the stimulus trace. Single-channel amplitude was determined as the amplitude difference in Gaussian fits of the histogram. (G) Left, average I-V response curve for stretch-activated single-channel currents from wildtype or mutant channels. Right, channel conductance from individual cells across the two conditions. Bars represent population mean (OSCA1.2: 132 ± 5 ms (N = 6); OSCA1.2 (E531A): 82 ± 1 ms (N = 8). ***p=0.0007, Mann Whitney test).
Figure 3—figure supplement 1
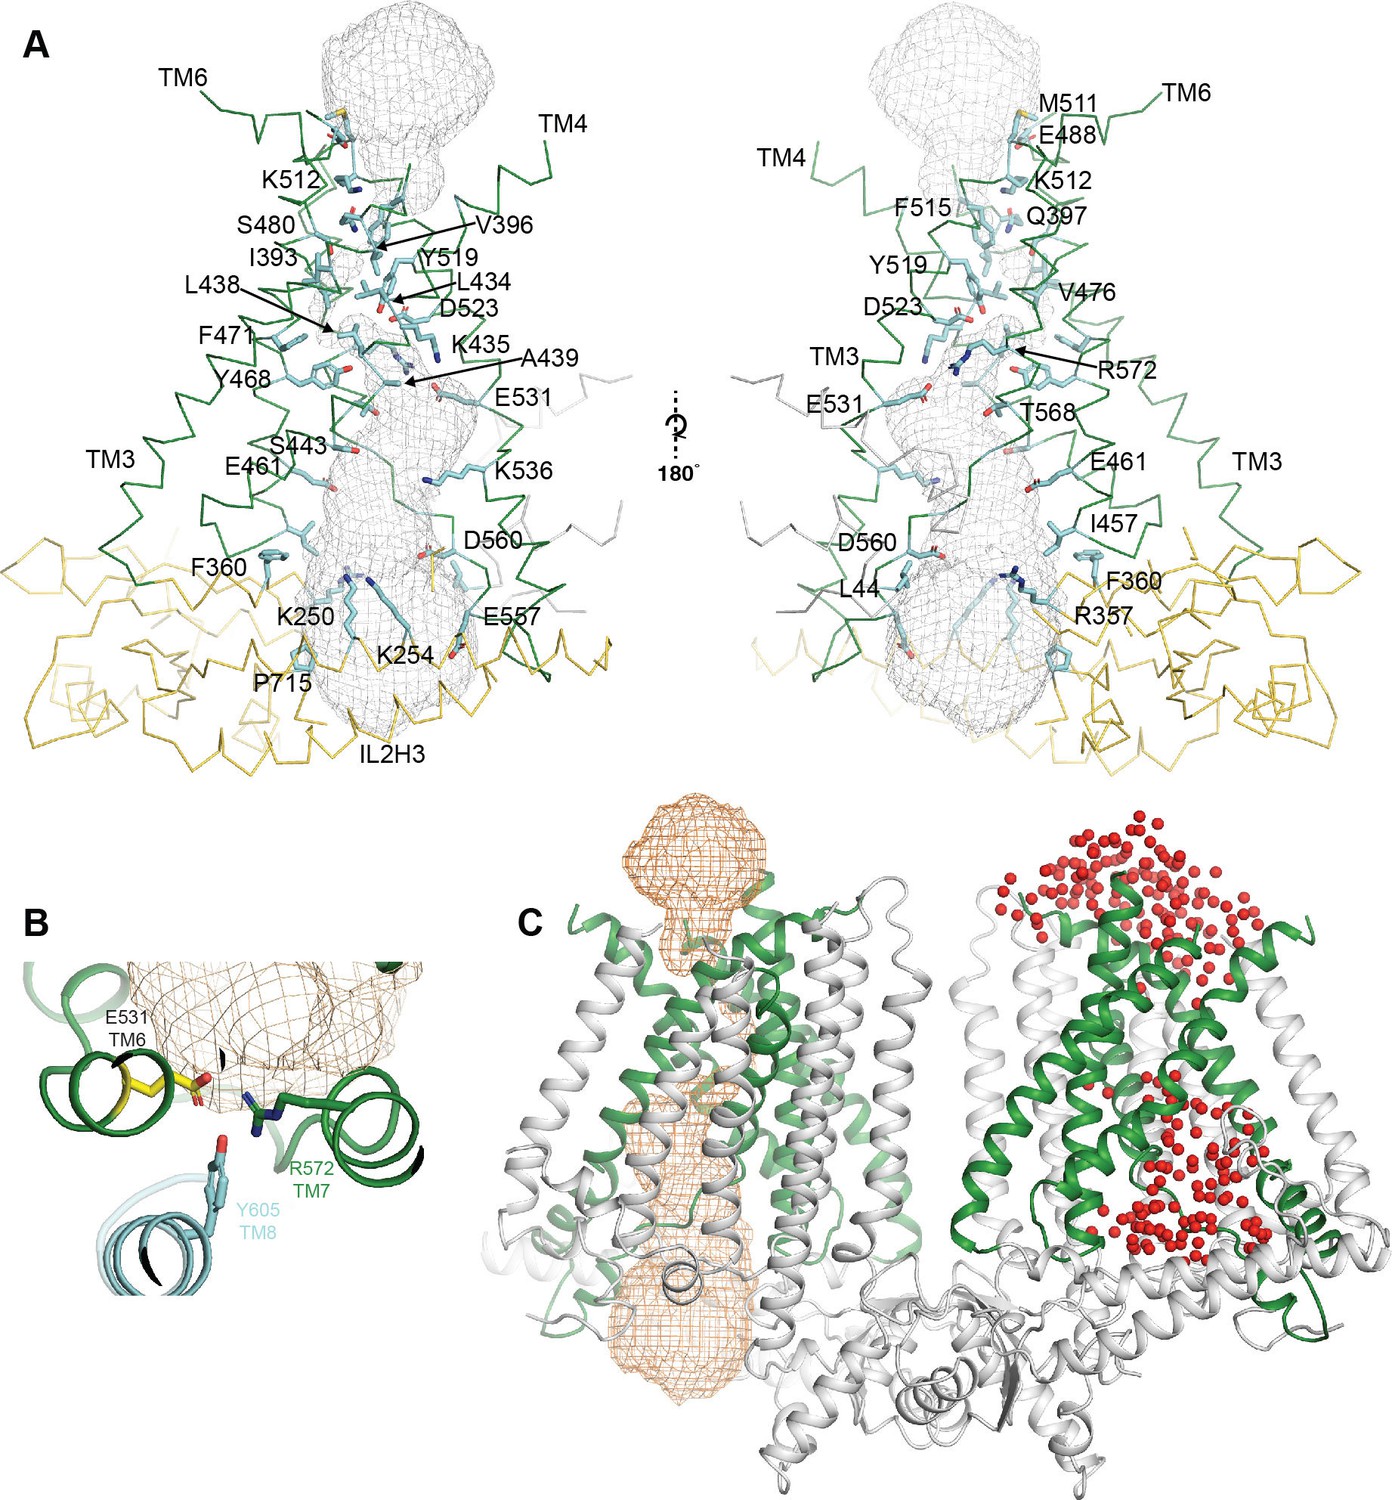
Details of the OSCA 1.2 pore.
(A) Pore and pore lining residues. Side chains are shown as blue sticks, backbone of OSCA1.2 is shown in ribbon representation and colored green for the TM helices and yellow for the intracellular domain. (B) Expanded top-down view of E531 and residues that sit in close proximity. (C) OSCA1.2 dimer showing pore representation obtained using HOLE (Smart et al., 1996) in orange mesh (left subunit) and the placement of water molecules (represented as red spheres) around the pore at the end of AT-MD simulation. The similarity between the two supports placement of the pore.
Figure 4
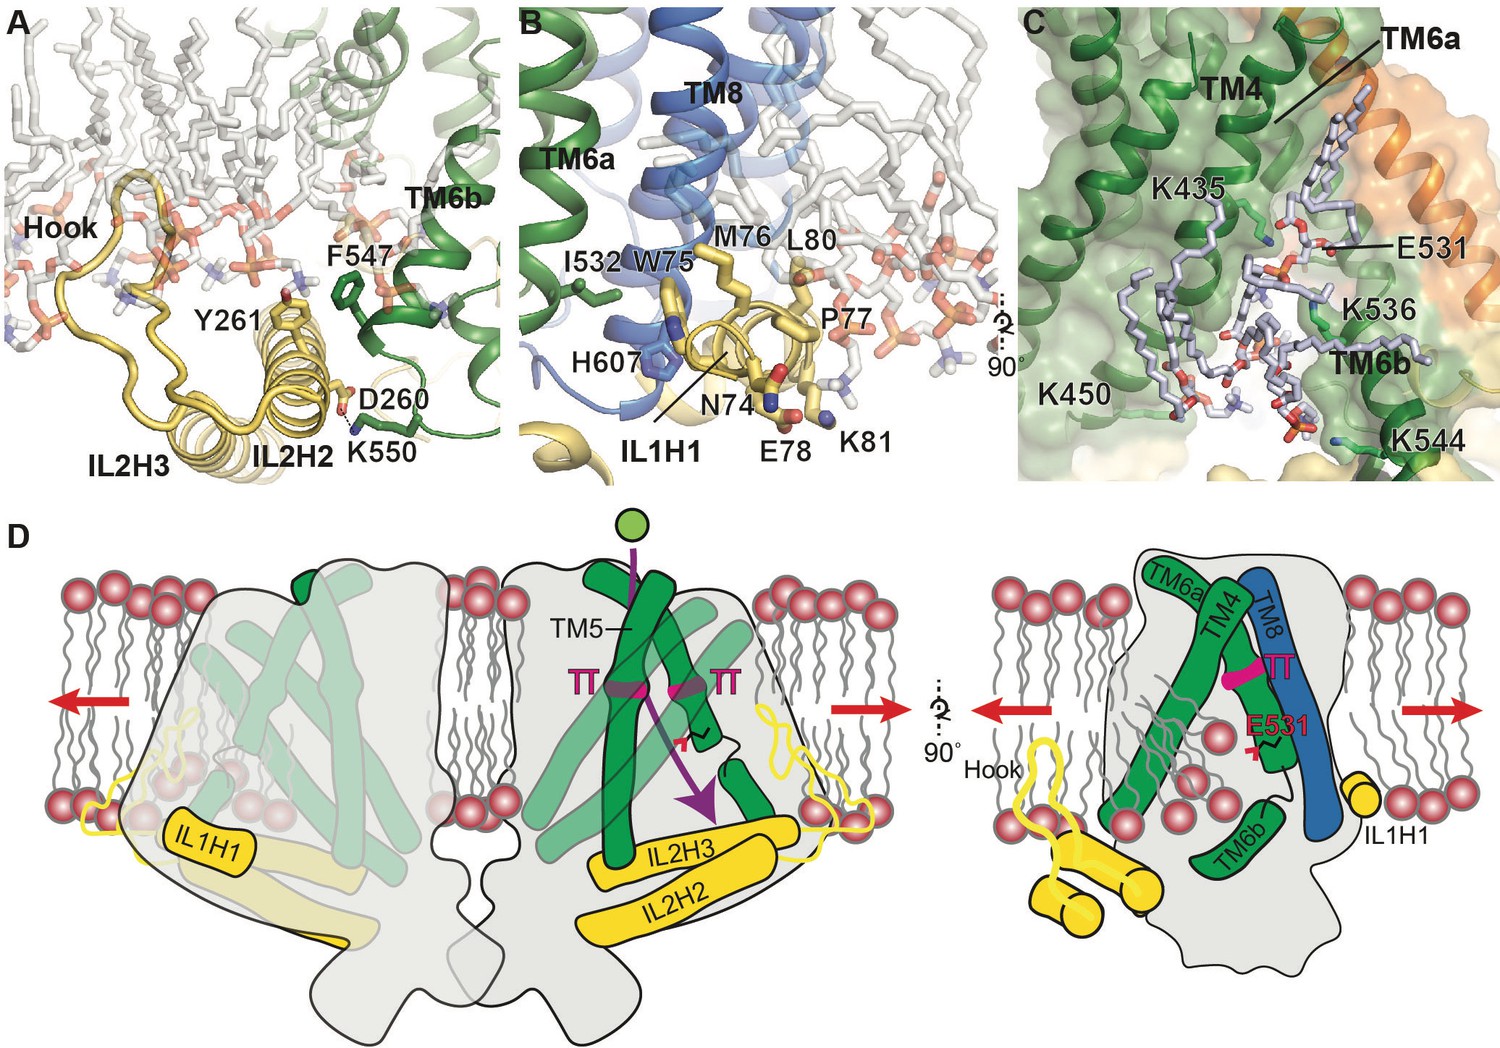
Putative mechanosensitive features of OSCA1.2.
(A) Cartoon representation of the membrane embedded hook, which intervenes IL2H2 and IL2H3. IL2H2 interacts with pore-lining TM6b. (B) Cartoon and stick representation of the amphipathic membrane-embedded IL1H1, which contacts pore-lining TM6a and TM8. In (A) and (B), MD snapshots of lipids proximal to the hook and IL1H1 are shown, demonstrating that both domains are membrane-embedded. (C) A snapshot (at ~50 ns) of the MD simulation showing four phospholipids occupying a cytoplasmic cavity of the pore, which is formed by TM4 and TM6b. Interactions of three lipids with the sidechains of K435, K536, and K544 were sustained throughout the 1 µs of CG simulation and also throughout the entire 250 ns of AT simulation (also see Figure 1—figure supplement 5B, Video 6 and Video 7). (D) Schematic showing various features of OSCA1.2 proposed to be involved in MA ion channel function. Red arrows depict direction of membrane tension when applied, though the current structure is not under tension. Green sphere represents ion entering the pore and purple arrow shows pore pathway that transits between π helices. The right panel highlights the amphipathic and membrane embedded regions of one monomer of OSCA1.2 and the local perturbation of the inner leaflet, including entry of lipids into the cytoplasmic side of the pore.
Videos
Video 1
Related to Figure 2A and Figure 4A,B. Atomistic simulation of OSCA1.2 (side view) in a POPC lipid environment.
The system was first equilibrated for 1 µs in CG simulations before converting to atomistic detail. The entire AT simulation is 250 ns, with position restraints applied in the first 50 ns (see Materials and methods). This allows the lipid bilayer interactions with the protein to equilibrate. Phosphorus atoms of POPC lipids within 20 Å of the protein are shown as transparent tan spheres. The hook and IL1H1 regions remain inserted in the membrane. Lipid flip-flop (i.e. scramblase activity) was not observed over the course of the simulation.
Video 2
Related to Figure 1G–I. The network of intersubunit lipids remains stable in the AT simulation.
OSCA1.2 and POPC lipids in the atomistic simulation same as Video 1, showing the top view. Lipids found in the inter-subunit cleft are defined as within 20 Å of residue 655–683 (TM10) of both subunits, at the start of the AT simulation. Here the upper and lower leaflets contain 13 and 9 POPC molecules respectively. The networks of lipids in both leaflets are stable. No lipids either entered or left the cleft.
Video 3
View of OSCA1.2 pore from the membrane plane.
Pore and pore lining residues. Side chains are shown as blue sticks, backbone of OSCA1.2 is shown in ribbon representation and colored green for the TM helices and yellow for the intracellular domain.
Video 4
Related to Figure 3C and Figure 1—figure supplement 5B.
Water distribution around the neck region of the pore (subunit 1). Water molecules around the highlighted residues on TM4–6 are shown; residue labels are colored by residue types (green: polar; white: non-polar). In subunit 1, intermittent permeation of water between L434 (TM4) and Y519 (TM6) were observed when position restraints were removed after 50 ns. This water permeation pathway presented a possible alternative to that suggested by the HOLE program. See also Video 5.
Video 5
Related to Figure 3C and Figure 1—figure supplement 5B.
Water distribution around the neck region of the pore (subunit 2). Water molecules around the highlighted residues on TM4–6 are shown; residue labels are colored by residue types (green: polar; white: non-polar). Subunit 2 remains impermeable to water during the entire simulation, in contrast to that in subunit 1 (Video 4).
Video 6
Related to Figure 4C and Figure 1—figure supplement 5C–D.
Lipid distribution around the cytoplasmic side of the pore (subunit 1).Interactions of lipid phosphate groups with lysine residues on TM4 and TM6b are shown (see also Figure 1—figure supplement 5C and Figure 1—figure supplement 5D). For both of the subunits, the orientation of K435 rearranges to face the constricted region of the pore after the position restraints are removed after 50 ns. The network of lipids of the lower leaflet shows how the bilayer is deformed around this region, with the lipid closest to K435 arranged almost perpendicular to the membrane (Video 7). As noted above (Video 1), lipid flip-flop is not observed.
Video 7
Related to Figure 4C and Figure 1—figure supplement 5C–D.
Lipid distribution around the cytoplasmic side of the pore (subunit 2). See Video 6 for caption.
Video 8
Morph between LMNG-solubilized and nanodisc-embedded OSCA1.2 models.
https://doi.org/10.7554/eLife.41845.025Additional files
-
Transparent reporting form
- https://doi.org/10.7554/eLife.41845.026
Download links
A two-part list of links to download the article, or parts of the article, in various formats.
Downloads (link to download the article as PDF)
Open citations (links to open the citations from this article in various online reference manager services)
Cite this article (links to download the citations from this article in formats compatible with various reference manager tools)
Cryo-EM structure of the mechanically activated ion channel OSCA1.2
eLife 7:e41845.
https://doi.org/10.7554/eLife.41845


