Circulating transforming growth factor-β1 facilitates remyelination in the adult central nervous system
- Osaka University, Japan
- National Center of Neurology and Psychiatry, Japan
- Toneyama National Hospital, Japan
Figures
Figure 1 with 1 supplement

TGF-β1 drives oligodendrocyte maturation.
(A) (Upper panels) Representative images of the oligodendrocyte cultures. Cells were stained with MBP (green) and Olig2 (magenta). (Lower panels) Yellow outlines were obtained from HCA to measure the MBP-positive area in Olig2-positive cells. (B) Representative images of the culture stained with MBP and Olig2. Cells were cultured 5 days after the adult mice serum treatment. (C) Quantification of MBP-positive area in Olig2-positive cells indicated in B (n = 8 for each), p=0.0009. (D) Representative images of culture stained with MBP and Olig2. Cells were treated with 1 μM of LY364847 (a TGF-βRI inhibitor), and then with adult mice serum. (E) Quantification of MBP-positive area in Olig2-positive cells indicated in D (n = 6 for each), p=0.0111, 0.0195 (left to right). (F) Representative images of oligodendrocyte stained with MBP and Olig2. Cells were transfected with TGF-β RI siRNA and treated with serum. (G) Quantification of MBP-positive area in Olig2-positive cells indicated in F (n = 5 for each), p=0.0011, 0.0104 (left to right). (H) Representative images of culture stained with MBP and Olig2. Cells were cultured with the indicated concentration of recombinant TGF-β1. (I) Quantification of MBP-positive area in Olig2-positive cells indicated in H (n = 3 for each), p=0.0007, 0.003 (left to right). (J) Representative image of TGF-βRI expression in the culture. Arrowheads indicate cells co-labeled with TGF-βRI (green) and APC (magenta). **p<0.01, *p<0.05, Student’s t-test or ANOVA with Tukey’s post-hoc test. Error bars represent SEM. Scale bars represent 20 μm for J, 100 μm for others.
-
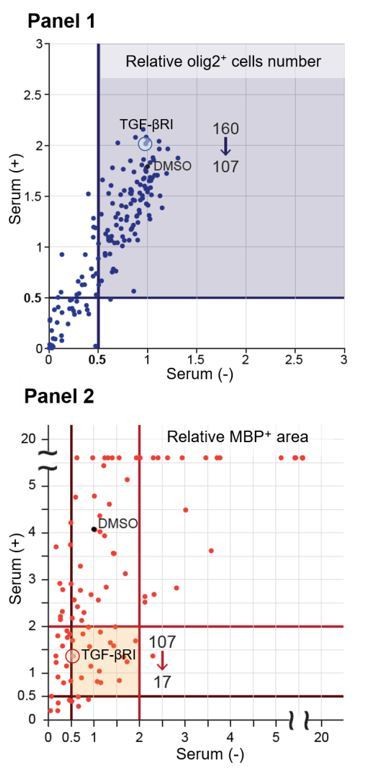
Figure 1—source data 1
Pharmacological impact for serum-mediated oligodendrocyte maturation.
Inhibitors were used at a final concentration of 10 μM. Each line shows the relative values of MBP/Olig2 area (two rows from the left) and Olig2 cell number (two rows from the right) relative to the control value (DMSO treatment without serum). TGF-βRI kinase inhibitor (red letters) is the only drug we tested that targets a receptor-type protein. The data is average of two trials.
- https://doi.org/10.7554/eLife.41869.004
Figure 1—figure supplement 1
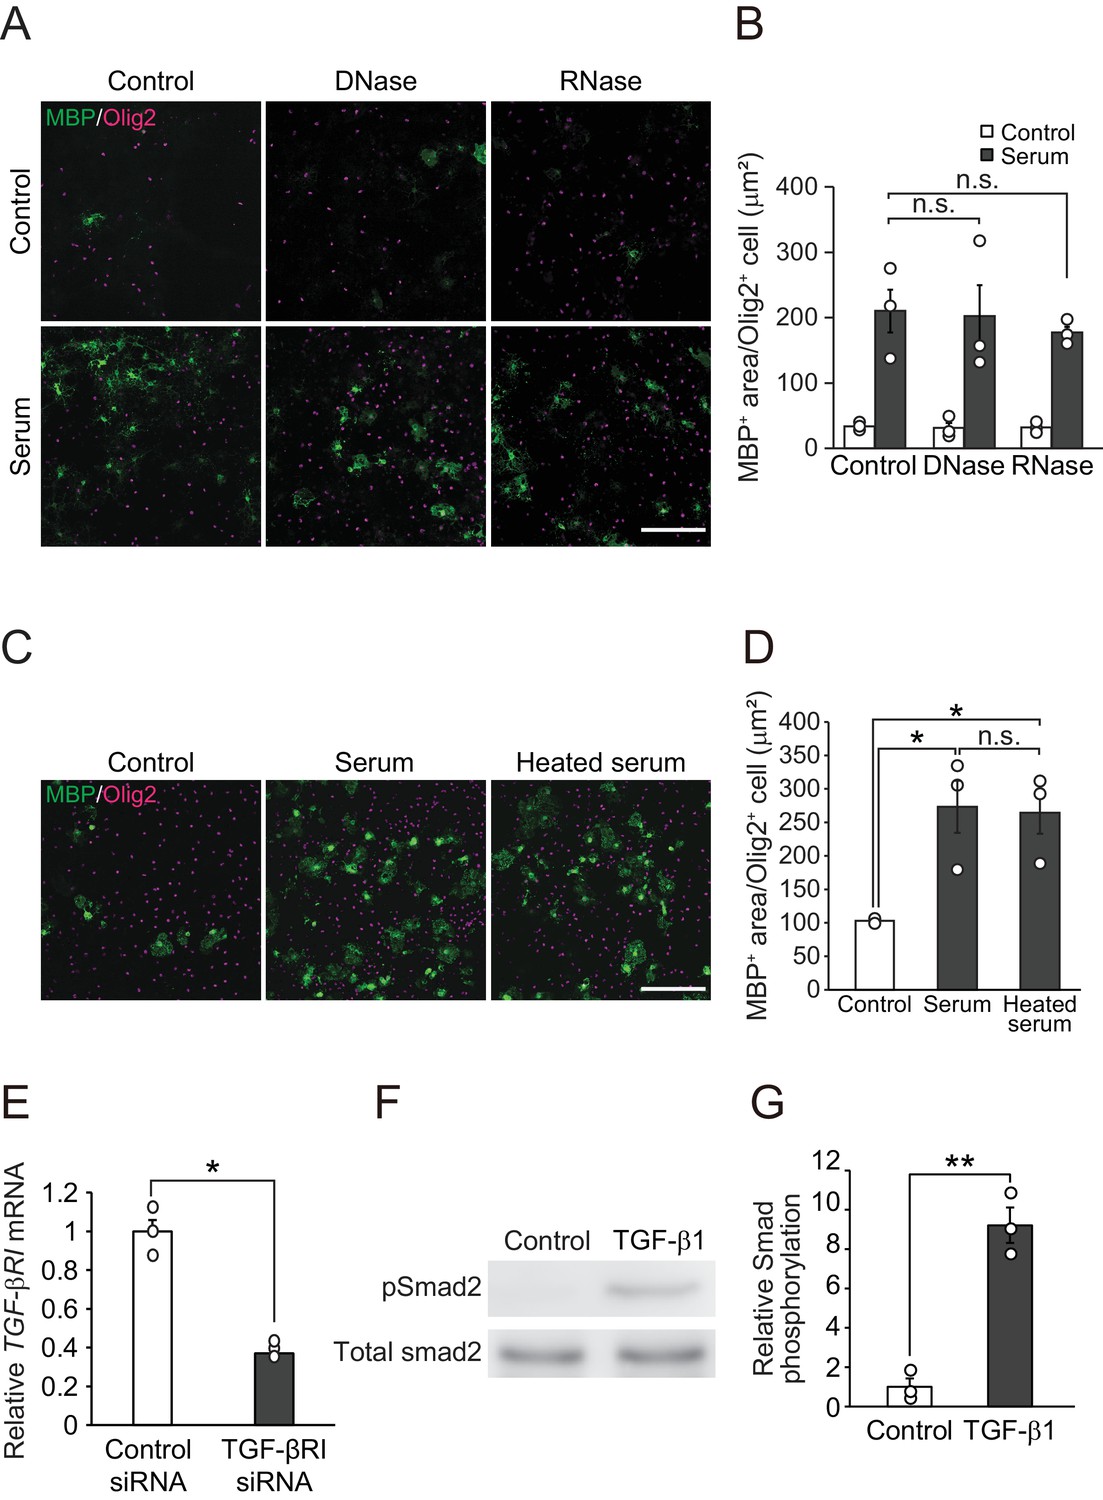
A heat-resistant protein in circulation promotes oligodendrocyte maturation.
(A) Representative images of the oligodendrocyte culture. Serum was pretreated with the indicated reagent and added into the culture. Cells were cultured 5 days after treatment. (B) Quantification of MBP-positive area in Olig2-positive cells (n = 3 for each), p=1 (serum vs serum pretreated with DNase), 0.9634 (serum vs serum pretreated with RNase). (C) Representative images of culture. Serum was pretreated with heat and added into the culture. (D) Quantification of MBP-positive area in Olig2-positive cells (n = 3 for each), p=0.0329 (control vs serum), 0.0407 (control vs serum pretreated with heat), 0.9828 (serum vs serum pretreated with heat). (E) Relative expression of TGF-βRI in the culture 3 days after TGF-βRI siRNA transfection (n = 3 for each), p=0.0011. (F) Representative image of Smad2 phosphorylation. Oligodendrocyte cultures were stimulated by with recombinant mouse TGF-β1 (10 ng/ml) for 30 min. (G) Relative increase of Smad2 phosphorylation indicated in F (n = 3 for each; p=0.0012). NS indicates not significant difference. *p<0.05, Student’s t-test or ANOVA with Tukey’s post-hoc test. Error bars represent SEM. Scale bars represent 100 μm.
Figure 2
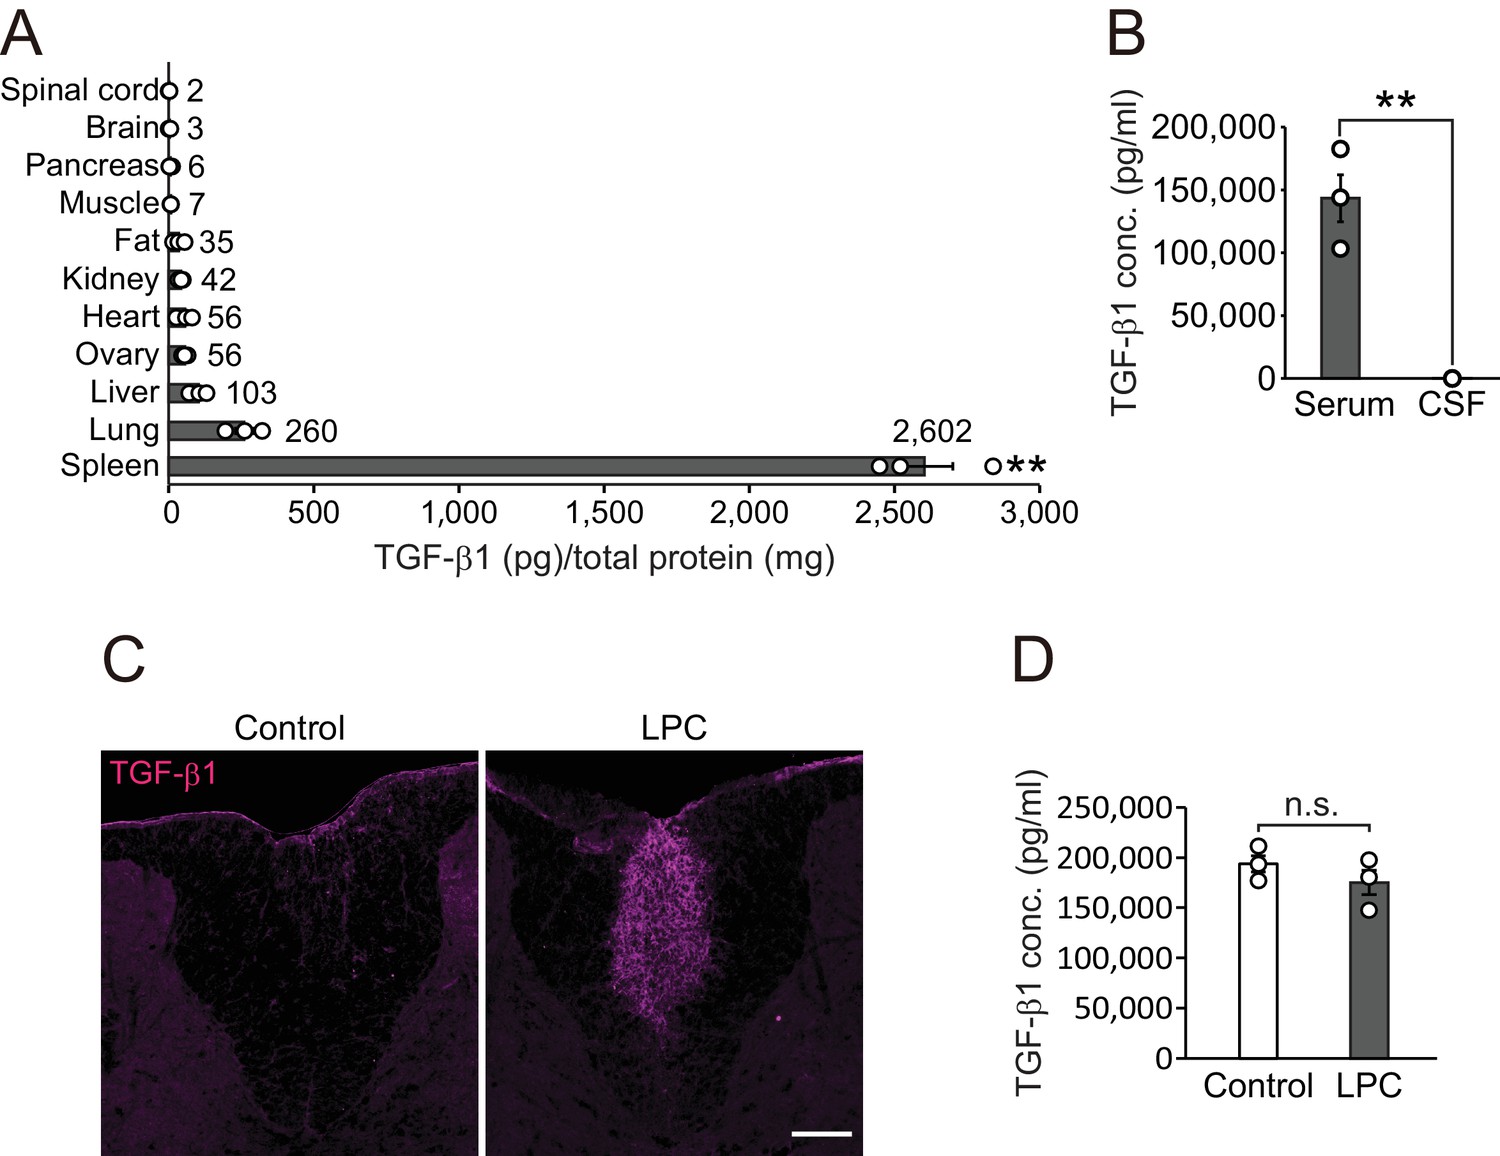
TGF-β1 level in circulation is higher than that in the CNS.
(A) Quantification of TGF-β1 protein level in individual organs in intact mice (n = 3 for each), p<0.0001. (B) Quantification of TGF-β1 protein concentration in the serum and CSF (n = 3 for serum, n = 4 for CSF), p=0.0007. (C) Representative image of spinal cord section which is labeled with TGF-β1. The spinal cord sections were obtained 7 days after LPC injection. (D) Quantification of TGF-β1 protein concentration in the serum 7 days after LPC injection (n = 3 for each). NS indicates not significant difference. **p<0.01, Student’s t-test or ANOVA with Tukey’s post-hoc test. Error bars represent SEM. Scale bars represent 100 μm.
Figure 3 with 1 supplement
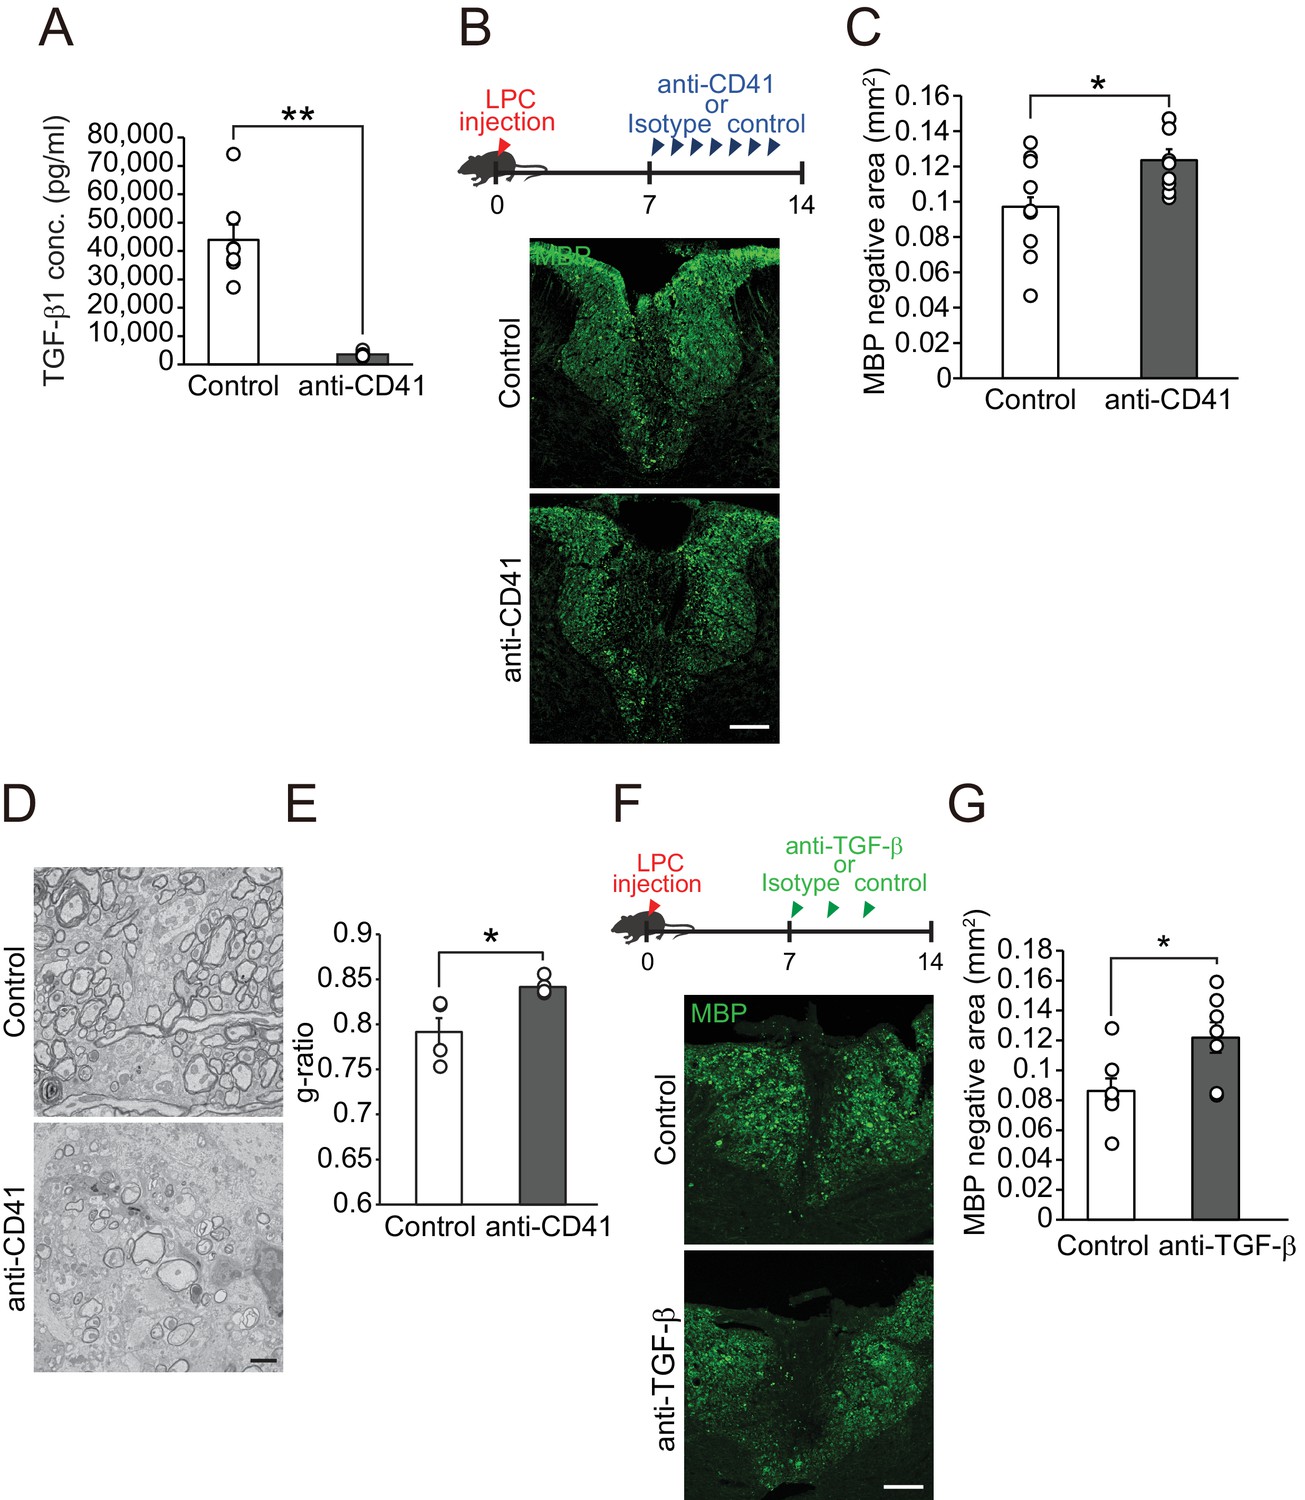
Circulating TGF-β1 supports spontaneous remyelination.
(A) Quantification of circulating TGF-β1 level in the mice with platelet depletion. Plasma from mice were obtained from 7 days after the start of anti-CD41 mAbs injection (n = 7 for control IgG, n = 8 for anti-CD41 mAbs), p=0.0001. (B) Representative images of spinal cord sections labeled for MBP. Spinal cords were dissected from mice 14 days after LPC injection. (C) Quantification of an MBP-negative area in the dorsal column of spinal cord as indicated in B (n = 9 for each), p=0.0347. (D) Representative electron micrographs of myelin in the spinal cord. Sections were obtained from mice treated with anti-CD41 mAb 14 days after LPC injection. (E) Graphs show quantitation of the g-ratio indicated in D (n = 4 for each), p=0.0347. (F) Representative images of spinal cord sections labeled for MBP. Spinal cords were obtained 14 days after LPC injection. Injection of TGF-β neutralizing antibodies was started 7 days after LPC and continued every other day (n = 7), p=0.0278. (G) Quantification of an MBP-negative area in the dorsal column of spinal cord, as indicated in F. NS indicates not significant difference. **p<0.01, *p<0.05, Student’s t-test. Error bars represent SEM. Scale bars represent 100 μm for B, F, 2 μm for D.
Figure 3—figure supplement 1
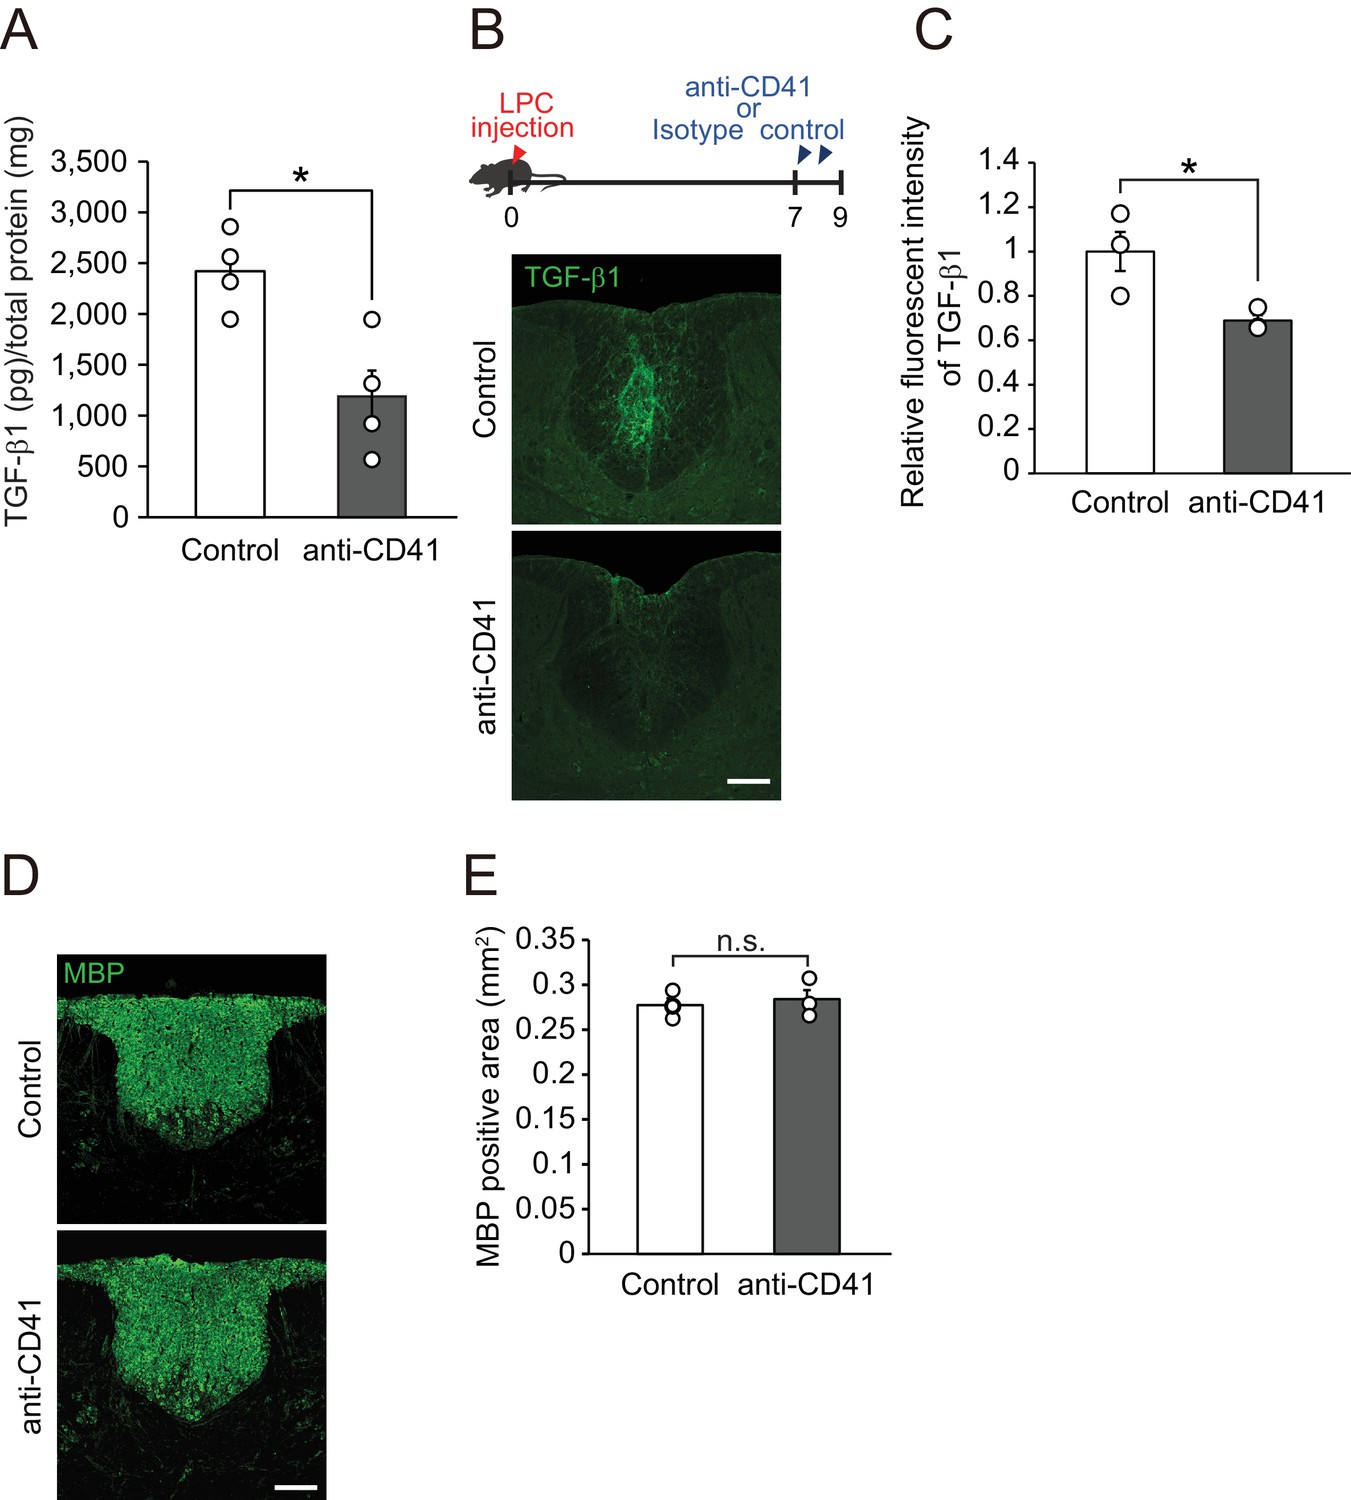
Circulating TGF-β leaks into the spinal cord after LPC injection.
(A) Quantification of TGF-β1 level in the spleen in mice subjected to platelet depletion. Samples were collected 7 days after the start of anti-CD41 mAb injection (n = 4 for each), p=0.0129. (B) Representative image of spinal cord from mice treated with anti-CD41 mAb. Seven days after LPC injection, mice were treated with anti-CD41 mAbs. Spinal cords were dissected 2 days after antibody treatments. Control data were obtained from mice that received control IgG (n = 3 for each), p=0.05. (C) Quantification of TGF-β1 signal in the spinal cord, as indicated in B. (D) Representative image of intact spinal cord sections labeled for MBP. Spinal cords were obtained 7 days after the start of anti-CD41 mAb injection (n = 3 for each), p=0.5768. (E) Quantification of MBP-negative area in the dorsal column of spinal cord, as indicated in D. **p<0.01, *p<0.05, Student’s t-test. Error bars represent SEM. Scale bars represent 100 μm.
Figure 4 with 1 supplement
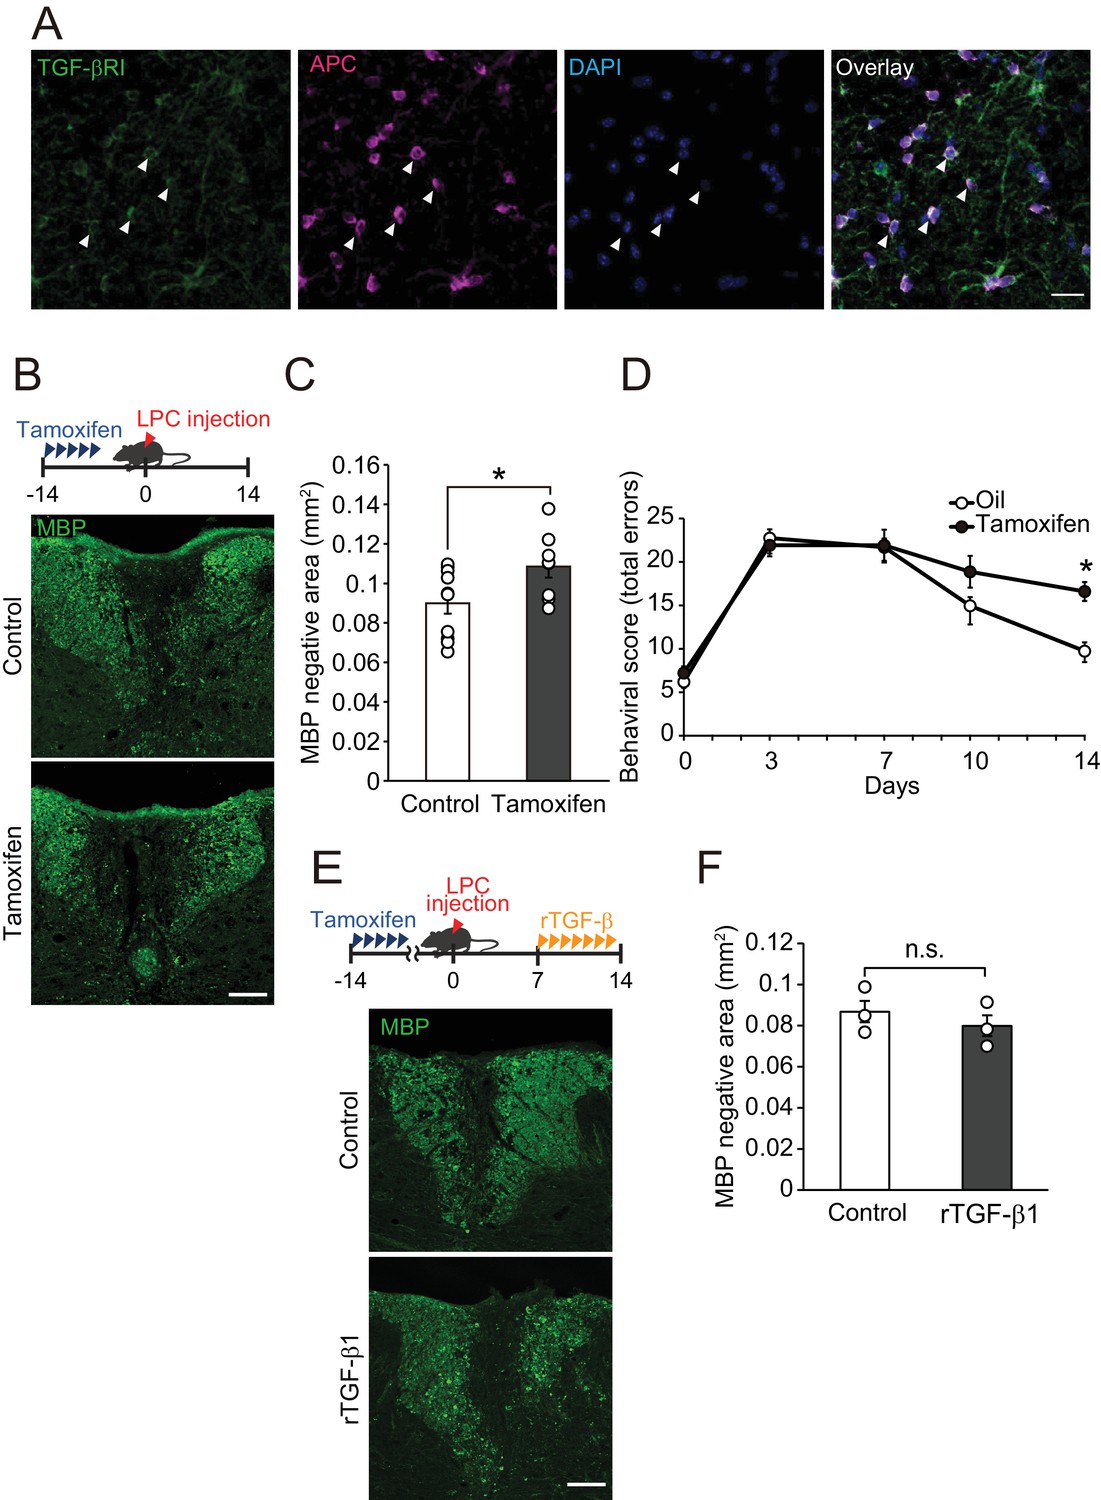
TGF-βRI in oligodendrocytes is required for remyelination.
(A) Representative images of spinal cord sections double-labeled for APC and TGF-βRI. Spinal cords were obtained from control mice. The white arrowheads show APC+ TGF-βRI+ cells. (B) Representative images of spinal cord sections labeled for MBP. Spinal cords were obtained from the tamoxifen-treated conditional knockout mice 14 days after LPC injection. Control data was obtained from the conditional knockout mice without tamoxifen treatment. (C) Quantification of MBP-negative area in the dorsal column of spinal cord as indicated in B (n = 10 for control, n = 8 for conditional knockout mice), p=0.0364. (D) Motor function was assessed by beam walk test (n = 10 for each), p=0.0156. (E) Representative images of spinal cord sections labeled for MBP. Spinal cords were obtained from tamoxifen-treated conditional knockout mice 14 days after LPC injection. Data were obtained from conditional knockout mice with or without recombinant TGF-β1 treatment. (F) Quantification of MBP-negative area in the dorsal column of spinal cord, as indicated in D (n = 3 for each; p=0.4816). (F) *p<0.05, Student’s t-test or Two-way ANOVA with Bonferroni’s post-hoc test. Error bars represent SEM. Scale bars represent 20 μm for A, and 100 μm for B and D.
Figure 4—figure supplement 1

TGF-βRI is expressed in oligodendrocytes.
(A) Representative images of spinal cord sections double-labeled for PDGFRα (magenta) and with TGF-βRI (green). (B) Representative images of spinal cord sections double-labeled for APC (magenta) and with TGF-βRI (green). Spinal cord was obtained from the vehicle-treated control or tamoxifen-treated conditional knockout mice. (C) Relative expression of TGF-βRI in oligodendrocyte obtained from oligodendrocyte-specific TGF-βRI knockout mice (n = 3 for each), p=0.0062. (D) Representative images of spinal cord sections labeled for MBP. Spinal cords were obtained from tamoxifen-treated conditional knockout mice not subjected to LPC injection. (E) Quantification of MBP-positive area in the dorsal column of spinal cord, as indicated in D (n = 3 for each; p=0.9719). **p<0.01, Student’s t-test. Error bars represent SEM. Scale bars represent 20 μm.
Figure 5 with 1 supplement
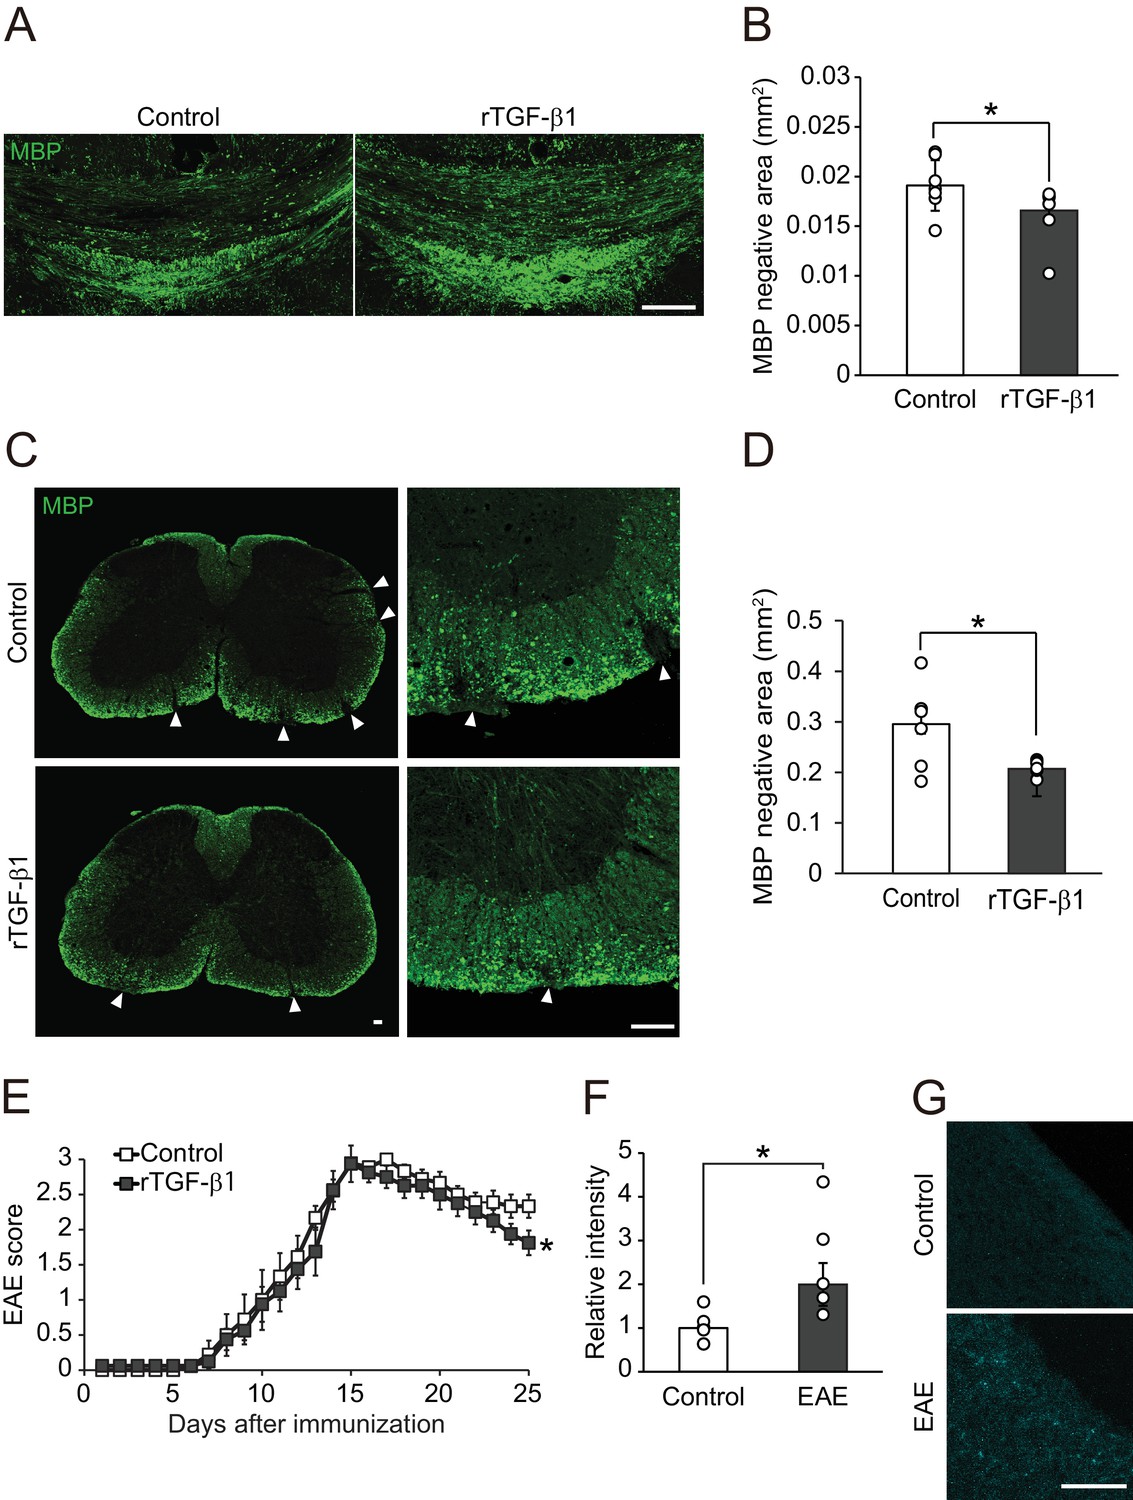
TGF-β1 treatment promotes remyelination.
(A) Representative image of brain section labeled for MBP. Brains were obtained from the cuprizone fed mice, along with TGF-β1 administration for 14 days after removal of cuprizone diet. (B) Quantification of MBP-negative area in the corpus callosum as indicated in A (n = 7 for control, n = 8 for TGF-β1), p=0.0444. (C) Representative image of spinal cord section labeled for MBP. Spinal cords were dissected from the mice 25 days after EAE induction. Right panels show high magnification of left panels. (D) Quantification of MBP-negative area in the spinal cord as indicated in C (n = 7 for each), p=0.0125. (E) EAE score of the mice with TGF-β1 administration. TGF-β1 administration was started 15 days after EAE induction and continued daily injection at the end of period (n = 13 for control, n = 12 for TGF-β1), p=0.049. (F) Relative intensity of fluorescent dye-labeled recombinant mouse TGF-β1 in the spinal cord obtained from EAE mice (n = 6 for control, n = 5 for EAE), p=0.0193. (G) Representative image of spinal cord section from EAE mice. EAE mice received fluorescent-dye-labeled recombinant mouse TGF-β1. *p<0.05, Student’s t-test or two-way ANOVA with Bonferroni’s post-hoc test. Error bars represent SEM. Scale bars represent 100 μm.
Figure 5—figure supplement 1
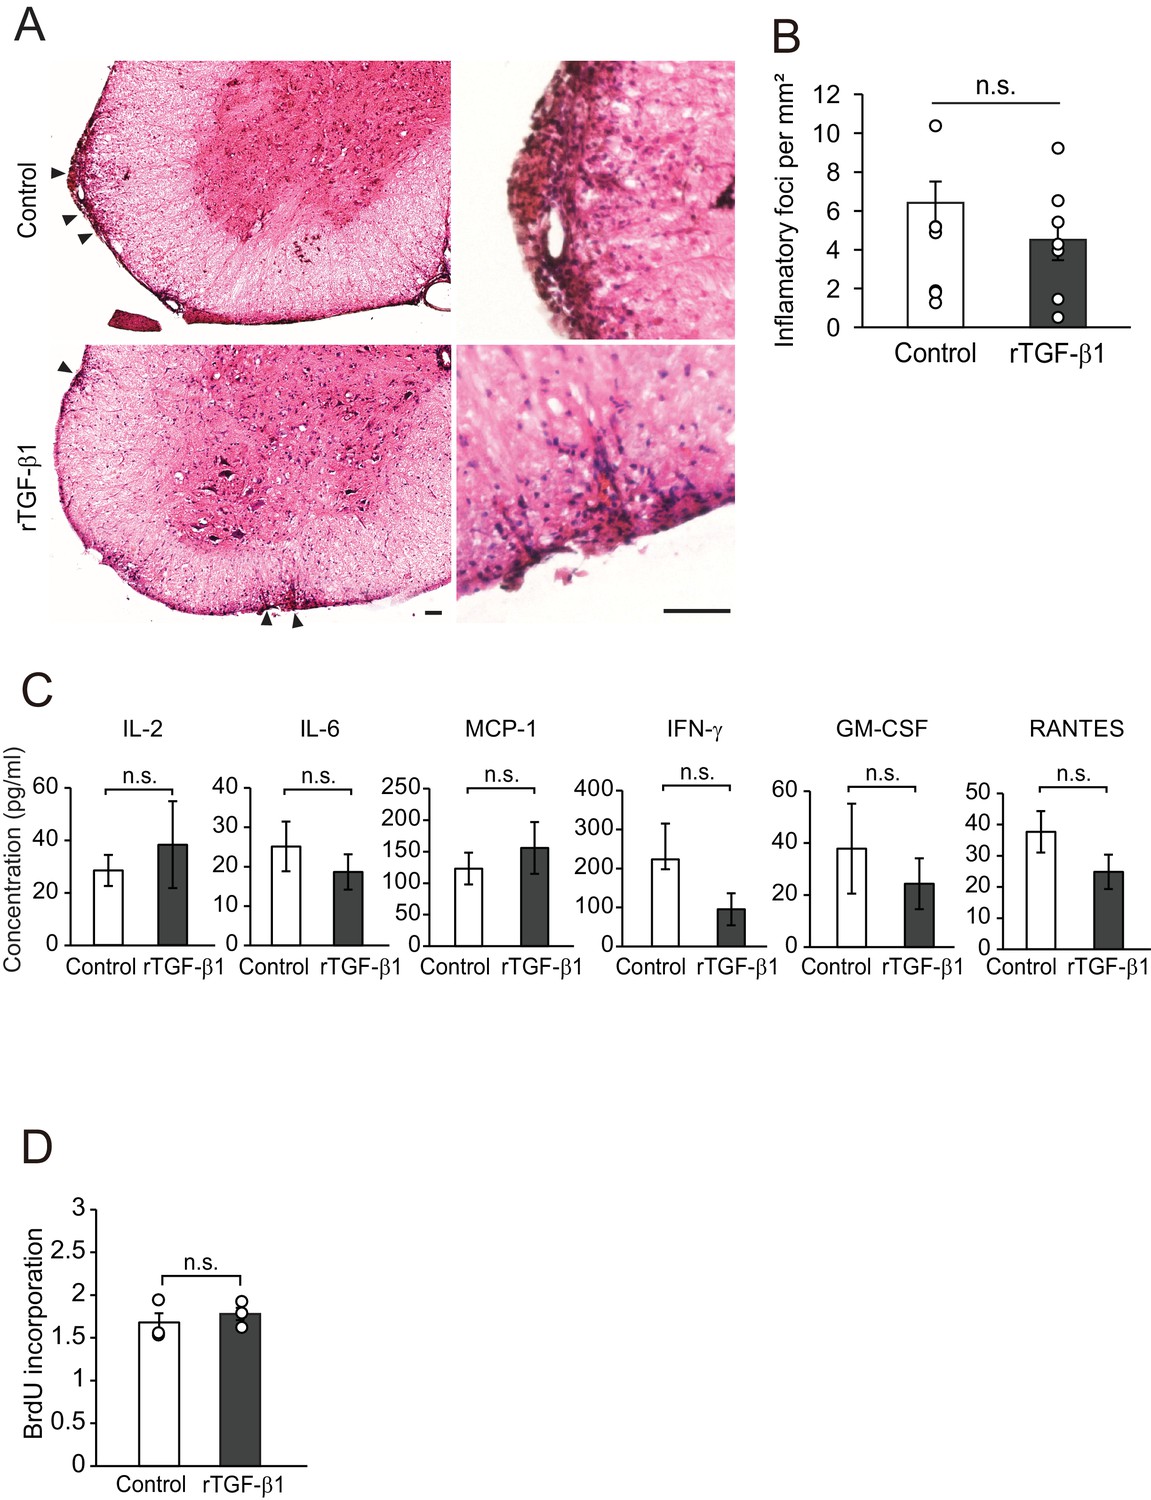
TGF-β treatment does not regulate accumulation of inflammatory cells.
(A) Representative images of spinal cord section stained with hematoxylin and eosin. Spinal cord section was collected 14 days after the start of TGF-β1 treatment. Right panels show high magnification of left panels. (B) Quantification of the number of inflammatory foci in the spinal cord, as indicated in A (n = 7 for each). p=0.9448. (C) Quantification of cytokine release from splenocytes. Splenocytes were obtained from mice 21 days after EAE injection. Recombinant TGF-β1 treatment started just after EAE induction (n = 3 for each). p=0.6706, 0.5336, 0.6073, 0.3567, 0.6088, 0.2934. (D) Ratio of BrdU incorporation into the splenocyte. Cells were obtained from mice 21 days after EAE injection. Recombinant TGF-β1 treatment started just after EAE induction (n = 3 for each). p=0.5646. Student’s t-test. Error bars represent SEM. Scale bars represent 200 μm.
Figure 6
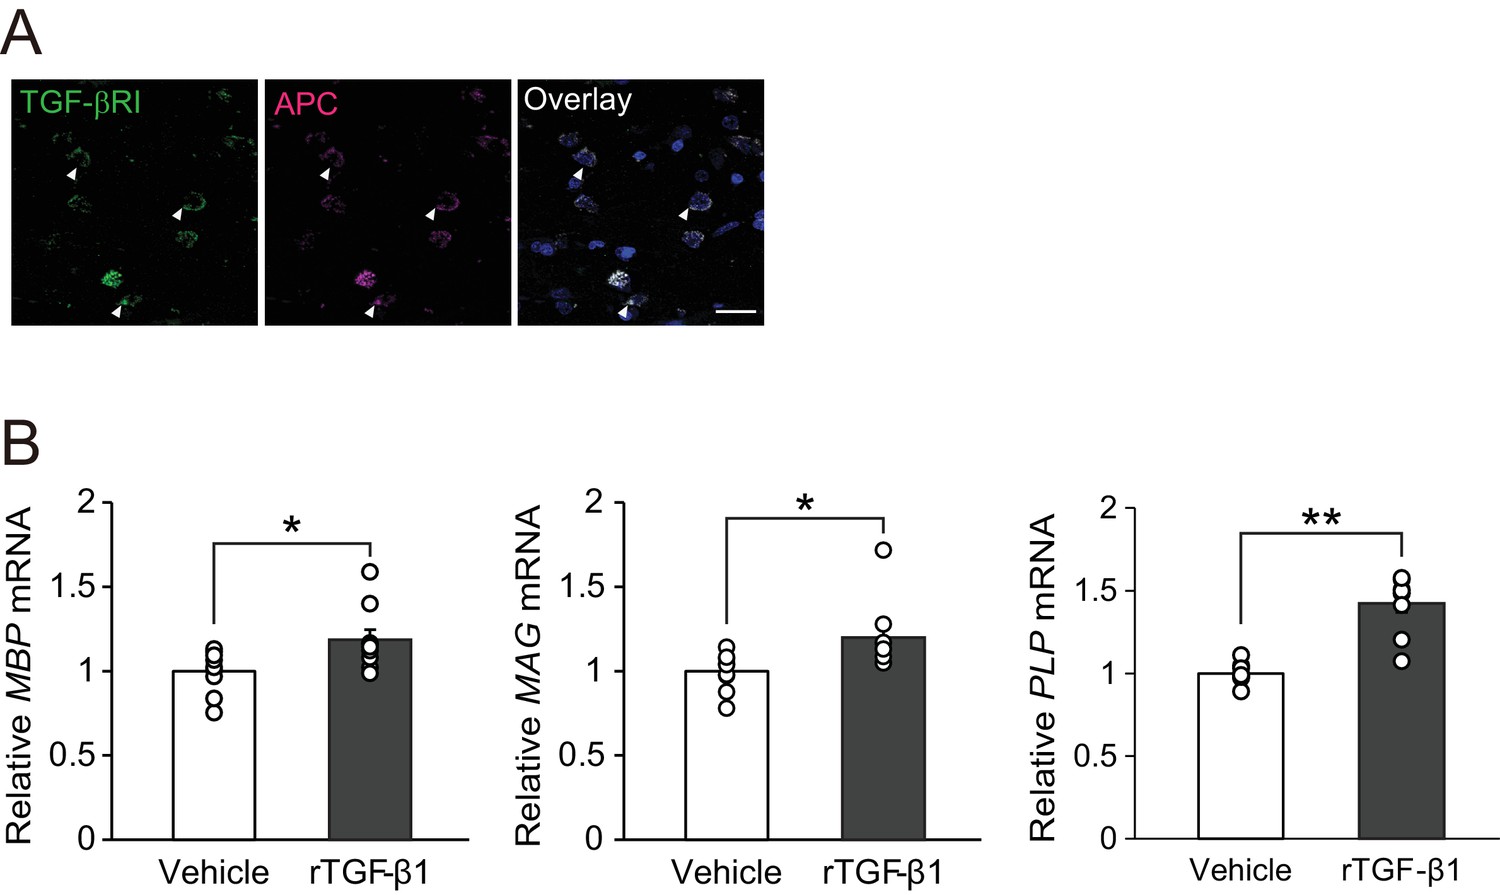
TGF-β1 stimulates human oligodendrocyte maturation.
(A) Representative images of spinal cord sections double-labeled for APC with TGF-βRI. Brain samples were obtained post-mortem from MS patients. (B) Relative expression of indicated mRNA in human oligodendrocyte. The cells were treated with recombinant human TGF-β1 (10 nM) for 3 days (n = 9 for each), p=0.0278 (MBP), 0.0222 (MAG), 0.0001 (PLP). **p<0.01, *p<0.05, Student’s t-test. Error bars represent SEM. Scale bar represents 50 μm.
Author response image 1
Tables
Key resources table
| Designation | Source or reference | Identifiers | Additional information |
|---|---|---|---|
| Tg(Plp1-cre/ERT)3Pop | PMID:12481300 | RRID:MGI:3696409 | |
| ALK5 flox | PMID:12842983 | Dr. Stefan Karlsson (Lund University) | |
| Myelin Basic Protein antibody | PMID:20209960 | RRID:AB_305869 | IHC (1:500) |
| Goat Anti-Human Olig2 Polyclonal antibody | PMID:18615534 | RRID:AB_2157554 | IHC (1:300) |
| Anti-APC (Ab-7) Mouse mAb (CC-1) antibody | PMID:16705673 | RRID:AB_2057371 | IHC (1:500) |
| Donkey Anti-Mouse IgG (H + L) Antibody, Alexa Fluor 594 Conjugated | PMID:23970788 | RRID:AB_141633 | IHC (1:500) |
| Donkey Anti-Goat IgG (H + L) Antibody , Alexa Fluor 647 Conjugated | PMID:25505326 | RRID:AB_141844 | IHC (1:500) |
| Phospho-Smad2 (Ser465/467)/Smad3 (Ser423/425) (D27F4) Rabbit mAb antibody | PMID:28324027 | RRID:AB_2631089 | WB (1:1000) |
| Smad2/3 (D7G7) XP Rabbit mAb antibody | PMID:29056512 | RRID:AB_10889933 | WB (1:1000) |
| Anti-Rabbit IgG Phototope-HRP Western Blot Detection System Antibody, Horseradish Peroxidase Conjugated | RRID:AB_2099234 | WB (1:2000) | |
| Rat Anti-CD41 Monoclonal Antibody, Unconjugated, Clone MWReg30 | PMID:30590031 | RRID:AB_395084 | |
| Goat Anti-Mouse Pdgf r alpha Polyclonal antibody, Unconjugated | PMID:28111199 | RRID:AB_2236897 | IHC (1:500) |
| TGFbeta RI (V-22) antibody | PMID:29161592 | RRID:AB_632493 | IHC (1:50) |
| Donkey Anti-Rat IgG (H + L) Antibody, Alexa Fluor 488 Conjugated | PMID:28280459 | RRID:AB_141709 | IHC (1:500) |
| TGF-beta 1,–2,−3 MAb (Clone 1D11) antibody | PMID: 28521131 | RRID:AB_357931 | |
| Q-Plex Mouse Cytokine - Screen (16-Plex) | Quansys Biosciences | Cat. #110949 MS | |
| Human Oligodendrocyte differentiation Kit | Millipore | Cat. #CS204496 | |
| Human recombinant TGF-β1 | R and D Systems | Cat. #240-B | |
| Recombinant Murine basic FGF | Peprotech | Cat. #450–33 | |
| Recombinant Murine PDGF-AA | Peprotech | Cat. #315–17 | |
| LY364947 | Calbiochem | Cat. #616451 | |
| Recombinant mouse TGF-b1 | R and D Systems | Cat. #7666 MB-005 | |
| Mouse/Rat/Porcine/Canine TGFb1 Quantikine ELISA | R and D Systems | Cat. #MB100B | |
| Cell Proliferation ELISA, BrdU (colorimetric) | Sigma Aldrich | Cat. #11647229001 | |
| L-α-Lysophosphatidylcholine (LPC) from bovine brain | Sigma Aldrich | Cat. #L1381 | |
| InhibitorSelect 384-Well Protein Kinase Inhibitor Library I | Calbiochem | Cat. #539743 |
Additional files
-
Transparent reporting form
- https://doi.org/10.7554/eLife.41869.013
Download links
A two-part list of links to download the article, or parts of the article, in various formats.
Downloads (link to download the article as PDF)
Open citations (links to open the citations from this article in various online reference manager services)
Cite this article (links to download the citations from this article in formats compatible with various reference manager tools)
Circulating transforming growth factor-β1 facilitates remyelination in the adult central nervous system
eLife 8:e41869.
https://doi.org/10.7554/eLife.41869


