Piezo’s membrane footprint and its contribution to mechanosensitivity
- University of Southern California, United States
- Howard Hughes Medical Institute, The Rockefeller University, United States
Figures
Figure 1

Piezo curves the membrane.
(A) Side and (B) top-down (projecting into the cell) views of the Piezo dome. The approximate position of the curved mid-bilayer surface of the Piezo dome is indicated in grey, with the cyan regions corresponding to the intersection of the mid-bilayer surface and the Piezo protein. (C) The curved shape of the mid-bilayer surface of the Piezo dome (indicated in grey) deforms the mid-bilayer surface of the surrounding lipid membrane (indicated in blue) and results in a membrane footprint of Piezo that extends beyond the size of the dome (see Figure 2A for further details). [The atomic structure of the Piezo protein in (A) and (B) corresponds to mPiezo1 with Protein Data Bank (http://www.rcsb.org) ID 6B3R.].
Figure 2
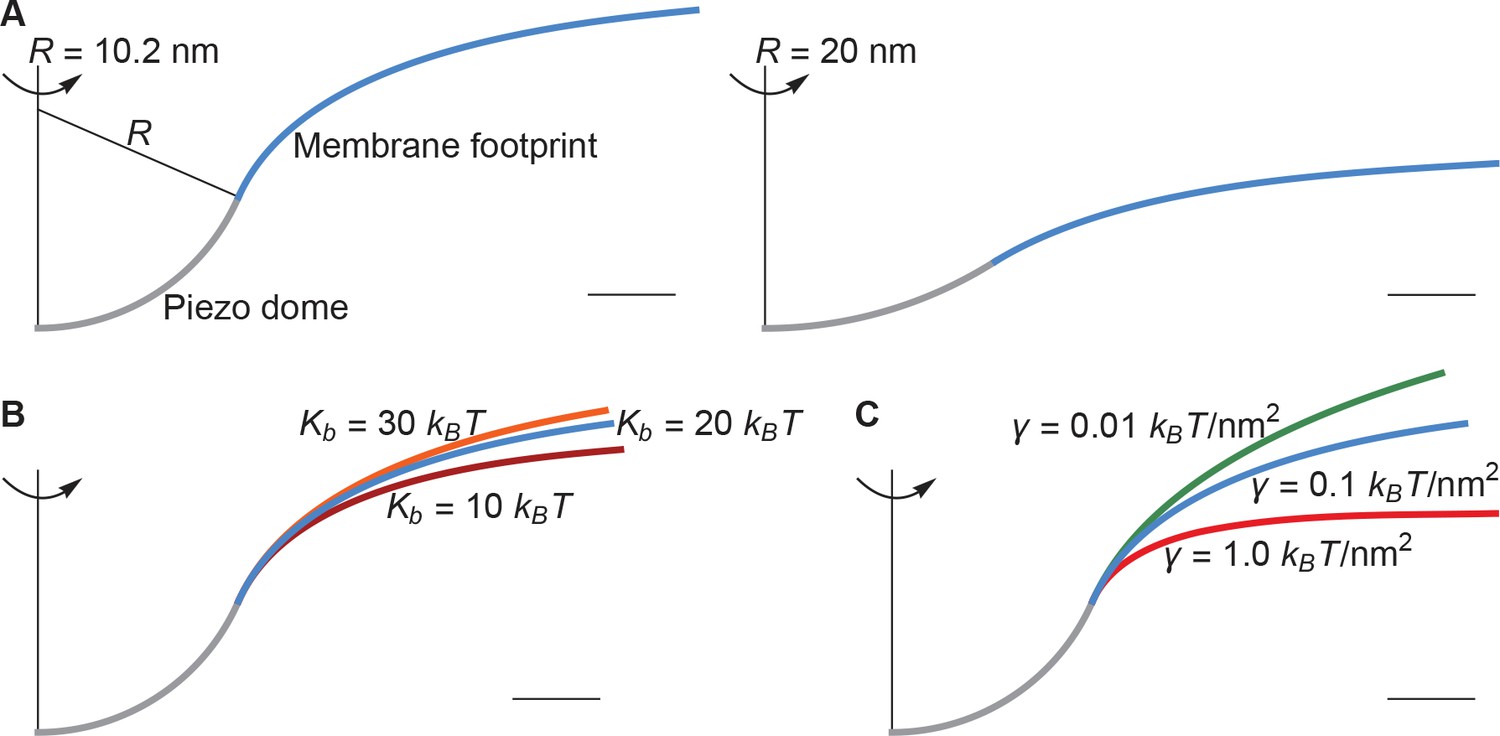
Membrane footprint of the Piezo dome.
The shape of the Piezo membrane footprint depends on (A) the radius of curvature of the Piezo dome , (B) the membrane bending modulus (membrane bending stiffness) , and (C) the membrane tension . All curves show the cross section of the mid-bilayer surface and its intersection with the Piezo protein. Unless indicated otherwise, we calculated the Piezo membrane footprint using the value observed for Piezo in a closed conformation (Guo and MacKinnon, 2017) with and . For Figure 1C we used the same parameter values as in the left panel of Figure 2A. The range of considered in (B) corresponds to the approximate range of measured for phosphatidylcholine bilayers with different acyl-chain lengths and degrees of unsaturation (Rawicz et al., 2000). Scale bars, 4 .
Figure 3
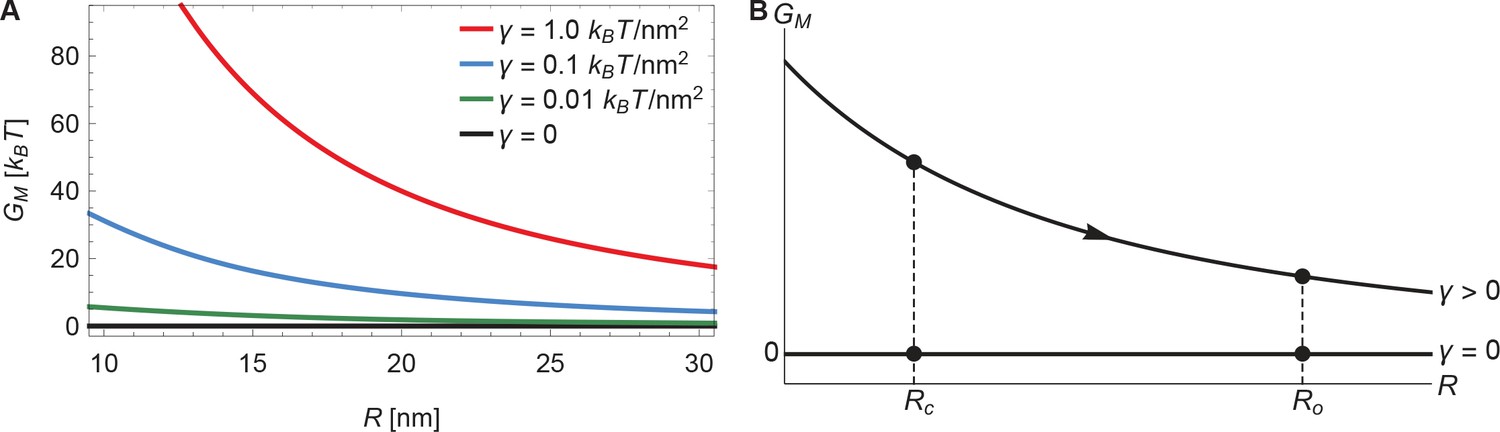
Energy of the Piezo membrane footprint.
(A) Energy cost of the Piezo membrane footprint as a function of the radius of curvature of the Piezo dome . We calculated by minimizing Equation 1 with the membrane bending rigidity and the indicated values of the membrane tension . (B) Schematic of the proposed mechanism for the mechanical activation of Piezo through membrane tension, for which we assume that the radius of curvature of the Piezo dome in the closed conformational state, , takes a smaller value than in the open conformational state, .
Figure 4
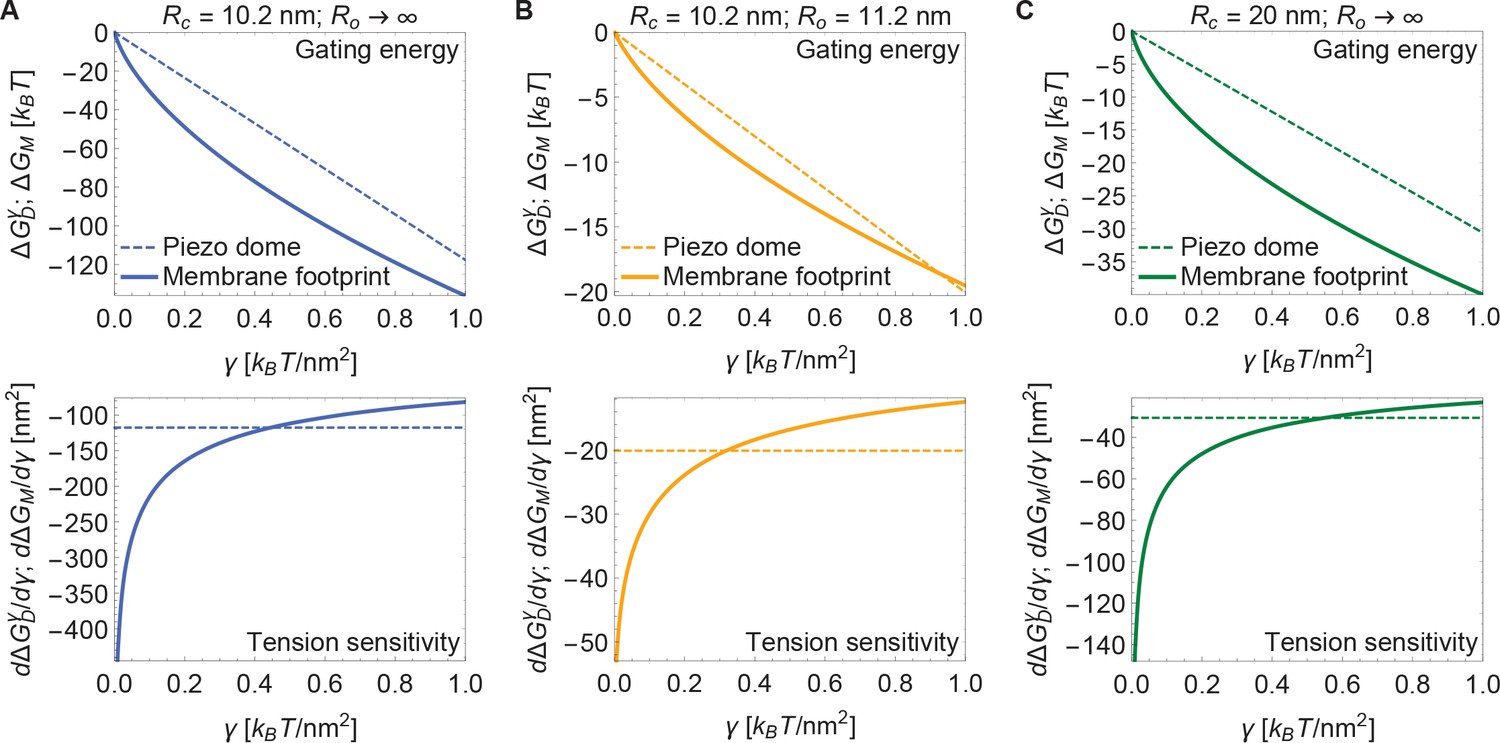
Energy of Piezo gating.
Tension-dependent contributions to the Piezo gating energy (upper panels) and associated tension sensitivity (lower panels) due to the Piezo dome, , and the Piezo membrane footprint, , as a function of membrane tension for the Piezo dome radii of curvature (A) and , (B) and , and (C) and in the closed and open conformational states of Piezo, respectively. For all calculations, we set the membrane bending rigidity .
Figure 5
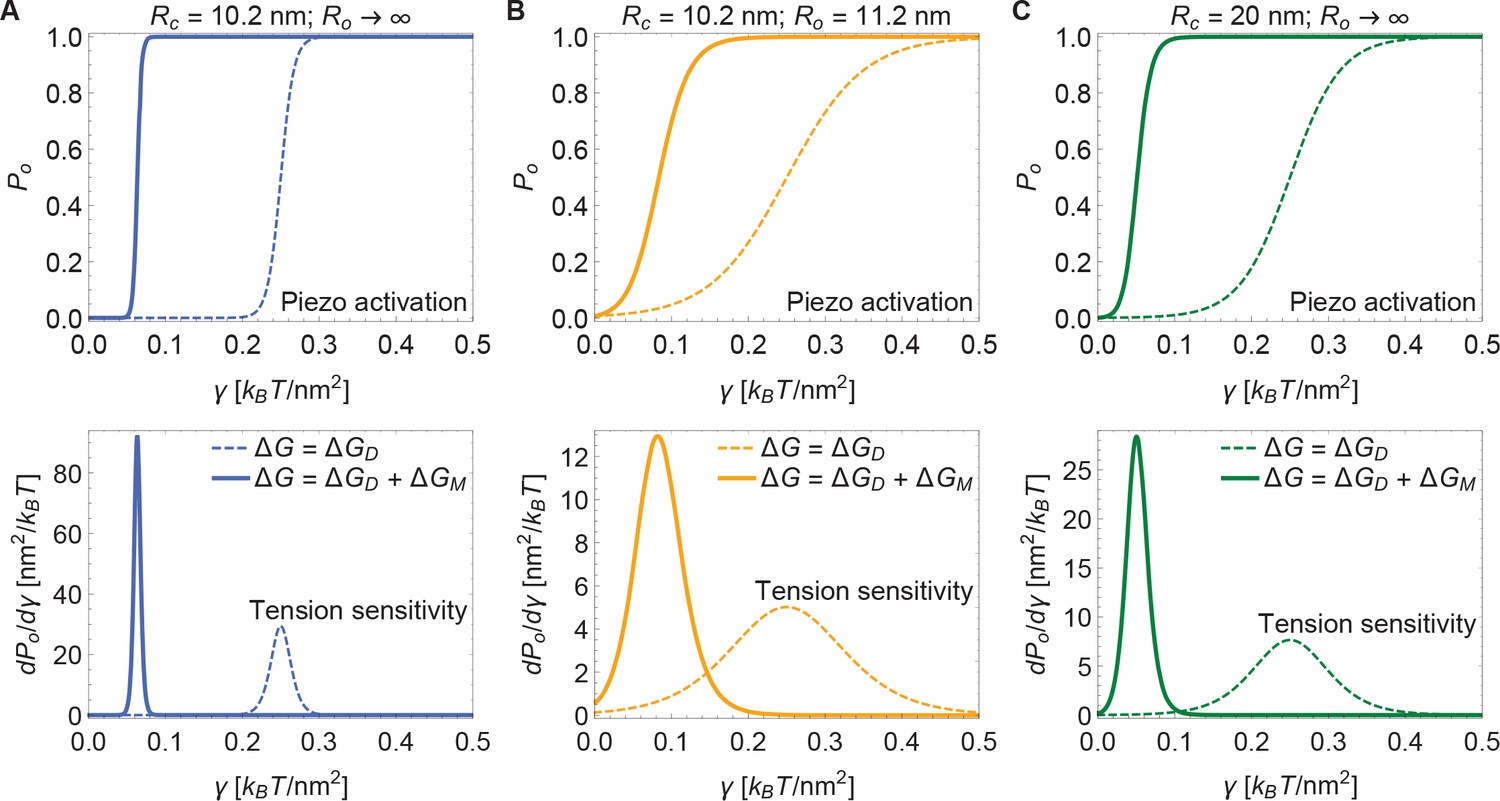
Piezo activation through membrane tension.
Piezo activation curves (upper panels) and associated tension sensitivity (lower panels) resulting solely from the gating energy due to the Piezo dome, , and from the gating energy due to the Piezo dome together with the Piezo membrane footprint, , as a function of membrane tension for the Piezo dome radii of curvature (A) and , (B) and , and (C) and in the closed and open conformational states of Piezo, respectively. For all calculations, we set the membrane bending rigidity . We used the values (A) , (B) , and (C) for the (unknown) contribution of the protein energy to the Piezo gating energy such that gating occurs within the indicated tension range.
Figure 6
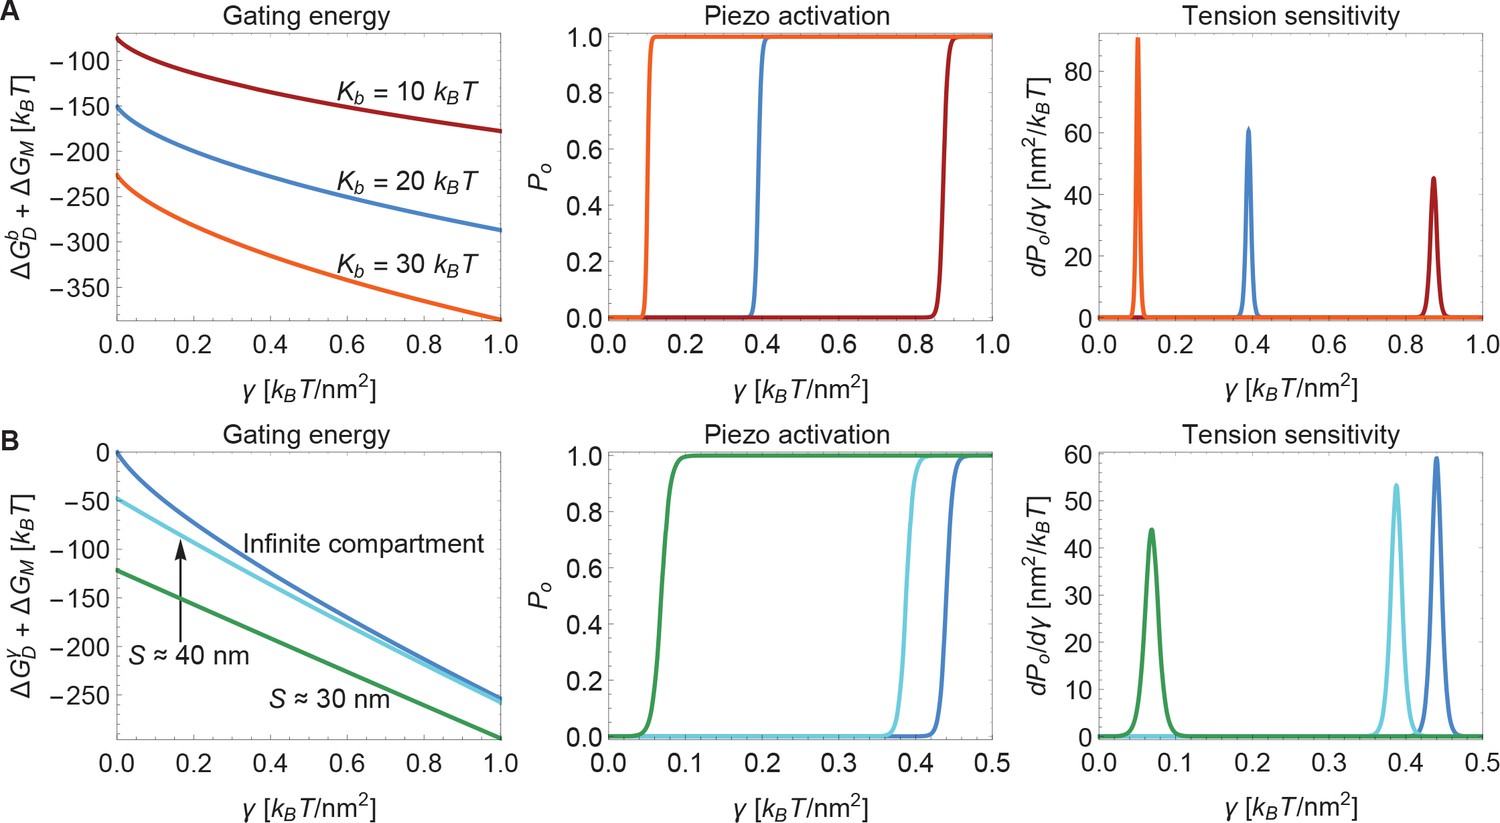
Modulation of Piezo gating through the membrane.
(A) Membrane bending stiffness-dependent contribution to the Piezo gating energy (left panel) and associated Piezo activation and tension sensitivity curves (middle and right panels) as a function of membrane tension for the indicated values of the membrane bending stiffness . (B) Membrane tension-dependent contribution to the Piezo gating energy (left panel) and associated Piezo activation and tension sensitivity curves (middle and right panels) as a function of membrane tension for infinite and finite membrane compartments. For both (A) and (B) we employed the Piezo dome radii of curvature and in the closed and open conformational states of Piezo, respectively. For (B) we used the unconstrained membrane arc lengths and separating the border of the Piezo dome and the border of the membrane compartment along the membrane in the radial direction, which correspond to the membrane compartment diameters and , respectively, and set . We calculated the curves in the middle and right panels of (A) and (B) from the total energy of the membrane-Piezo system in Equation 3, with the values (A) and (B) for the (unknown) contribution of the protein energy to the Piezo gating energy such that gating occurs within the indicated tension ranges.
Appendix 1—figure 1
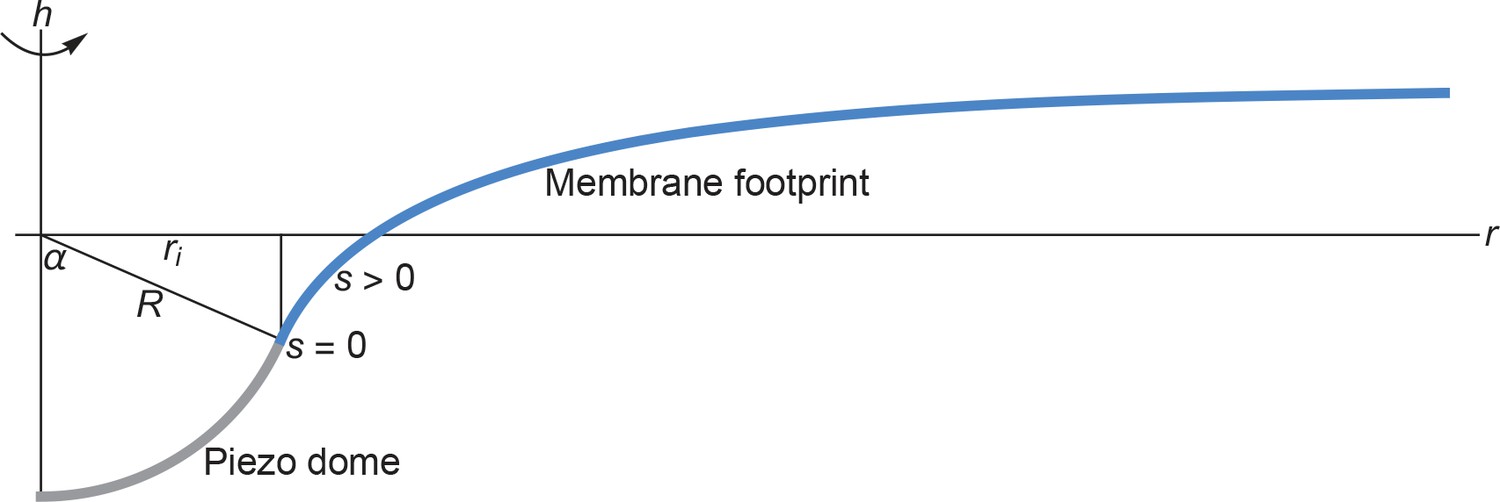
Cross section of the membrane shape deformations induced by Piezo for and .
Based on the structural data in (Guo and MacKinnon, 2017) we assume that the Piezo dome takes the shape of a spherical cap with fixed cap area 2. We denote the radius of curvature of the Piezo dome by , and represent the central pore axis of Piezo by the -axis and the radial coordinate in the reference plane by . Furthermore, we denote the arclength along the profile of Piezo’s membrane footprint by , with at the interface of the Piezo dome and the surrounding membrane and away from the Piezo dome. We set (Guo and MacKinnon, 2017) here and obtained Piezo’s membrane footprint by numerically calculating the stationary membrane shape implied by the arclength parametrization of Equation A1 (Peterson, 1985; Seifert et al., 1991; Jülicher and Seifert, 1994; Deserno, 2004; Bahrami et al., 2016) (see Appendix 1-section 2). The quantities and mathematically determine (Weisstein, 2017) the in-plane radius of the Piezo dome, , and the cap angle, . We allowed here the Piezo-induced membrane shape deformations to decay to a flat membrane shape over an arbitrarily large .
Appendix 1—figure 2
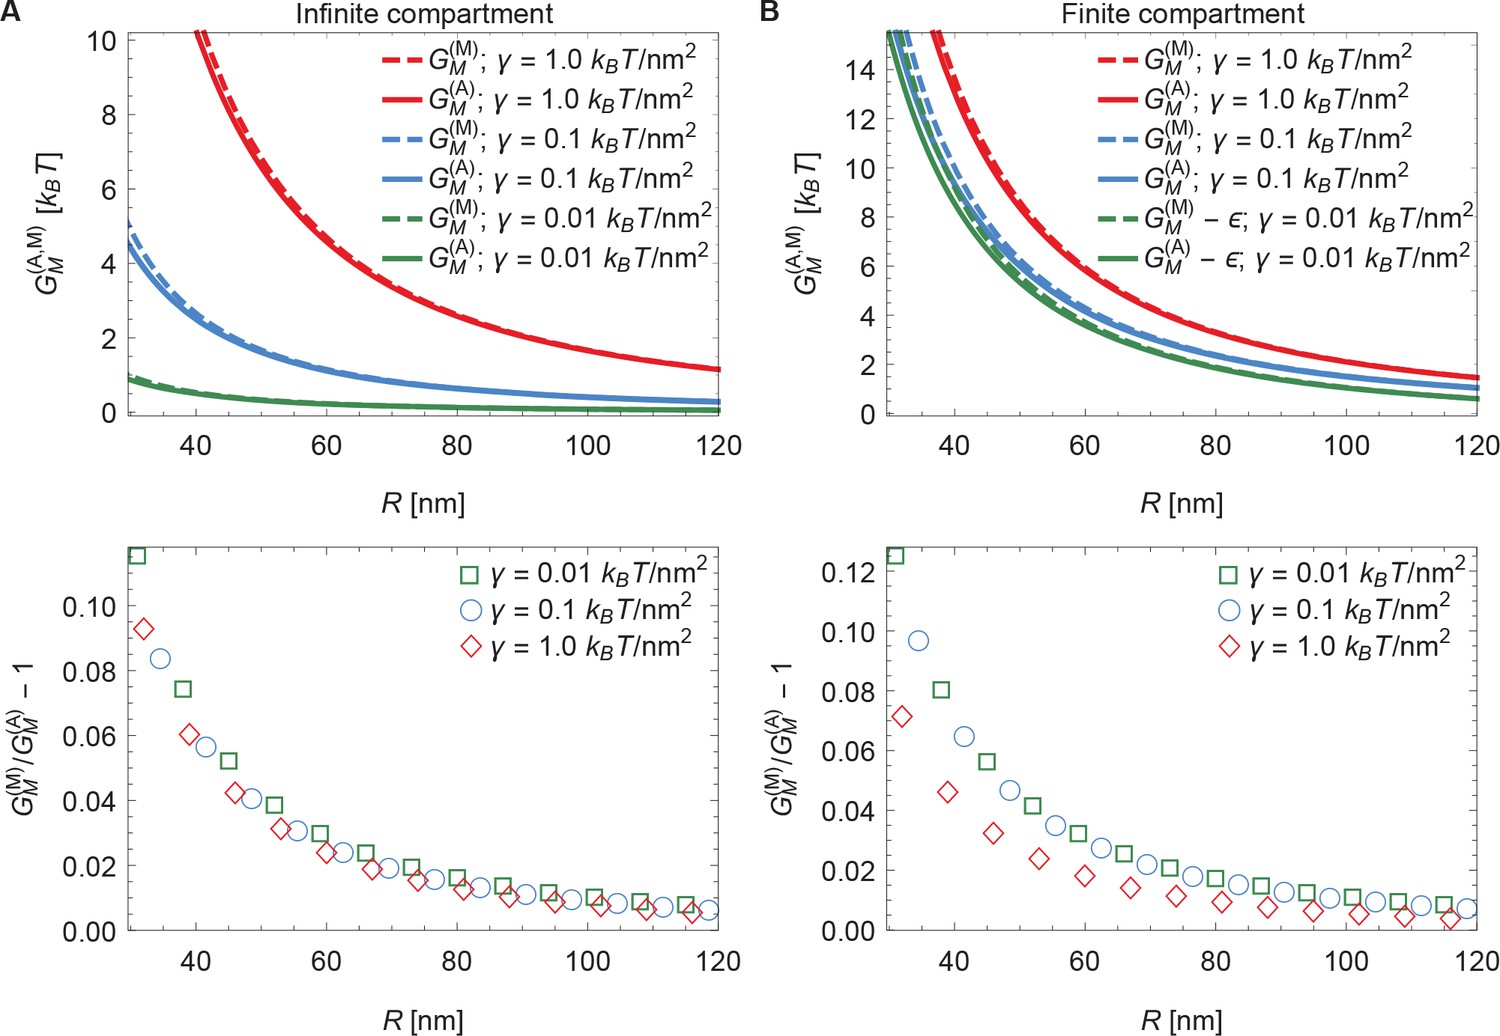
Comparison of arclength and Monge solutions.
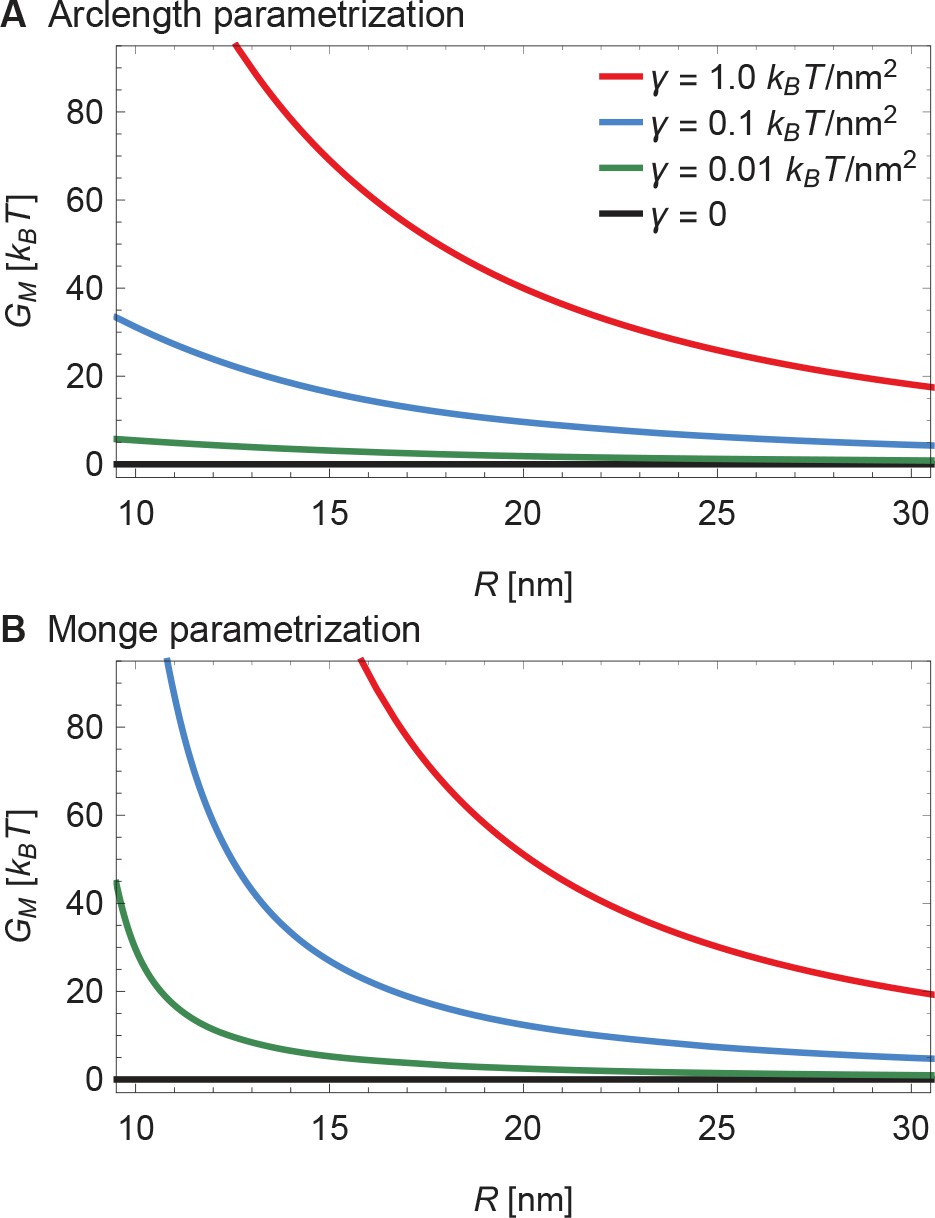
Energy cost of Piezo’s membrane footprint as a function of the radius of curvature of the Piezo dome calculated numerically using the arclength parametrization of Equation A1 (see Appendix 1-section 2) [] and analytically using the Monge parametrization of Equation A1 (see Appendix 1-section 1) [] (upper panels), and corresponding relative difference of the analytical and numerical solutions (lower panels), for (A) infinite and (B) finite membrane compartments. We set and 2 (Guo and MacKinnon, 2017), and used the indicated values of the membrane tension. For (B) we used an unconstrained membrane arclength separating the boundary of the Piezo dome and the boundary of the membrane compartment along the membrane in the radial direction. For ease of visualization, we shifted the curves corresponding to by in the upper panel of (B).
Appendix 1—figure 3
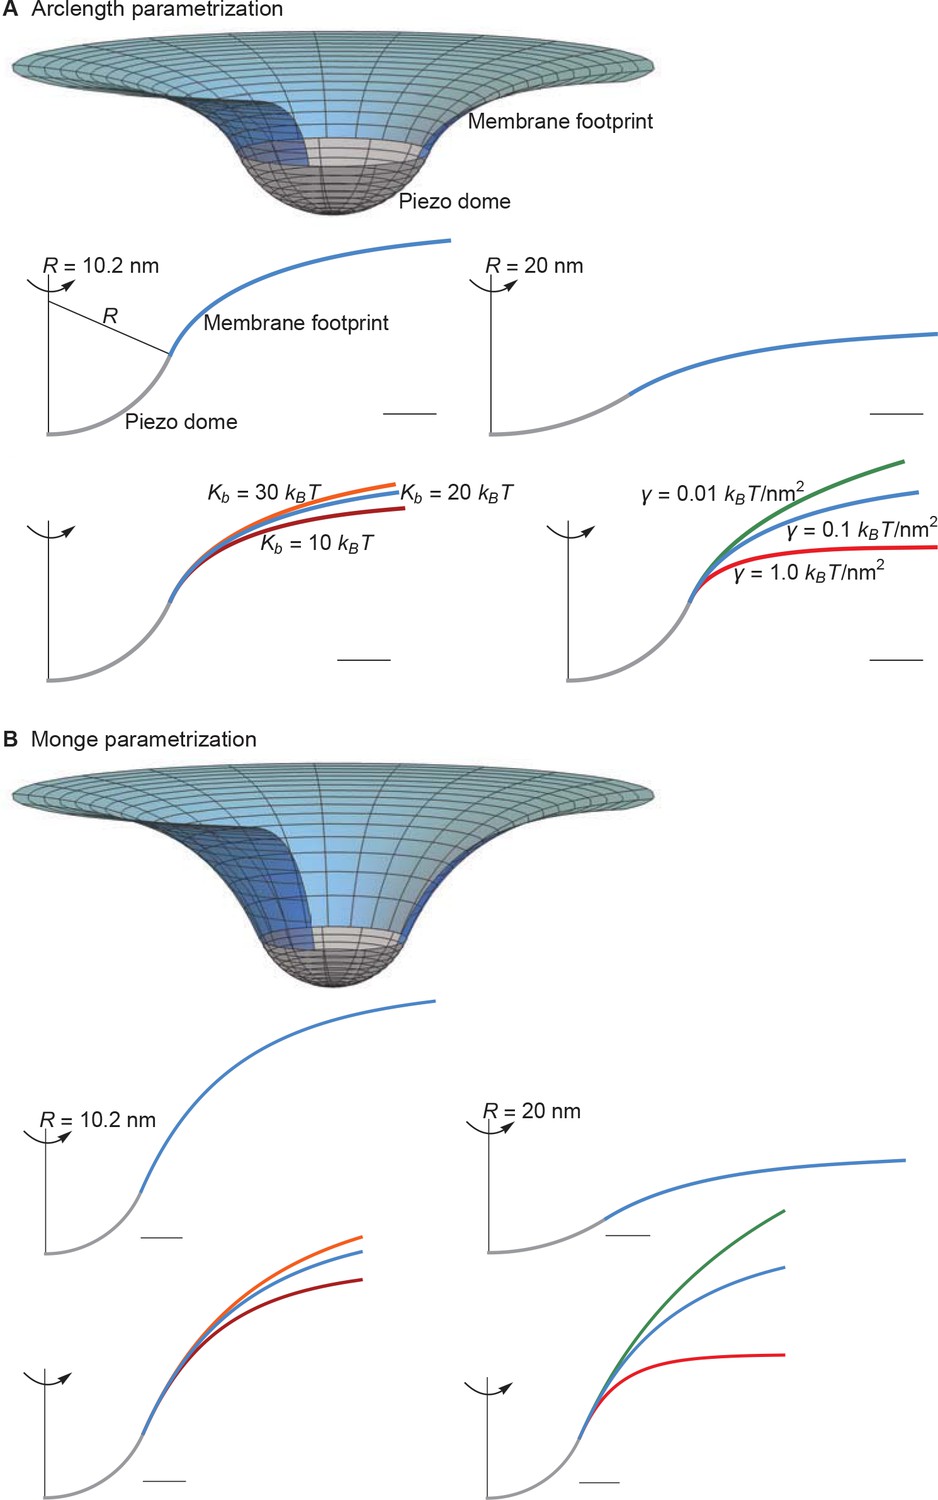
Supplement to membrane footprint of the Piezo dome.
(A) Same plots as in Figures 1C and 2 of the main text, with the membrane footprints calculated numerically using the arclength parametrization of Equation A1 (see Appendix 1-section 2) and (B) corresponding results with the membrane footprints calculated analytically using the Monge parametrization of Equation A1 (see Appendix 1-section 1). We use the same labeling conventions for (A) and (B). Scale bars, 4 . See Figures 1C and 2 of the main text for further details.
Appendix 1—figure 4
Supplement to energy of the Piezo membrane footprint.
(A) Same plots as in Figure 3A of the main text, with calculated numerically using the arclength parametrization of Equation A1 (see Appendix 1-section 2) and (B) corresponding results with calculated analytically using the Monge parametrization of Equation A1 (see Appendix 1-section 1). We use the same labeling conventions for (A) and (B). See Figure 3A of the main text for further details.
Appendix 1—figure 5
Supplement to energy of Piezo gating.
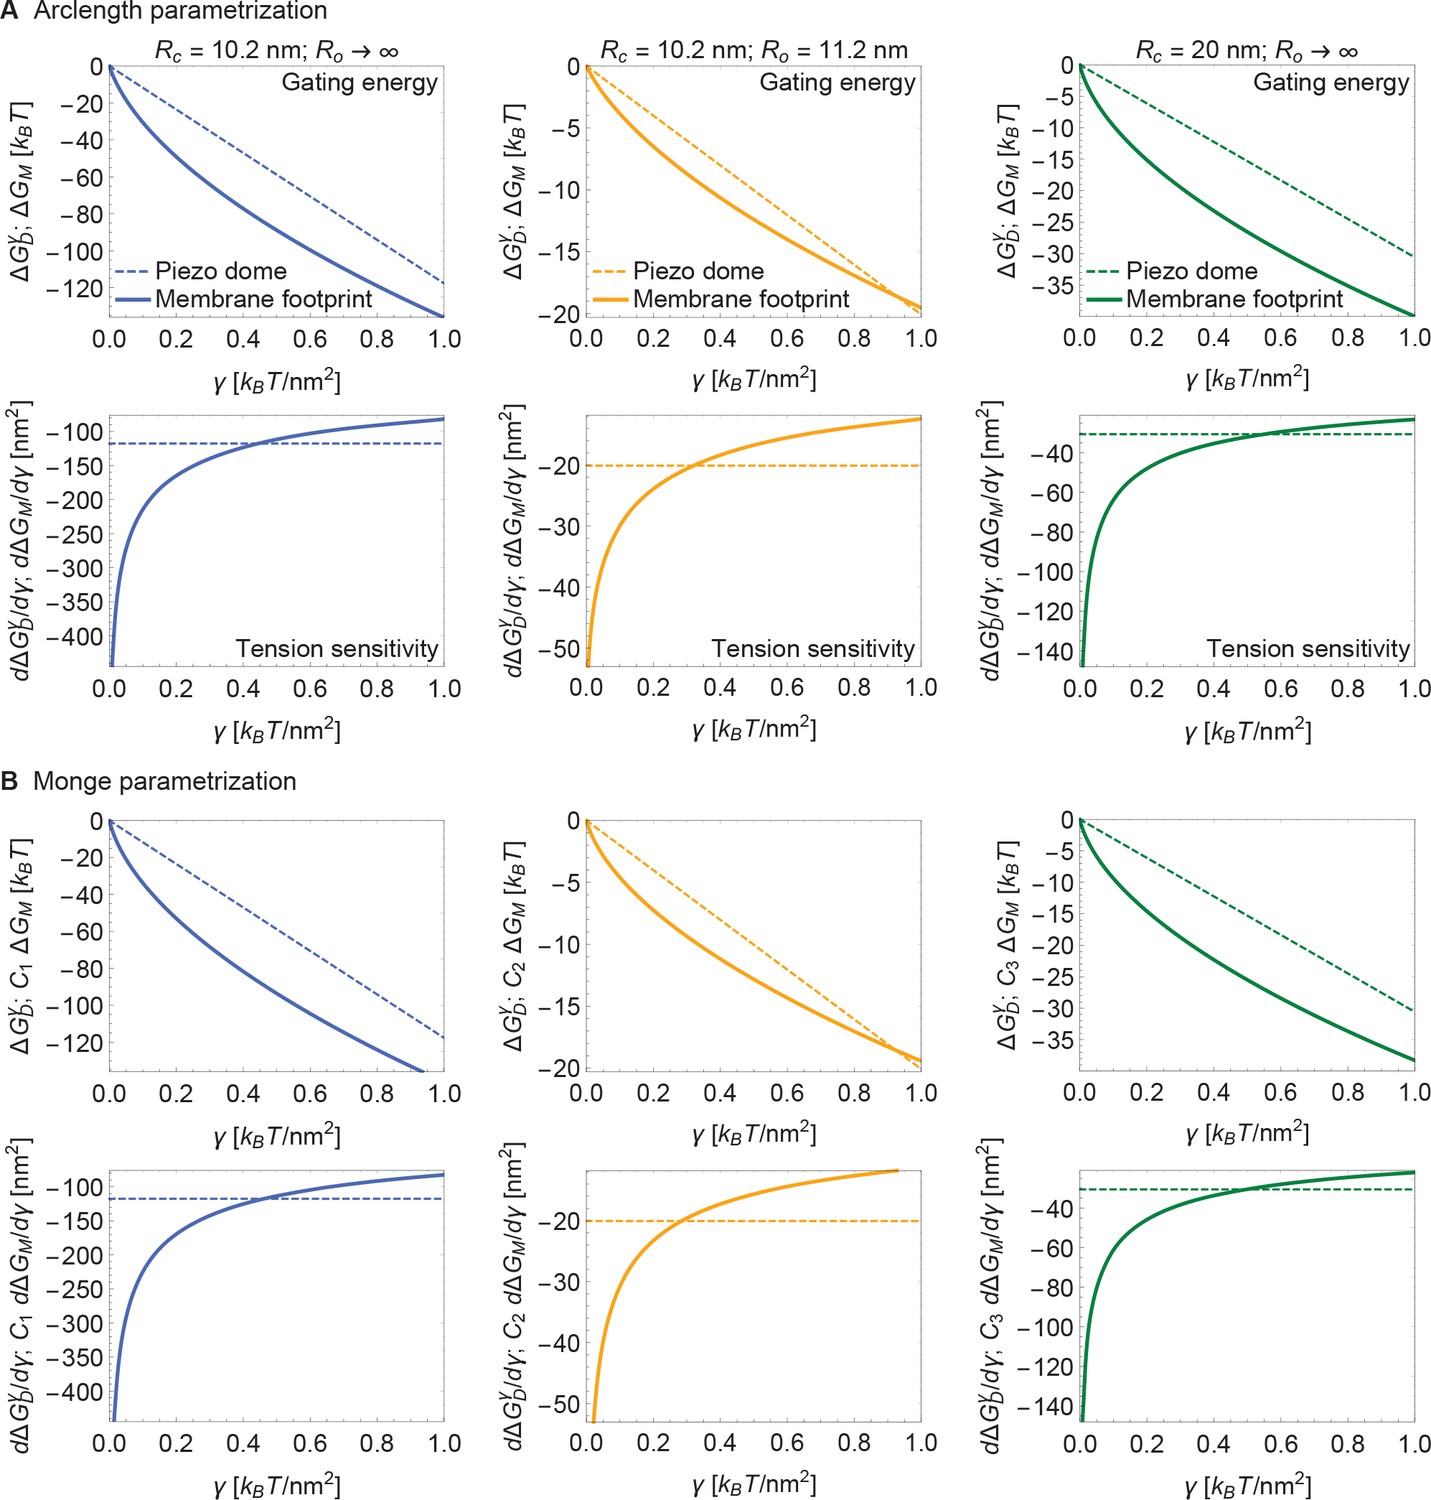
(A) Same plots as in Figure 4 of the main text, with calculated numerically using the arclength parametrization of Equation A1 (see Appendix 1-section 2) and (B) corresponding results with calculated analytically using the Monge parametrization of Equation A1 (see Appendix 1-section 1). We use the same labeling conventions for (A) and (B). For ease of visualization, we rescaled by , , or in (B) (left to right panels). See Figure 4 of the main text for further details.
Appendix 1—figure 6
Supplement to Piezo activation through membrane tension.
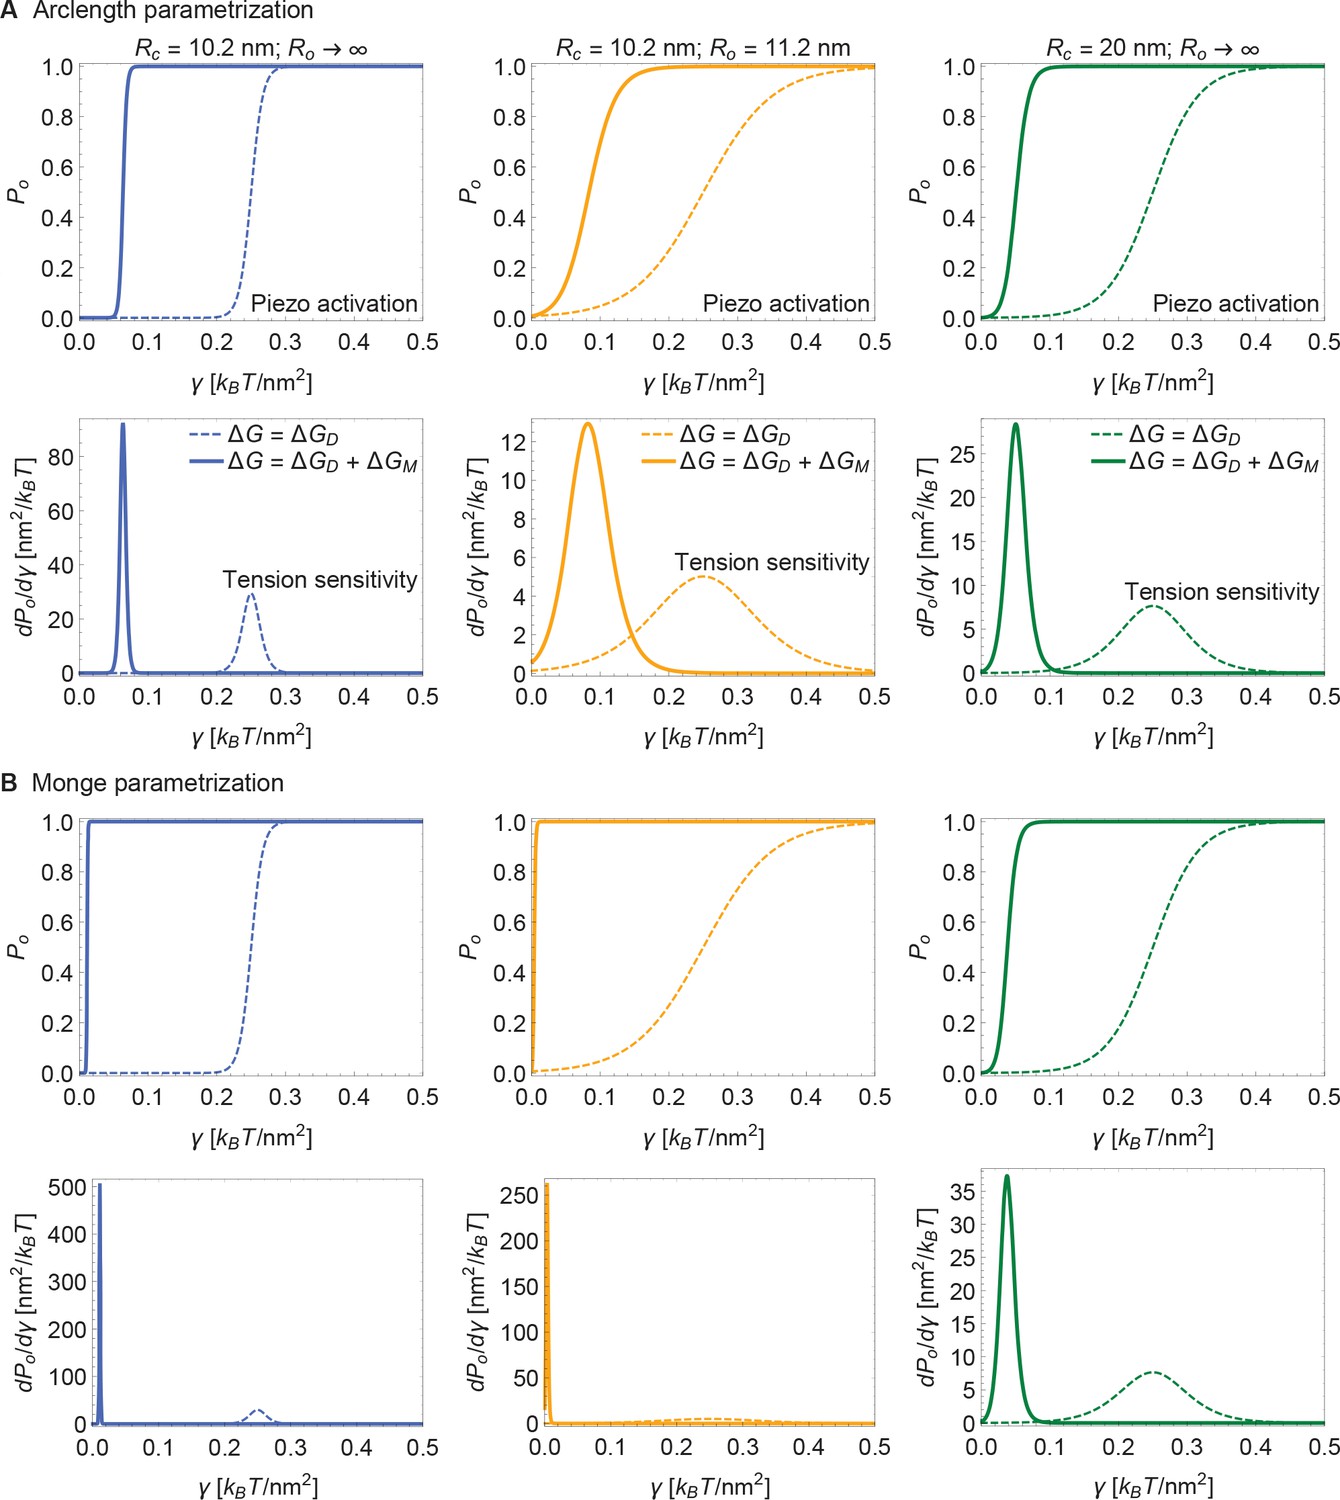
(A) Same plots as in Figure 5 of the main text, with calculated numerically using the arclength parametrization of Equation A1 (see Appendix 1-section 2) and (B) corresponding results with calculated analytically using the Monge parametrization of Equation A1 (see Appendix 1-section 1). We employed the same values of , and use the same labeling conventions, for (A) and (B). See Figure 5 of the main text for further details.
Appendix 1—figure 7
Supplement to modulation of Piezo gating through the membrane.
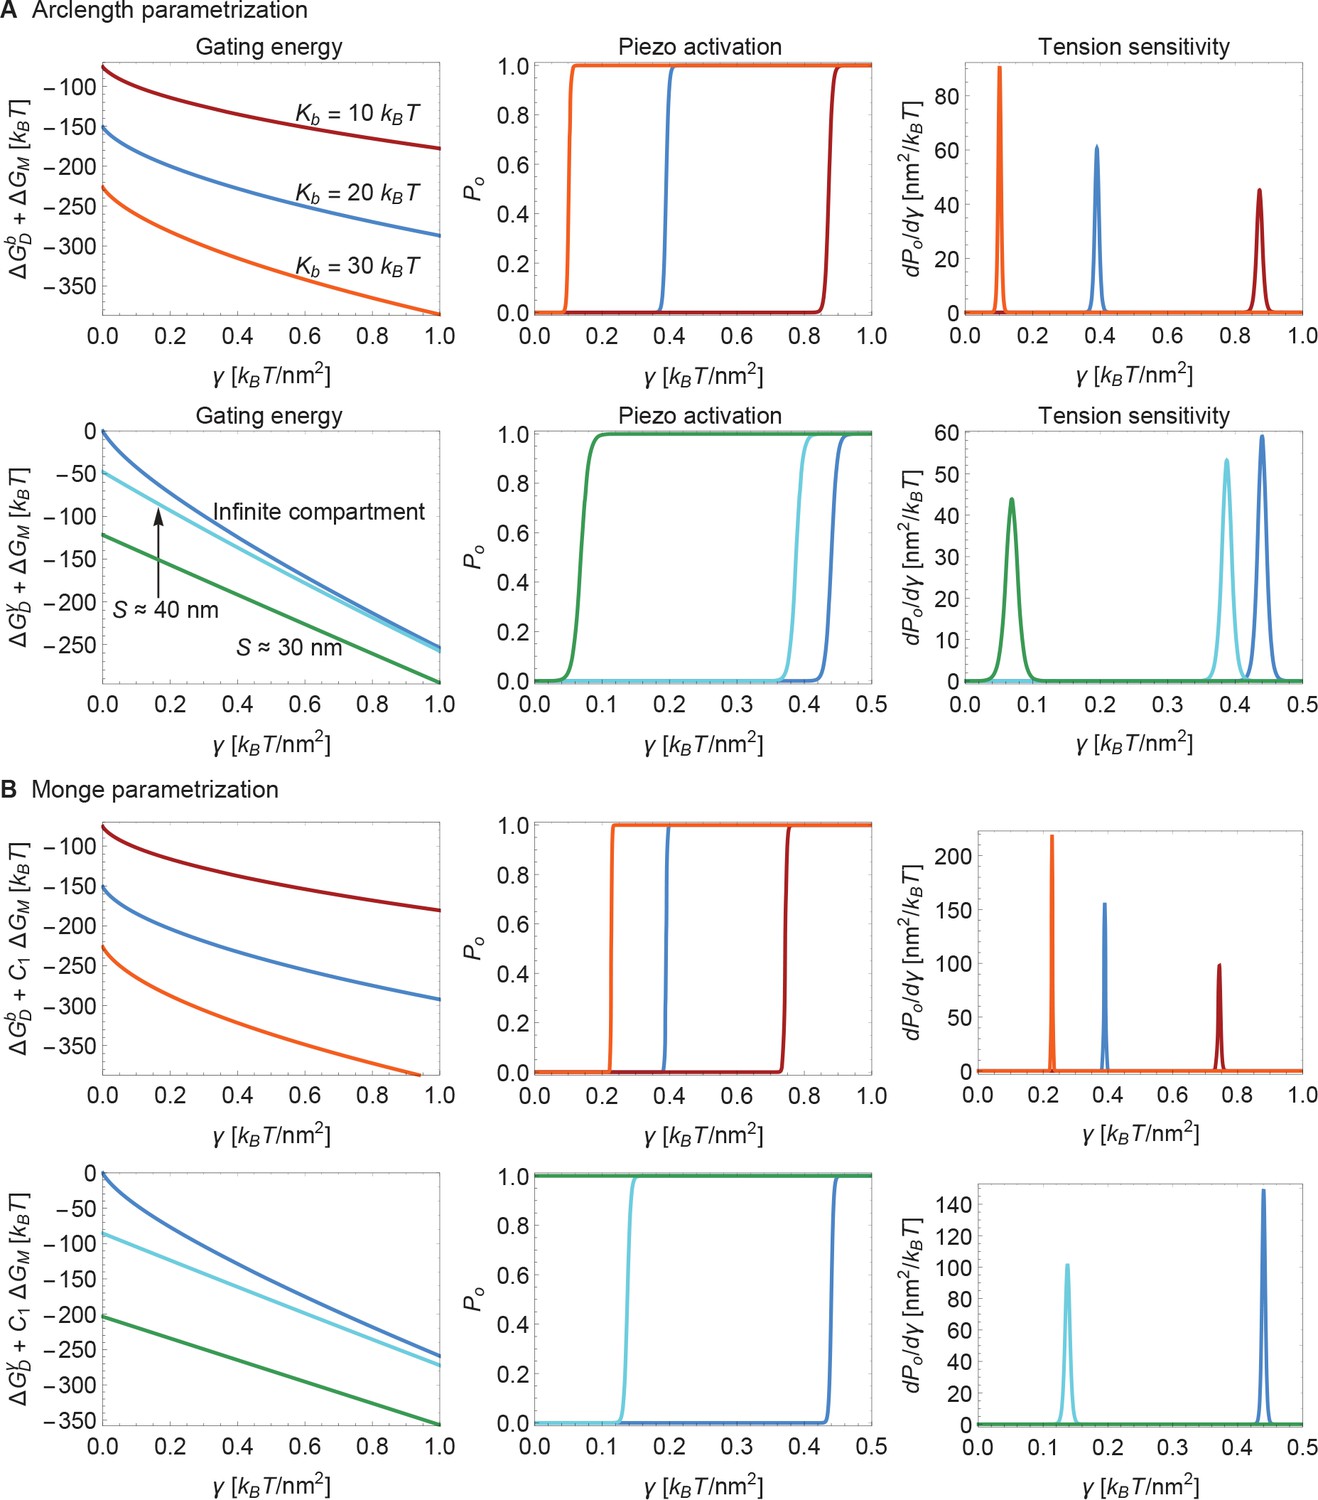
(A) Same plots as in Figure 6 of the main text, with calculated numerically using the arclength parametrization of Equation A1 (see Appendix 1-section 2) and (B) corresponding results with calculated analytically using the Monge parametrization of Equation A1 (see Appendix 1-section 1). We use the same labeling conventions for (A) and (B). For ease of visualization, we rescaled by in the left panels of (B). For (B) we set (upper middle and upper right panels) and (lower middle and lower right panels) for the (unknown) contribution of the protein energy to the Piezo gating energy such that gating occurs within the indicated tension ranges. See Figure 6 of the main text for further details.
Additional files
-
Transparent reporting form
- https://doi.org/10.7554/eLife.41968.008
Download links
A two-part list of links to download the article, or parts of the article, in various formats.
Downloads (link to download the article as PDF)
Open citations (links to open the citations from this article in various online reference manager services)
Cite this article (links to download the citations from this article in formats compatible with various reference manager tools)
Piezo’s membrane footprint and its contribution to mechanosensitivity
eLife 7:e41968.
https://doi.org/10.7554/eLife.41968


