Dynamic neuromuscular remodeling precedes motor-unit loss in a mouse model of ALS
- Université de Montréal, Canada
- Centre de recherche du Centre Hospitalier de l'Université de Montréal, Canada
Figures
Figure 1 with 1 supplement
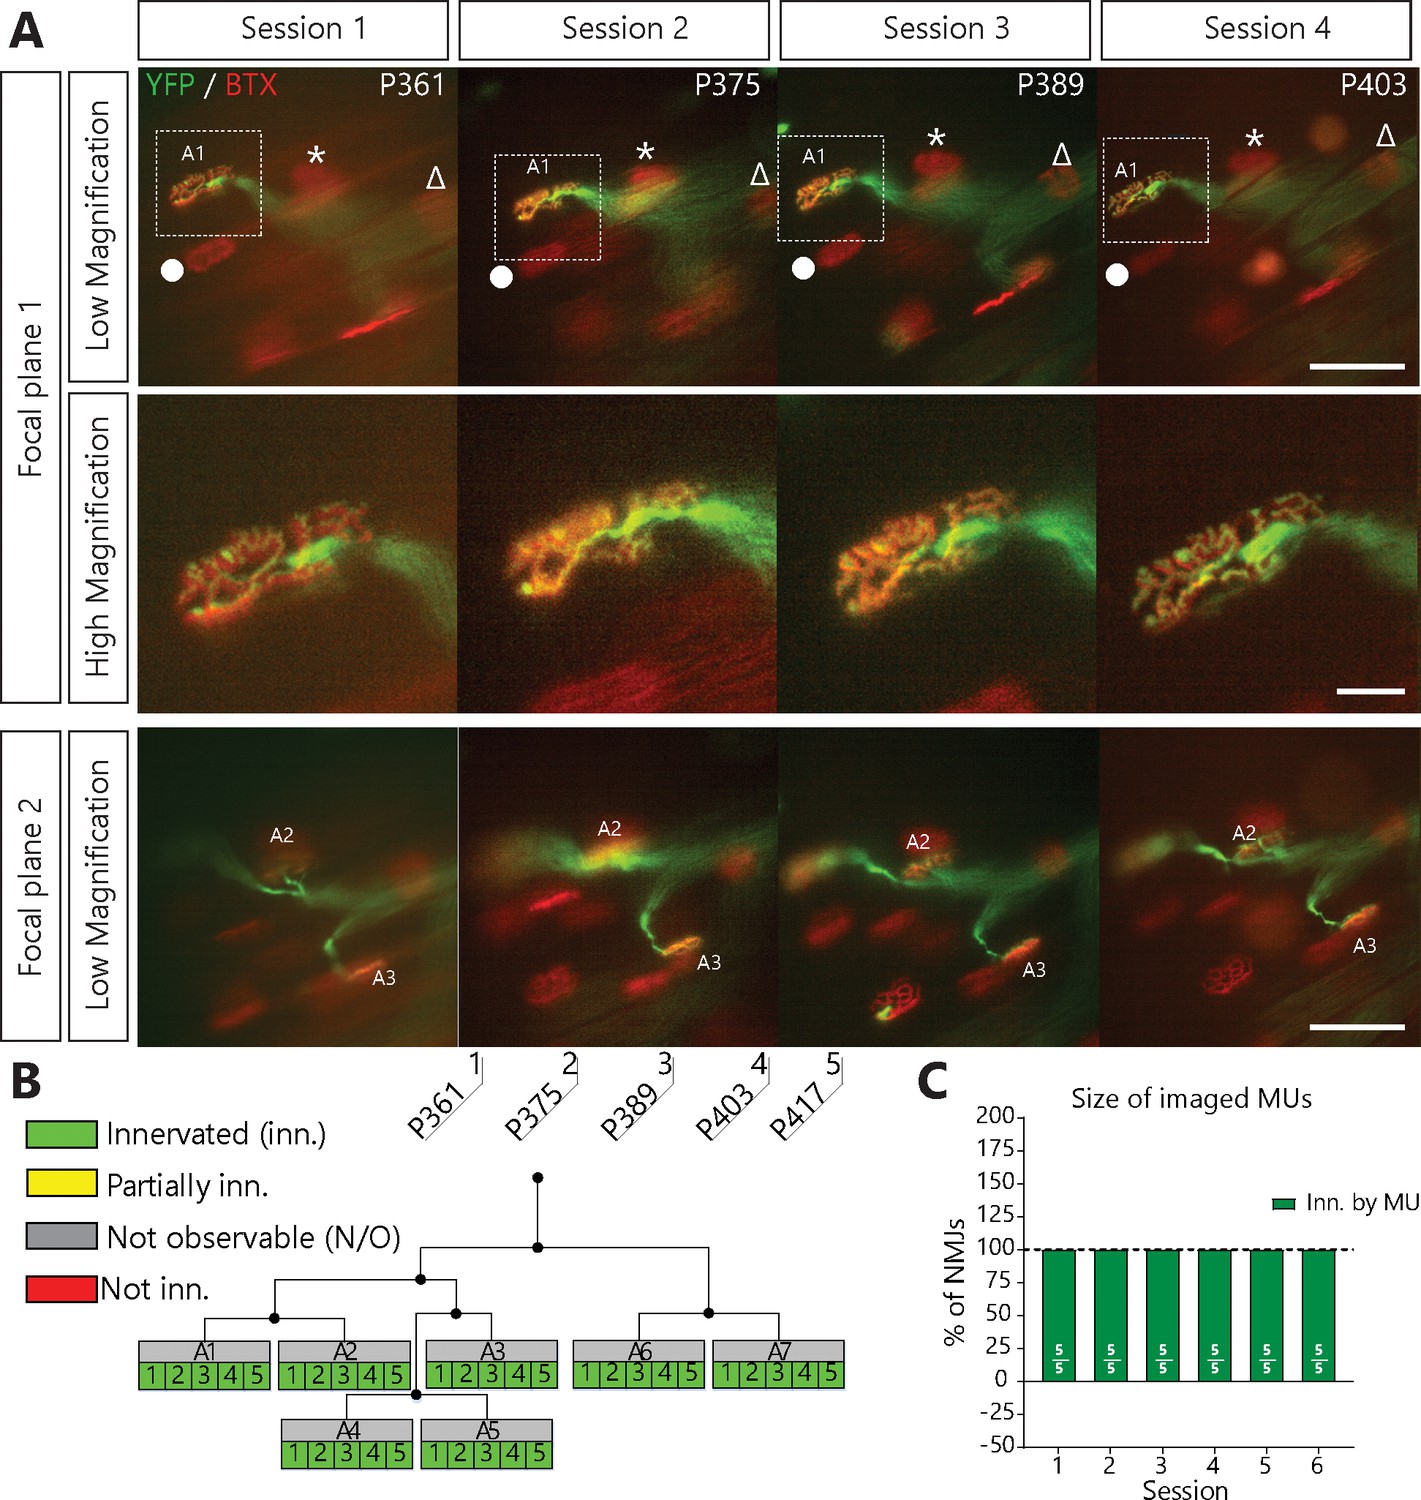
NMJs in a single motor-unit of WT/YFP mice are stable.
(A) Images at different focal planes of the same MU arbor from a WT/YFP mice during four sessions, with a higher magnification on-focus image of one NMJ (digital zoom, dashed box in low magnification). Green: YFP-labeled axon; Red: nAChR. Symbols (Δ, *, ●) identify landmarks used to confirm that the same region was imaged. (B) MU dynamic diagram of the MU shown in (A) showing that all NMJs within that motor arbor are stable in WT/YFP mice. Black lines and dots represent the axonal arborization and branching points respectively, while each box represents a single NMJ. (C) Histogram showing the average proportion of NMJs which are innervated (green) by the MU, showing that all MU preserved their NMJs in WT/YFP mice. Individual results for all MUs from WT mice (N = 5), including graphical representations, are included in Figure 1—source data 1. Details on how NMJs were classified, with representative examples, are presented in Figure 1—figure supplement 1. Scale bar, low magnification: 100 μm; high magnification: 25 μm.
-
Figure 1—source data 1
Spreadsheet for the innervation status of all NMJs in each MU arbor imaged in WT/YFP mice and individual graphical representations.
In the spreadsheet, a value of ‘1’ represents an NMJ fully innervated by the MU while a value of ‘x’ represents an NMJ which could not be fully resolved on that session. The global percentages for each MU are included below each table with individual histograms for each MU. The histograms are also compiled in the PDF file.
- https://doi.org/10.7554/eLife.41973.005
Figure 1—figure supplement 1

Classification of NMJs within single MUs.
Representative examples of the initial and subsequent observation of NMJs classified as completely innervated (inn.) (A) or partially innervated (B) repaired (C) re-innervated (partially or completely) by the MU (D) as a complete (E) or a partial (F) MU expansion or finally as lost by the MU (G) (Green: YFP-labeled axon; Red: nAChR). For each example, the MU dynamic diagram and the color- and pattern-coded classification for the supplementary and main figures (simplified) is shown. Arrowheads in (C) indicate the postsynaptic site which re-innervated, the arrow in (D) (3) shows that a small part of the endplate re-innervated and big arrows in (E) represent newly innervated NMJ (expansion). Note that the NMJ presented in (D) is the same as the one presented in Figure 2A4. Scale Bar: 25 μm.
Figure 2 with 1 supplement

Single motor-unit degeneration is initially asynchronous and can last for several weeks in SOD1G37R/YFP mice.
(A) Images at two different focal planes of the same MU arbor during four imaging sessions (1, 2, 3 and 5), with on-focus images at higher magnification of some NMJs (digital zoom, dashed boxes in low magnification). Green: YFP-labeled axon; Red: nAChR. Of note, A4 eventually gets partially re-innervated (inset, arrowhead, autologous reinnervation). (B) MU dynamic diagram showing that NMJs within this motor axon branch were lost asynchronously over imaging sessions. (C) Histogram showing the proportion of NMJs which are innervated (dark green), re-innervated (purple), not observable (gray) or lost (red) by the MU in A. (#): Number of NMJs observed in the MU arbor. Control experiments demonstrating that the SOD1G37R/YFP mice progress identically to SOD1G37R mice and that YFP expression does not exacerbate or affect motor neuron death are presented in Figure 2—figure supplement 1. Scale bar, low magnification: 100 μm; high magnification: 25 μm.
Figure 2—figure supplement 1
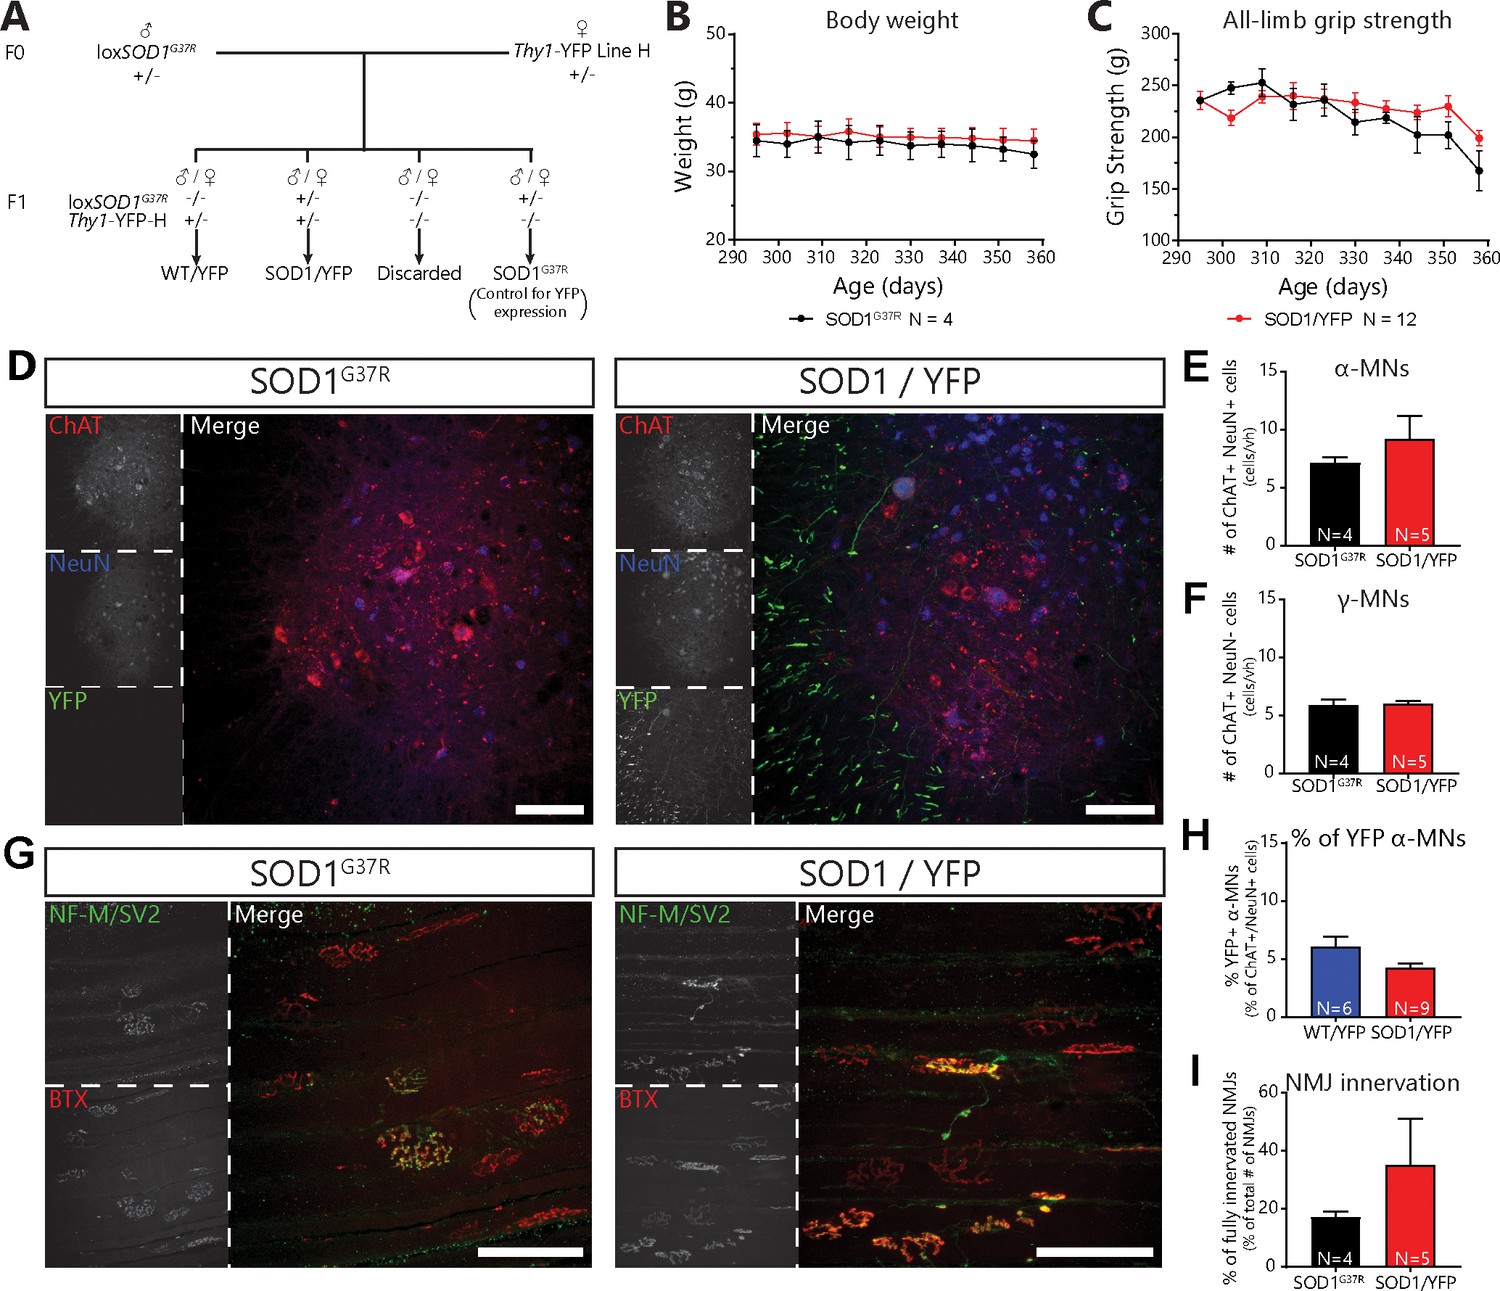
Mating of floxSOD1G37R to thy1-YFP-H mice did not alter disease course or mutant SOD1 levels.
(A) Mating scheme for SOD1G37R/YFP and WT/YFP mice. (B) Body weight curve of SOD1G37R and SOD1G37R/YFP mice (black and red, respectively), showing a similar weight between both groups (repeated measures two-way ANOVA; Effect of genotype: p=0.7059; Effect of time: p=0.1237; Interaction: p=0.8874). (C) All-limb grip strength curve of SOD1G37R and SOD1G37R/YFP mice (black and red respectively), showing a parallel grip strength loss between both groups (repeated measure two-way ANOVA; Effect of genotype: p=0.3186; Effect of time: p<0.0001; Interaction: p=0.2189). (D) Representative example of lumbar spinal cord sections from SOD1G37R (left) and SOD1G37R/YFP (right) mice at P360 (Red: ChAT; Blue: NeuN; Green: YFP). Note the presence of YFP-positive neuronal cell bodies and projecting axons (in the white matter) in SOD1G37R/YFP mice. (E) (F) Quantification of the number of α-MNs (E) ChAT + NeuN + cells) and γ-MNs (F) ChAT + NeuN cells) per ventral horn at P360, showing that SOD1G37R/YFP and SOD1G37R mice had similar levels of α-MN loss (unpaired t-test; p=0.3648) and that γ-MNs were unaffected (unpaired t-test; p=0.8624). (H) Percentage of YFP-expressing α-MNs in WT/YFP and SOD1G37R/YFP mice, illustrating that, although the proportion of YFP-expressing MNs tended to be lower in SOD1 G37R /YFP mice, the difference was not statistically significant (Mann-Withney test; p=0.1447). (G) Representative images of NMJs in the Tibialis anterior muscle of SOD1G37R (left) and SOD1G37R/YFP mice (right) at P360 (Red: α-BTX; Green: NF-M and SV2). (I) Quantification of the percentage of fully innervated NMJs in the Tibialis anterior at P360, demonstrating that SOD1G37R/YFP and SOD1G37R mice had similar levels of denervation (GLM effect of genotype: p=0.214; post-test; p=0.316). The number of replicates for each experiment are indicated in the figure directly for clarity. Animals were sex-matched and age-matched between groups for each experiment. Data presented as mean ± SEM. The raw values for graphs in panels (B) (C) (E) (F) (H) and (I) are presented in Figure 2- Supplement – Source data one with the full results of the statistical tests for (B) and (C). Scale bars: 100 µm.
-
Figure 2—figure supplement 1—source data 1
Raw values of body weight, grip strength, α- and γ-motor neuron counts, percentages of YFP-expression motor neurons and NMJ innervation as depicted in Figure 2—figure supplement 1B,C,E,F,H and I, respectively.
Values in the motor neuron counts table represent the average number of motor neurons per ventral horn counted from 15 to 20 lumbar spinal cord sections. Values in the NMJ innervation table represent the number of completely denervated, partially denervated and fully innervated NMJs, as well as the number of denervated NMJs (partial + complete) and the total number of NMJs (complete + partial + innervated).
- https://doi.org/10.7554/eLife.41973.008
Figure 3 with 1 supplement
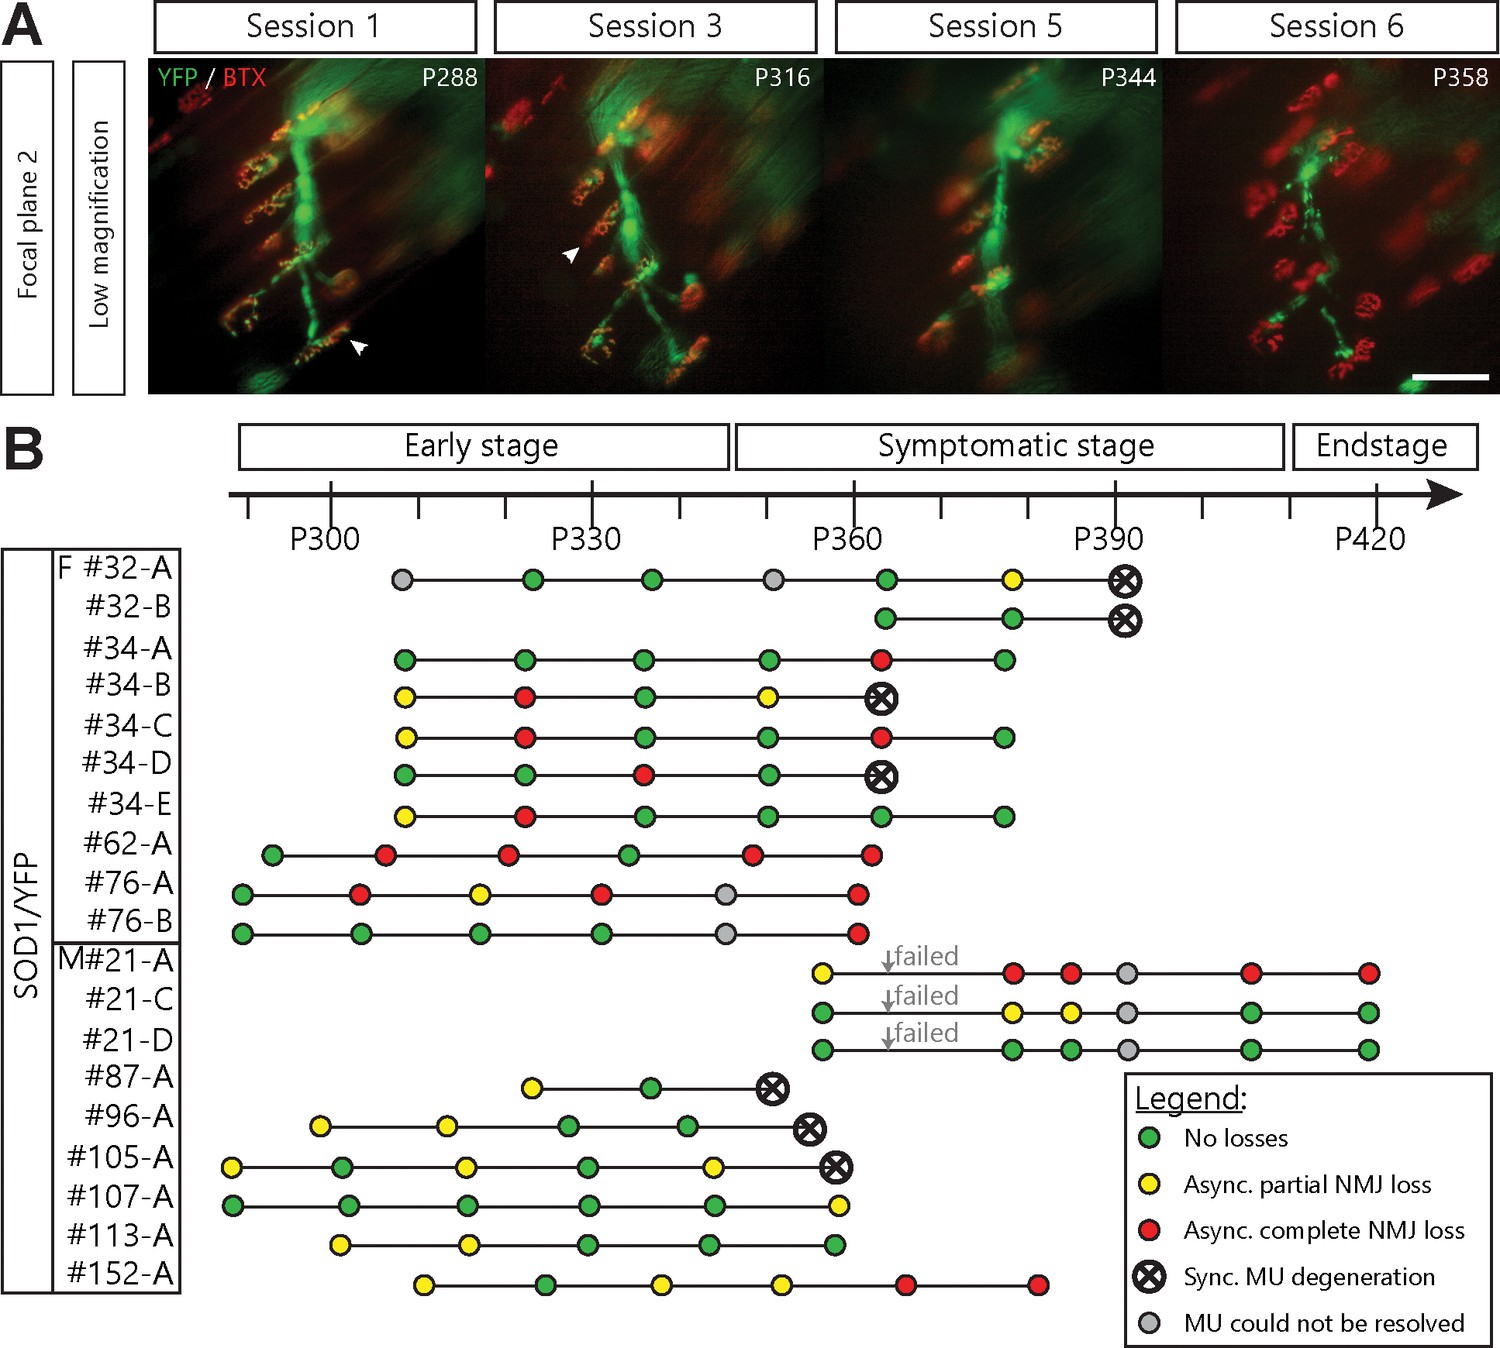
Asynchronous branch-specific dismantlement precedes synchronous motor-unit degeneration in SOD1G37R/YFP mice.
(A) Example of another MU arbor showing two partially innervated NMJs (arrowheads) on session 1 and 2, before the whole motor axon degenerated on session 6. Note the presence of YFP fragments along the axonal tract. (B) Time course of repeated in vivo imaging in SOD1G37R/YFP mice showing sessions where no losses, at least one partial NMJ loss, at least one complete NMJ loss or synchronous MU degeneration were observed (green, yellow, red and black dots, respectively). Gray dots represent session where the MU could not be resolved while ‘Failed’ identifies session terminated for animal care reasons. Notice how synchronous global MU degenerations were almost always preceded by weeks of asynchronous branch-specific changes, even at later stages of the disease. The distribution of surface muscle fiber types (MU types) is presented in Figure 3—figure supplement 1, showing that these different patterns of degeneration are unlikely due to differences in MU types.
Figure 3—figure supplement 1
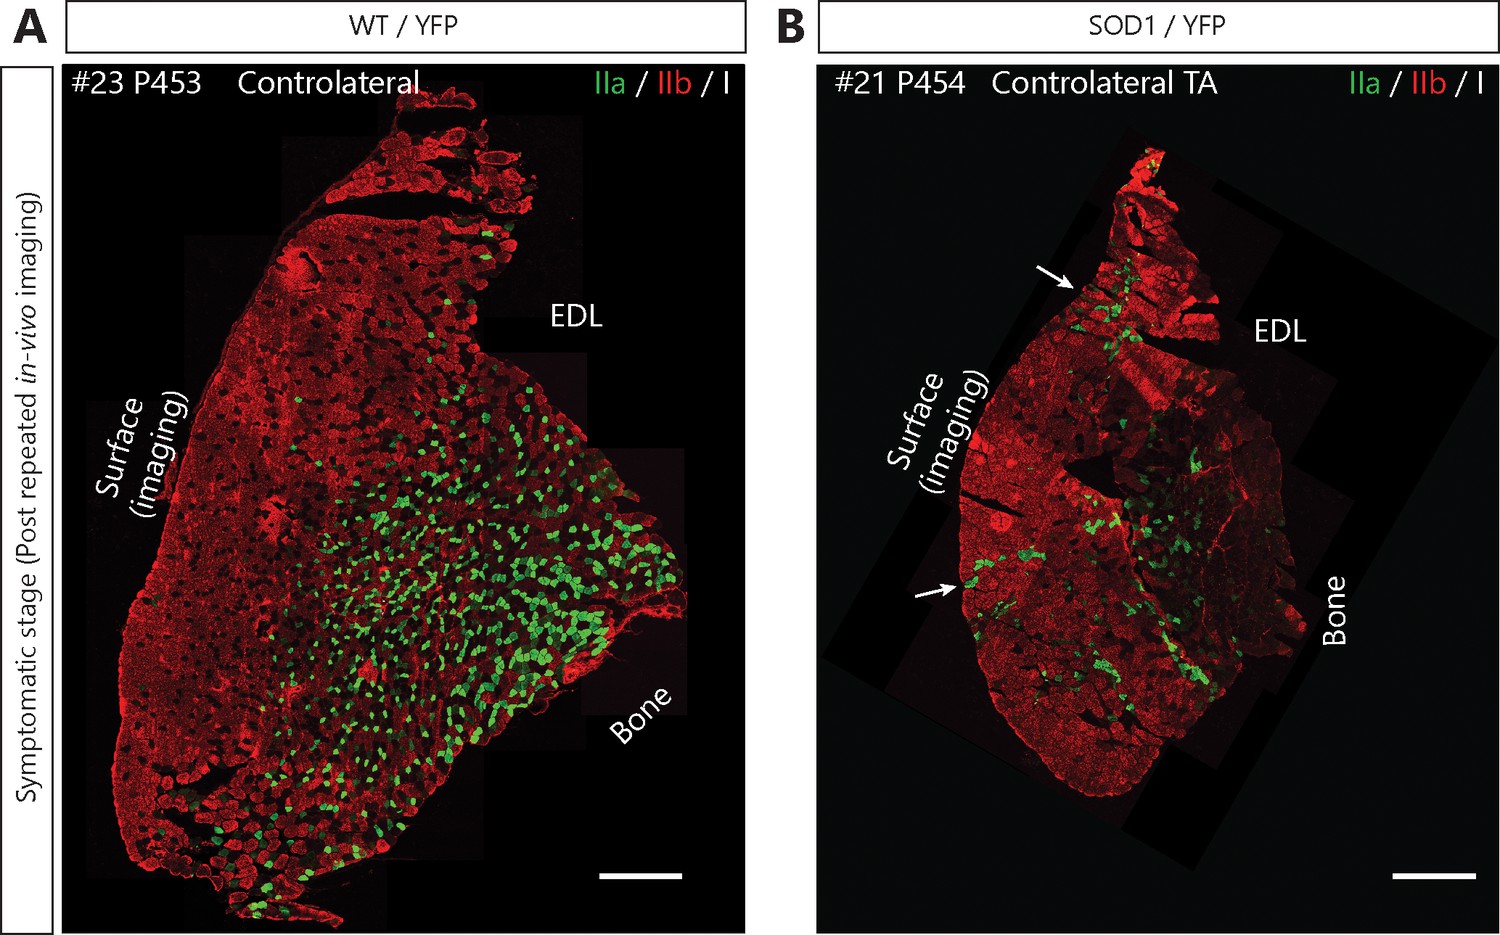
Motor-units are mainly fast-fatigable on the surface of the Tibialis anterior in SOD1G37R/YFP mice.
Fiber type composition of TA muscles from WT/YFP (A) and SOD1G37R/YFP (B) after repeated in vivo imaging (symptomatic stage, contralateral TA). Muscle cross-sections were stained with antibodies against myosin heavy-chain type I (white), type IIa (green) and type IIb (red). Note that the vast majority of fibers near the surface are type IIb or IIx (unlabeled) fibers in WT/YFP (3/3 animals) and SOD1G37R mice (5/5 animals). Also, note the presence of a few type IIa fiber groupings near the surface (arrows) in SOD1G37R/YFP mice (4/5 animals). Hence, no slow MUs could have been imaged in SOD1G37R/YFP mice and the probability of imaging a fast-fatigue-resistant MU is very low. Scale bar: 500 μm.
Figure 4 with 2 supplements
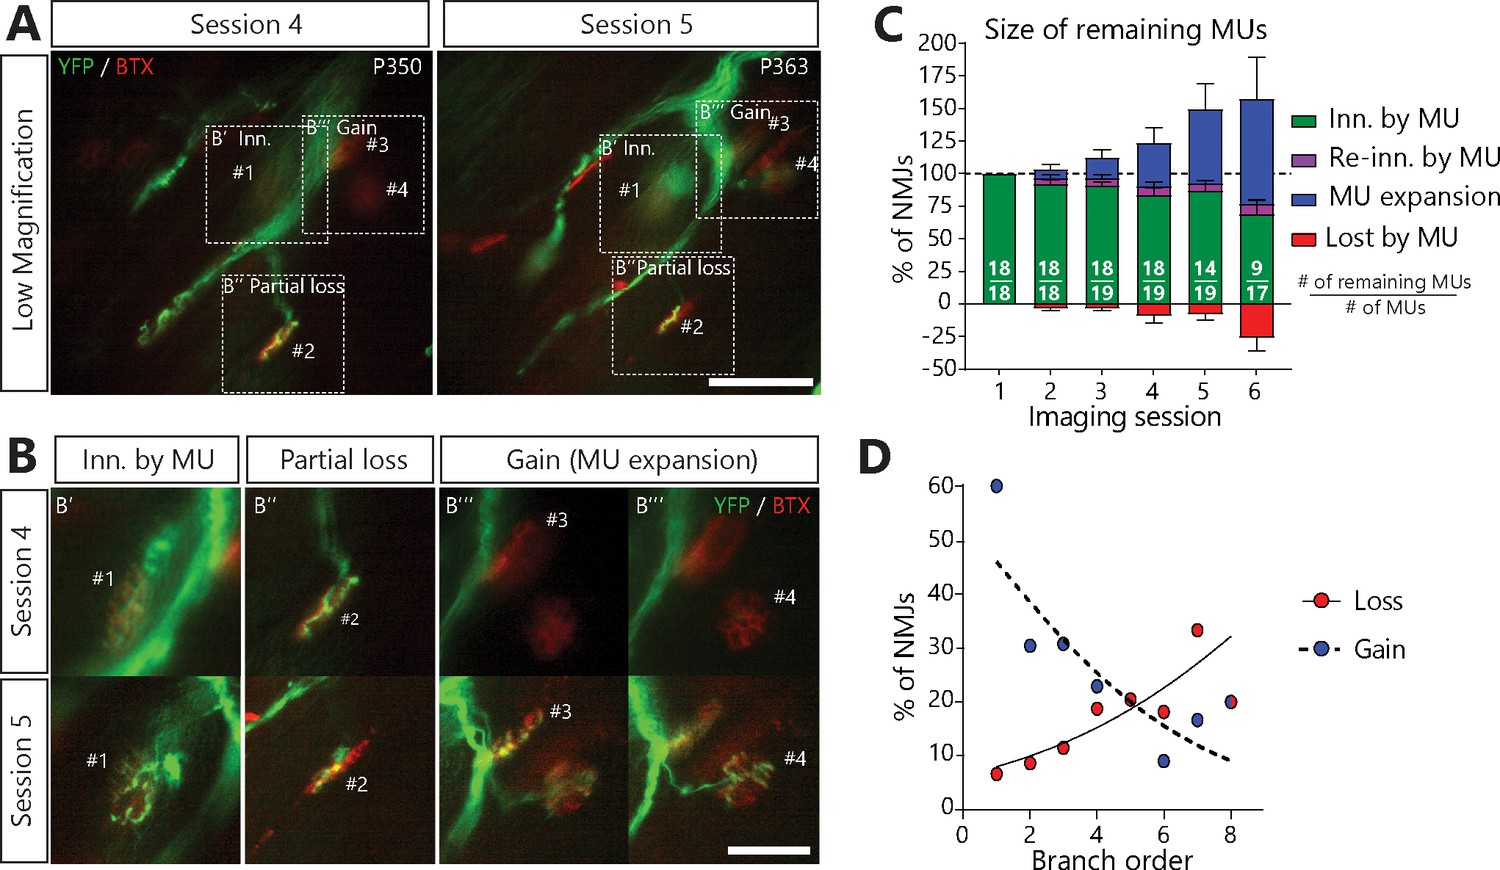
MUs retracted and expanded constantly during disease progression in SOD1G37R/YFP mice.
(A) (B) Images of a MU branch on two sessions (A) with on-focus high-magnification images of 4 NMJs (B) (dashed boxes in A), where one NMJ remained innervated (#1, B’), one was partially lost (#2, B’’) and two others were newly innervated by this MU through axonal sprouting (#3 and #4, B’’’; heterologous reinnervation) (Green: YFP-labeled axon; Red: nAChR). (C) Histogram showing the average proportion of NMJs from the initial pool which are innervated (green), re-innervated (purple, ‘autologous reinnervation’) or lost (red) by the MU and the proportion which are gained through expansions (blue, ‘heterologous reinnervation’). Note that the overall size of MUs increased over time despite the loss of NMJs from their initial pool. Numbers in brackets represent the number of remaining MU arbors over the total number of MU arbors observed (N = 11). Figure 4—figure supplement 1 illustrates how these opposing changes could alternate within the same MU over time. Controls showing that heterologous reinnervation (MU expansions) occurs on NMJs lost by the imaged MU are presented in Figure 4—figure supplement 2. (D) Correlation between MU expansions (blue) or asynchronous complete NMJ losses (red) and their branch order (n = 253; 19 arbors; N = 11) showing the inverse relationship between the propensity of axonal branches to expand (logistic regression, p=0.001) or to be lost (logistic regression, p=0.010). Each dot represents a data point while the solid and the dotted lines represent the logistic regression curves. Individual results for all MUs from SOD1 mice (N = 11), including graphical representations, are included in Figure 4—source data 1. The raw values for the graph in panel (D) are presented in Figure 4—source data 2. Data are presented as mean ± SEM. Scale bar, low magnification: 100 μm; high magnification: 25 μm.
-
Figure 4—source data 1
Spreadsheet for the innervation status of all NMJs in each MU arbor imaged in SOD1/YFP mice and individual graphical representations.
In the spreadsheet values of ‘1’, ‘0.5’ and ‘0’ represent an NMJ which is fully innervated, partially innervated or not innervated by the imaged MU. A value of ‘x’ represents an NMJ which could not be fully resolved on that session. The change relative to last session (delta) and the classification of the NMJ (repair, reinnervated or new) of each NMJ as well as the global percentages for each MU and individual histograms for each MU are presented below the innervation status of each NMJ. The data is split between three tabs: the females, the males and the compilation, which contains the individual data points for the histogram in Figure 4C. The histograms are also compiled in the PDF file.
- https://doi.org/10.7554/eLife.41973.015
-
Figure 4—source data 2
Spreadsheet including the number and the percentage of lost and gained NMJs as a function of their branch order.
This data is presented in the histogram in Figure 3D.
- https://doi.org/10.7554/eLife.41973.016
Figure 4—figure supplement 1
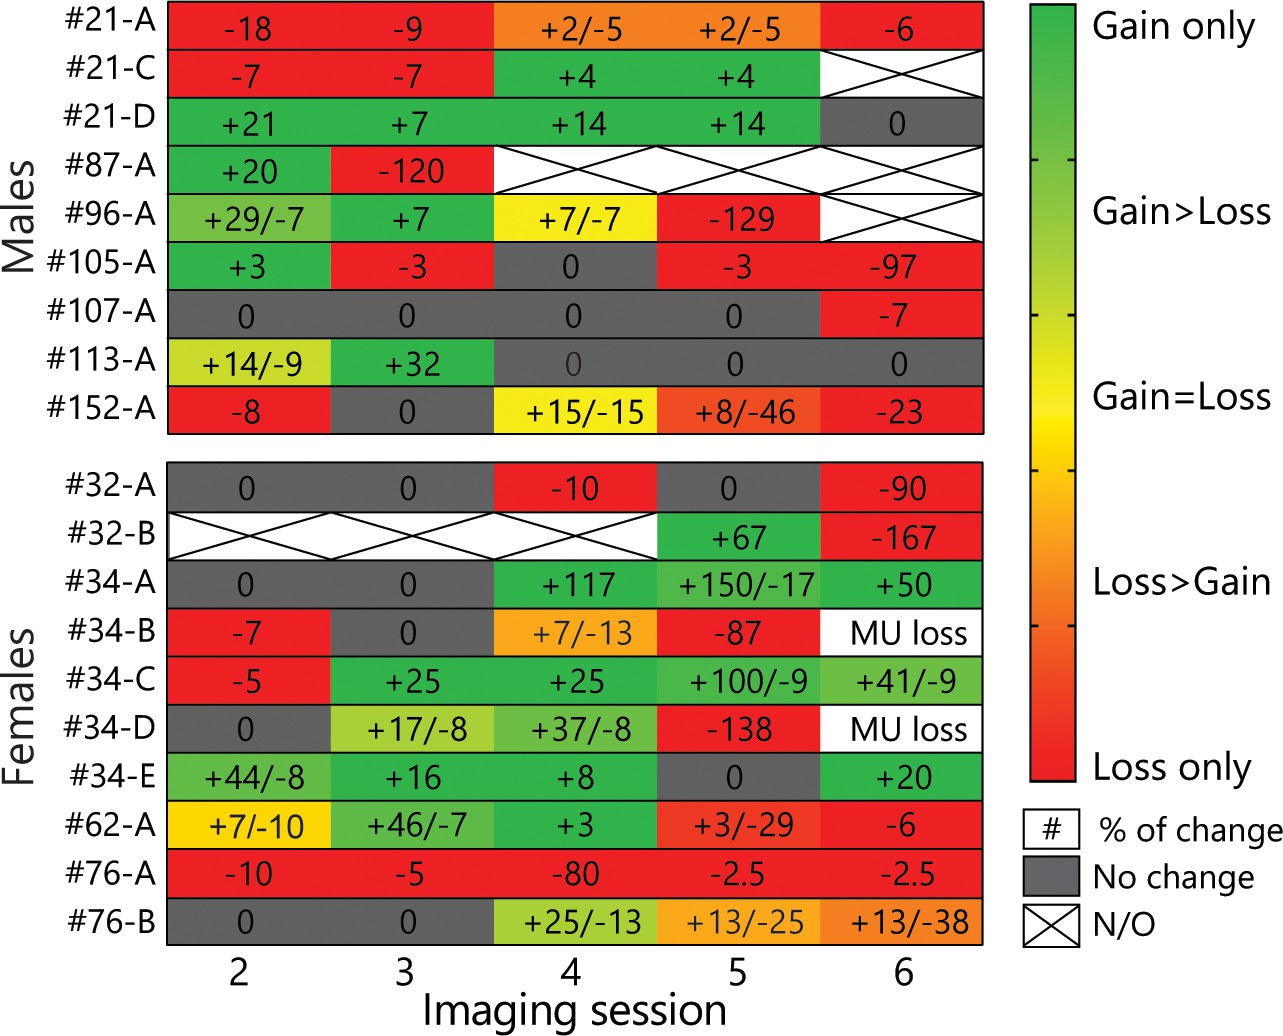
Heat-map of all MU changes across all sessions.
The green-red gradient represents the ratio of gains over losses, while the numbers indicate the % of gains/losses on a given session relative to the first session. Note that most MU underwent gains and losses, although mostly not simultaneously. The values for the heat-map are presented in Figure 4–figure supplement 1–source data 1.
-
Figure 4—figure supplement 1—source data 1
Percentage of change (gains, losses, total or delta) on each session relative to the first session.
This data was obtained from the data presented in Figure 4—source data 1.
- https://doi.org/10.7554/eLife.41973.014
Figure 4—figure supplement 2
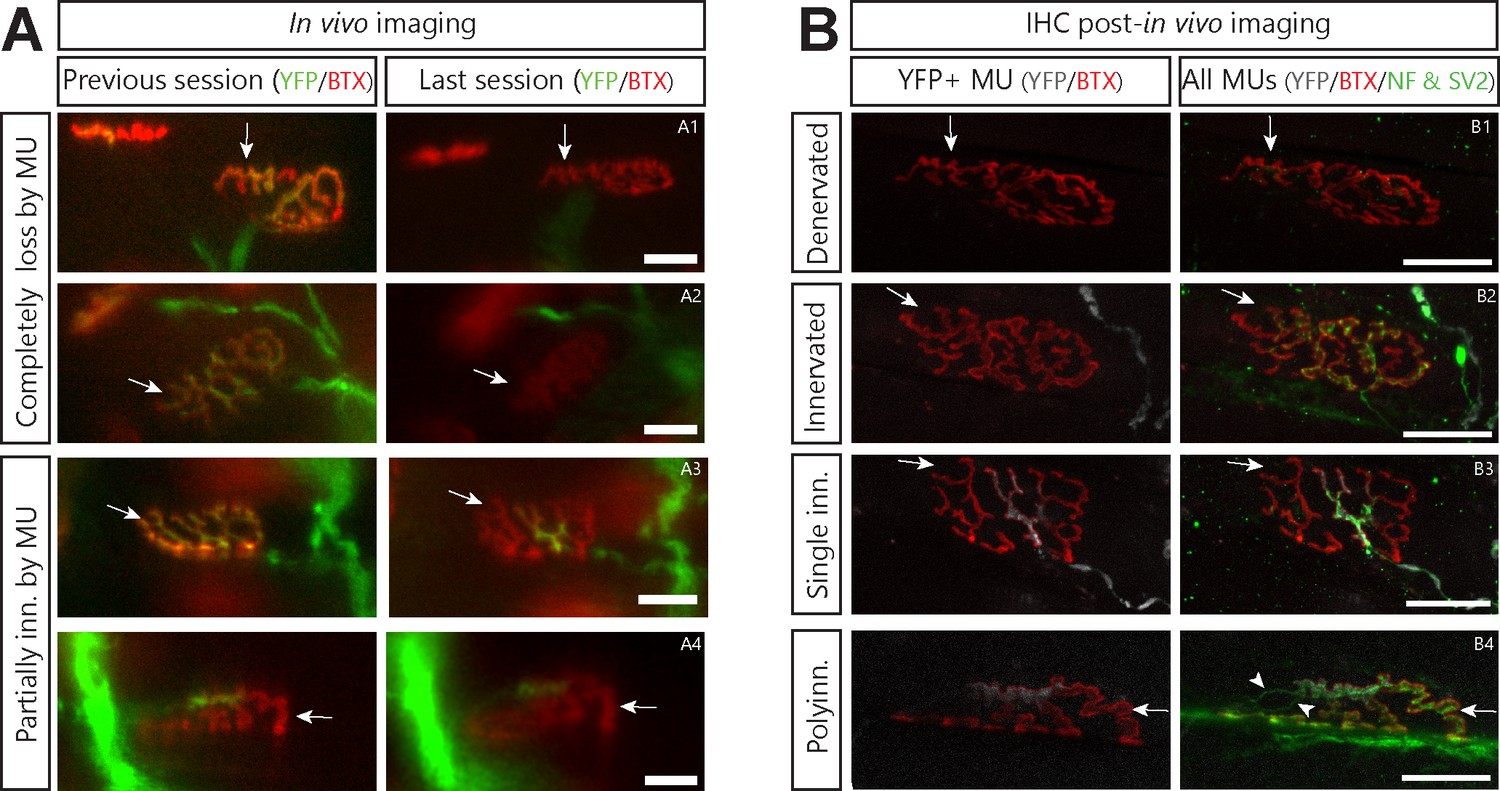
Asynchronously lost postsynaptic sites do not become refractory to other MUs.
(A) and (B) illustrate the same NMJ during in vivo and after IHC respectively. Arrows point to a distinctive landmark of postsynaptic area. (A). Examples of NMJs that were asynchronously lost by the imaged MU (A1 and A2), partially lost by the MU (A3) or partially innervated by the MU for several weeks (A4). Green: YFP-labeled axon; Red: nAChR labeled with BTX. Note the slight change in the appearance of A1 and A2 is due to a change in the imaging angle (tilting) due to variable leg placement. This is also notable by the apparent change in distance between the NMJ of interest and another nearby NMJ. (B). Confocal images of the same NMJs as in A after immunolabeling for the presynaptic markers NF-M and SV2. Note how vacated postsynaptic sites in A2 and A4 were innervated by another, YFP-negative, motor axon, while those in A1 and A3 were not. The stable partial innervation by the imaged MU in A4 was thus likely due to lasting polyinnervation (B4, arrowhead). Green: NF-M and SV2 (all MUs); Gray: YFP-labeled axon; Red: nAChR labeled with BTX. Note how distinctive parts of the ‘pretzel’ shape of postsynaptic receptors is identical between the in vivo the post-in vivo confocal image. Importantly, the main axonal branch visible in A4 is not visible in B4 as it was at a lower focal plane which was not included in the confocal stack shown in B4. Scale bars: 25 µm.
Figure 5
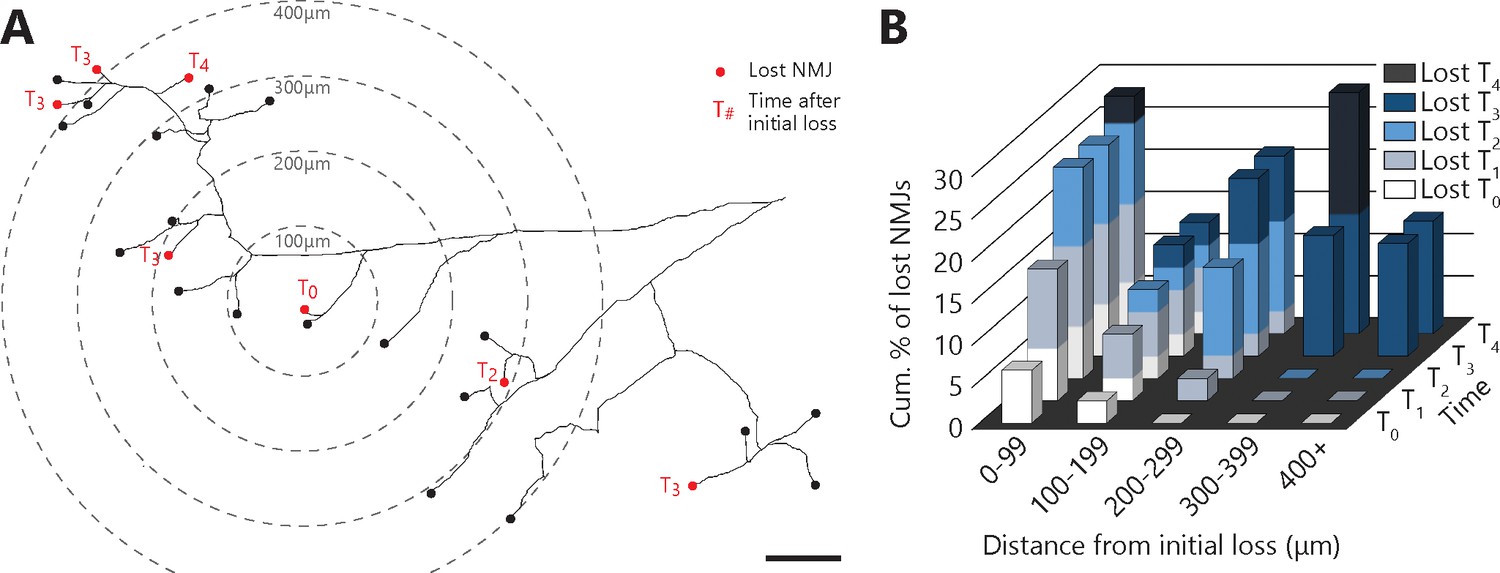
Denervation events tended to propagate from the first lost NMJ in the MU, with a higher susceptibility of distal branches.
(A) Example of a full MU arbor tracing used to calculate the distance of every NMJ from the first one lost (T0). Red dots indicate denervation events and their time (in session numbers) from the initial loss while black dots mark conserved NMJs. (B) Histogram showing the cumulative probability of an NMJ being lost as a function of distance and time from the initial loss, and for all MU arbors bearing multiple losses. Note how NMJs close to the initial loss (<300 μm) are frequently lost in the following sessions while distant NMJs are exclusively lost 3 or 4 sessions after (n = 141; 9 arbors, N = 6; repeated measures GLM with logistic distribution, effect of time: p=0.251; effect of distance: p=0.004; interaction between time and distance: p<0.001). The raw values for graphs in panel (B) are presented in Figure 5—source data 1. Scale bar: 100 μm.
-
Figure 5—source data 1
Spreadsheet of the innervation status of all NMJs in each MU arbor with their distance from first lost NMJ in the arbor (in µm) and timing of subsequent losses relative to the initial losses (T0, T1, T2, T3 and T4).
Tables at the bottom of the file represent the compilations across all MUs. This data is represented in Figure 4B.
- https://doi.org/10.7554/eLife.41973.018
Figure 6
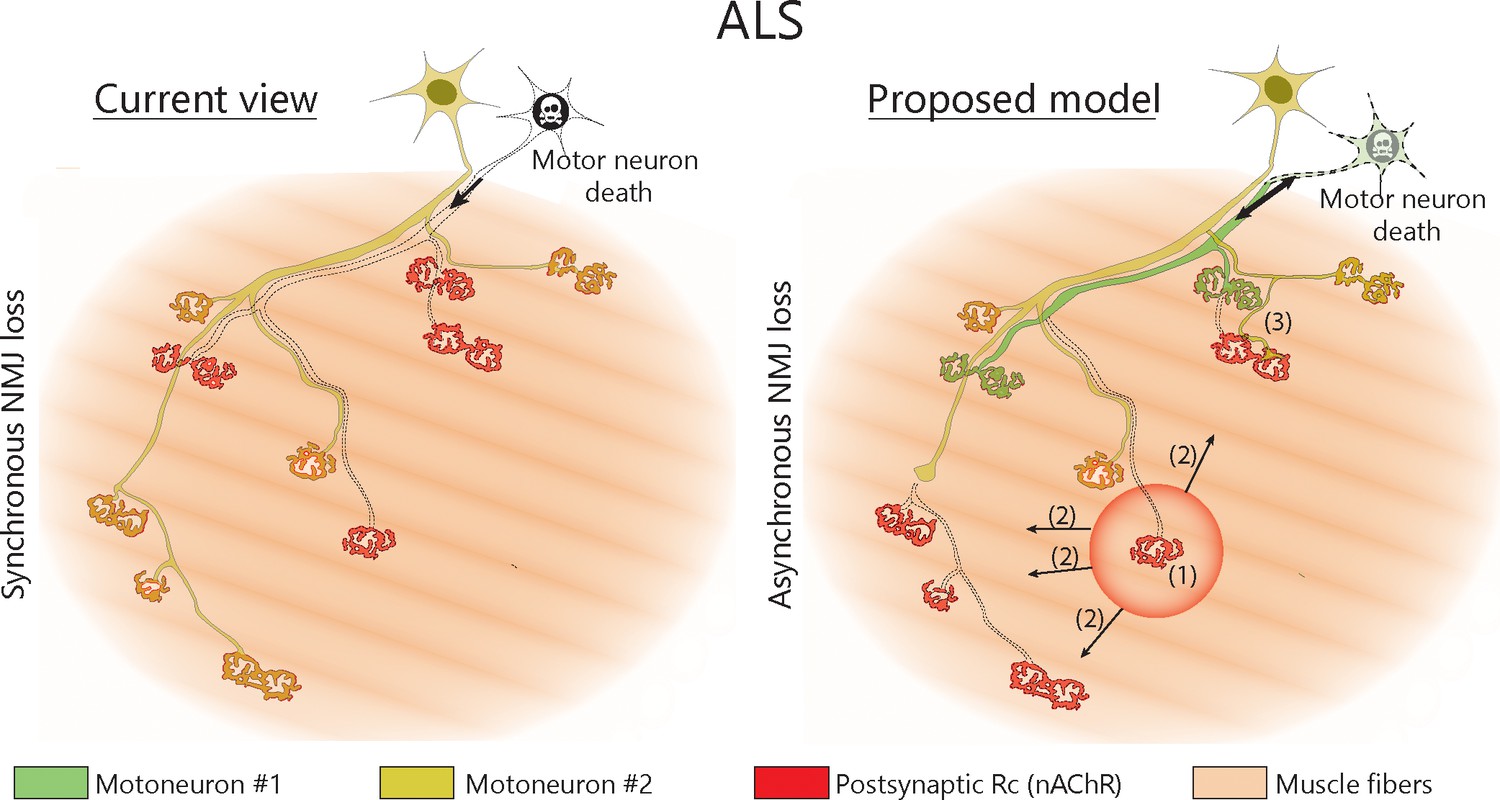
Proposed model of NMJ dynamism in ALS.
NMJs within single MUs are lost asynchronously independently of motor axon degeneration (1). Local neuromuscular factors contribute to denervation events, which thus propagate from the first lost NMJ in the arbor (2), with distal branches being more susceptible than proximal ones. Nevertheless, MUs preserve their sprouting capability and extend toward heterologous, postsynaptic sites (3).
Tables
Key resources table
| Reagent type (species) or resource | Designation | Source or reference | Identifiers | Additional information |
|---|---|---|---|---|
| Strain, strain background (Mus muculus, C57BL/6J) | loxSOD1G37R | PMID: 16741123; now also available from Jax mice (stock number 016149) | RRID:MGI:3629226 | Originaly imported from Don W. Cleveland's facilities (UCSD). |
| Strain, strain background (M. muculus, C57BL/6J) | Thy1-YFP line H | Jax mice (stock number 003782) | RRID:MGI:3497947 | |
| Antibody | Goat polyclonal anti-choline acetyl-transferase | EMD Millipore (AB144P) | RRID:AB_207951 | (1:100) |
| Antibody | Mouse monoclonal IgG1 anti-NeuN, clone A60 | EMD Millipore (MAB377) | RRID:AB_2298772 | (1:300) |
| Antibody | Rabbit polyclonal anti-S100β | Agilent Dako (Z0311) | RRID:AB_10013383 | (1:250) |
| Antibody | Chicken polyclonal anti-neurofilament M | Rockland Inc. (212-901-D84) | RRID:AB_11182576 | (1:2000) |
| Antibody | Mouse monoclonal IgG1 anti-synaptic vesicular protein 2 | DSHB (SV2) | RRID:AB_2315387 | (1:2000) |
| Antibody | Mouse monoclonal IgG2b anti-MHC1 | DSHB (BA-D5c) | RRID:AB_2235587 | (1:100) |
| Antibody | Mouse monoclonal IgG1 anti-MHC2a | DSHB (SC-71c) | RRID:AB_2147165 | (1:200) |
| Antibody | Mouse monoclonal IgM anti-MHC2b | DSHB (BF-F3c) | RRID:AB_2266724 | (1:200) |
| Antibody | Mouse monoclonal IgM anti-MHC2x | DSHB (6H1s) | RRID:AB_1157897 | (1:10) |
| Antibody | Mouse monoclonal IgG1 anti-MHC all-but-IIx | DSHB (BF-35c) | RRID:AB_2274680 | (1:200) |
| Antibody | Goat polyclonal anti-mouse IgG1 DyLight 405 | Jackson ImmunoResearch (115-475-205) | RRID:AB_2338799 | (1:500) |
| Antibody | Donkey polyclonal anti-goat Alexa 594 | Jackson ImmunoResearch (705-585-147) | RRID:AB_2340433 | (1:500) |
| Antibody | Goat polyclonal anti-mouse IgG1 Alexa 647 | Jackson ImmunoResearch (115-605-205) | RRID:AB_2338916 | (1:500) |
| Antibody | Donkey polyclonal anti-chicken Alexa 647 | Jackson ImmunoResearch (703-605-155) | RRID:AB_2340379 | (1:500) |
| Antibody | Donkey polyclonal anti-rabbit Alexa 405 | Jackson ImmunoResearch (711-475-152) | RRID:AB_2340616 | (1:500) |
| Antibody | Goat polyclonal anti-mouse IgM Alexa 647 | Jackson ImmunoResearch (115-605-020) | RRID:AB_2338905 | (1:500) |
| Antibody | Goat polyclonal anti-mouse IgG2b Alexa 488 | Jackson ImmunoResearch (115-545-207) | RRID:AB_2338856 | (1:500) |
| Antibody | Goat polyclonal anti-mouse IgG1 Alexa 594 | Jackson ImmunoResearch (115-585-205) | RRID:AB_2338885 | (1:500) |
| Chemical compound, drug | Alexa 594-conjuguated α-Bungarotoxin | Thermofisher (B13423) | (1:750) (1.33µg/mL) |
Additional files
-
Transparent reporting form
- https://doi.org/10.7554/eLife.41973.021
Download links
A two-part list of links to download the article, or parts of the article, in various formats.
Downloads (link to download the article as PDF)
Open citations (links to open the citations from this article in various online reference manager services)
Cite this article (links to download the citations from this article in formats compatible with various reference manager tools)
Dynamic neuromuscular remodeling precedes motor-unit loss in a mouse model of ALS
eLife 7:e41973.
https://doi.org/10.7554/eLife.41973


