Nuclear receptor NR4A is required for patterning at the ends of the planarian anterior-posterior axis
- Whitehead Institute for Biomedical Research, United States
- Massachusetts Institute of Technology, United States
- Howard Hughes Medical Institute, United States
- Harvard Medical School, United States
Figures
Figure 1 with 1 supplement
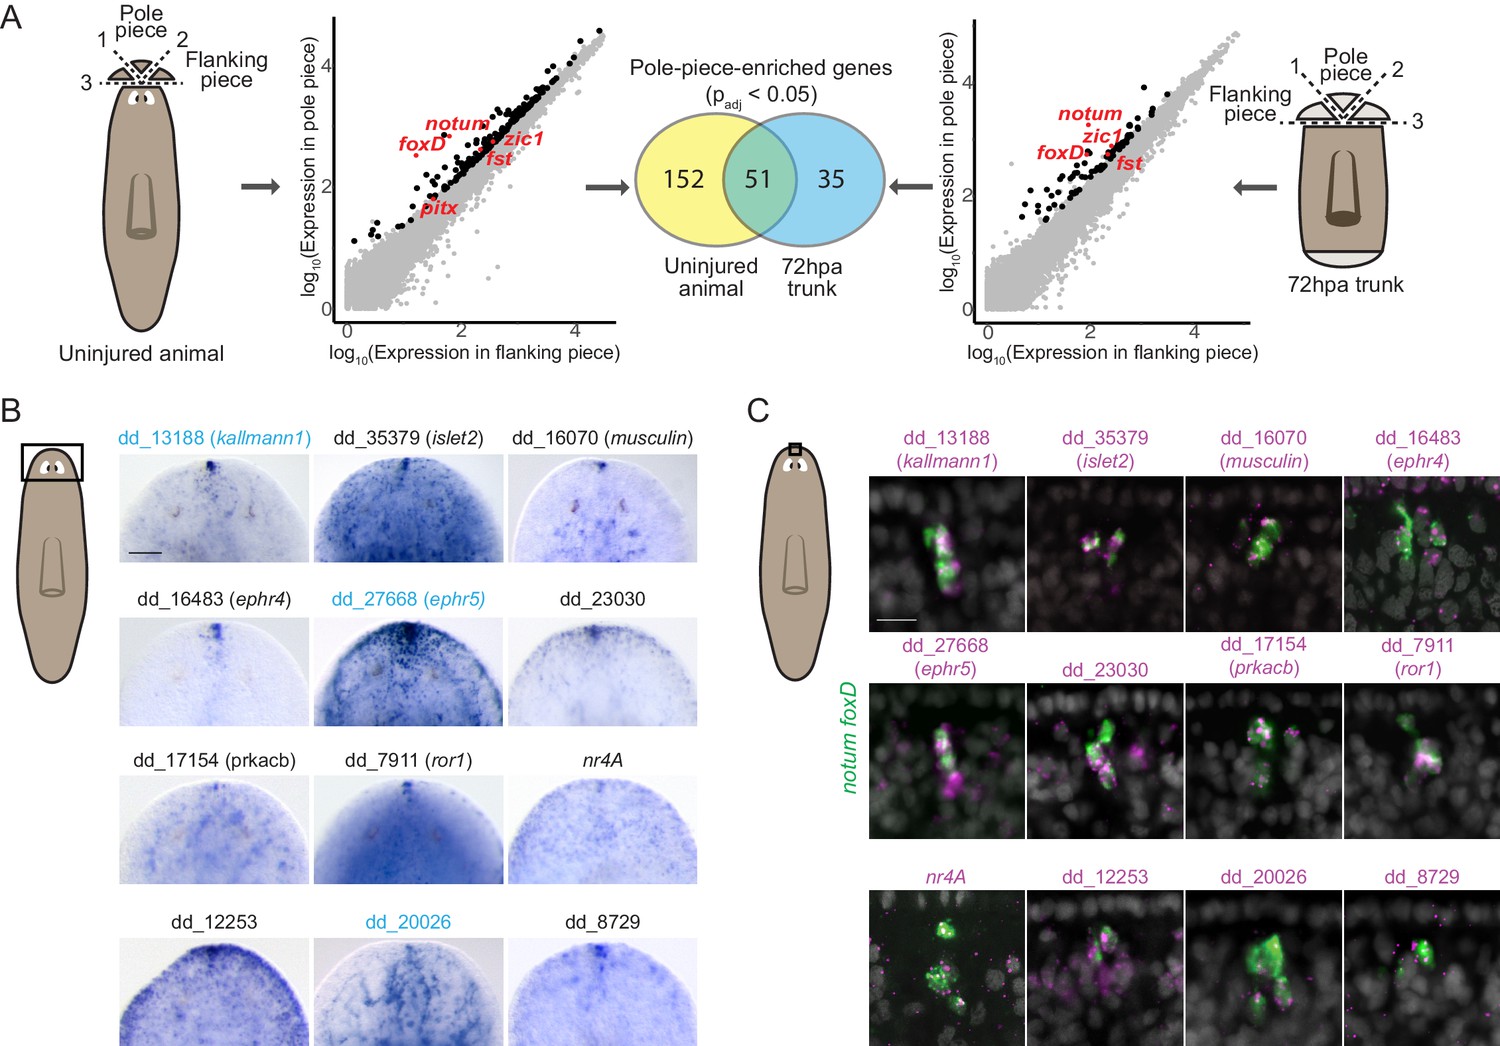
RNA sequencing of head-tip fragments identifies new anterior-pole-enriched genes.
(A) Anterior pole bulk RNA sequencing: RNA sequencing of excised fragments containing the anterior pole (‘Pole piece’) and adjacent fragments without the pole (‘Flanking piece’) from uninjured animals and anterior blastemas of regenerating trunks 72 hr post amputation (72hpa) was performed (cartoons, dotted lines are cut planes, and dotted line numbers indicate cut sequence). Scatter plots show results from differential expression analysis, which identified genes with enriched expression (padj <0.05) in pole pieces compared to flanking pieces (black data points), including previously published anterior pole genes (red data points). Many genes with enriched expression were identified in both uninjured and 72hpa animals, as shown in the Venn diagram. (B) Head expression of anterior pole candidates from RNA sequencing by whole-mount in situ hybridization. Gene names, if present, represent best human BLAST hits; numerical names indicate the Smedv4.1 Dresden transcriptome assembly transcript number (See ‘Gene nomenclature’ in Materials and methods). Genes in blue were also expressed in the posterior-pole region (Figure 1—figure supplement 1). Area imaged is indicated by the box in the cartoon on the left. Scale bar represents 100 μm. (C) Co-expression of anterior pole gene candidates with pooled pole markers notum and foxD by fluorescence in situ hybridization. DAPI nuclear stain in gray. Area imaged is indicated by the box in the cartoon on the left. Scale bar represents 10 μm. Images are representative of results seen in at least four animals.
Figure 1—figure supplement 1
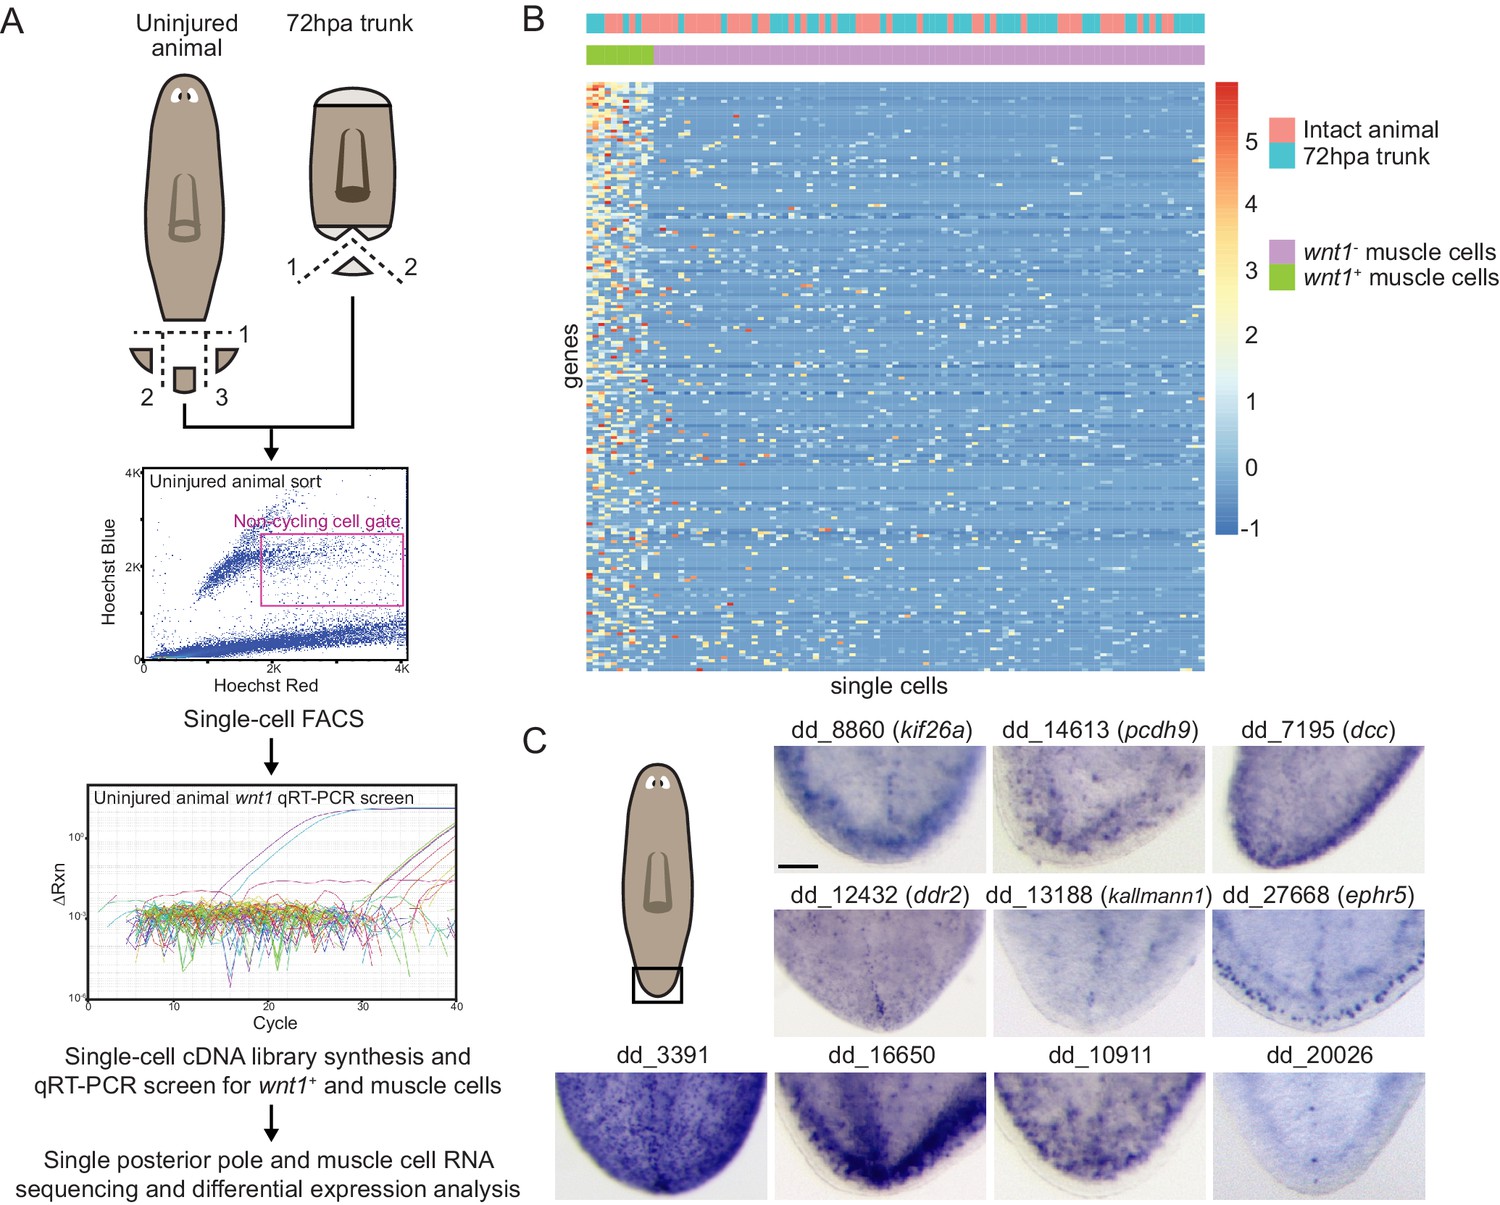
Single-cell RNA sequencing of tail tip fragments identifies new genes expressed in the posterior pole region.
(A) Posterior pole single-cell RNA sequencing approach: Posterior-pole-containing fragments were excised from tail tips of uninjured animals and posterior blastemas of regenerating trunks 72 hr post amputation (hpa) (cartoons; dotted lines are cut planes, and dotted line numbers denote cut sequence). Excised fragments were dissociated and single cells were sorted (gate in magenta) onto 96-well plates via fluorescence activated cell sorting (FACS). cDNA libraries synthesized from single cells were screened by qRT-PCR for wnt1 and collagen expression (qRT-PCR plot), sequenced, and analyzed for differential gene expression. (B) Heatmap of all 101 single cells sequenced (columns: 11 wnt1+; collagen+ posterior pole cells and 90 wnt1-; collagen+ muscle cells) was generated by clustering by normalized transcript counts of the genes (rows) differentially expressed in posterior pole cells over non-pole muscle cells (p<0.05) (C) Tail expression of posterior pole candidates by whole-mount in situ hybridization: Gene names represent best human BLAST; numerical names indicate the Smedv4.1 Dresden transcriptome assembly transcript number (See ‘Gene nomenclature’ in Materials and methods). Area imaged is indicated by the box in the cartoon on the left. Images are representative of results seen at least four animals. Scale bar represents 50 μm.
Figure 2 with 2 supplements

nr4A RNAi leads to head and tail patterning defects.
(A) Images of the heads of live animals at different time points during control and nr4A RNAi. Progressive development of posterior ectopic eyes and complete head regeneration at 7 days post amputation (seven dpa) were observed in nr4A RNAi. Proportions indicate numbers of animals with phenotype shown over total number of animals. Scale bars represent 150 μm. (B) Images of the tails of live animals at 12 weeks of RNAi. Development of an outgrowth at the tail tip and complete tail regeneration without an outgrowth at seven dpa were observed in nr4A RNAi. Scale bars represent 150 μm. (C) Differentiated tissue marker expression in the head of 9 week RNAi animals by FISH. Ectopic differentiated tissue marker expression is indicated by arrow heads; posteriorly expanded mag-1+ cells and head tip loss are indicated with brackets. Dotted white lines indicate anterior borders of the heads. Scale bars for images with laminB, NB.22.1e, and mag-1 represent 100 μm; scale bar for images with ChAT and dd_3524 represent 200 μm. (D) FISH with differentiated tissue markers showed ectopic marker expression in the tails of 9 week nr4A(RNAi) animals (arrow heads) compared to 9 week control animals. Scale bars represent 100 μm. Areas imaged are indicated by the box in the cartoons on the left for all panels. Fluorescence images are maximum intensity projections. All images are representative of results seen in at least four animals.
Figure 2—figure supplement 1
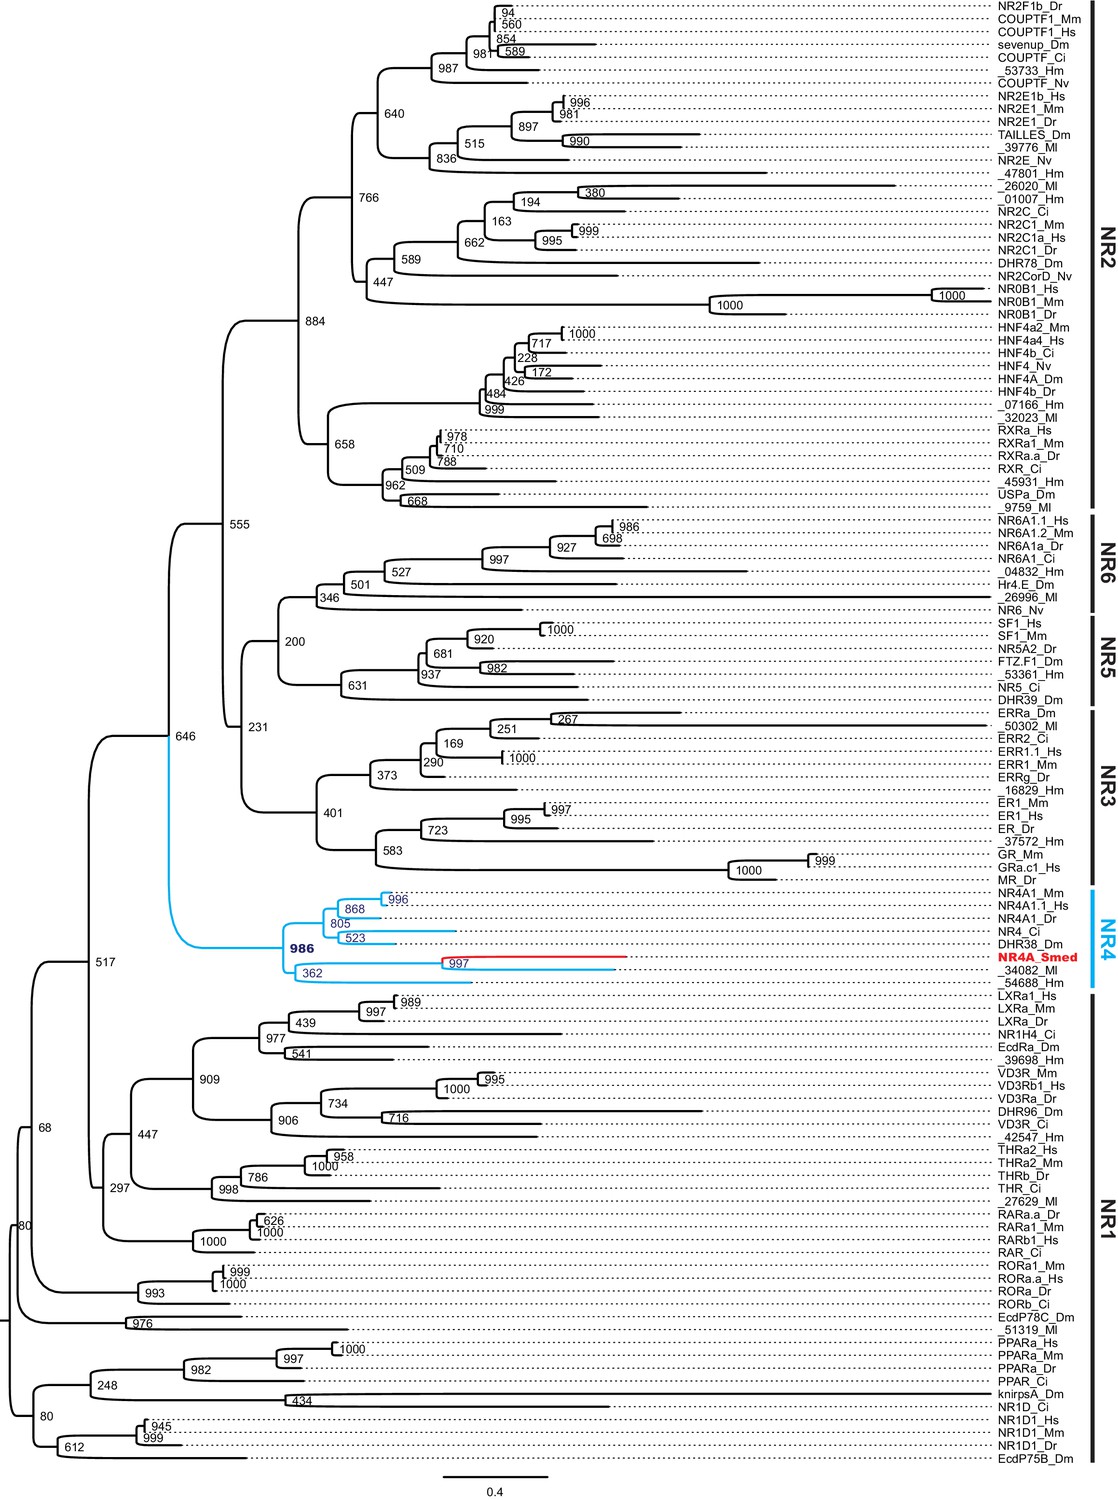
Phylogenetic analysis of Schmidtea mediterranea NR4A.
Tree showing the protein sequence of the translated Schmidtea mediterranea nr4A mRNA (NR4A_Smed) along with representative protein sequences from each of the six nuclear receptor subfamilies annotated on the right from Homo sapiens (Hs), Mus musculus (Mm), Danio rerio (Dr), Ciona intestinalis (Ci), Drosophila melanogaster (Dm), Macrostomum lignano (Ml), Nematostella vectensis (Nv), and Hofstenia miamia (Hm). Numbers at the nodes denote the number of trees consistent with branch placements at those nodes from 1000 bootstrap replicates. The blue-colored clade denotes the NR4A subfamily, with the red-colored branch denoting the Schmidtea mediterranea NR4A.
Figure 2—figure supplement 2
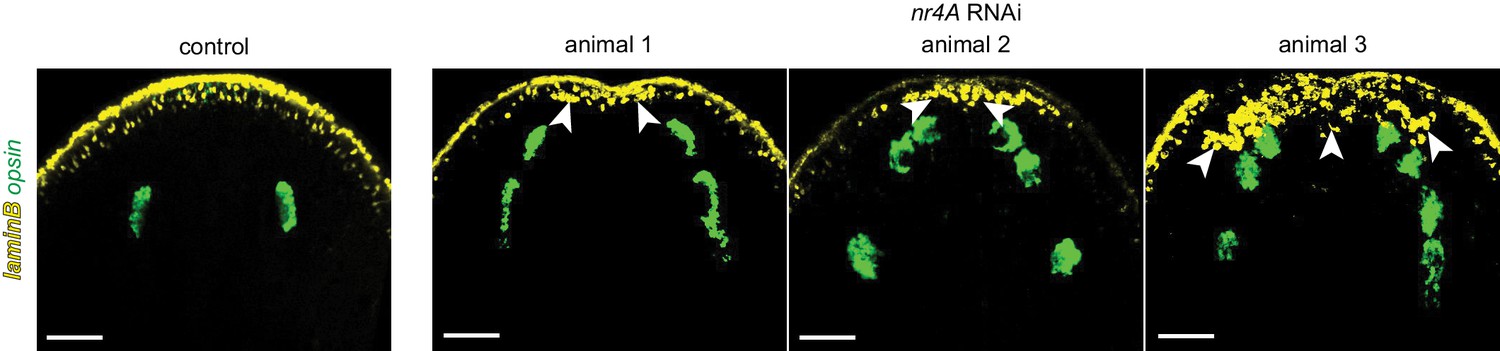
nr4A RNAi leads to the appearance of ectopic laminB+ cells posterior to the dorsal-ventral (DV) boundary of the head tip.
laminB and opsin expression by FISH. nr4A was inhibited for 9 weeks in nr4A(RNAi) animals 1 and 2, and for 11 weeks in nr4A(RNAi) animal 3. Scale bars represent 100 μm. Images are maximum intensity projections.
Figure 3 with 3 supplements
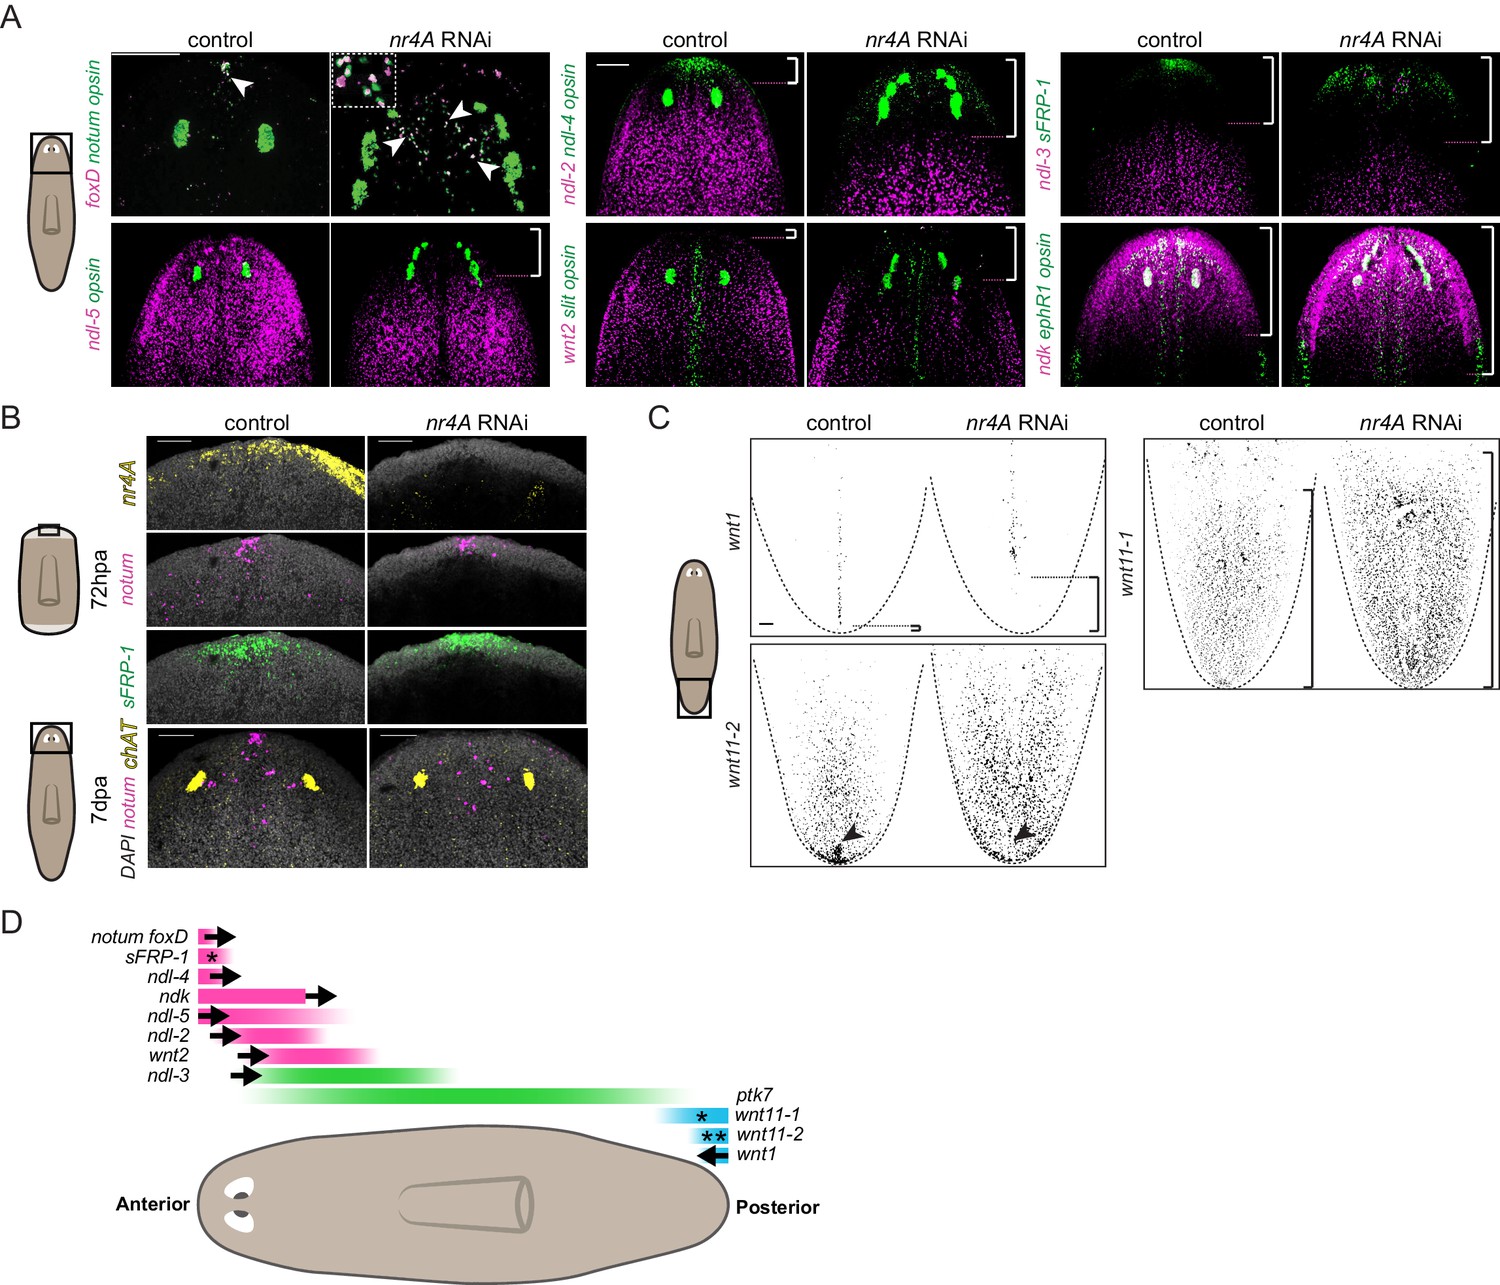
nr4A maintains PCG expression at the head and tail tips.
(A) Eye marker opsin and head PCG expression by FISH in control and nr4A(RNAi) animals at 9 weeks of RNAi. Inset shows a magnified view of ectopic notum+; foxD+ anterior pole cells in nr4A(RNAi) animal. Scale bars represent 200 μm. (B) Anterior pole regeneration at the anterior blastema at 72 hr post amputation (72hpa) and 7 days post amputation (7dpa) by FISH. DAPI nuclear stain in gray. Scale bars represent 100 μm. (C) Tail PCG expression by FISH in control and nr4A(RNAi) animals at 9 weeks of RNAi. Scale bar represents 100 μm. (D) Diagram summarizing PCG domain shifts in nr4A RNAi. Statistically significant shifts of anterior or posterior PCG boundaries in the direction of the arrows are shown. A single asterisk denotes statistically significant area change without significant domain boundary shift. Double asterisks in wnt11-2 domain denote the disappearance of its posterior-most expression cluster in nr4A RNAi. Quantification of PCG expression domain changes is included in Figure 3—figure supplement 1 and Supplementary file 1D. Area imaged is indicated by the box in the cartoon on the left for all panels. Images are maximum intensity projections. All images are representative of results seen in at least four animals.
Figure 3—figure supplement 1
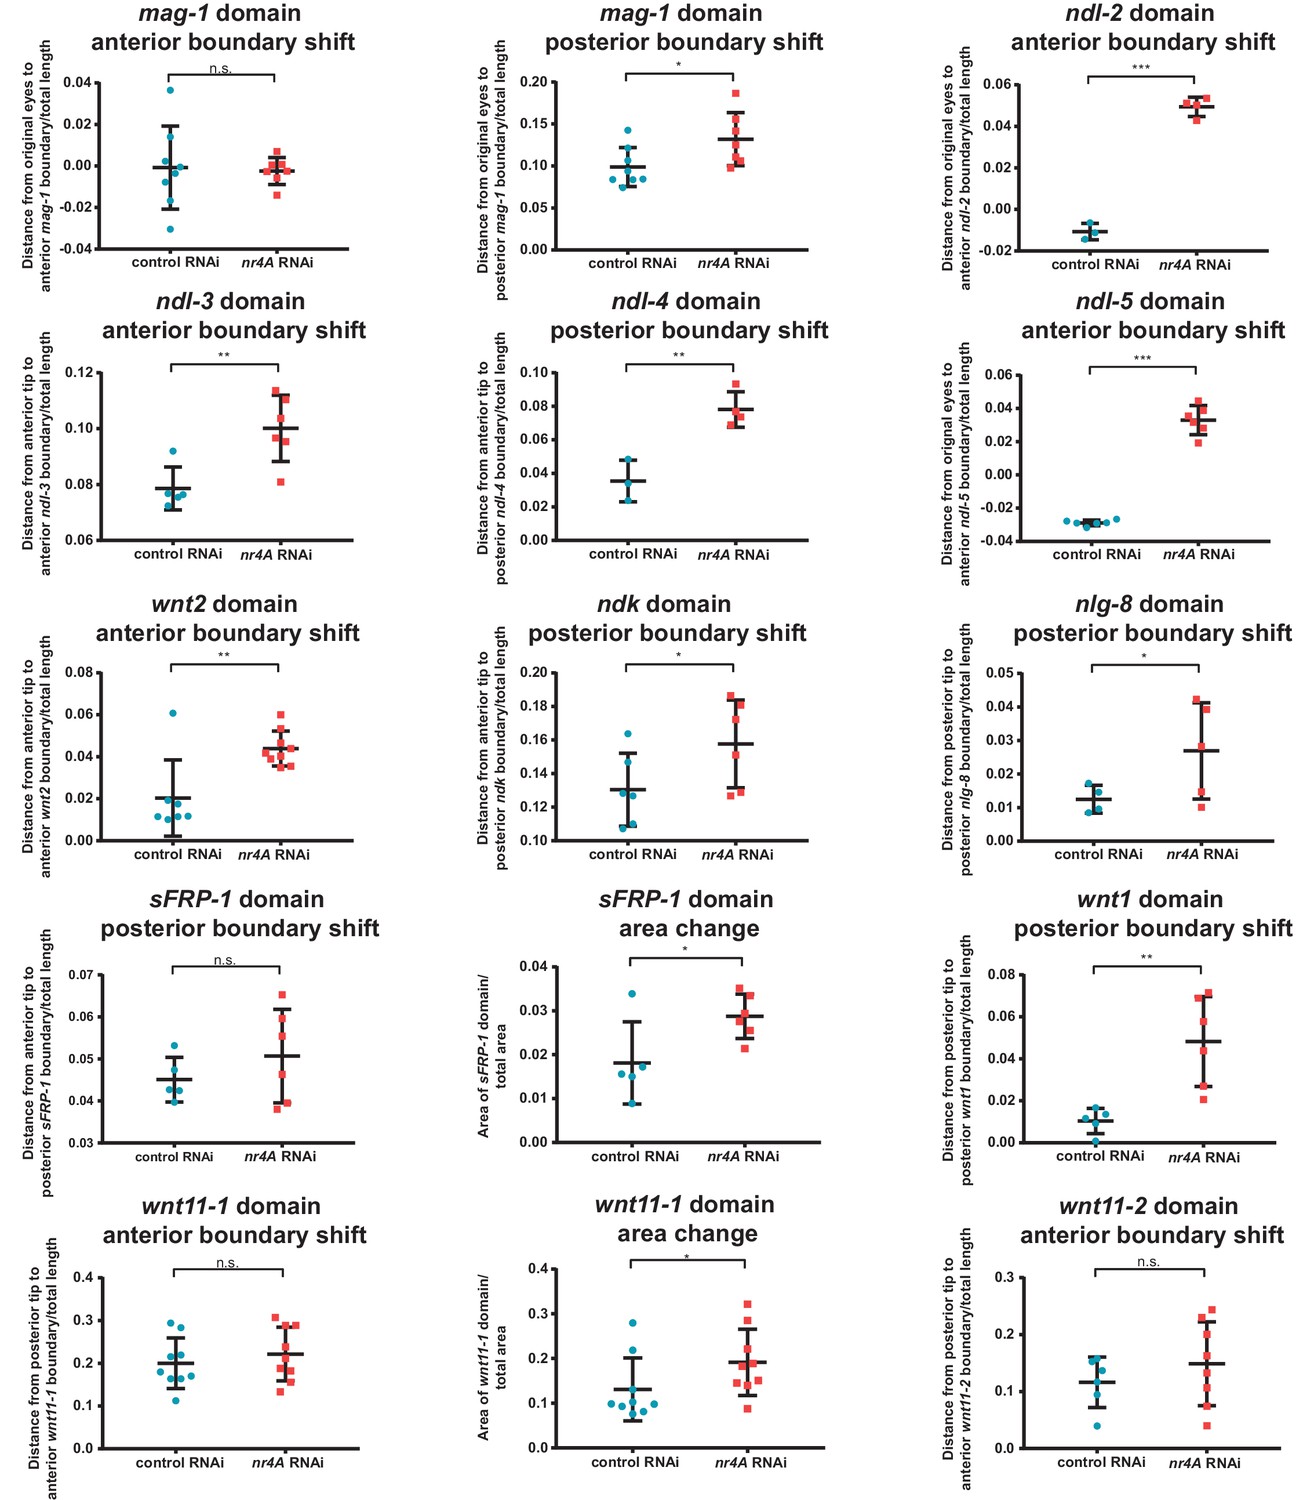
Quantification of shifts in PCG and mag-1 expression domains in nr4A RNAi.
Graphical representations of quantifications of shifts in PCG and mag-1 expression boundaries relative to the anterior tip, eyes, or posterior tips of animals at 9 weeks of nr4A RNAi and control RNAi (Supplementary file 1D). Statistical comparisons were done using one-tailed Welch’s t-tests. Distances were normalized to total animal length. The boundaries of sFRP-1 and wnt11-1 expression domains were not significantly shifted in nr4A RNAi compared to those in control, but their expression domain areas (normalized to total animal area) were significantly greater in nr4A RNAi than in control. n.s. = not significant at a level of 0.05. *=p < 0.05, **=p < 0.01, ***=p < 0.001.
Figure 3—figure supplement 2
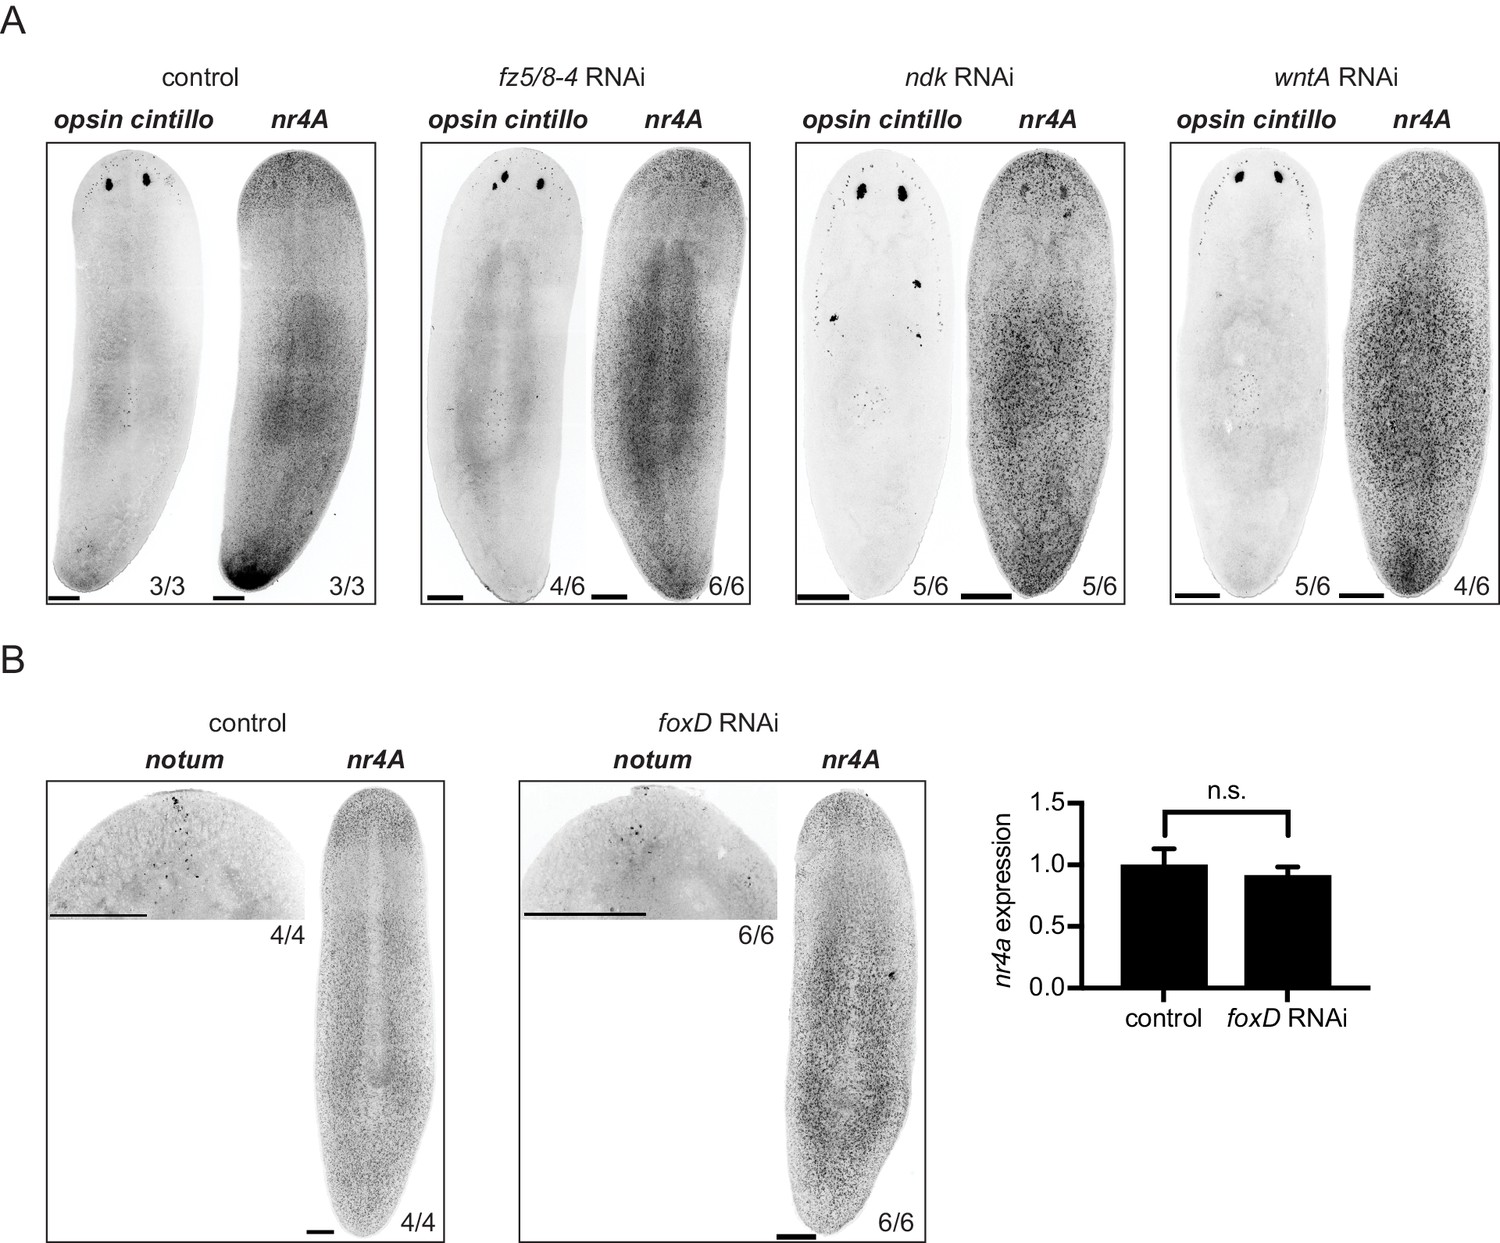
nr4A expression is independent of anterior PCGs.
(A) nr4A, opsin, and cintillo expression by FISH in control, fz5/8-4, ndk, and wntA(RNAi) animals. (B) nr4A and notum expression in control and foxD(RNAi) animals by FISH. qPCR quantification of nr4A expression in the same batch of animals as those analyzed by FISH is shown on the right. Statistical comparison was performed with two-tailed Welch’s t-test. n.s. = not significant at a level of 0.05. Proportions indicate fraction of animals analyzed with phenotype shown. Images are maximum intensity projections. Scale bars represent 200 μm.
Figure 3—figure supplement 3
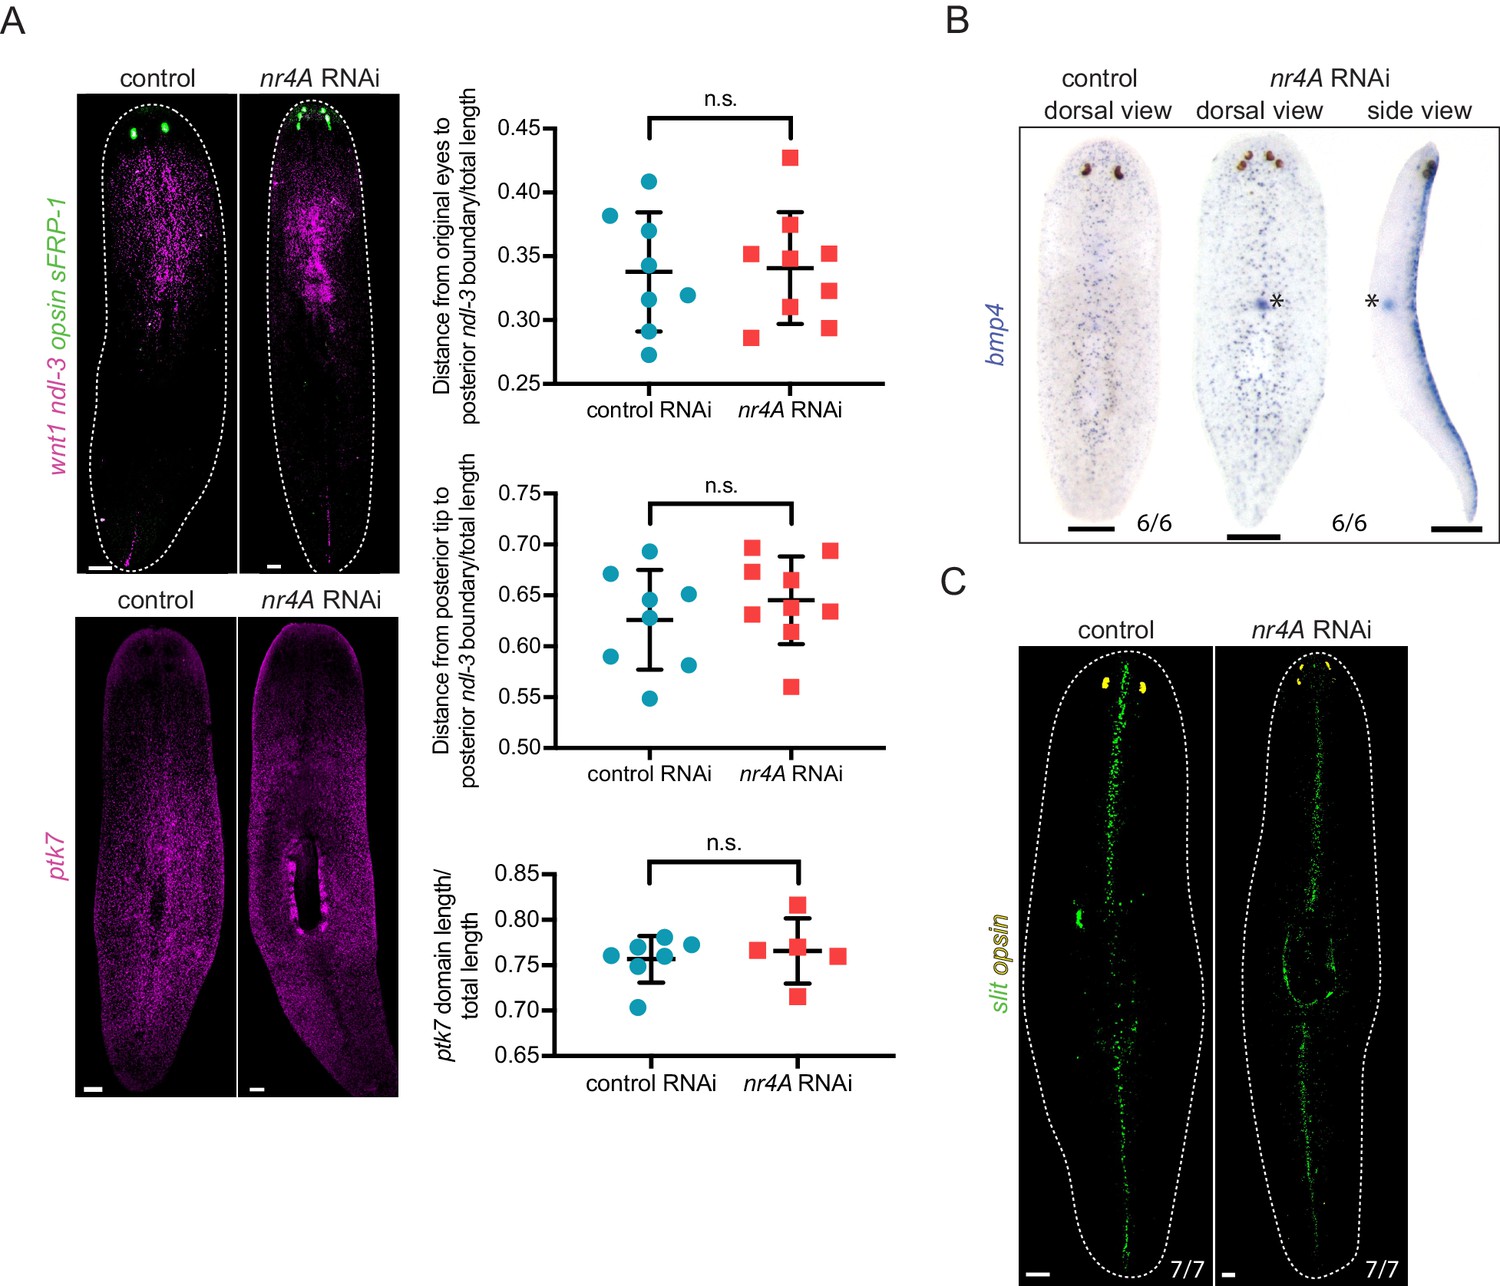
Mid-body, DV, and midline pattern are largely intact in nr4A RNAi.
(A) ndl-3 and ptk7 expression by FISH in control and nr4A(RNAi) animals, and quantifications of their domain boundaries. ptk7 domain length was defined by the distance between its anterior and posterior boundaries. All measurements were normalized by animal length. Statistical comparisons were done using one-tailed Welch’s t-tests (Supplementary file 1D). n.s. = not significant at a level of 0.05. Scale bar represents 200 μm. (B) bmp4 expression pattern by colorimetric ISH in control and nr4A(RNAi) animals. There was no ventral ectopic bmp4 expression in nr4A RNAi (side view). bmp4 expression in the esophagus (asterisk) was increased in nr4A(RNAi) animals compared to control animals. Proportions indicate fraction of animals analyzed with phenotype shown. Scale bar represents 200 μm. (C) slit expression by FISH in control and nr4A(RNAi) animals. Proportions indicate fraction of animals analyzed with phenotype as shown. Scale bar represents 200 μm. Fluorescence images are maximum intensity projections. All Images are representative of results seen in at least four animals.
Figure 4 with 1 supplement
Planarian nr4A is expressed in muscle.
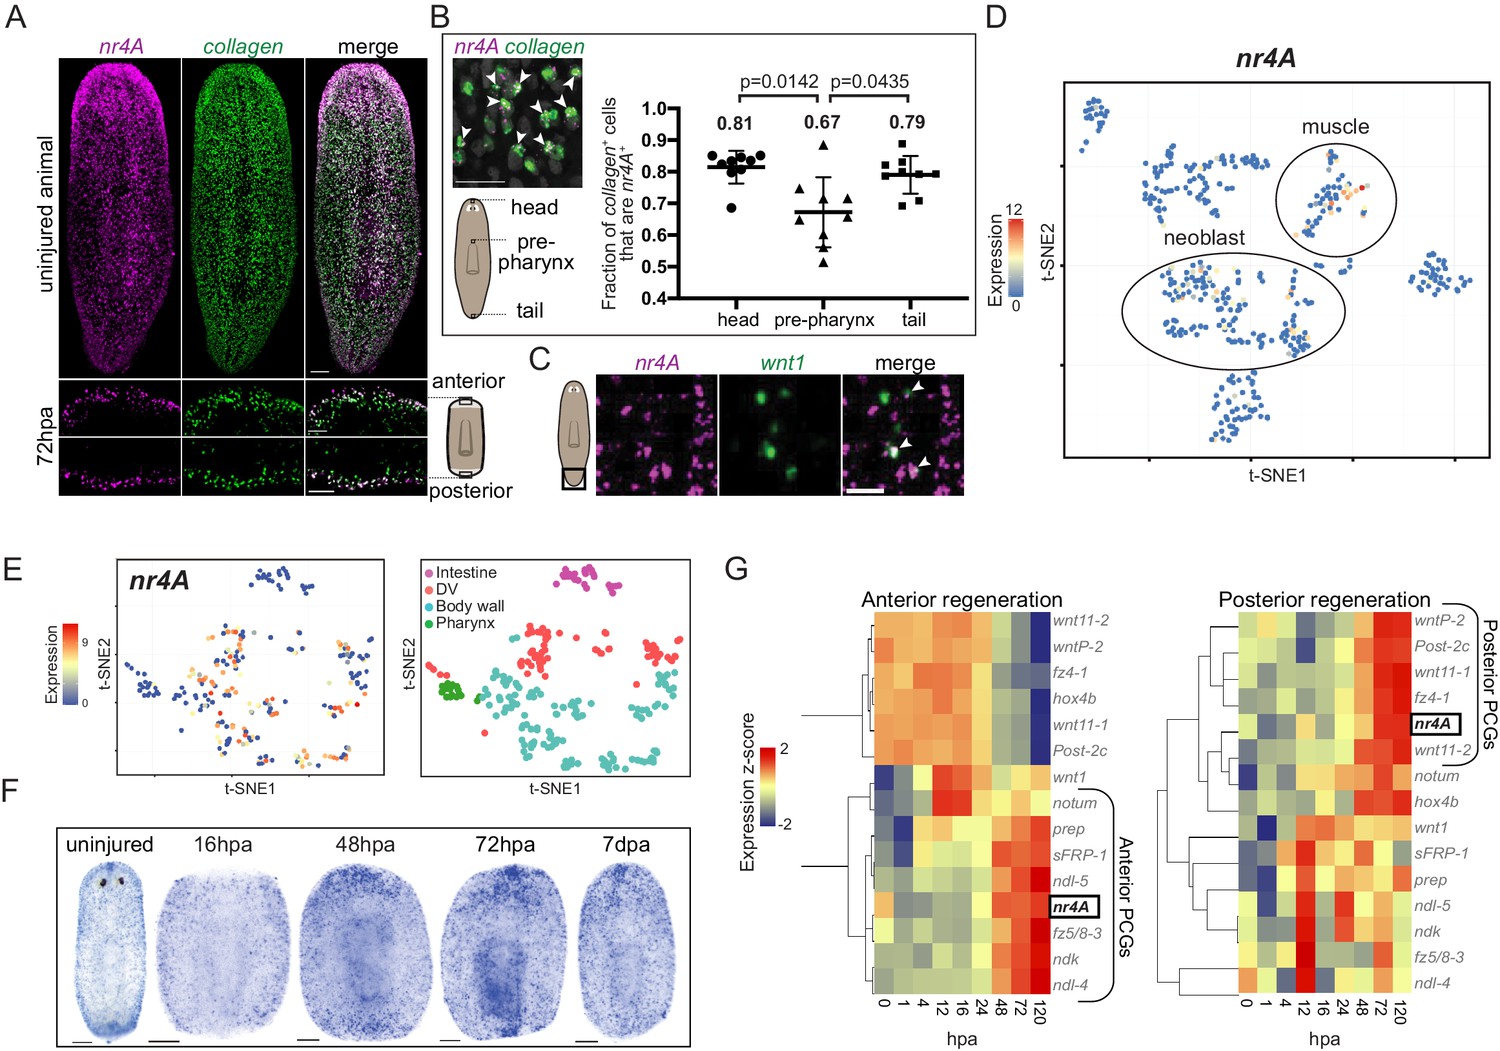
(A) nr4A and collagen expression and co-expression in body-wall muscle cells in uninjured animals (top) and anterior and posterior bastema 72 hr post amputation (72hpa, bottom) by FISH. Blastema areas imaged are indicated by the boxes in the cartoon on the right. Uninjured image scale bar represents 100 μm. 72hpa image scale bar represents 50 μm. (B) Quantification of proportion of collagen+ muscle cells that expressed nr4A by FISH in the head, pre-pharynx, and tail (Figure 4—source data 1), with a representative image showing collagen and nr4A double-positive cells (arrow heads). Numbers on the plot indicate mean proportions for each region. Statistical comparisons were done using Brown-Forsythe and Welch ANOVA tests with Dunnett’s T3 multiple comparisons test. Scale bar represents 25 μm. (C) nr4A and wnt1 expression and co-expression (arrow heads) in the posterior pole in uninjured animals by FISH. Area imaged is indicated by the box in the cartoon on the left. Scale bar represents 10 μm. (D) nr4A expression in single-cell clusters. Expression of nr4A mapped on the t-distributed Stochastic Neighbor Embedding (t-SNE) plot of cell type clusters generated by Seurat (Wurtzel et al., 2015). Muscle and neoblast clusters are labeled. (E) nr4A expression in muscle cell clusters (left) generated from single-cell RNA sequencing data in Scimone et al. (2018); t-SNE representation of major muscle classes is on the right. (F) nr4A expression in uninjured animal and regenerating trunks at 16 hr post amputation (16hpa), 48hpa, 72 hpa, and 7 days post amputation (7dpa) by whole-mount in situ hybridization. All images are representative of results seen in at least four animals. (G) nr4A expression levels during anterior and posterior regeneration compared with PCG expression levels. Heat maps were generated with normalized expression levels (expression z-score) of nr4A and anterior and posterior PCGs during head (anterior) and tail (posterior) regeneration using previously published data (Wurtzel et al., 2015), and clustered by their trend of expression from 0 to 120 hr post amputation (hpa) with Spearman's correlation. nr4A clusters with anterior PCGs during anterior regeneration and posterior PCGs during posterior regeneration.
-
Figure 4—source data 1
Quantification of proportion of collagen+ muscle cells that express nr4A in head, pre-pharynx, and tail of uninjured animals.
- https://doi.org/10.7554/eLife.42015.014
Figure 4—figure supplement 1
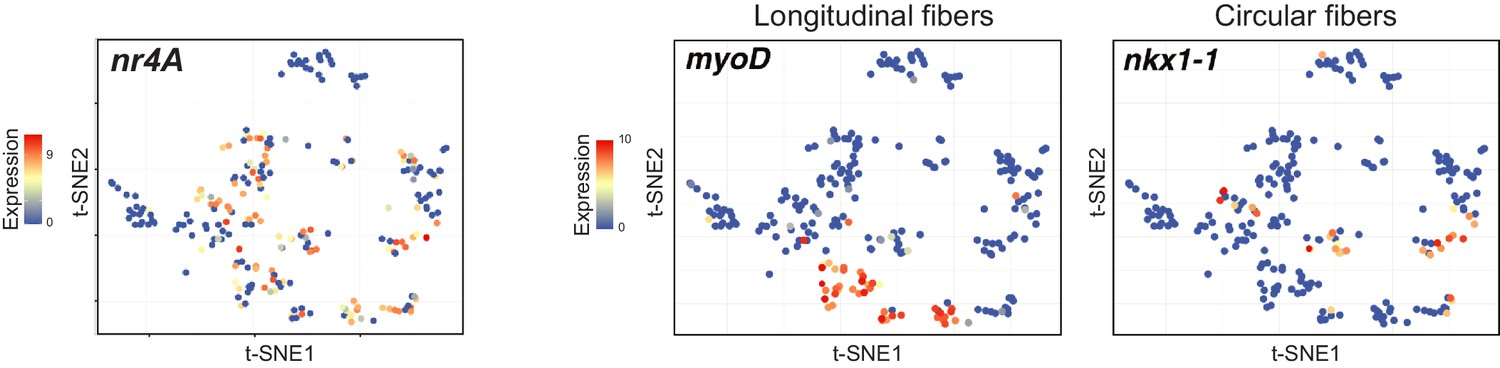
Planarian nr4A is expressed broadly in body-wall muscle, including in longitudinal and circular muscle fibers.
Mapping of nr4A, nkx1-1, and myoD expression in single-muscle-cell t-SNE plots generated in Scimone et al. (2018).
Figure 5 with 1 supplement
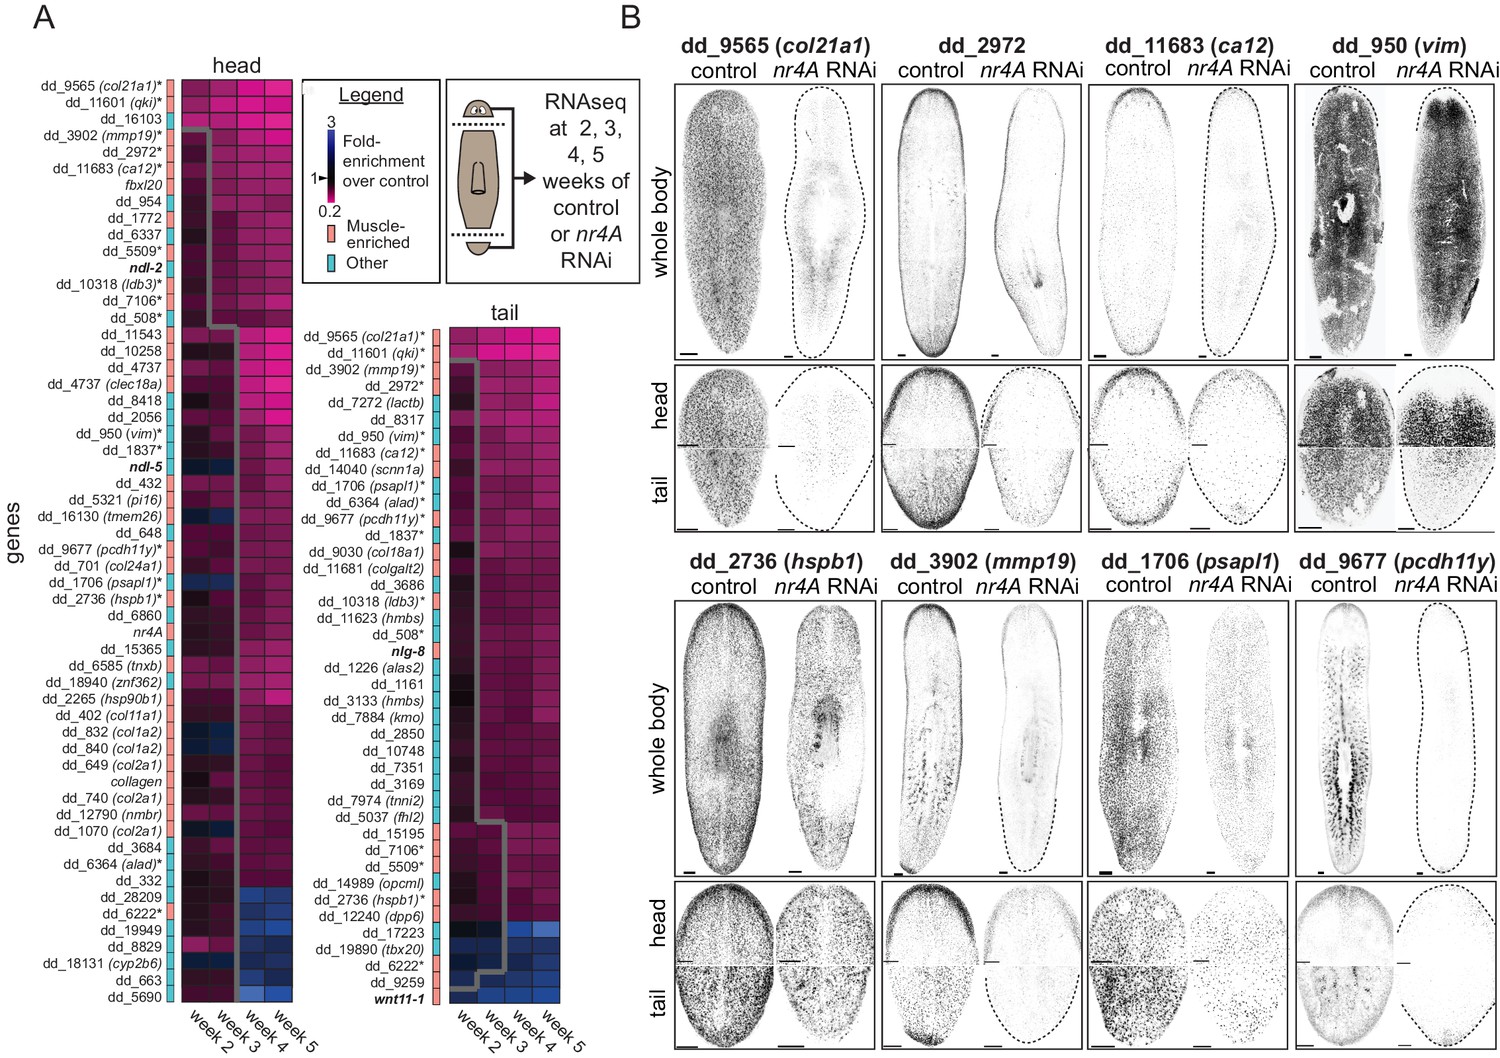
nr4A regulates the expression of muscle-enriched genes and PCGs.
(A) RNA sequencing of control and nr4A(RNAi) animals: Diagram shows the collection of heads and tails for RNA sequencing at selected time points during the course of RNAi (see Materials and methods). Cartoon shows amputation planes as dotted lines. Heat maps were generated from the fold-enrichment of expression of genes differentially expressed in the heads or tails of nr4A(RNAi) versus control animals. Columns are RNAi time points and rows are individual genes. Heat map regions to the right of the thick gray line indicate statistically significant (padj <0.05) expression changes over control. Color-coded column to the left of each heat map indicates whether each gene was muscle-enriched (salmon) or not muscle-enriched (cyan), as previously determined (Wurtzel et al., 2015). Gene names in bold are PCGs; gene names with an asterisk are genes with significant expression changes in both the head and tail in nr4A RNAi compared to control. See Materials and methods for gene nomenclature. (B) Expression patterns of a subset of genes regulated by nr4A in both the head and the tail and their downregulation by nr4A RNAi, shown by FISH. All animals were analyzed at 9 weeks of RNAi. Dotted lines mark animal boundaries. Images are maximum intensity projections, and representative of results seen in at least three animals. Scale bars represent 150 μm.
Figure 5—figure supplement 1
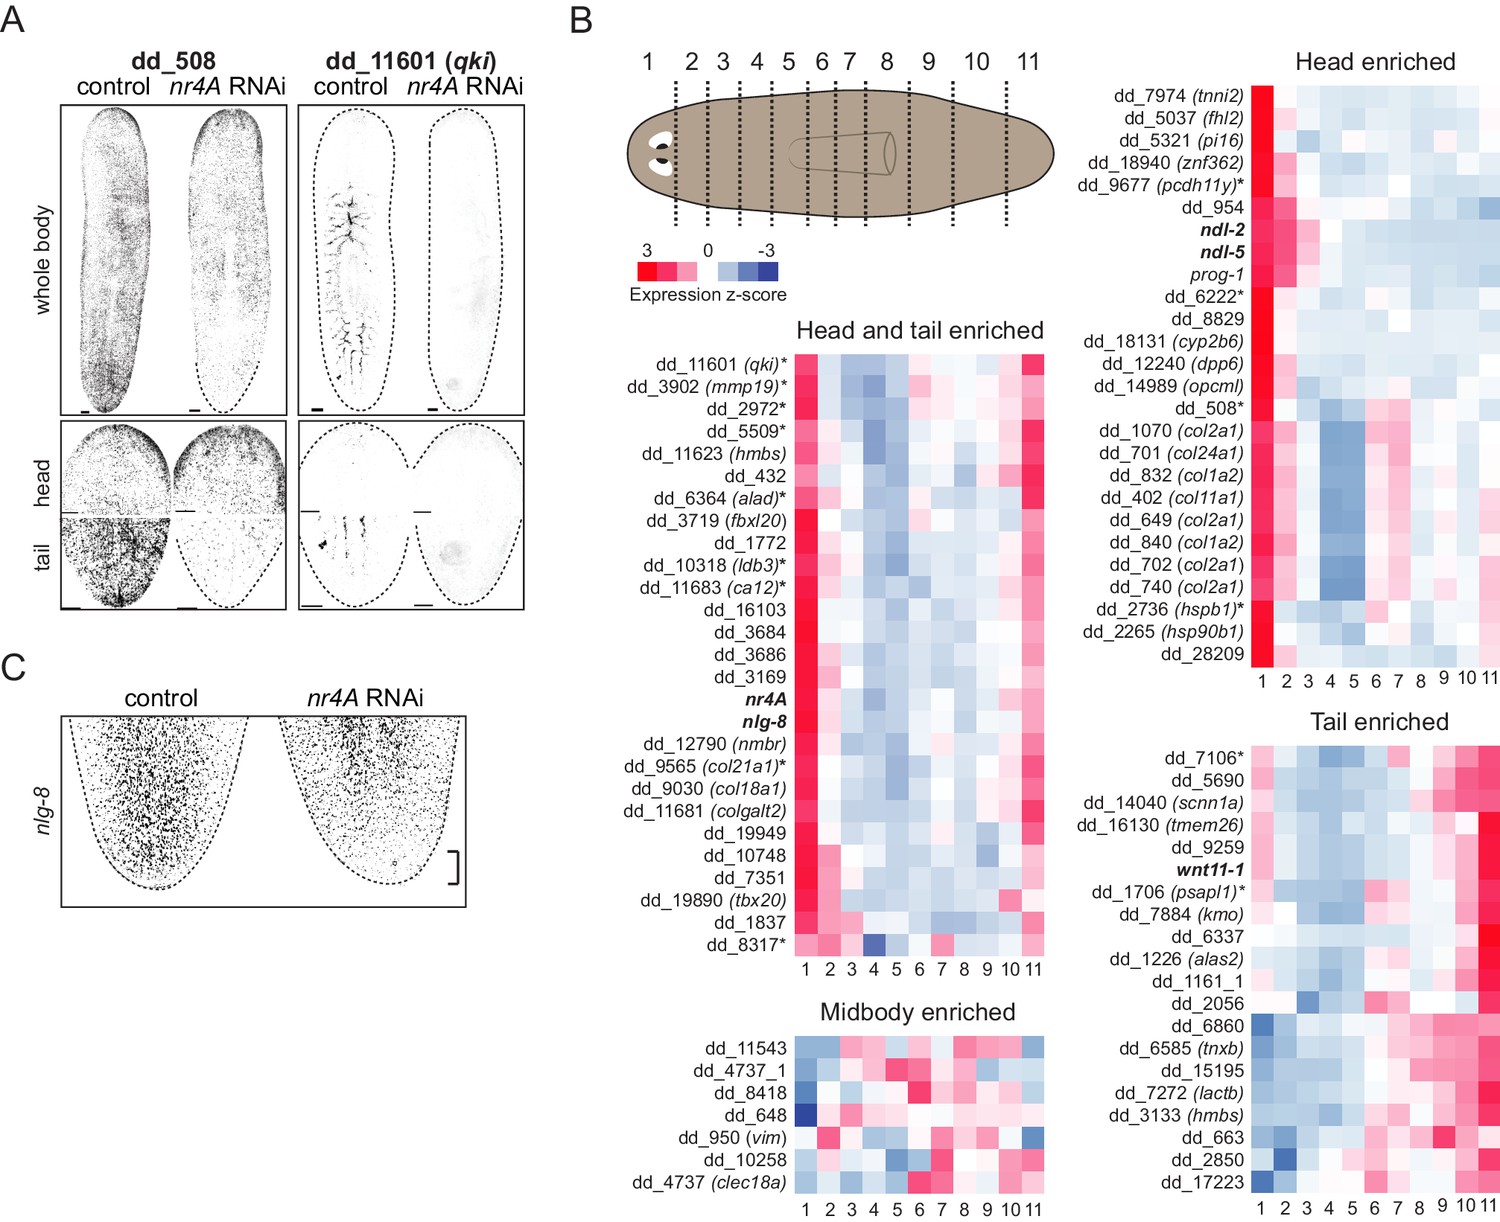
nr4A-regulated gene expression patterns and regulation by nr4A RNAi.
(A) Expression patterns of additional genes regulated by nr4A in both the head and the tail and their downregulation by nr4A RNAi, shown by FISH. Dotted lines denote animal boundaries. All animals were analyzed at 9 weeks of RNAi. Scale bars represent 150 μm. (B) nr4A and nr4A-target expression levels (as z-scores calculated from FPKM) in each of the denoted anterior-posterior segments (cartoon) from Stückemann et al. (2017). Genes are grouped into head and tail enriched, head enriched, midbody enriched, and tail enriched. nr4A and PCG gene names are in bold; gene names with an asterisk are genes with significant expression changes in both the head and tail in nr4A RNAi compared to control RNAi. See Materials and methods for gene nomenclature. (C) nlg-8 expression at the tail tip of nr4A(RNAi) animals and control animals at 9 weeks of RNAi. All images are maximum intensity projections and are representative of results seen in at least three animals.
Figure 6 with 1 supplement
nr4A inhibition leads to muscle loss at the head tip.
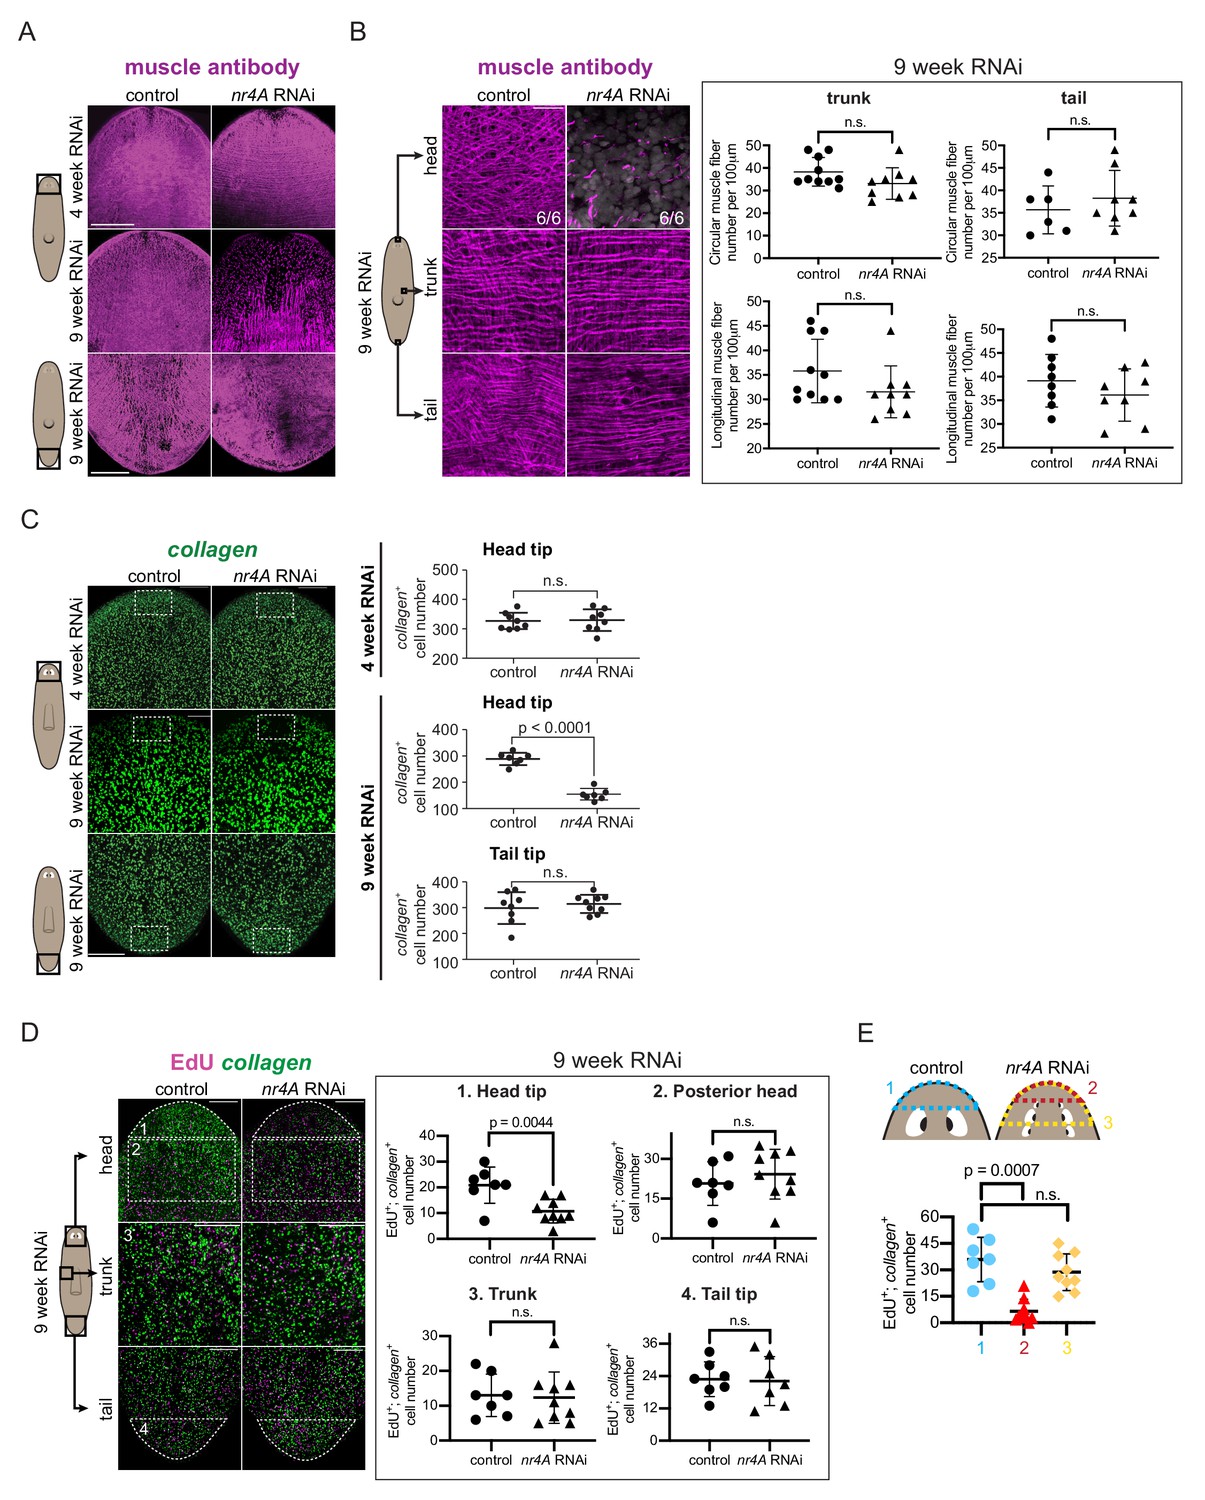
(A) Immunofluorescence with muscle antibody (6G10) in the head and tail of control and nr4A(RNAi) animals. Areas imaged are on the ventral surface of the animal. Scale bars represent 200 μm. (B) Higher magnification views of muscle fibers in the head tip, trunk, and tail of 9 week RNAi animals, and circular and longitudinal muscle fiber quantification in the tail and trunk (Figure 6—source data 1). Proportions in the head pictures indicate the number of animals with phenotype shown over total number of animals examined. Scale bars represent and 25 μm. Statistical comparisons were done using one-tailed Welch’s t-tests. (C) Muscle marker collagen expression in the head and tail by FISH and quantification of collagen+ muscle cell number in a 190 μm x 125 μm area (white box) through the entire DV axis of head and tail tips (Figure 6—source data 2). Statistical comparisons were done using one-tailed Welch’s t-tests. Scale bars represent 150 μm. (D) EdU labeling and collagen FISH of 9 week control and nr4A(RNAi) animals (left) and quantification of the number of new muscle (EdU+; collagen+) cells in each of the numbered regions (matched by location and area) between control and nr4A(RNAi) animals (right) (Figure 6—source data 3). Statistical comparisons were done using two-tailed Welch’s t-test for cell counts in posterior head region and one-tailed Welch’s t-tests for cell counts in all other regions. Scale bars represent 150 μm. (E) Quantification of the number of new muscle (EdU+; collagen+) cells anterior to the eyes in control animals (blue), and anterior to the original eye pair (red) and to the posterior-most ectopic eye pair (yellow) in nr4A(RNAi) animals (Figure 6—source data 3). Statistical comparisons were done using Brown-Forsythe and Welch ANOVA tests with Dunnett’s T3 multiple comparisons test. n.s. = not significant at a level of 0.05 for all quantifications. All counting was performed blind. Areas imaged are indicated by the box in the cartoons on the left for all panels. All images are maximum intensity projections, and are representative of results seen in at least four animals per panel.
-
Figure 6—source data 1
Muscle fiber quantifications at 9 weeks of RNAi.
- https://doi.org/10.7554/eLife.42015.024
-
Figure 6—source data 2
Quantification of number of collagen+ muscle cells at the head tip and tail tip of 9 week RNAi animals, and at the head tip of 4 week RNAi animals.
- https://doi.org/10.7554/eLife.42015.025
-
Figure 6—source data 3
EdU+; collagen+ quantifications in the head, trunk, and tail.
- https://doi.org/10.7554/eLife.42015.026
Figure 6—figure supplement 1
Effects of nr4A inhibition on muscle fibers, total EdU incorporation, and apoptosis.
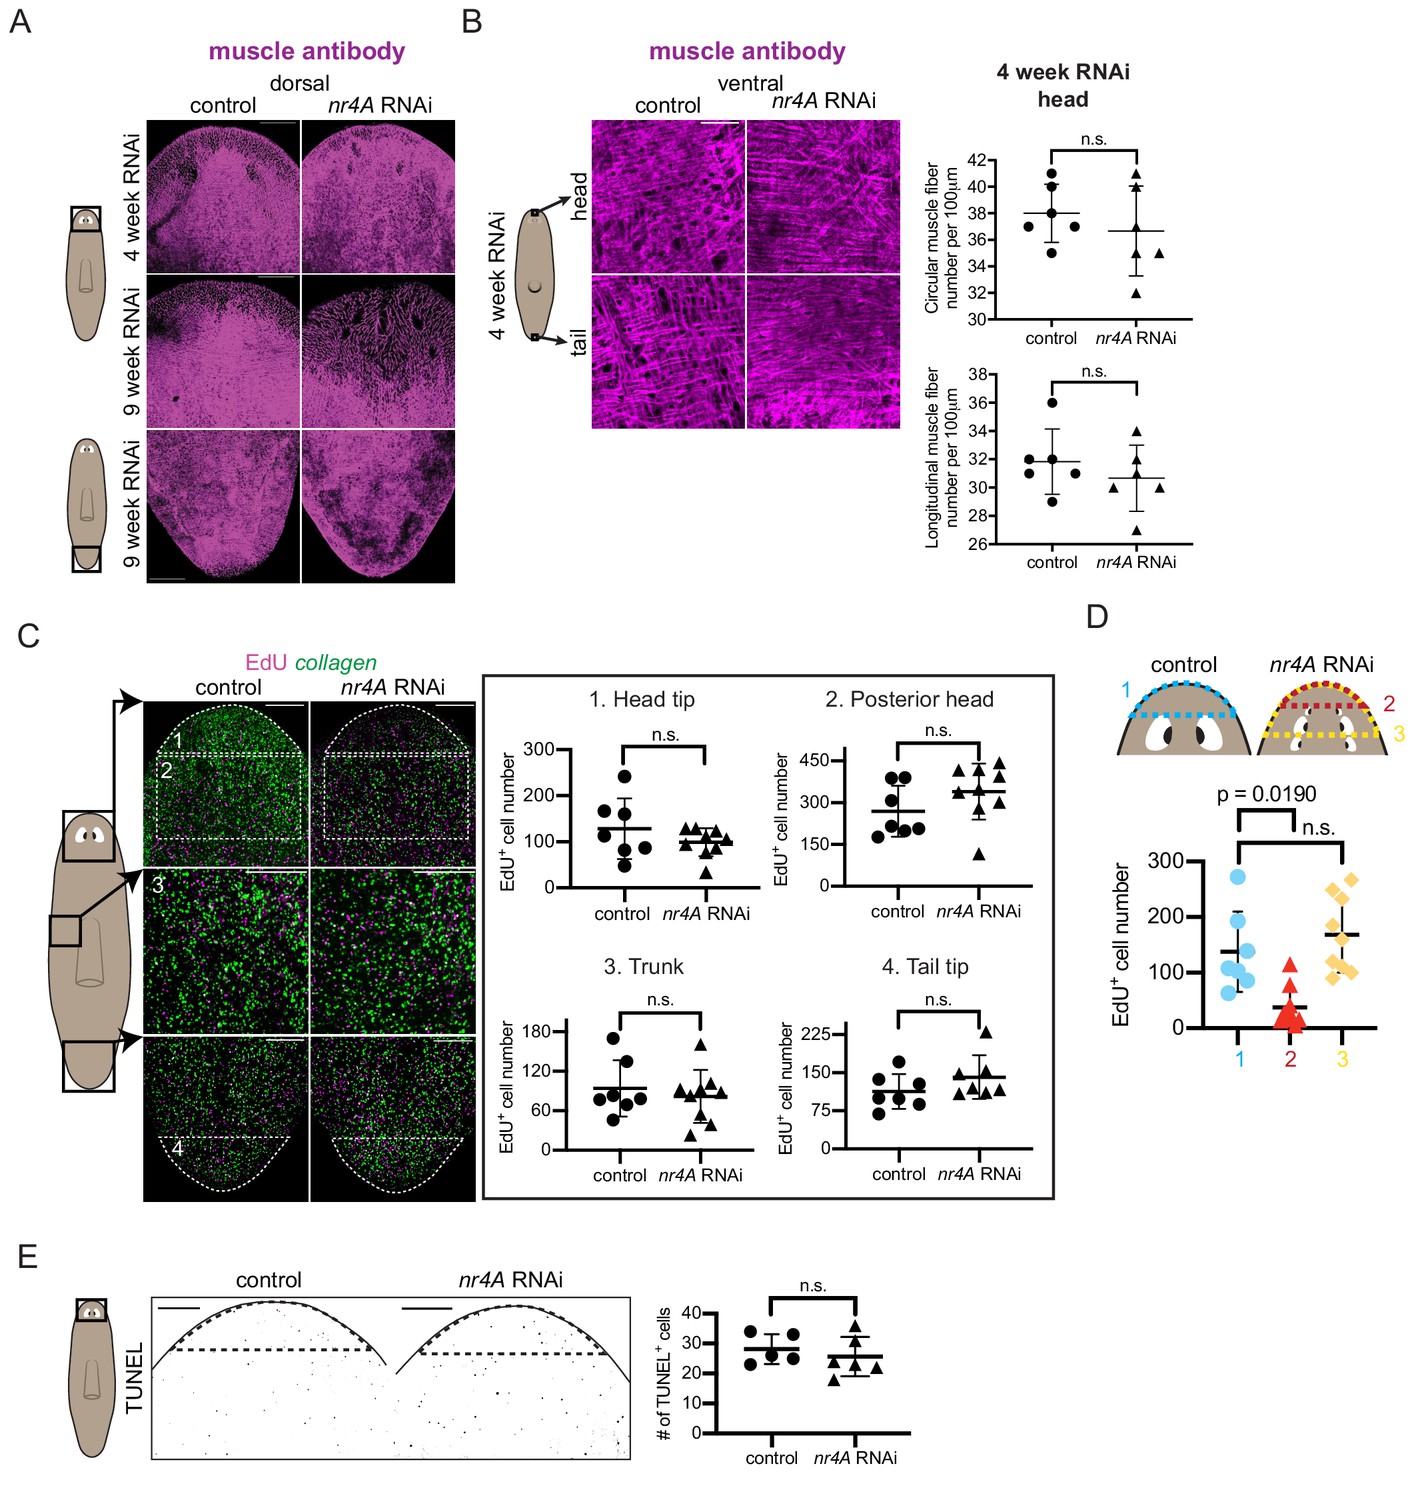
(A) Immunofluorescence with muscle antibody (6G10) of dorsal head and tail of control and nr4A(RNAi) animals. Scale bars represent 200 μm (B) Higher magnification view of muscle fibers in the ventral head and tail tip of RNAi animals and muscle fiber quantification (Figure 6—figure supplement 1—source data 1). Scale bars represent 25 μm. (C) EdU antibody staining and collagen FISH of 9 week control and nr4A(RNAi) animals (left) and quantification of the number of EdU+ cells in each of the numbered regions matched by area between control and nr4A(RNAi) animals (right) (Figure 6—figure supplement 1—source data 2). Statistical comparisons were done using one-tailed Welch’s t-tests for cell counts in head tip and trunk and two-tailed Welch’s t-tests for cell counts in posterior head and tail tip. Scale bars represent 150 μm. (D) Quantification of the number of EdU+ cells anterior to the eyes in control animals (blue), and anterior to the original eye pair (red) and to the posterior-most ectopic eye pair (yellow) in nr4A(RNAi) animals (Figure 6—figure supplement 1—source data 2). Statistical comparisons were done with Brown-Forsythe and Welch ANOVA tests with Dunnett’s T3 multiple comparisons test. (E) Staining of apoptotic cells with TUNEL and quantification of the number of TUNEL+ cells in equivalent head tip regions (by location and area, marked by dotted lines) through the entire DV axis (Figure 6—figure supplement 1—source data 3). Scale bars represent 150 μm. All statistical comparisons were done with one-tailed Welch’s t-tests unless otherwise specified. n.s. = not significant at a level of 0.05 for all quantifications. Areas imaged are indicated by the box in the cartoons on the left. Images are maximum intensity projections.
-
Figure 6—figure supplement 1—source data 1
Muscle fiber quantifications at 4 weeks of RNAi.
- https://doi.org/10.7554/eLife.42015.021
-
Figure 6—figure supplement 1—source data 2
EdU+ cell quantifications in the head, trunk, and tail.
- https://doi.org/10.7554/eLife.42015.022
-
Figure 6—figure supplement 1—source data 3
TUNEL+ cell quantifications in the head.
- https://doi.org/10.7554/eLife.42015.023
Figure 7 with 1 supplement
Changes in expression of head and tail PCGs precede changes in differentiated tissues in nr4A RNAi.
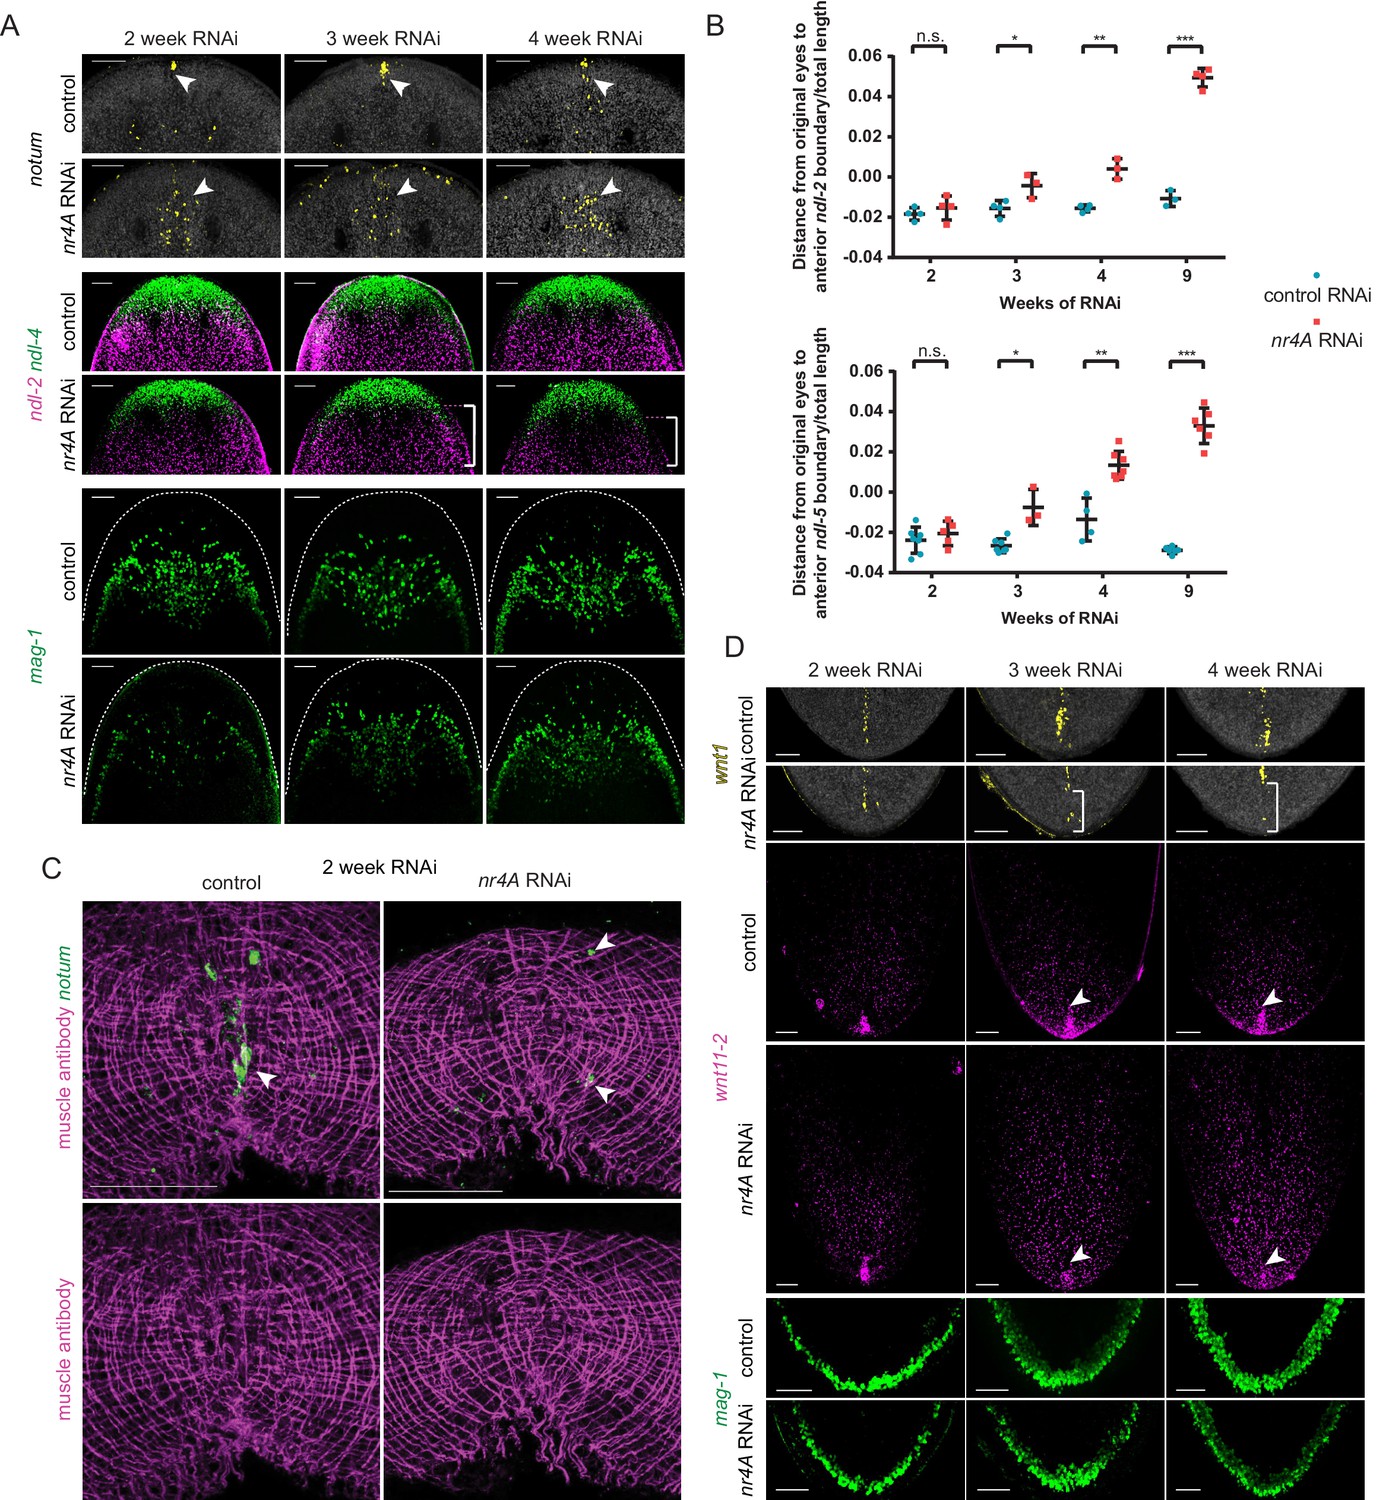
(A) Head PCG expression by FISH in animals at 2, 3, and 4 weeks of RNAi. Anterior pole cells are indicated by arrow heads. Posterior shifts of the anterior boundary of the ndl-2 expression domain are indicated by brackets. Quantification is shown in Supplementary file 1D. Scale bars represent 100 μm. (B) Quantification of ndl-2 (top) and ndl-5 (bottom) expression domain shifts in a nr4A(RNAi) time course. Statistical comparisons were done using one-tailed Welch’s t-tests. Negative and positive distances on y-axis denote that the position of the anterior boundary of expression domain is anterior and posterior to the eyes, respectively; n.s. = not significant at a level of 0.05. *=p < 0.05, **=p < 0.01, ***=p < 0.001. (C) Head-on view of head tips stained with muscle antibody 6G10 and notum probe at 2 weeks of RNAi. Anterior pole cells are indicated by arrow heads. Scale bars represent 50 μm. (D) Tail PCG expression by FISH in animals at 2, 3, and 4 weeks of RNAi. Anterior shifts in the posterior-most domain of wnt1+ posterior pole and the clustered expression domain of wnt11-2 at tail tip are indicated by brackets and arrow heads, respectively. Quantification is shown in Supplementary file 1D. Scale bars represent 100 μm. Images are maximum intensity projections. All images are representative of results seen in at least four animals per panel.
Figure 7—figure supplement 1
Shifts in PCG expression domains precede muscle fiber changes in nr4A RNAi.
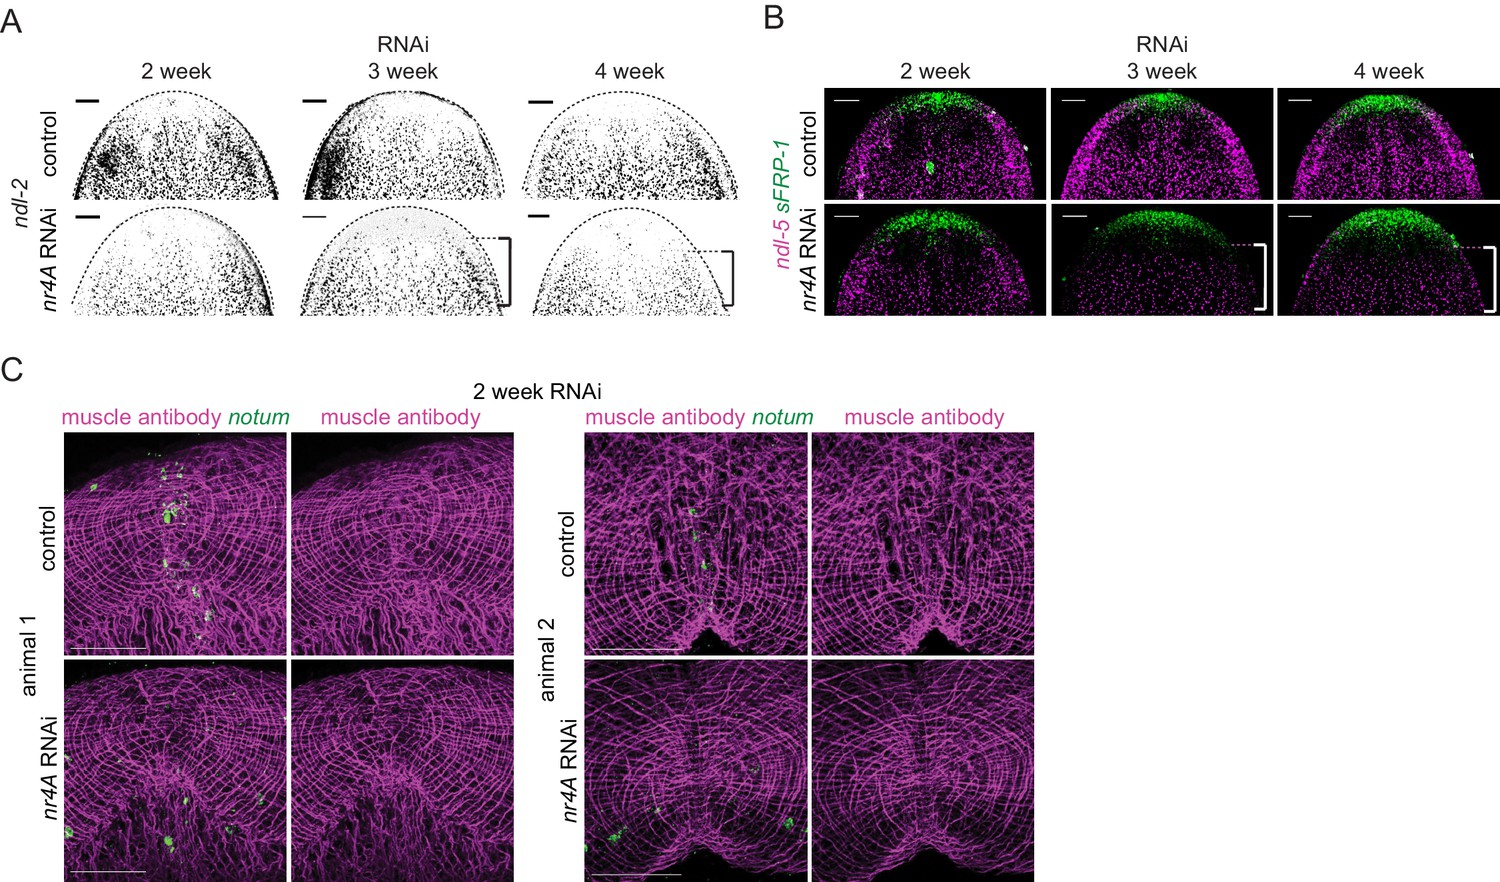
(A) ndl-2 expression by FISH in the heads of animals at 2, 3, and 4 weeks of RNAi corresponding to Figure 7A. The posterior shifts (brackets) of the anterior boundary of ndl-2 expression domain are more clearly seen in this single-channel representation. Quantification is shown in Supplementary file 1D. Anterior animal borders are marked by dotted arches. Scale bars represent 100 μm. (B) ndl-5 and sFRP-1 expression by FISH in the heads of animals at 2, 3, and 4 weeks of RNAi. Quantification is shown in Supplementary file 1D. Scale bars represent 100 μm. (C) Head-on view of the head tips of additional animals showing the loss of pole (notum+) cells from the apex of the head in nr4A RNAi, with muscle fibers (stained by muscle antibody 6G10) remaining unchanged compared with control. Scale bars represent 100 μm. Images are maximum intensity projections. Images are representative of results seen in at least four animals.
Figure 8 with 1 supplement
Anterior pole cells shift early and contribute to the head patterning phenotype in nr4A(RNAi) animals.
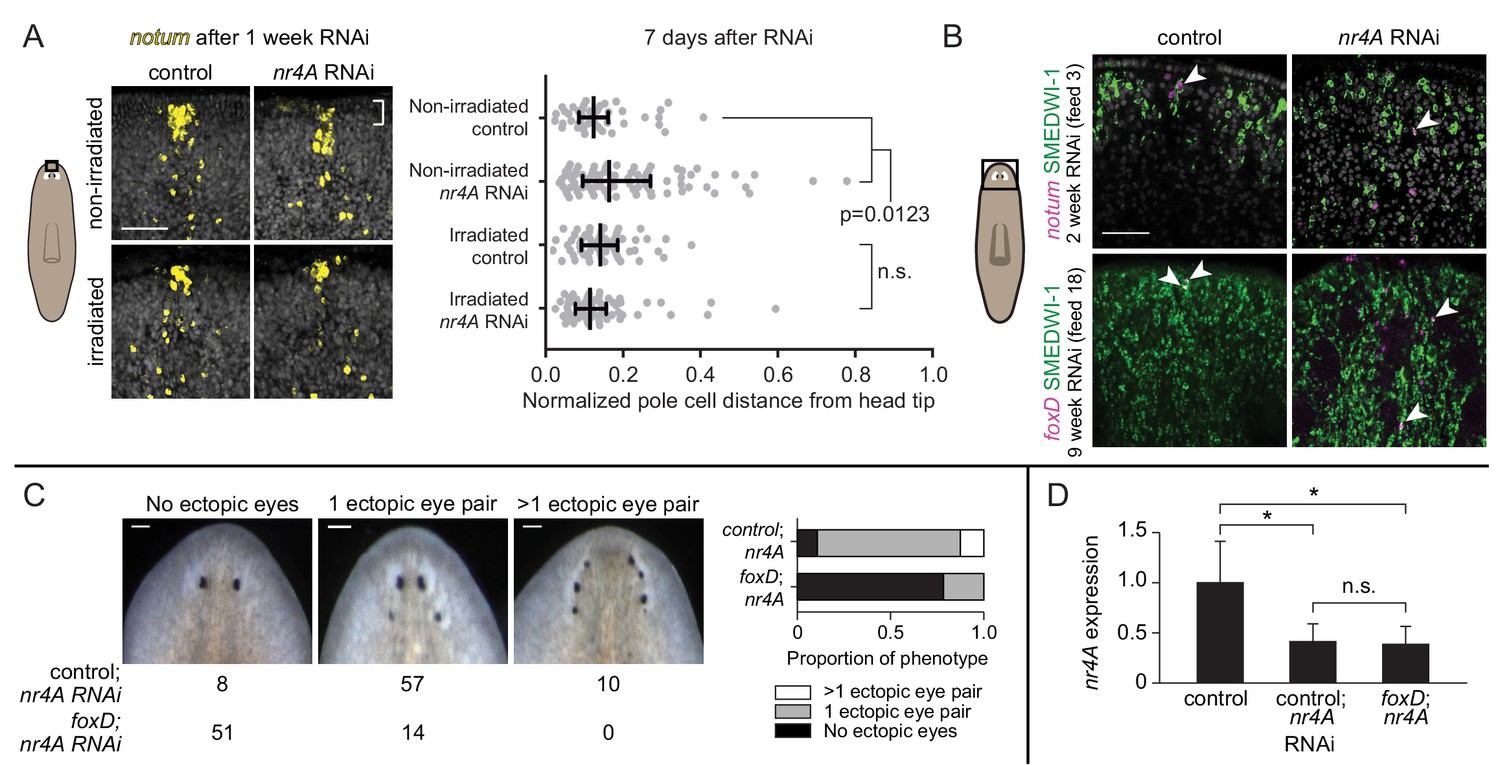
(A) Expression of notum by FISH in animals fixed 7 days after a single nr4A or control(RNAi) feeding and 8 days after lethal gamma irradiation. Distances of individual anterior pole cells to head apex were normalized to distances between the eyes within each animal (Figure 8—source data 1). Statistical comparisons were done with Kruskal-Wallis test with Dunn’s multiple comparisons test. Scale bar represents 50 μm. (B) FISH with notum or foxD probe and SMEDWI-1-antibody labeling in the head after 2 and 9 weeks of RNAi. Arrow heads indicate notum+; SMEDWI-1+ or foxD+; SMEDWI-1+ cells. Scale bar represents 50 μm. (C) foxD; nr4A double RNAi phenotype scoring. Representative live images of animals within each phenotypic category (no ectopic eyes, one ectopic eye pair, and more than one ectopic eye pair) are shown. Numbers of animals with each phenotype in control; nr4A and foxD; nr4A RNAi are displayed below, with graphic representation of phenotype proportions on the right. Differences in the number of animals seen in each phenotypic category between control; nr4A and foxD; nr4A RNAi were statistically significant (chi-squared = 67, p<0.00001, df = 2). Scale bars represent 150 μm. (D) qPCR quantification of nr4A expression in control, control; nr4A, and foxD; nr4A RNAi in uninjured animals. Statistical comparisons were done with Brown-Forsythe and Welch ANOVA tests with Dunnett’s T3 multiple comparisons test. * = p<0.05. n.s. = not significant at a level of 0.05 for all quantifications. Area imaged is indicated by the box in the cartoon on the left for panels A and B. All images are representative of results seen in at least four animals per panel.
-
Figure 8—source data 1
Quantification of anterior pole cell distance from head apex, normalized to inter-eye distance in each animal.
- https://doi.org/10.7554/eLife.42015.031
Figure 8—figure supplement 1
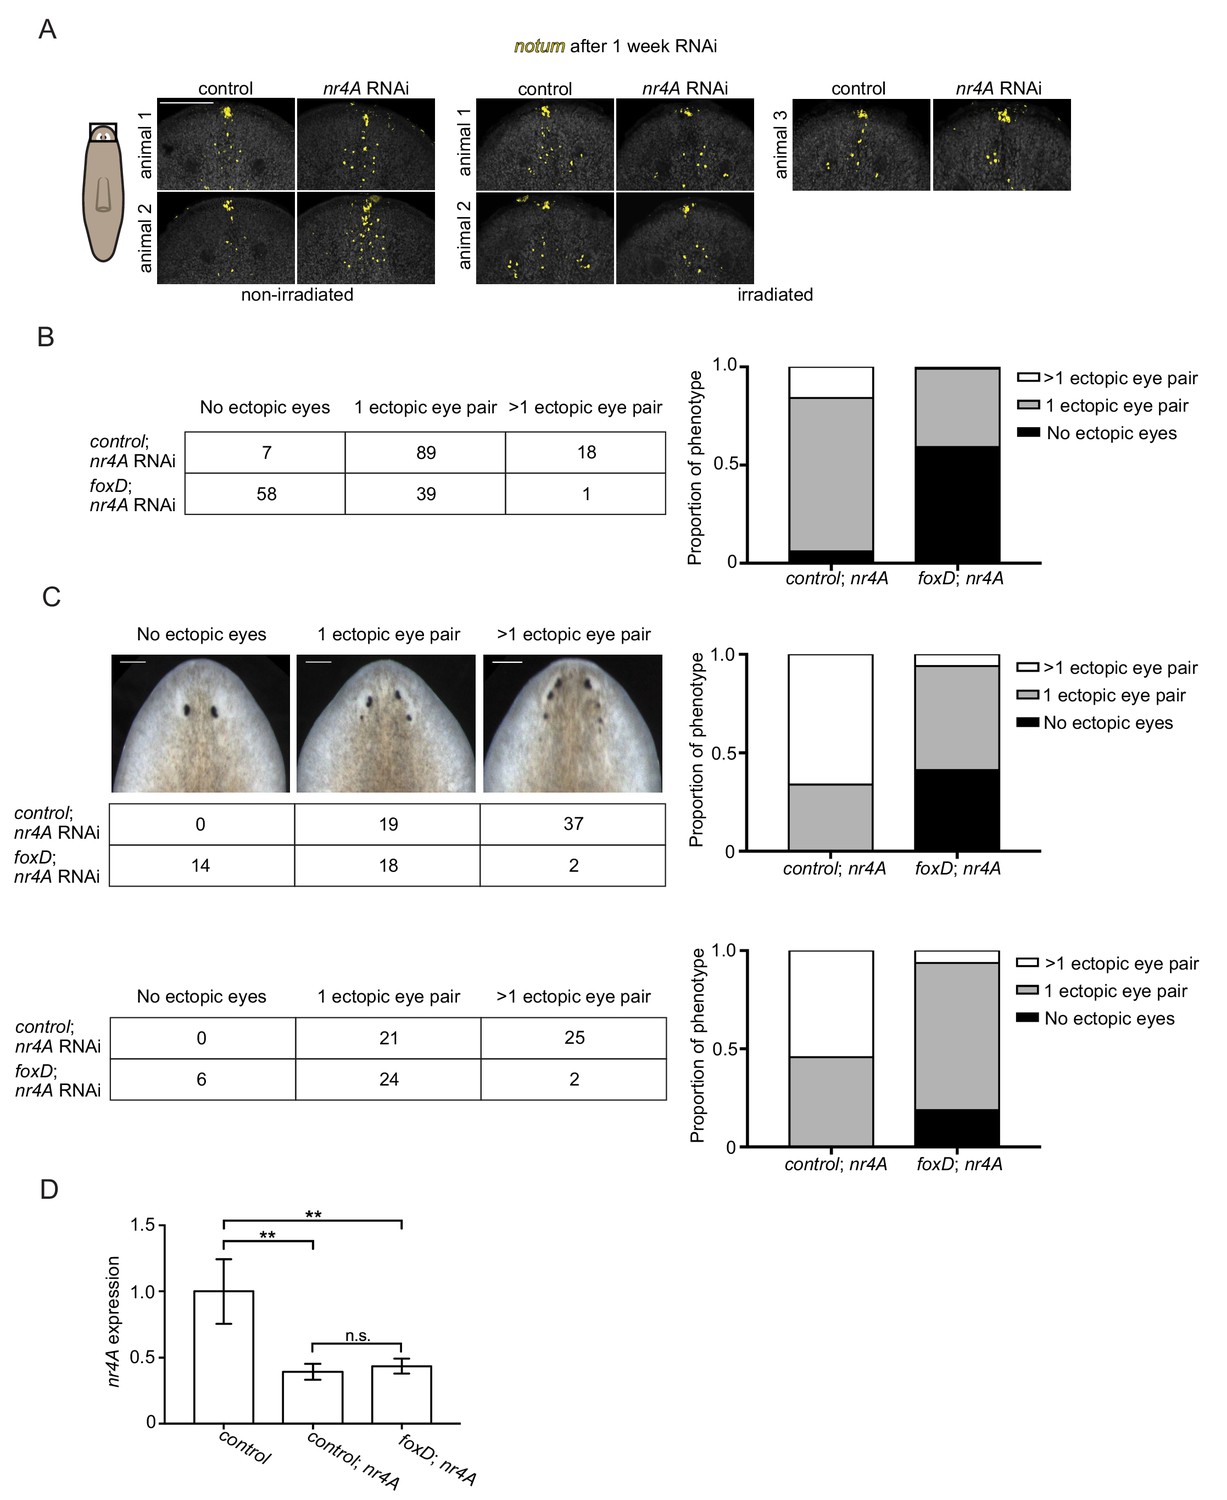
Anterior pole shift, a neoblast-dependent process, is important for ectopic eye formation in nr4A RNAi.
(A) Early anterior pole shift in nr4A RNAi is repressed by irradiation. Additional representative images of notum expression by fluorescence in situ hybridization in animals fixed 7 days after a single nr4A or control(RNAi) feeding and 8 days after lethal gamma irradiation. Area imaged is indicated by the box in the cartoon on the left. Scale bar represents 100 μm. (B) Biological replicate of foxD; nr4A double RNAi in uninjured animals. Table shows numbers of animals seen in each phenotypic category (no ectopic eyes, one ectopic eye pair, and more than one ectopic eye pair) in each of the double RNAi groups (control; nr4A and foxD; nr4A RNAi), with graphic representation on the right. Differences in the number of animals seen in each phenotypic category between control; nr4A and foxD; nr4A RNAi were statistically significant (chi-squared = 74, p<0.00001). (C) foxD; nr4A double RNAi phenotype scoring in animals with anterior poles excised prior to initiation of nr4A RNAi. Representative live images of animals within each phenotypic category are shown. Numbers of animals with each phenotype are tabulated below, with graphic representation of the proportion of each phenotype on the right. Differences in the number of animals seen in each phenotypic category between control; nr4A and foxD; nr4A RNAi were statistically significant (chi-squared = 43, p<0.00001). Scale bars represent 150 μm. Biological replicate is shown below (chi-squared = 24, p<0.00001). (D) qPCR quantification of nr4A expression in control, control; nr4A, and foxD; nr4A RNAi in animals with anterior poles excised prior to initiation of nr4A RNAi. Statistical comparisons were done with Brown-Forsythe and Welch ANOVA tests with Dunnett’s T3 multiple comparisons test. ** = p<0.005. n.s. = not significant at a level of 0.05. Images are representative of results seen in at least four animals per panel.
Figure 9 with 1 supplement
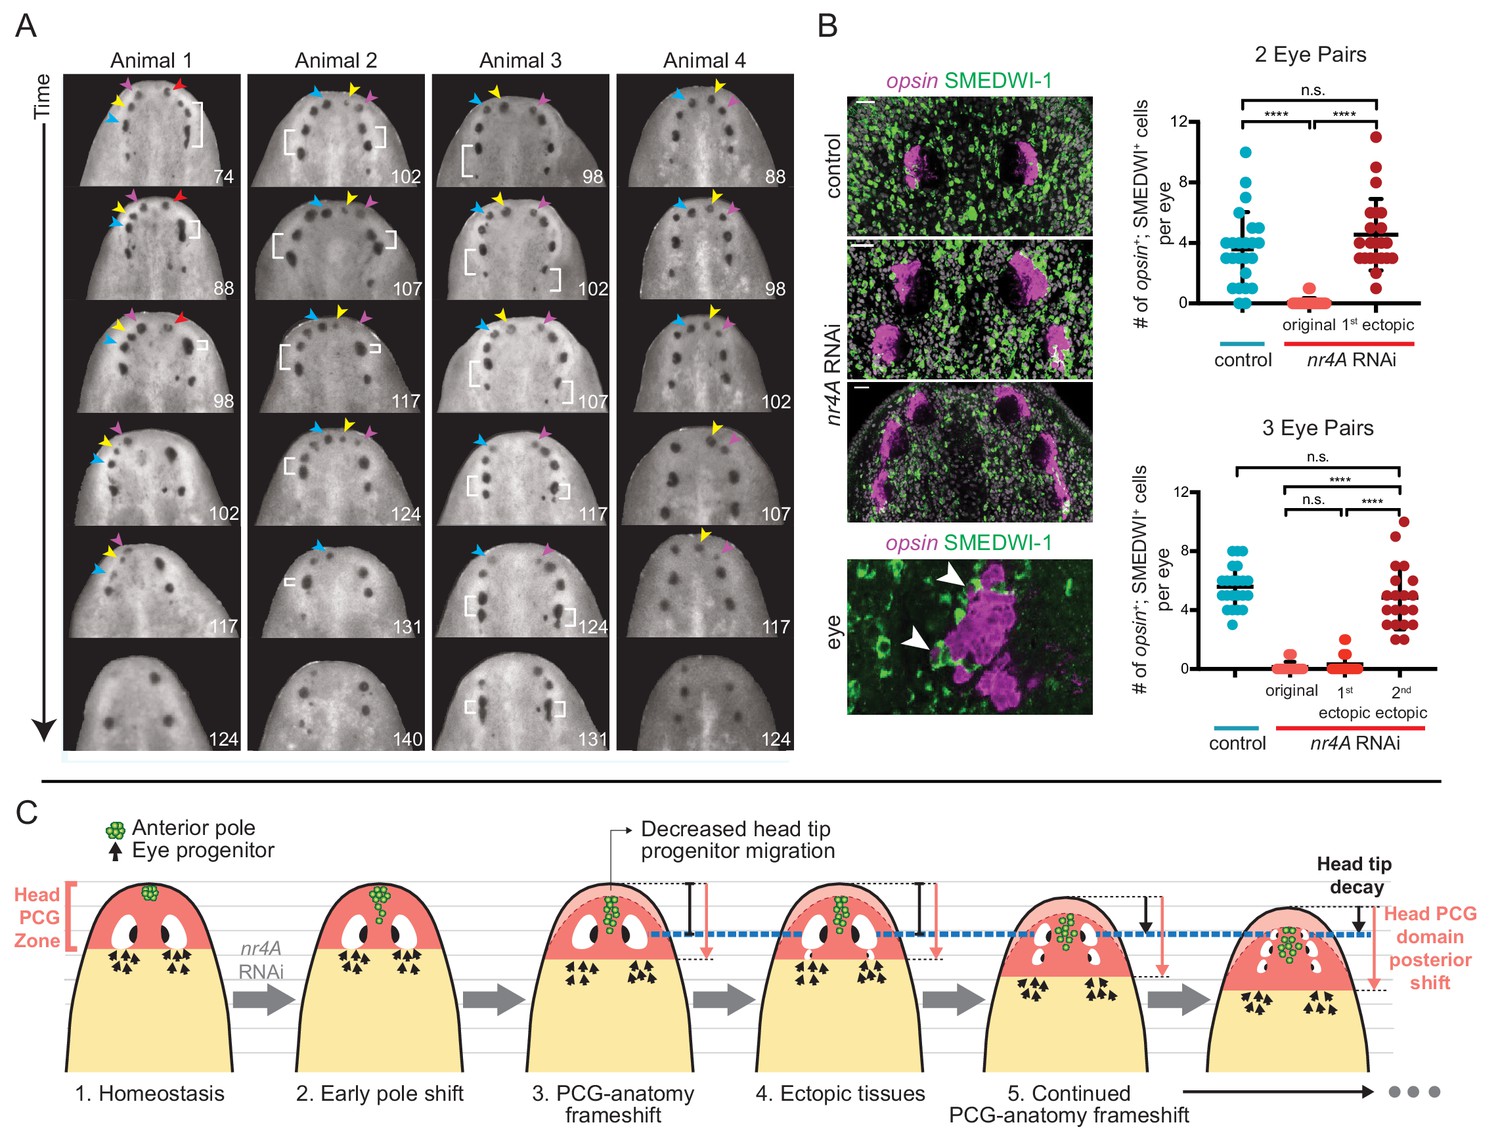
nr4A RNAi leads to patterning that fails to reach a stable state.
(A) Disappearance and fusion of eyes after many weeks of nr4A RNAi. Single animals were separated and individually imaged over the course of long-term nr4A RNAi. The number of days of RNAi at the time image was taken is at the bottom right of each image. Eyes crowded near the head tip in nr4A(RNAi) animals were observed to disappear (colored arrow heads in frames in which they appear) or fuse (white brackets). (B) Progenitor incorporation into the eyes of RNAi animals. Newly incorporated (opsin+; SMEDWI-1+) cells in each eye were quantified in control, 2-eye-pair nr4A(RNAi) animals, and 3-eye-pair nr4A(RNAi) animals (Figure 9—source data 1), with representative images of the eyes in each group of animals shown. A magnified image of an eye with opsin+; SMEDWI-1+ cells (arrow heads) is shown at the bottom. Double-positive cells were included in the count if located within the eye itself or within approximately one cell diameter of the eye. Statistical comparisons were done with Brown-Forsythe and Welch ANOVA tests with Dunnett’s T3 multiple comparisons test. n.s. = not significant at a level of 0.05. **** = p<0.0001. (C) nr4A(RNAi) phenotype model (animals aligned by the position of the original eyes, marked by the blue dotted line): nr4A RNAi causes an early posterior shift in anterior pole (green) cells followed by a similar shift in other head PCG domains (red zone), and formation of new tissues at ectopically posterior positions with respect to the original anatomy (e.g., posterior ectopic eyes). As PCG domains continue to shift in relation to anatomy, this process continues iteratively throughout nr4A inhibition. Refer to Discussion for a more detailed description.
-
Figure 9—source data 1
SMEDWI-1+; opsin+ cell quantification in eyes of control and nr4A(RNAi) animals.
- https://doi.org/10.7554/eLife.42015.034
Figure 9—figure supplement 1
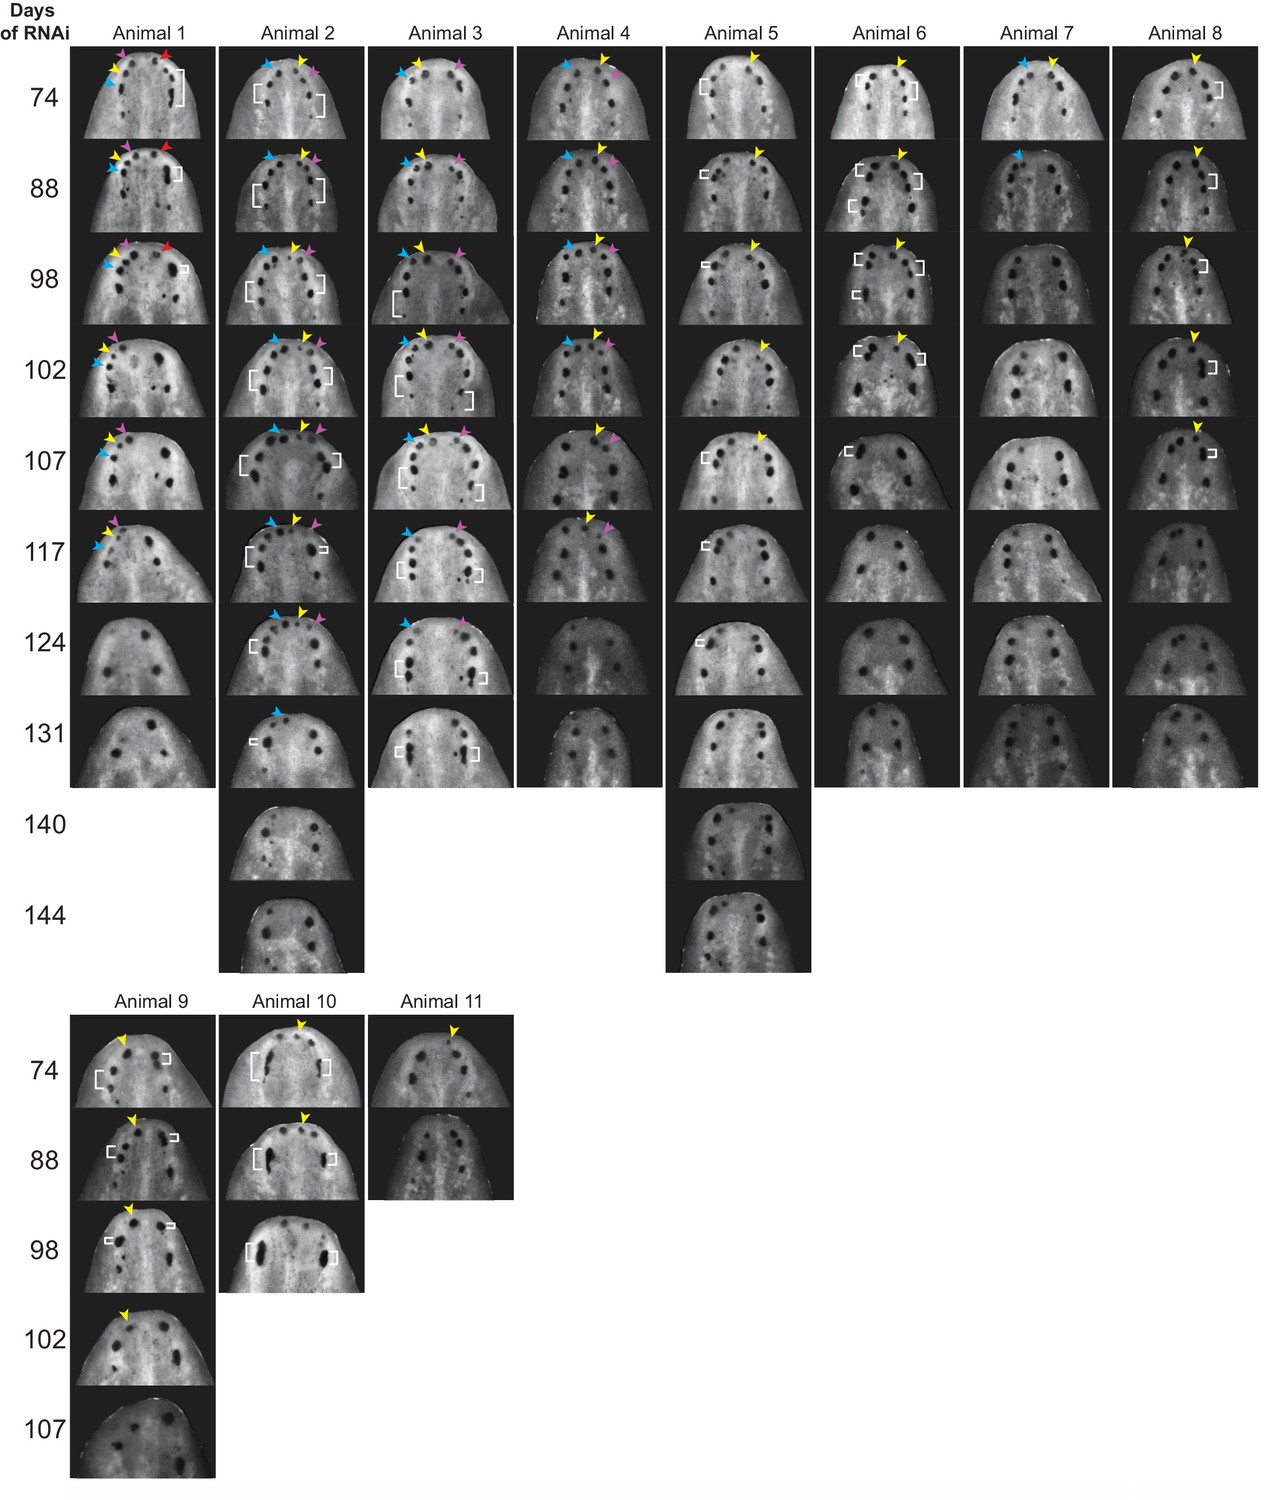
Anterior eyes disappear and fuse in long-term nr4A RNAi.
Time course of long-term nr4A RNAi cataloging instances of eye disappearance and fusion. Single nr4A(RNAi) animals were separated and individually imaged over time. Eyes crowded near the head tip in nr4A(RNAi) animals were observed to disappear (colored arrow heads in frames in which they appear) or fuse (white brackets).
Videos
Video 1
Magnified image stack showing dd950(vim) expression (magenta) and epidermal nuclei (DAPI, gray) in control animal head by FISH.
https://doi.org/10.7554/eLife.42015.017
Video 2
Magnified image stack showing dd950(vim) expression (magenta) and epidermal nuclei (DAPI, gray) in nr4A(RNAi) animal head by FISH.
https://doi.org/10.7554/eLife.42015.018Tables
Key resources table
| Reagent type (species) or resource | Designation | Source or reference | Identifiers | Additional information |
|---|---|---|---|---|
| Gene (Schmidtea mediterranea) | nr4A; dd_9565 (col21a1); dd_3902 (mmp19); dd_2972; dd_11683 (ca12); dd_508; dd_950 (vim); dd_9677 (pcdh11y); dd_1706 (psapl1); dd_2736 (hspb1); dd_11601 (qki) | This paper | RRID: NCBITaxon:79327 | New Schmidtea mediterranea genes (nr4A and nr4A-regulated genes) cloned in this paper. See Supplementary file 1F for primer sequences. |
| Strain, strain background (ClW4 clonal line) | Asexual strain of Schmidtea mediterranea | NA | RRID: NCBITaxon:79327 | All animals used in this study |
| Antibody | rabbit anti-SMEDWI-1 polyclonal antibody | Guo et al., 2006 | RRID: AB_2797418 | 1:1000 dilution |
| Antibody | anti-muscle mouse monoclonal 6G10 | Ross et al., 2015 (DSHB Hybridoma Product 6G10-2C7) | RRID: AB_2619613 | 1:1000 dilution, antibody used for muscle fiber staining |
| Commercial assay or kit | TruSeq RNA Library Prep Kit V2 | Illumina | RS-122–2001, RS-122–2002 | Used for bulk RNA sequencing |
| Commercial assay or kit | Nextera XT DNA Library Preparation Kit | Illumina | FC-131–1002 | Used for single-cell RNA sequencing DNA library construction |
| Commercial assay or kit | ApopTag Red In Situ Apoptosis Detection Kit | Millipore | S7165 | Used for TUNEL staining |
| Chemical compound, drug | F-ara-EdU | Sigma-Aldrich | T511293 | Used for EdU labeling |
| Software, algorithm | Prism 8 | GraphPad | RRID: SCR_002798 | Used for all statistical analyses |
| Software, algorithm | Fiji/ImageJ | NIH, public | RRID: SCR_002285 | Used for all image contrast adjustment and cell, muscle fiber, and PCG domain quantification |
| Software, algorithm | SCDE | Kharchenko et al., 2014 | RRID: SCR_015952 | Used in single-cell RNA sequencing differential expression analysis |
| Software, algorithm | DESeq | Anders and Huber, 2010 | RRID: SCR_000154 | Used in bulk RNA sequencing differential expression analysis |
| Software, algorithm | MacVector | MacVector, Inc | RRID: SCR_015700 | Used to align protein sequences |
| Software, algorithm | ClustalX | Clustal | RRID: SCR_017055 | Used to create .phy protein sequence alignment files |
Additional files
-
Supplementary file 1
Summary of data from bulk RNA sequencing, single-cell RNA sequencing, PCG domain quantifications, nr4A RNAi target screen, and phylogenetic analysis.
(A) Anterior-pole-enriched genes in uninjured animals. (B) Anterior-pole-enriched genes in anterior blastema of 72hpa trunks. (C) Posterior-pole-enriched genes from single-cell sequencing. (D) Quantification of PCG and mag-1 domain shifts in nr4A vs. control RNAi. (E) nr4A+ muscle vs. nr4A- muscle SCDE. (F) Primers used to clone nr4A and its target genes, and qPCR primers. (G) Nuclear receptor proteins and their accession numbers used in phylogenetic analysis.
- https://doi.org/10.7554/eLife.42015.035
-
Transparent reporting form
- https://doi.org/10.7554/eLife.42015.036
Download links
A two-part list of links to download the article, or parts of the article, in various formats.
Downloads (link to download the article as PDF)
Open citations (links to open the citations from this article in various online reference manager services)
Cite this article (links to download the citations from this article in formats compatible with various reference manager tools)
Nuclear receptor NR4A is required for patterning at the ends of the planarian anterior-posterior axis
eLife 8:e42015.
https://doi.org/10.7554/eLife.42015


