The impact of pathological high-frequency oscillations on hippocampal network activity in rats with chronic epilepsy
- University of California, San Diego, United States
- University of Bonn Medical Center, Germany
- Ludwig-Maximilians-Universität München, Germany
- Berstein Center for Computational Neuroscience Munich, Germany
Figures
Figure 1 with 2 supplements

High-frequency oscillations in animals with epilepsy compared to control animals.
(A) Each recording session consisted of a sequence of rest epochs (grey blocks) and foraging epochs (white blocks). Rats were placed in either circular (diameter = 1 meter, pictured) or square (0.8 x 0.8 meters) open arenas for foraging and in a plexiglass holding box (0.2 × 0.2 meters) adjacent to the open arena for rest. (B) Example high-frequency oscillations recorded from the CA1 cell layer of a control rat during rest and foraging. Each line of the heat map corresponds to a 100 ms voltage trace of a high-frequency oscillatory event, high-pass filtered, and centered on its peak voltage amplitude. Positive and negative voltages are represented on a color scale (bottom). Three example voltage traces are shown to the left, and see Figure – Supplement1 for more examples. (C) The same as (B), but recorded from the CA1 cell layer of a rat with chronic epilepsy. (D) For each recording session that had at least 20 high-frequency events (n = 4 control, n = 12 epileptic), the coefficient of variability was calculated for the distribution of peak voltage amplitudes associated with each high-frequency oscillation. *, p ≤ 0.05, Wilcoxon Rank Sum test.
Figure 1—figure supplement 1
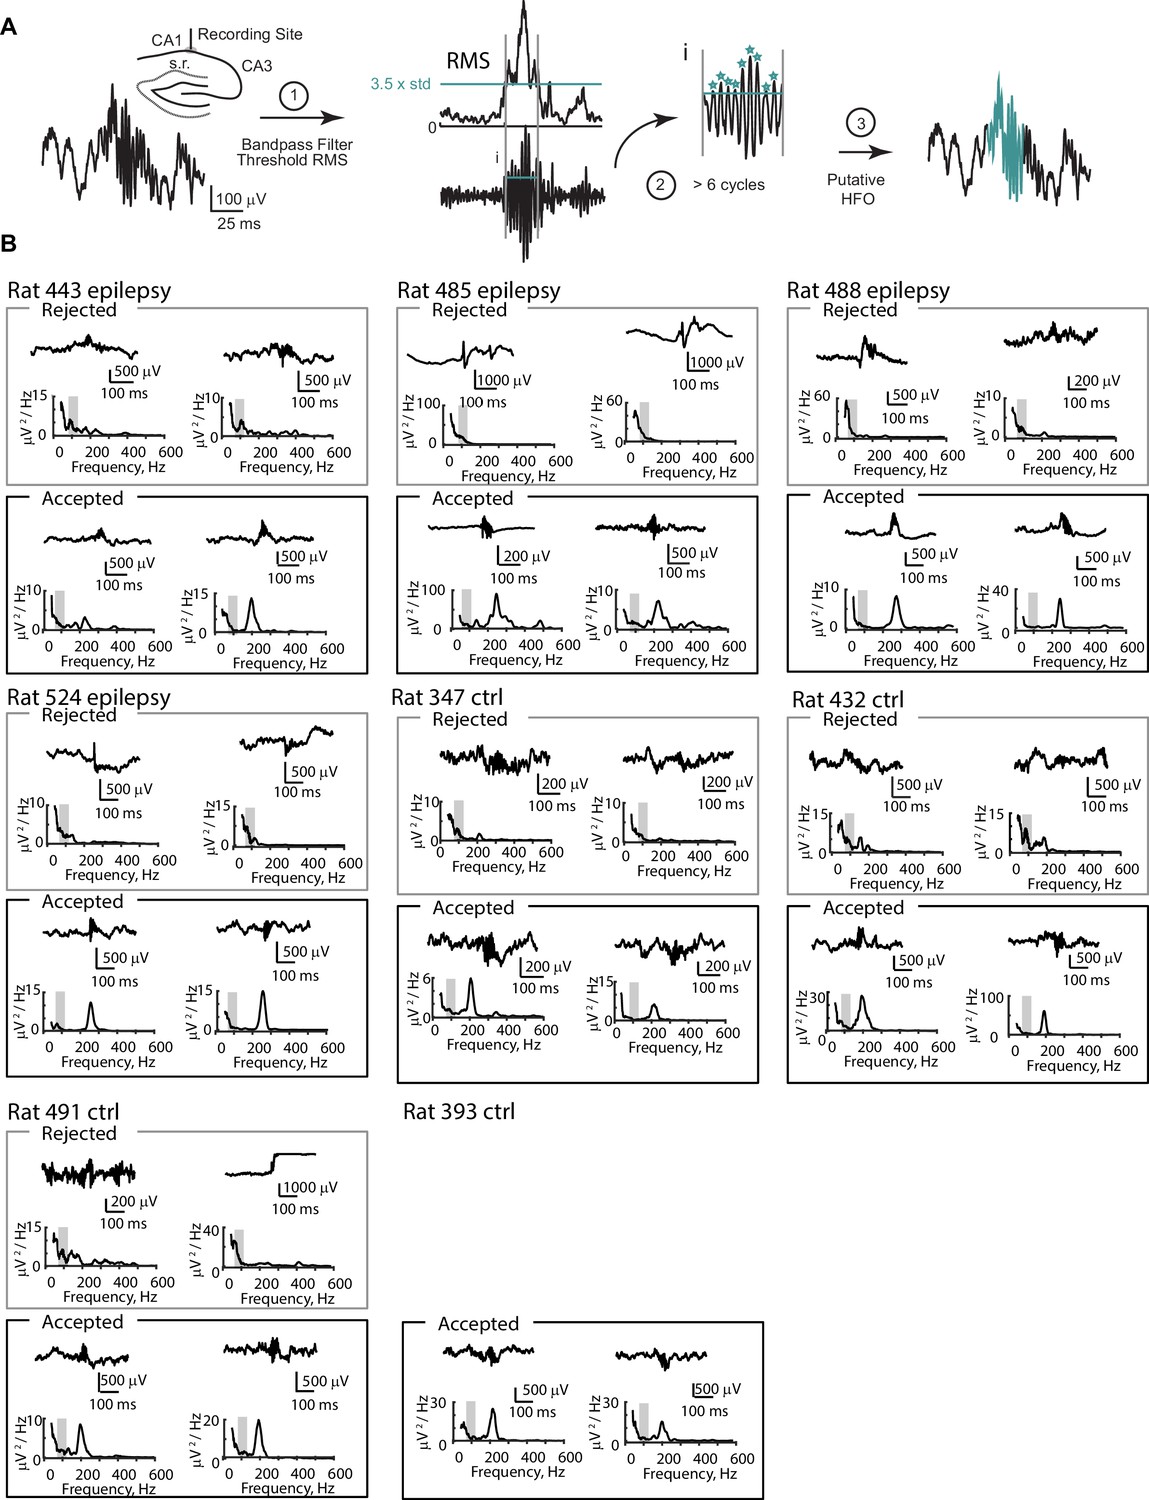
Detection criteria for high-frequency oscillations (HFO).
(A) LFP recordings from the CA1 cell layer were bandpass filtered and putative HFO events were detected when the RMS surpassed 3.5 standard deviations (step 1) and when the event had at least five cycles (step 2). (B) As a third step to confirm that HFOs were not misidentified as fast gamma rhythm or a noise artifact, putative HFOs were either accepted or rejected based on peak frequency of the power spectrum. Events were only accepted if the peak power at frequencies greater than 150 Hz was higher than the peak power from 75 to 125 Hz (shaded grey region). For each animal included in the study, two rejected and two accepted events are depicted, except for rat 393, in which all putative events were accepted.
Figure 1—figure supplement 2
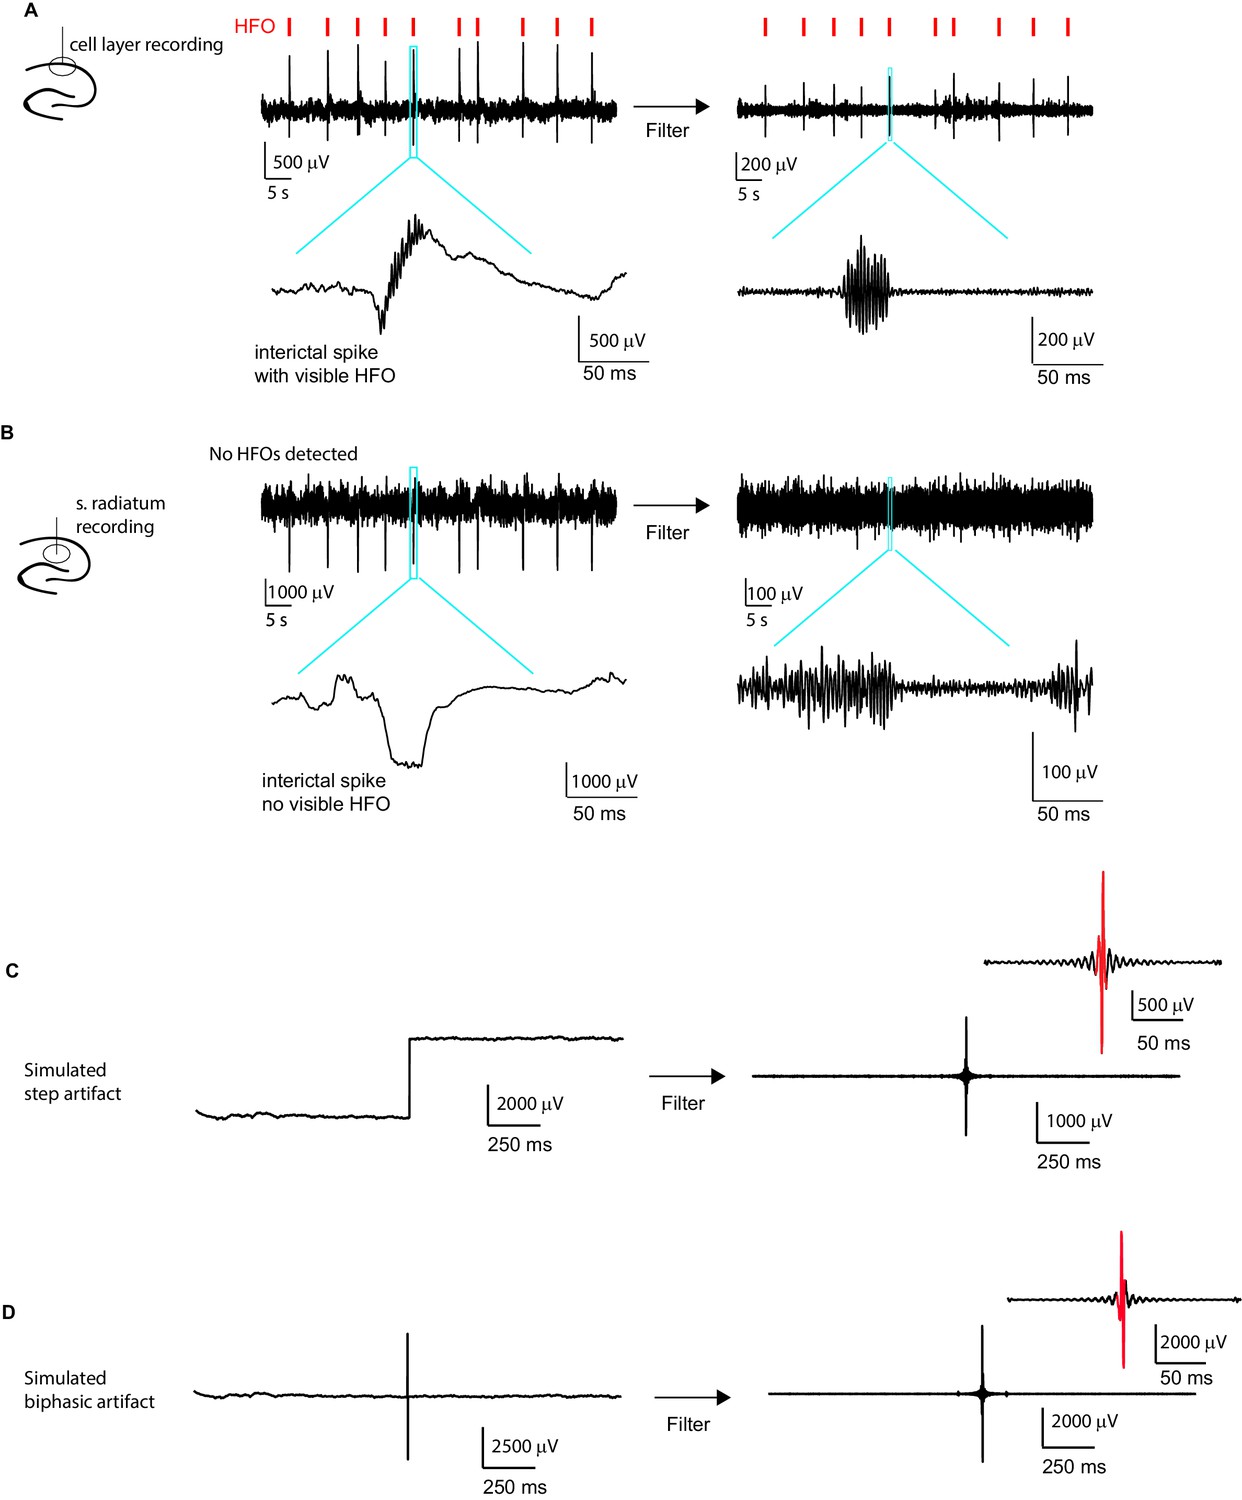
Interictal spikes and noise artifacts are not detected as high frequency oscillations (HFO).
A Example LFP recording from the CA1 cell layer of an epileptic animal. Signals detected as HFOs (see methods section) are indicated by red tick marks on top. An example of a single event (blue box) is enlarged below to show the HFO co-occurring with the interictal spike. As the first step of HFO detection, the trace was filtered (shown to the right), and a clear high-frequency oscillatory signal is seen in the enlarged version of the same event as shown on the left. (B) LFP from stratum radiatum recorded simultaneously with the signal in the cell layer shown in (A). Note that at this recording location, the interictal spikes are larger in amplitude than in (A) and do not contain detectable HFOs (note absence of red tick marks). To confirm that HFO detection in the filtered signal cannot be attributed to ringing of the filter in response to the large interictal spikes, the same analysis as in (A) is performed on the large interictal spikes. Importantly, filtering this signal, as shown to the right, did not introduce false HFOs. (C) Simulated step artifact. A 4000 μV signal was added to the second half of a LFP trace recorded from the CA1 cell layer. Filtering this signal introduced oscillation events (right), but there were not a sufficient number of large amplitude cycles to cause the signal to be classified as an HFO event (cycles larger than threshold shown in red). (D) Similarly, when introducing a biphasic artifact (−3000 μV to 3000 μV), a false oscillation was introduced after filtering, but again the oscillation was not detected as a HFO event as it did not reach our criteria for number of large amplitude cycles (see Materials and methods section).
Figure 2 with 1 supplement
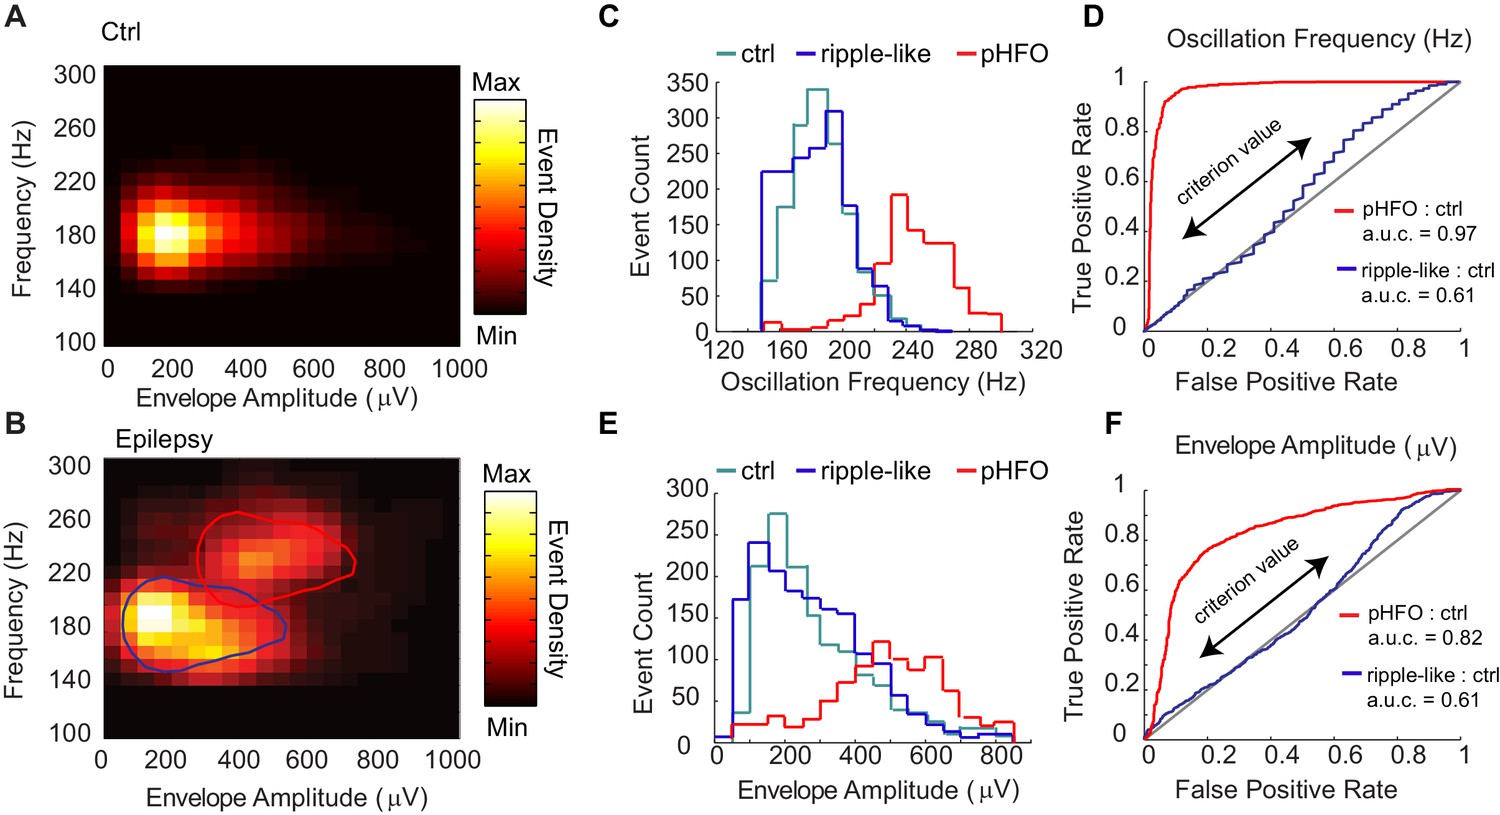
Classification of two types of high-frequency oscillations in animals with epilepsy.
A Density plot of high-frequency oscillations (HFOs) recorded from all sessions in control rats (n = 4 rats, n = 4 sessions). All events were characterized by a single cluster of similar frequency and envelope amplitude. (B) Density plot of HFOs from all sessions recorded from epileptic rats (n = 4 rats, n = 12 sessions). In animals with epilepsy, two clusters are present, one characterized by envelope amplitudes and frequencies that resemble control ripples (circled in blue), and the other characterized by higher frequencies and larger envelope amplitudes (circled in red), and see Figure – Supplement1 A-C. (C) Distribution of the oscillation frequencies for control ripples (cyan, n = 1414), and in animals with epilepsy (blue and red). The two distributions for animals with epilepsy were separated by clustering the data presented in (B), and see Figure – Supplement1D for display of individual animals. Note that the blue population overlaps with control ripples and is thus referred to as ‘ripple-like’ (n = 1616). The red population is separate from control ripples and is thus referred to as ‘pathological HFOs (pHFO)’ (n = 923). (D) The separation (or not) of each cluster in epileptic animals from control ripples is confirmed analytically using a binary classifier and plotted in a Receiver Operator Curve. True positive and false positive rates are plotted with the range of oscillation frequencies used as criteria values (see Materials and methods for more detail). (E, F) The same as (C, D), but for envelope amplitude rather than oscillation frequency.
Figure 2—figure supplement 1
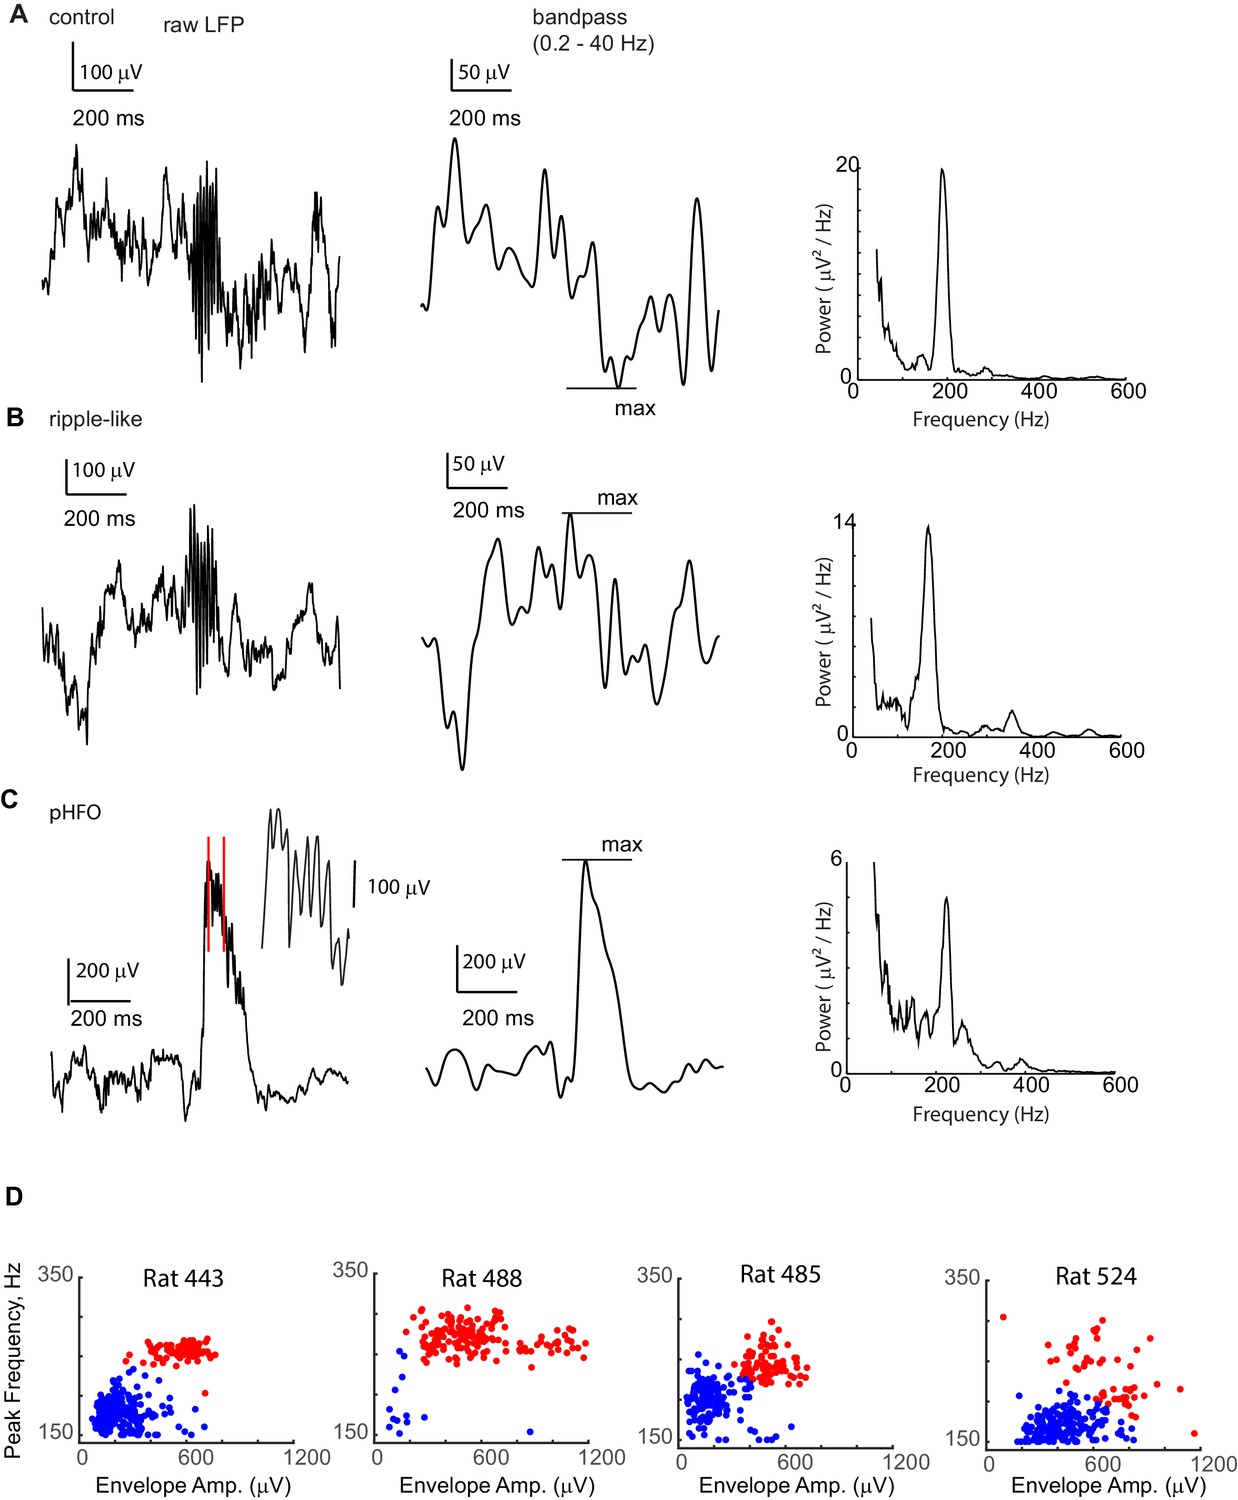
pHFO and ripple-like events are both present in each of the chronically epileptic animals.
A Example ‘ripple’ event recorded from the CA1 cell layer of a control animal. Left: The raw LFP is shown. Middle: To calculate the amplitude of the envelope (the simultaneously occurring voltage deflection, which in control animals is called the ‘sharp wave’), the LFP window around the event was band-pass filtered between 0.2 Hz and 40 Hz, and the maximum absolute amplitude of the filtered data was taken. Right: To determine the ‘peak frequency’ the peak in power spectrum at frequencies higher than 150 Hz was selected. (B) Example ‘ripple-like’ event recorded from the CA1 cell layer of an epileptic animal. (C) Example ‘pHFO’ event recorded from the same recording site in the CA1 cell layer of the same animal as in (B). (B) and (C) confirm that both ‘ripple-like’ and pHFO events can be generated by the same hippocampal network. (D) Envelope amplitude vs. frequency plots for high-frequency oscillations recorded in each animal with chronic epilepsy. For each epileptic rat, events from one recording session recorded from a tetrode located in the CA1 layer. Each event is represented by a dot, color coded based on whether they belong to the ripple-like cluster (blue) or pHFO cluster (red), confirming that both types of events are present in individual animals.
Figure 3 with 1 supplement

pHFOs occurred during movement-associated theta rhythm.
(A) Cumulative distributions of the running speed at times when a high-frequency oscillation occurred. All data were recorded from behavioral sessions when animals were foraging for food reward and when position and running speed were tracked (n = 691 control ripple, n = 293 ripple-like, n = 490 pHFO). *, p ≤ 0.05, Kruskal-Wallis ANOVA. Control ripple (cyan) and ripple-like (blue) events occur primarily when animals were not moving while pHFOs (red) occurred at all running speeds. (B) Event rates for control ripple (cyan), ripple-like (blue), and pHFOs (red) plotted as a function of time spent in the rest box or time spent at each running speed recorded during foraging experiments. Behavior during recordings in the rest box comprised a mixture of mobile and rest behavior. (C) Top, LFP recorded in stratum radiatum around the time of a pHFO/interictal spike event. The time frequency plot over the four seconds around the event is characterized by strong theta rhythm leading up to the event and a reduction in theta power after the event. Red parallel lines denote the LFP window that was clipped to remove the large interictal spike before wavelet analysis was performed. Bottom, the running speed of the animal plotted over the corresponding four seconds. See Figure 3—figure supplement 1 for theta phase analysis. (D) LFP and running speed around pHFOs that occurred when animals were running at speeds ≥ 5 cm/s were examined for modulation (n = 231). The distributions of the change in theta power (top) or running speed (bottom) compared to baseline (BL) are plotted for the periods before and after interictal events. Time windows are defined as shown by the black boxes in (C). ***, p ≤ 0.001, Wilcoxon Sign Rank test.
Figure 3—figure supplement 1
pHFOs occur at distinct theta phases unique for each animal.
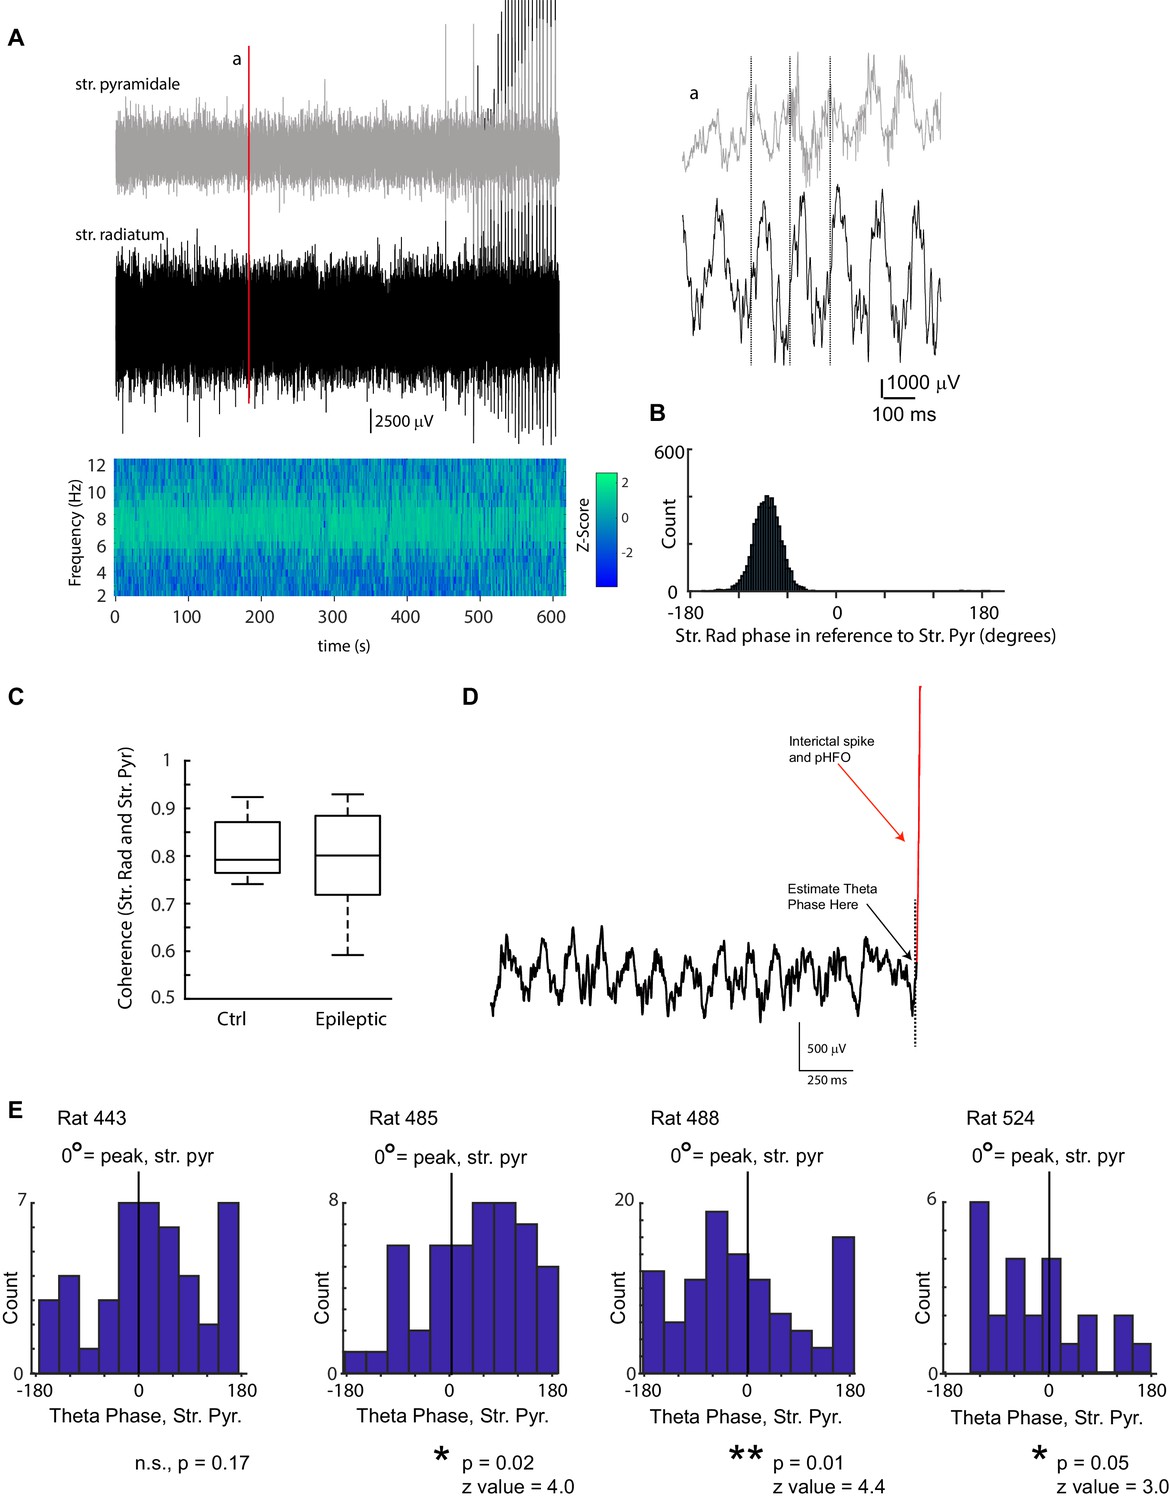
A LFP traces simultaneously recorded from stratum pyramidale (grey) and stratum radiatum (black) from an epileptic rat during a 10-min foraging session. The coherence between the two recorded sites is plotted below. The strongest coherence was observed in the theta band (7 Hz in this case). Note that toward the end of the recording, interictal spikes (which were associated with pHFO) were observed. Several hundred milliseconds of the two traces are enlarged in (a) to illustrate the prominence of theta rhythm in the raw data and the phase shift between the two layers. In this example, theta in stratum pyramidale is leading theta in radiatum by ~90 °, which is quantified in (B). (B) The phase lag at the frequency with the highest coherence (7–9 Hz) between stratum pyramidale and radiatum was calculated for each foraging session. The example shown, corresponds to the data shown in (A). (C) No difference was observed in the coherence of the two recording sites (stratum radiatum and stratum pyramidale) between control and epileptic rats (ctrl, n = 10; epilepsy, n = 12; Wilcoxon Rank Sum Test, p = 0.67, z = 0.4). (D) To determine the theta phase at which interictal spikes and pHFOs occurred, LFP traces recorded at stratum radiatum were clipped at the moment the interictal spike occurred and the phase was estimated (see Materials and methods, Analysis of theta oscillations). In this example, the trace was clipped at the dotted line. (E) For each animal the phase distribution of interictal spikes/pHFO are shown in reference to theta rhythm in stratum pyramidale (0 ° corresponds to the peak of a theta cycle). The distribution of theta phase associated with interictal spike/pHFO occurrence shows a clear phase modulation in 3 of four animals (Raleigh Test), however the phase modulation was inconsistent between animals (for the three that reached significance; mean phase ± SEM; 62.1 ± 9.7,–63.5 ± 7.0,–56.8 ± 13.3).
Figure 4 with 1 supplement
CA1 principal neurons increase firing rates during control ripple, ripple-like events, and pHFOs.
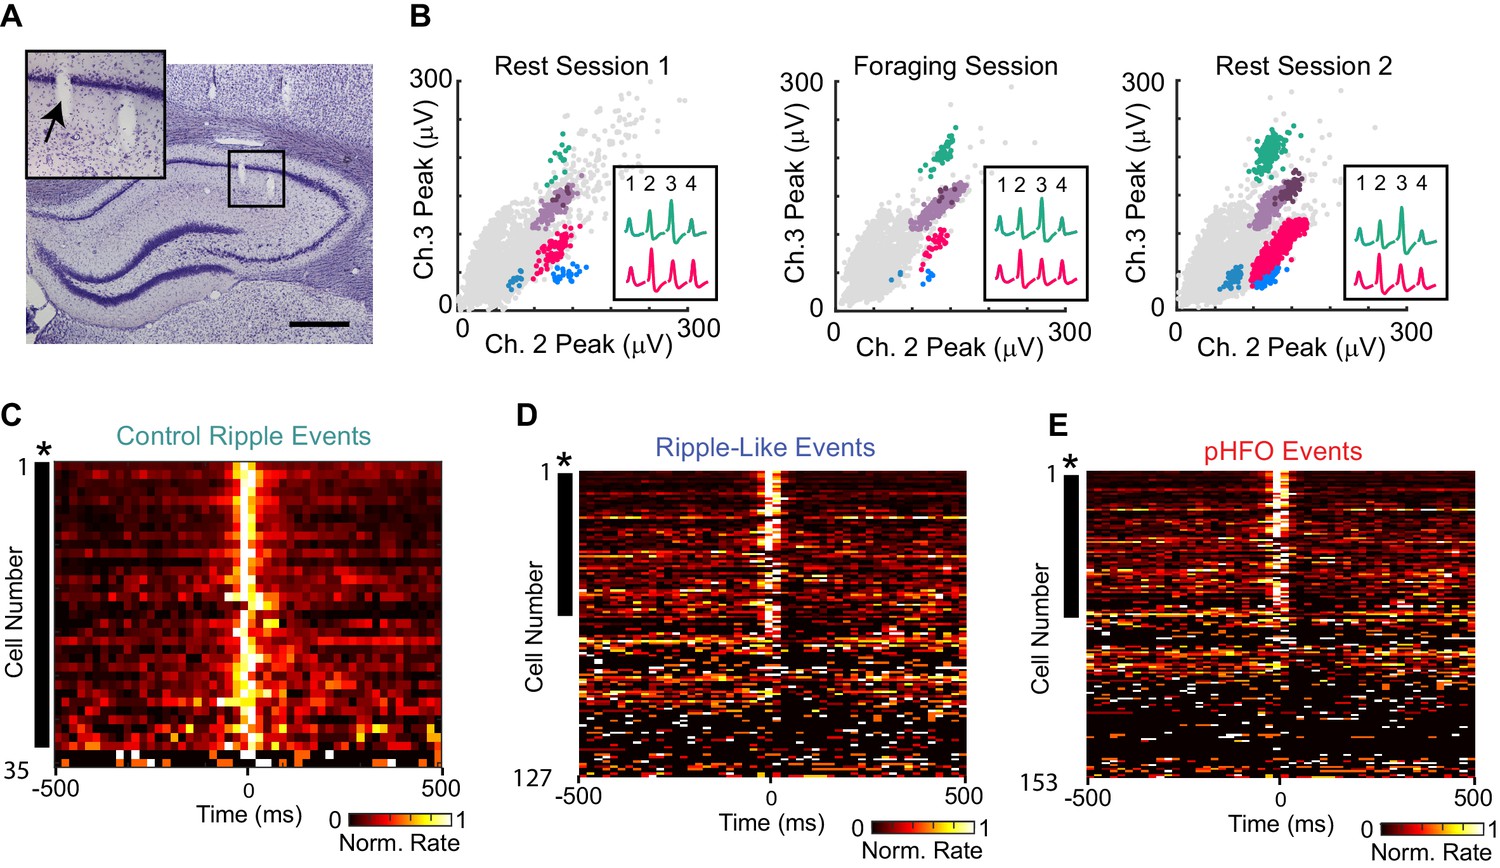
(A) Coronal section through the area of the hippocampus with tetrode tracks in the CA1 area. The area in the black box is magnified in the inset on the upper left. The tetrode position for the spike recordings in (B) is indicated by an arrow. Scale bar, 300 µm. (B) Scatterplots of spike amplitudes on two of the four recording channels (ch2, ch3) from the tetrode identified in (A). Each colored cluster corresponds to spikes from one cell, and insets show average waveforms of two well-isolated cells. Noise spikes are shown in grey. The similarity of the scatterplots and waveforms across the rest and foraging epochs indicates that the same cells were reliably recorded throughout the session. For more details about single unit sorting, see Figure – Supplement 1.( C) Each row in the heat map is the average rate vector for an individual control CA1 principal neuron aligned to ripple events (time 0). Average rates are normalized to their peak and range from 0 (black) to 1 (white). Neurons are sorted by ripple-modulation significance such that strongly modulated neurons are at the top. Neurons that show significant modulation (p <0.05, *) are marked by a black dash to the left of the row. Almost all control neurons are ripple-modulated (91%), and fire maximally during the ripple period (time 0). (D) The same as (C), but for neurons recorded in animals with epilepsy during ripple-like events (left, 46% of neurons were modulated). (E) The same as (C), but for neurons recorded during pHFO events (right, 21% of neurons were modulated). Please note that neurons in (D) and (E) are ordered differently, therefore cell identity across rows are not comparable. For rates and p-values see Figure – source data (1–3, corresponding to C-E).
-
Figure 4—source data 1
Neuron activity during control ripple.
Source data correspond to data shown in panel C. For each neuron (neuron # is a unique identifier given to each single unit in the study) several data are shown: (from left to right) the # of SWR ripples (for control), mean rate during baseline (BL), mean rate during detected high-frequency ripple events, and the p-value obtained using a Wilcoxon signed rank test. Neurons are ordered according to p-value, with the smallest p-values at the top. The solid line separates neurons that significantly changed rate during a high-frequency event from those that did not. Neuronal activity during ripple-like oscillations are reported in Figure 4—source data 2 and during pHFO in Figure 4—source data 3.
- https://doi.org/10.7554/eLife.42148.010
-
Figure 4—source data 2
Neuron activity during ripple-like oscillations.
Source data correspond to data shown in panel D. For each neuron (neuron # is a unique identifier given to each single unit in the study) several data are shown: (from left to right) the # of ripple-like oscillations (R–L), mean rate during baseline (BL), mean rate during detected high- frequency R-L events, and the p-value obtained using a Wilcoxon signed rank test. Neurons are ordered according to p-value, with the smallest p-values at the top. The solid line separates neurons that significantly changed rate during a high- frequency event from those that did not. Note that all neurons listed in Figure 4—source data 2 are also in Figure 4—source data 3 (but not vice versa), and can be compared by looking at neuron number.
- https://doi.org/10.7554/eLife.42148.011
-
Figure 4—source data 3
Neuron activity during pHFO.
Source data correspond to data shown in panel E. For each neuron (neuron # is a unique identifier given to each single unit in the study) several data are shown: (from left to right) the # of pHFOs recorded, mean rate during baseline (BL), mean rate during detected high- frequency events, and the p-value obtained using a Wilcoxon signed rank test. For each table, neurons are ordered according to p-value, with the smallest p-values at the top. The solid line separates neurons that significantly changed rate during a high- frequency event from those that did not. Note that all neurons listed in Figure 4—source data 2 are also in Figure 4—source data 3 (but not vice versa), and can be compared by looking at neuron number.
- https://doi.org/10.7554/eLife.42148.012
Figure 4—figure supplement 1

Spike waveforms are equally stable in control and epileptic animals and cluster quality is high in both groups.
(A) Scatterplots of spike amplitudes on two of the four recording channels (ch1, ch4) from a tetrode different from the one shown in the main Figure 4, but also implanted in an animal with epilepsy. Each colored cluster corresponds to spikes from one cell. In this projection (peaks from ch1, peaks from ch4), the cluster denoted by dark blue was clearly distinct from the noise and far from other clusters (cells), therefore boundaries were drawn around the cluster to define it. The gray dots within these boundaries were excluded by boundaries set in a different projection. All boundary definitions were assigned manually, i.e. we did not employ automated spike sorting. Note, the relationship of spike clusters to other cells and the noise did not change for a cluster over the recording session. (B) For each cluster shown in (A), the waveforms recorded on each tetrode channel (1 – 4) are shown for each behavioral period, with average waveforms superimposed in white. Dotted lines are drawn to mark the height of the average waveform at its largest in Rest 1, and extended so that a by-eye comparison can be made across the behavioral periods. Although different firing rates can be observed during different behavioral periods, the relationship of the spike amplitude across channels remains constant. This consistency is an indicator of a stable tetrode position in relation to the cell layer. (C) L-Ratio was the same for clusters recorded in control (n = 203; median, IQR, 0.0023, 0.0009–0.0076) and in epileptic animals (n = 795; median, IQR, 0.0025, 0.0009 -. 0073) (p = 0.54, Wilcoxon Rank Sum Test, z-value = −0.6). (D) Isolation distance was large in control and epileptic animals (98.7% of clusters had isolation distance > 10 cm). In epileptic animals, the isolation distance (n = 795; median, IQR, 48.6, 32.6–78.3) was larger than in controls (n = 203; median, IQR, 24.7, 17.1–43.3) (p = 5.1 * 10−29, Wilcoxon Rank Sum Test, z-value = −11.2). (E) for each cell, the channel that recorded the largest waveform in the first session (e.g., channel 4 for cluster one shown in (B)) was selected, and the average waveform is plotted for Rest one versus Rest 2. Note that all cells lie close to the identity line, confirming that waveforms were stable across the entire recording. (F) Changes in waveform amplitude from the first to the second rest session were the same for cells recorded in control (n = 35; median, IQR, 0.7–1.6 – 9.1) and epileptic animals (n = 177; median, IQR, 1.8,–4.1 – 10.8)(not significant, Wilcoxon Rank Sum Test, p = 0.57, z-value = −0.57). The results in (C) – (F) indicate that cluster quality does not differ significantly between control and epileptic animals, and when there is a significant difference it is toward higher cluster quality in epileptic animals.
Figure 5
Distinct neuronal ensembles are engaged during ripple-like and pHFO events.
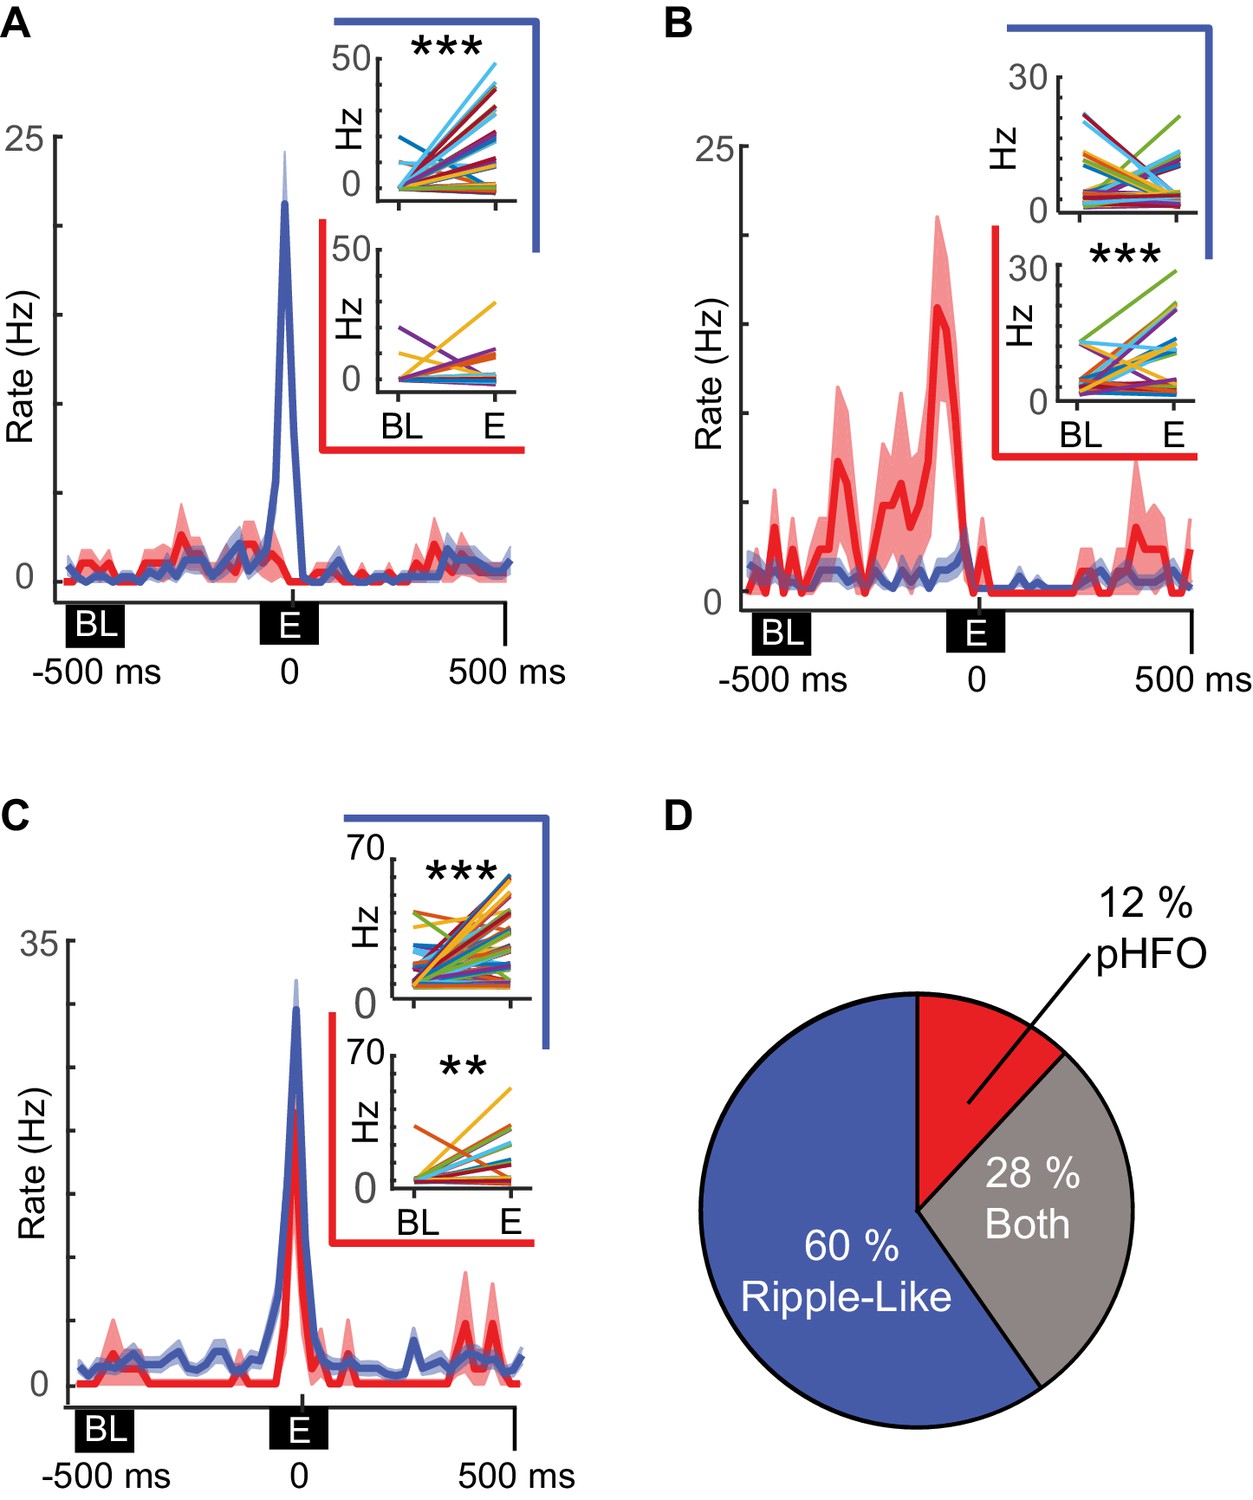
(A) Example CA1 pyramidal neuron that is modulated by ripple-like events only. The mean firing rate ±SEM over all ripple-like (blue) and pHFO events (red) is shown, and traces are centered on the ripple event (‘E’, time zero). Insets show the mean rate changes for the same neuron during individual events (the rates associated with individual events are depicted with distinct line colors). Rates are shown comparing baseline (‘BL’) to ripple-like events (upper plot, blue border) or comparing baseline to pHFO events (lower plot, red border). ***, p ≤ 0.001, Wilcoxon Sign Rank test. (B) As in (A) but an example of a cell modulated by pHFO events only. (C) A neuron that was modulated by both ripple-like and pHFO events. (D) Population summary of which event types individual neurons were modulated by.
Figure 6
Place coding deficits in CA1 neurons from animals with epilepsy.
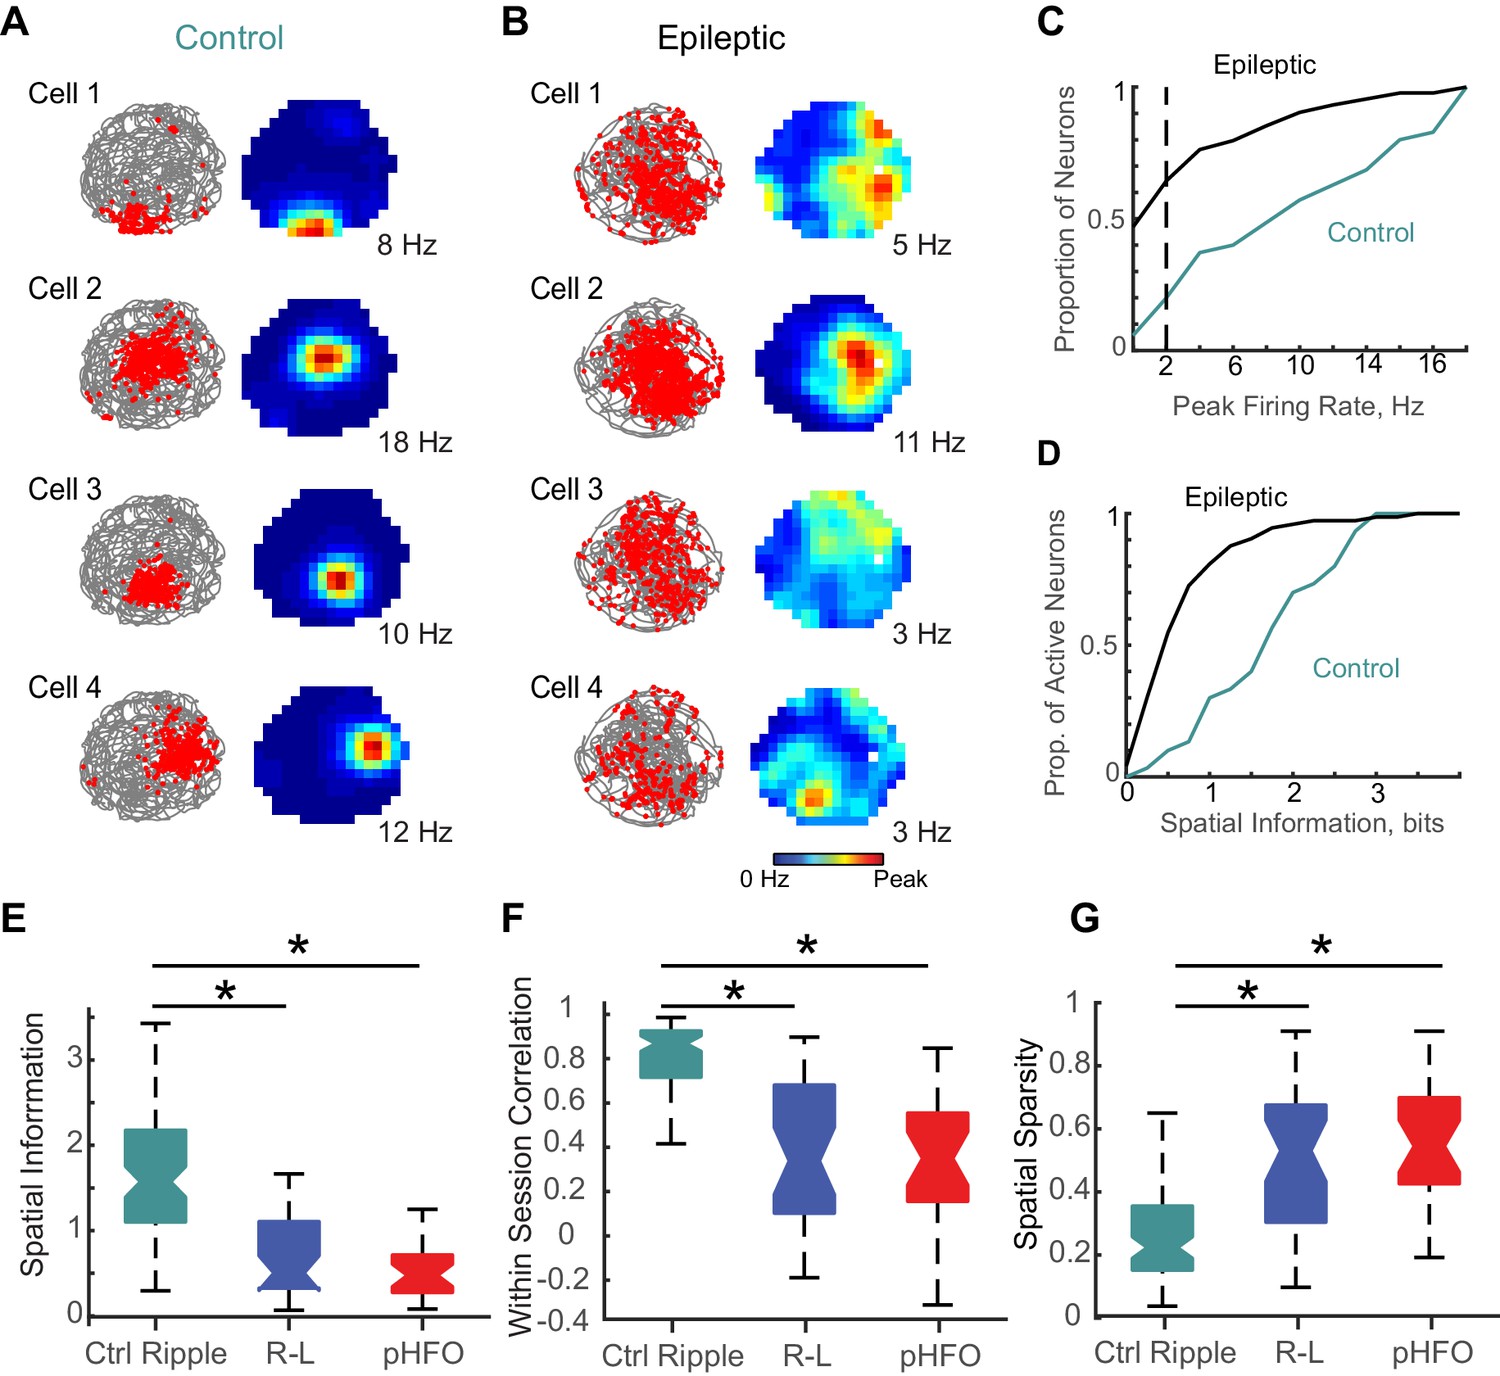
(A) The activity patterns of four control CA1 neurons recorded simultaneously during a 10 min foraging epoch in the open field. Left, for each cell the animal’s path is in grey and the positions where spikes of an individual neuron occurred are overlaid as red dots. Right, the corresponding firing rate maps with the average firing rate in each spatial location represented from 0 Hz (dark blue) to the peak rate for each cell (red, noted to the right of each map). (B) The firing patterns of four CA1 neurons recorded simultaneously from an epileptic rat during a 10-min foraging epoch. Maps are as described in (A). (C) Distributions of peak rates during foraging for all neurons recorded in control and epileptic rats (for neurons active in several sessions, foraging sessions with highest rates were selected, n = 35 ctrl, n = 177 epileptic). (D) Distribution of spatial information for neurons with peak rates ≥ 2 Hz (n = 30 ctrl, n = 73 epileptic). (E,F,G) Distributions of spatial parameters are shown for three neuron types: (1) CA1 pyramidal neurons recorded from control animals that were ripple modulated ‘Ctrl Ripple’, (2) CA1 pyramidal neurons recorded from animals with epilepsy that were only modulated by ripple-like events ‘R-L’, and (3) CA1 pyramidal neurons recorded from animals with epilepsy that were either modulated by pHFOs only or by both pHFOs and ripple-like events ‘pHFO’. See Figure 6 – source data for numerical values. *, ≤ 0.05 Kruskal – Wallis test, Turkey-Kramer post hoc.
-
Figure 6—source data 1
Spatial coding parameters of place cells in control and epileptic animals.
Neurons are grouped according to whether they are modulated by ripple, ripple-like, or pHFO events. These measures are calculated per foraging periods, such that N reflects the number of neurons multiplied by the number of foraging periods. Values are reported as median; inter-quartile range.
- https://doi.org/10.7554/eLife.42148.016
Figure 7

The spiking of neurons during pHFOs reduce spatial information.
(A) The animal’s path is depicted in grey with the positions where pHFO events occurred overlaid as red dots. The corresponding average rate map is displayed to the right, with a peak rate of 0.16 Hz. (B) Distribution of shuffled spatial information for pHFO events shown in (A). The actual spatial information is denoted by the red line. (C) Summary of the relationship between shuffled and actual spatial information of pHFOs for all foraging epochs with frequent pHFOs. Blue bars denote 5 and 95 percentile of shuffled distributions. Red dots show actual information. (D) Distributions of spatial information of neurons recorded from control animals (cyan, n = 93 maps) compared to spatial information of neurons in animals with epilepsy recorded either during foraging epochs with ongoing pHFOs (black, n = 83 maps) or no pHFOs (red, n = 59 maps). * ≤ 0.05 Kruskal – Wallis test, Tukey Kramer post hoc. (E) Distribution of the number of spikes that occurred during pHFOs for individual neurons during foraging epochs with ongoing pHFOs (n = 21). (F) The distribution of spatial information after random down-sampling (random d.s.) was calculated to determine whether targeted removal of spikes that occurred during pHFOs (targeted d.s., shown as a red x) led to a significantly higher spatial information score than would be expected by random down-sampling. (G) Spatial information of individual neurons was improved when spikes that occurred during pHFOs were removed from the map (targeted d.s.). *** ≤ 0.001 Wilcoxon Sign Rank test. (H) The improvement in spatial information as a function of the percentage of spikes which occurred during pHFOs. Values from individual neurons are plotted as black points. Only maps that had significant improvements beyond what would be expected by random down-sampling (as shown in F) are plotted and fit with a line.
Author response image 1
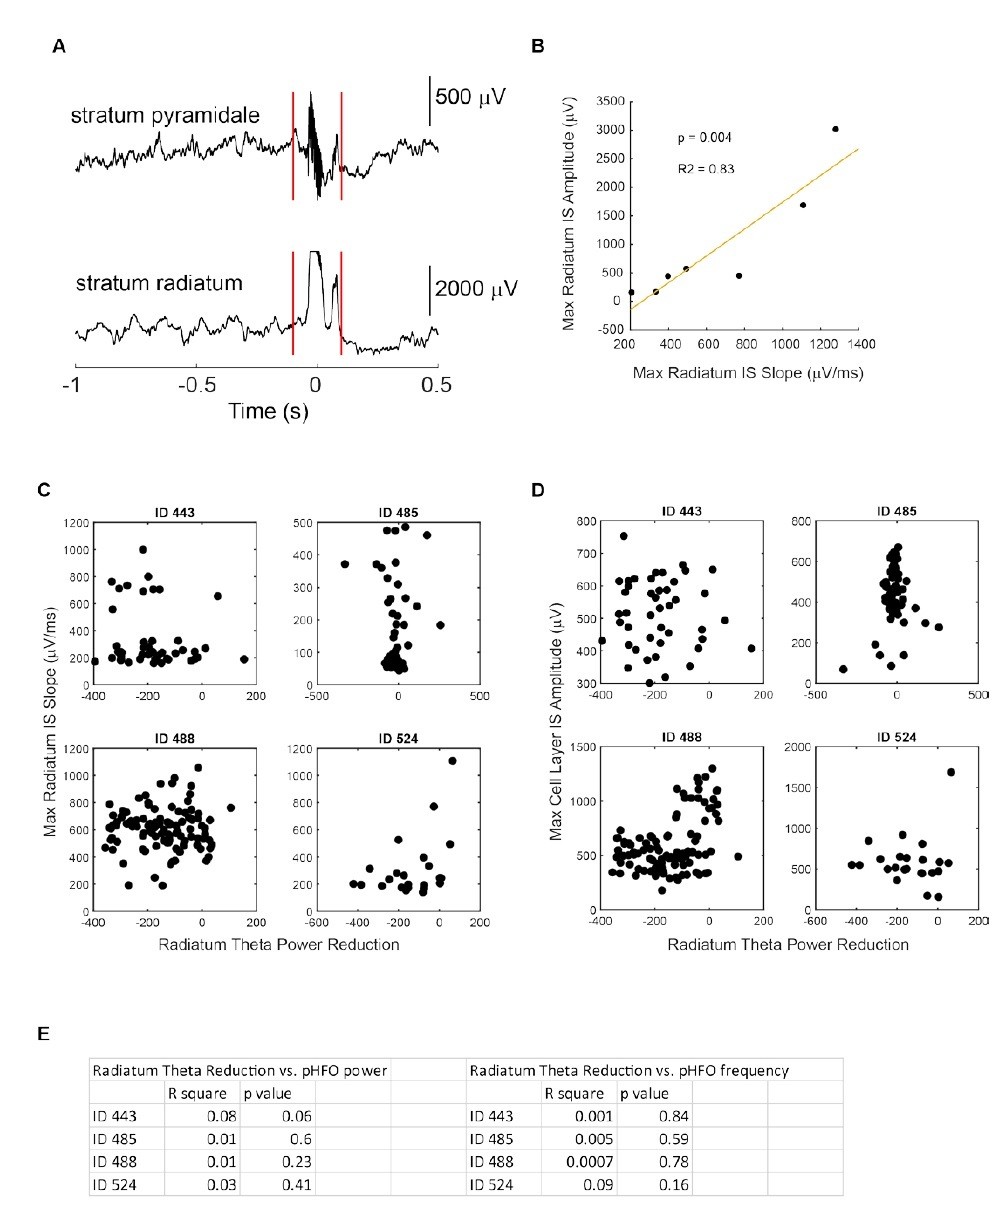
No relationship between IS /pHFO parameters and magnitude of theta suppression.
(A) Example event recorded simultaneously in the cell layer (stratum pyramidale) and radiatum during movement related theta oscillation. (B) In one foraging session, interictal spikes (IS) recorded in radiatum did not saturate and varied enough to allow us to test whether IS slope correlated with IS amplitude. The strong correlation allowed us to use slope (C) as a proxy for IS amplitude in other recording sessions where IS saturated (as shown in A). C,D,E No relationship was observed between radiatum IS slope (C), cell layer IS amplitude (D), or cell layer pHFO power/frequency (E) and magnitude of theta reduction. ID numbers refer to individual epileptic animals.
Author response image 2
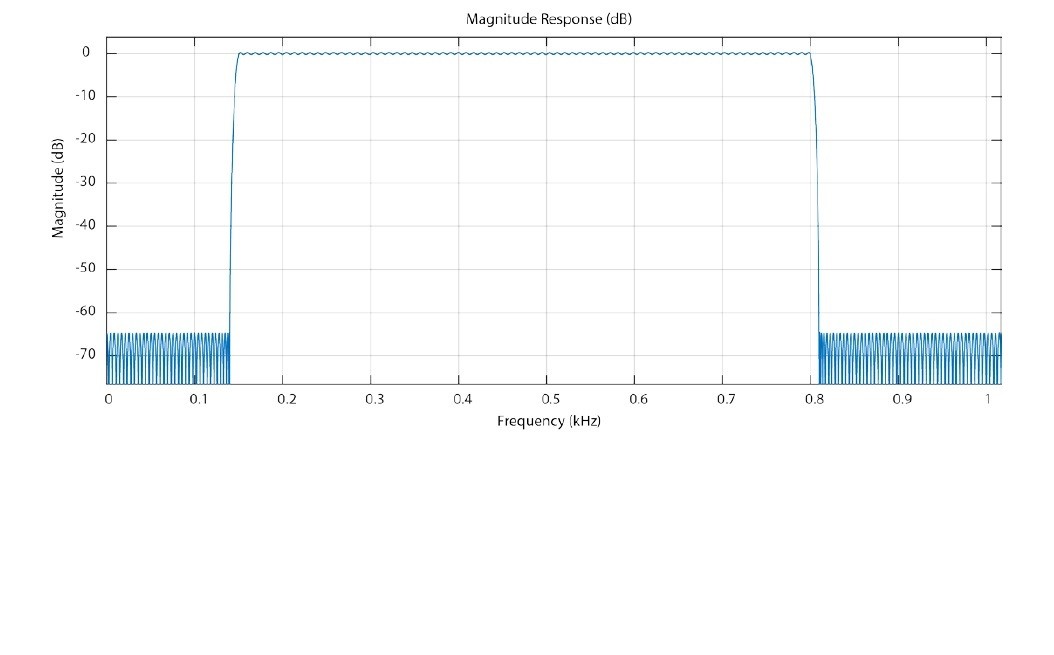
Magnitude response of the Equiripple Bandpass Filter.
https://doi.org/10.7554/eLife.42148.021Tables
Key resources table
| Reagent type (species) or resource | Designation | Source or reference | Identifiers |
|---|---|---|---|
| Strain, strain background | Wistar rats; Crl:WI | Charles River Labs | Strain Code: 003; RRID:RGD_13508588 |
| Chemical compound, drug | Kainic acid; kainate | Tocris | Cat # 0222 |
| Chemical compound, drug | Isoflurane | MWI | Cat #: NDC 13985-528-60 |
| Chemical compound, drug | Buprenorphine | MWI | Cat #: 29308 |
| Chemical compound, drug | Chloroplatinic acid for platinum plating | Sigma-Aldrich | Cat #: 206083; CAS 18497-13-7 |
| Chemical compound, drug | Sodium pentobarital | MWI | Cat #: 15199 |
| Chemical compound, drug | Formaldehyde | EMD | Cat #: FX-0415–4; CAS 50-00-0 |
| Chemical compound, drug | Cresyl violet | EMD | Cat #: M-19012; CAS 10510-54-0 |
| Software, algorithm | Matlab v2015b | Mathworks | MATLAB, RRID:SCR_001622 |
| Software, algorithm | MClust | AD Redish | http://redishlab.neuroscience.umn.edu/MClust/MClust.html |
| Software, algorithm | Chronux | Partha Mitra | http://chronux.org/ |
| Other | Hyperdrive | Custom built; Designed by B McNaughton | US Patent: US5928143 A |
| Other | Platinum- Iridium tetrode wire | California fine wire company | Cat #: CFW0011873 |
| Other | Freezing microtome | Leica | Model: SM 2000R |
| Other | Digital Neuralynx recording system | Neuralynx | Model: Digital Lynx SX |
Additional files
-
Transparent reporting form
- https://doi.org/10.7554/eLife.42148.018
Download links
A two-part list of links to download the article, or parts of the article, in various formats.
Downloads (link to download the article as PDF)
Open citations (links to open the citations from this article in various online reference manager services)
Cite this article (links to download the citations from this article in formats compatible with various reference manager tools)
The impact of pathological high-frequency oscillations on hippocampal network activity in rats with chronic epilepsy
eLife 8:e42148.
https://doi.org/10.7554/eLife.42148


