Atypical intrinsic neural timescale in autism
- University College London, United Kingdom
- RIKEN Centre for Brain Science, Japan
- University of Bristol, United Kingdom
Figures
Figure 1 with 2 supplements
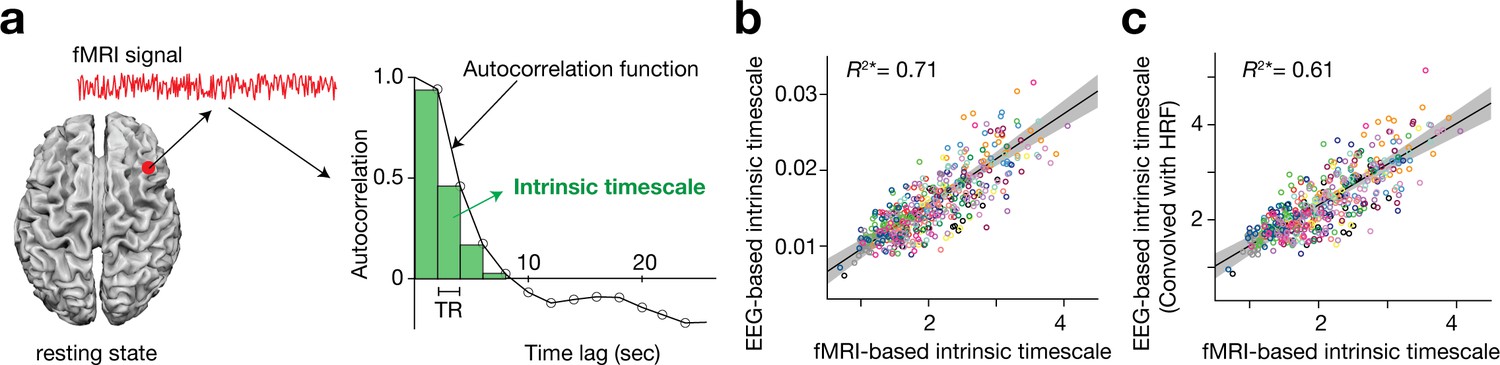
Definition and validation of intrinsic timescales based on resting-state fMRI data.
(a) To estimate an intrinsic neural timescale of an fMRI signal, we first calculated the sum of autocorrelation function (ACF) values of the signals in the initial positive period of the ACF. The period is the area under the ACF up to the time lag value just before the one where the ACF becomes non-positive for the first time as the time lag increases. We then multiplied the obtained area under the ACF by the repetition time (TR), which defined the index for the intrinsic timescale. Open circles in the right panel show the empirical ACF values for the resting-state fMRI data. TR was 2 s in the current dataset. (b and c) fMRI-based intrinsic timescale scores were highly correlated with those calculated from simultaneously recorded EEG data (gamma band, adjusted R2 = 0.71; panel b; see Figure 1—figure supplement 2 for other EEG bands). The fMRI-based timescales were different from those based on the EEG data by two orders of magnitude. When we convolved the EEG signals with the hemodynamic response function (HRF), the intrinsic timescales based on EEG data showed the same magnitude as those based on fMRI data (panel c). A circle represents a combination of a brain region and a participant. The fMRI-based intrinsic timescale represents the index value averaged over a 4mm-radius sphere whose centre was determined by source reconstruction of independent components of EEG data. Different colours indicate data recorded from different participants. The grey area indicates 95% confidence interval.
Figure 1—figure supplement 1

Power spectrum of the preprocessed EEG data.
To examine the magnitude of fMRI-induced gradient noise, we estimated power spectra of the independent components of the preprocessed EEG data. (a) Power spectra of the preprocessed EEG data recorded from Participant #1. Different lines show powers of different independent components. (b) Power spectra of the preprocessed EEG data of all participants. Different lines indicate the average powers of different participants. Both panels suggest that the preprocessing succeeded in significantly reducing the fMRI-induced noise in the EEG data.
Figure 1—figure supplement 2

Comparisons between fMRI-based and EEG-based intrinsic timescales.
As shown in Figure 1c, the fMRI-based intrinsic timescale was strongly correlated with those based on the gamma band of EEG signals. We also examined such correlations for different EEG bands, and relatively large correlations in the alpha and beta bands. A significant correlation was also seen without band filtering (R2*=0.40). The grey areas show 95% confidence intervals.
Figure 2
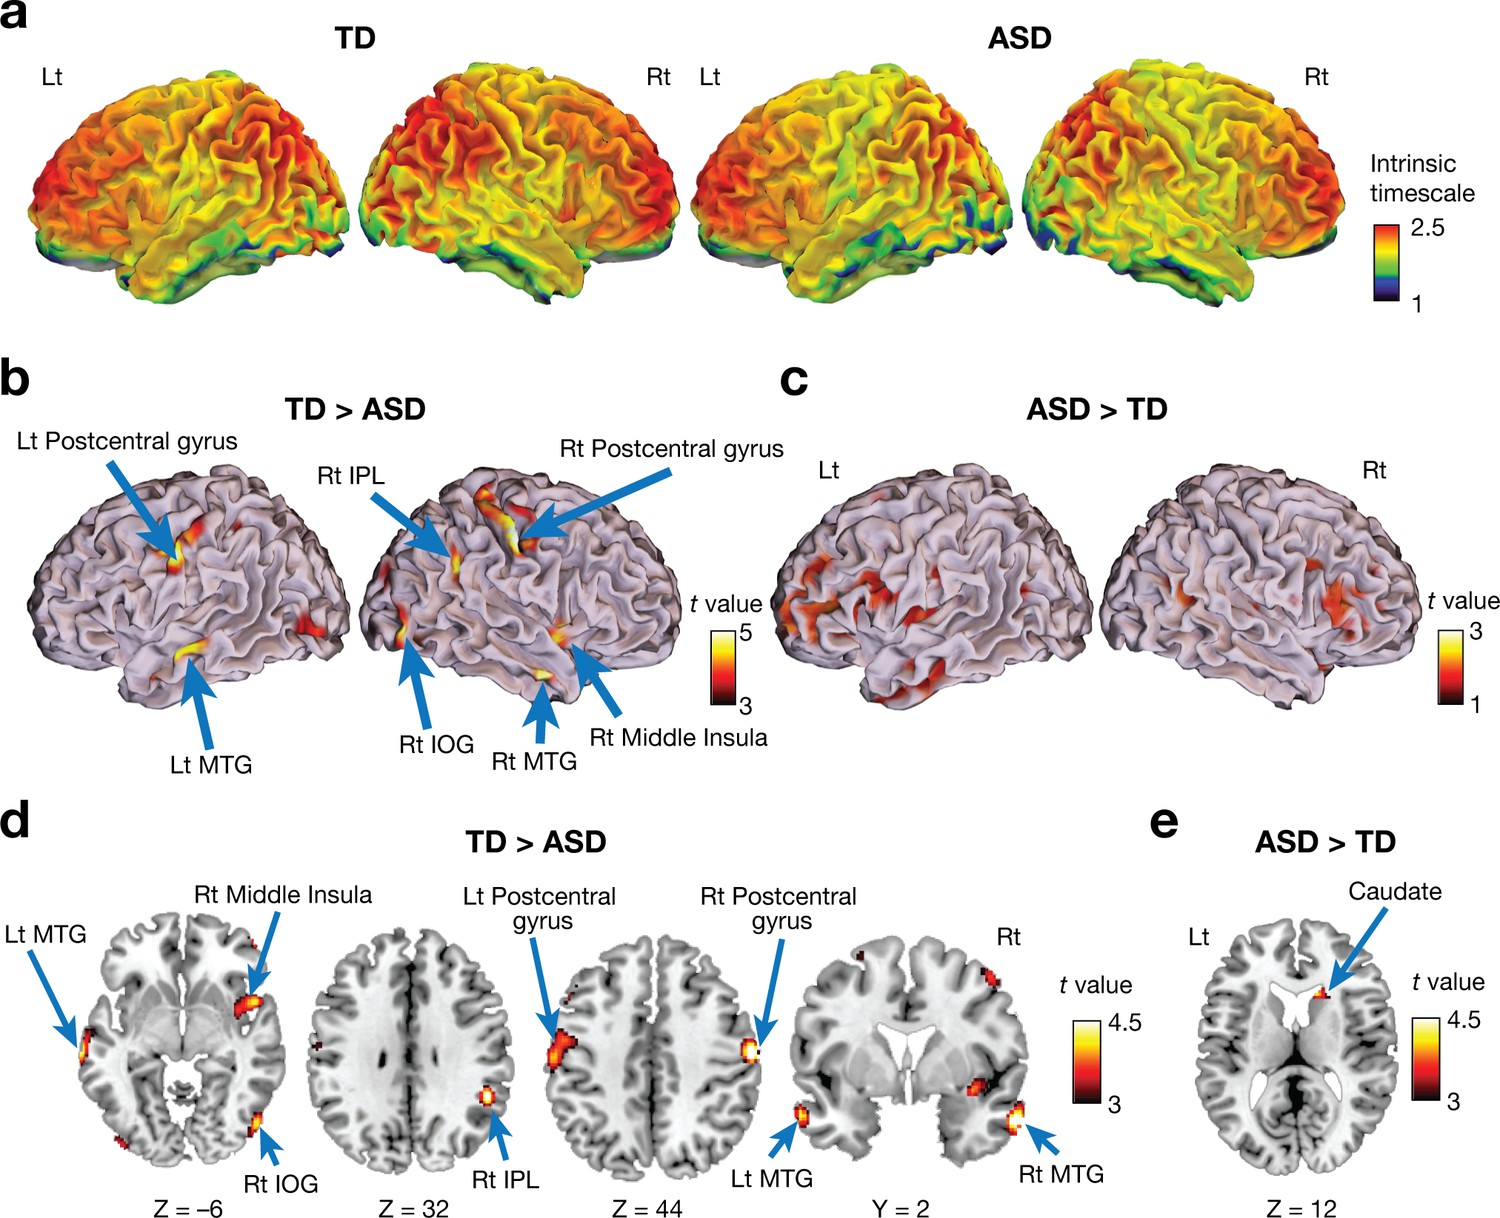
Voxel-wise comparison of the intrinsic neural timescale.
(a) In both ASD and TD groups, we found longer intrinsic timescales in frontoparietal areas and shorter timescales in sensory-related areas. The colour bar indicates the intrinsic neural timescales (Figure 1a). (b–e) Individuals with ASD had significantly shorter intrinsic timescales in bilateral postcentral gyri, right inferior parietal lobule (IPL), right middle insula, bilateral middle temporal gyri (MTG), and right inferior occipital gyrus (IOG) (panels b and d), whereas the intrinsic timescale in the right caudate was significantly longer in the ASD group compared to the TD group (panels c and e).
Figure 3 with 1 supplement

Associations between the intrinsic neural timescale and ASD symptoms.
(a) We found negative associations between the intrinsic timescale and the overall severity of ASD in the bilateral postcentral gyri and right IOG but not in the bilateral middle temporal gyri (MTGs), right middle insula, and right inferior parietal lobule (IPL). The intrinsic timescales of the regions represent the averages of the timescale values within the clusters. The statistical threshold for the seven brain-behaviour comparisons was corrected by FDR. (b) The intrinsic neural timescale in the right caudate was not correlated with the overall severity of autism, but was associated with that of repetitive, restricted behaviours (RRB) of ASD.
Figure 3—figure supplement 1
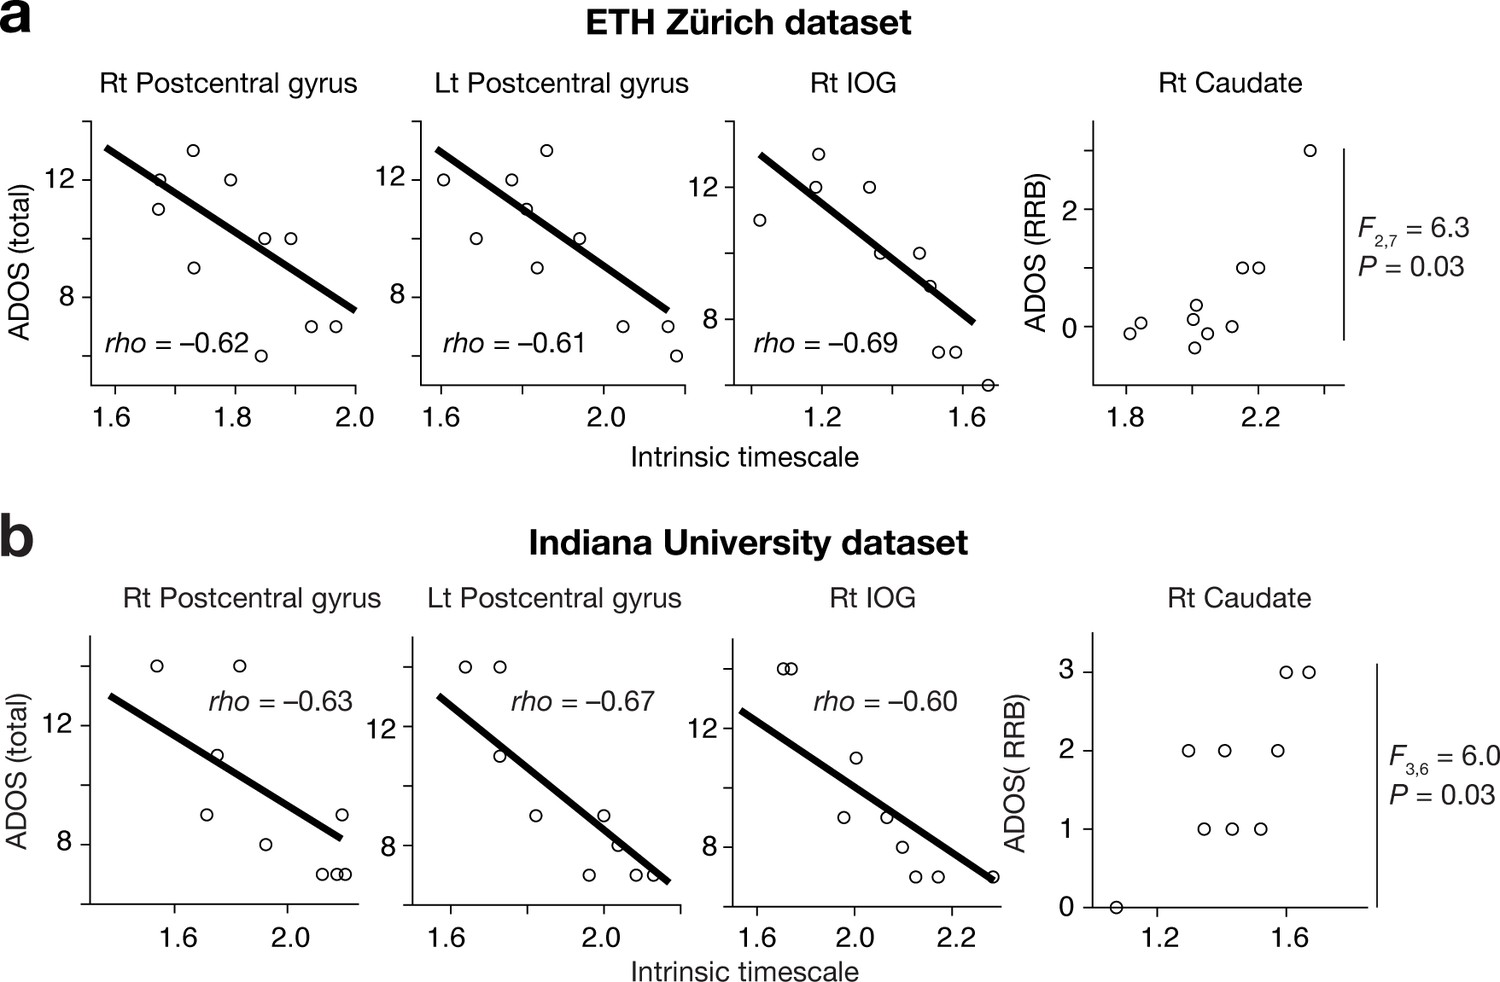
Brain-symptom associations in independent datasets.
To assure statistical independence between the ROI definition and the brain-symptom association analysis, we analysed two independent datasets that were not used in the ROI definition (panel (a): results based on EHT Zürich dataset, panel (b): results based on Indiana University dataset). The associations between the intrinsic neural timescales and ADOS scores were preserved in this confirmatory analysis.
Figure 4
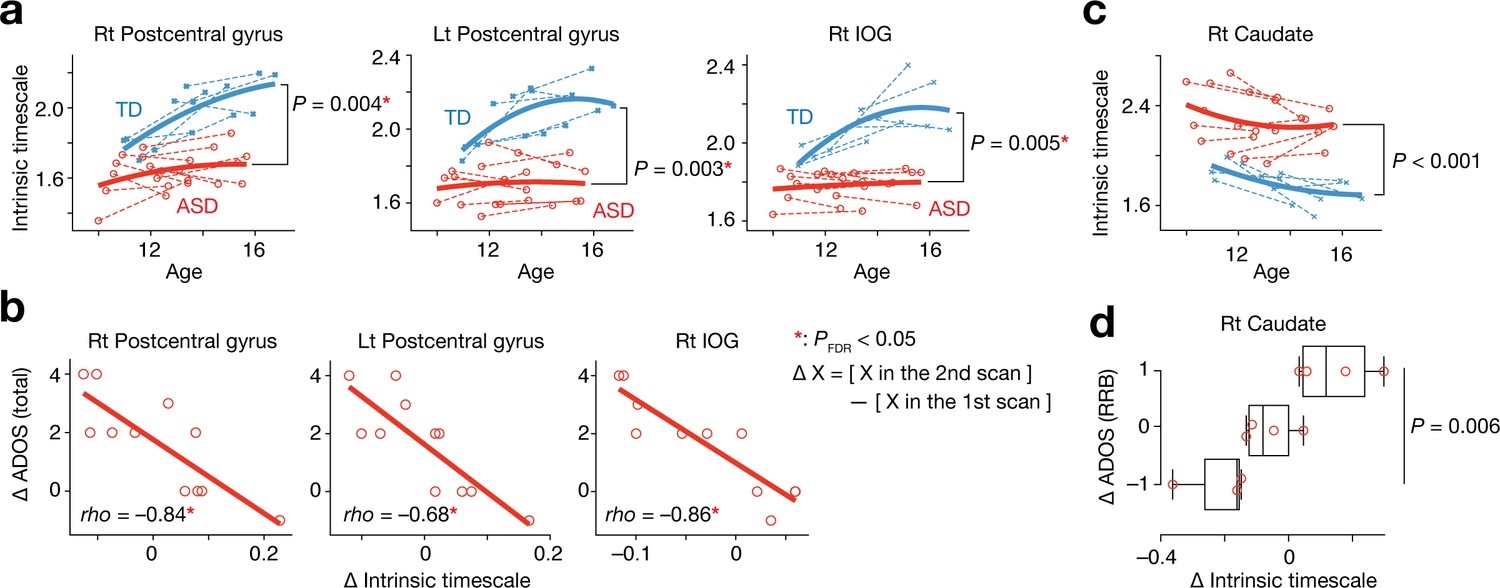
Analysis of a longitudinal developmental dataset.
Atypical intrinsic neural timescales and their associations with symptoms of ASD were investigated in a longitudinal fMRI dataset obtained from adolescent children (Supplementary Table 2 in Supplementary file 1) (Di Martino et al., 2014). (a) In adolescence, the intrinsic neural timescales in the bilateral postcentral gyri and right inferior occipital gyri (IOG) were consistently shorter in children with ASD. Each bold curve indicates the quadratic curve fitted to individual data points for each group. Each dotted line represents a longitudinal change in each participant. (b) The underdevelopment of the intrinsic timescale was correlated with progression of overall ASD symptoms. The changes in the intrinsic timescale and ADOS score were defined as subtraction of these indices at the first scan from those at the second scan. (c) The intrinsic neural timescale in the right caudate was consistently longer in ASD group during adolescence. (d) The overdevelopment of the intrinsic timescale was correlated with progression of RRB symptoms.
Figure 5 with 2 supplements
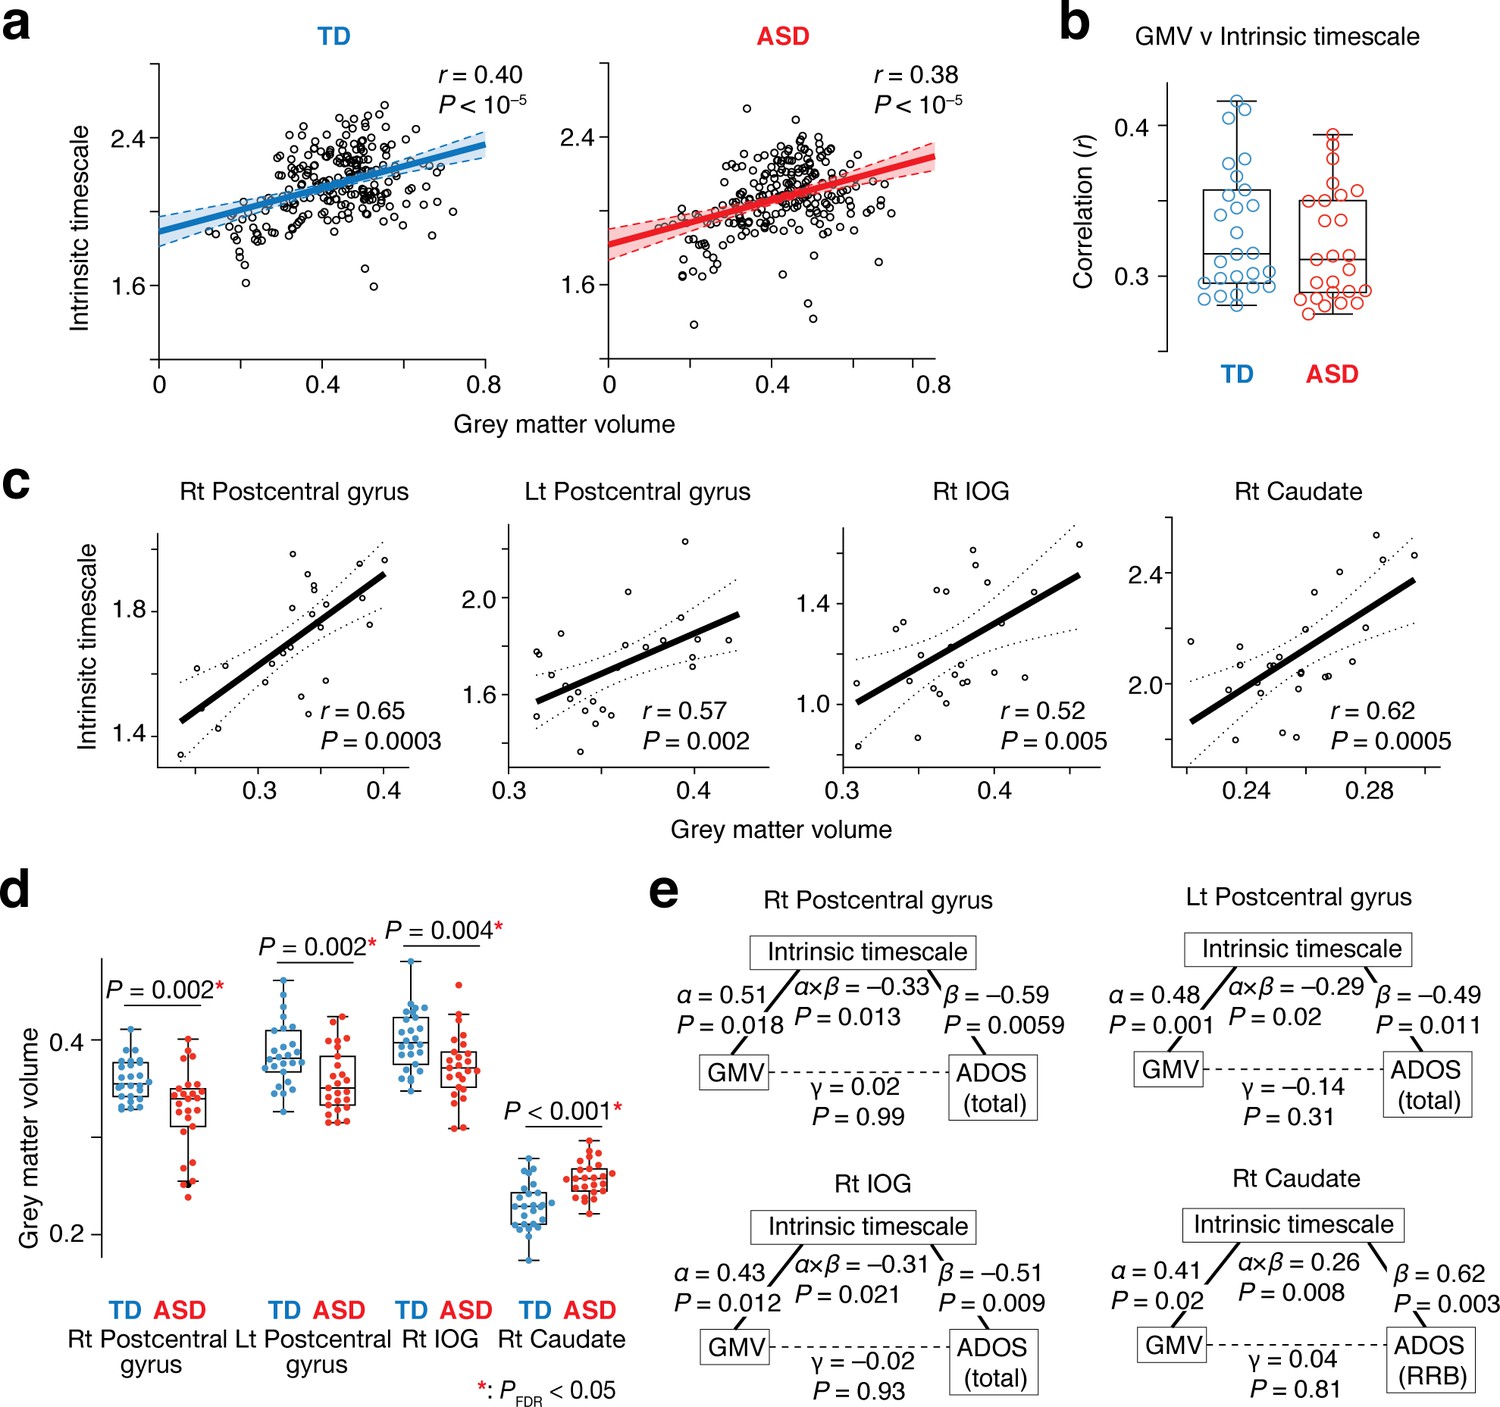
Neuroanatomical basis of the intrinsic neural timescale.
(a) At a group level, intrinsic timescale was correlated with local grey matter volume (GMV). Each circle represents an across-participant average of the intrinsic timescale and that of the GMV in one of the 360 brain regions defined by a previous multi-modal brain parcellation study (Glasser et al., 2016). Dotted lines and shaded areas indicate 95% confidence intervals of the fitted lines. (b) The correlation between the intrinsic timescale and GMV was significant even at a single-participant level. Each circle represents the Pearson’s correlation coefficient between the intrinsic timescale and GMV within each participant, which is calculated based on 360 brain areas (Glasser et al., 2016). (c) The correlation between the intrinsic timescale and GMV was seen in the four brain regions whose atypical intrinsic timescale was correlated with the severity of autism. Each circle represents an individual with ASD. Dotted lines indicate 95% confidence intervals of the fitted lines. (d) The GMVs of the three brain regions showing atypical reduction in the intrinsic timescale in autism were significantly smaller in the ASD than the TD group. In contrast, the GMV of the right caudate, which had an atypically longer intrinsic timescale in autism, was larger in the ASD group. (e) We conducted mediation analyses to examine the hypothesis that atypicality in the intrinsic timescale is one of the mediators linking atypical GMV and symptoms of autism. The analyses used the GMV, intrinsic timescale, and ADOS score as an independent variable, mediator variable, and dependent variable, respectively. ‘α” indicates effects of GMV on the intrinsic timescale, and ‘β” denotes effects of the intrinsic timescale on ADOS scores. ‘γ” represents direct effects of GMV on ADOS scores, and ‘α × β” indicates indirect effects. The statistical significance of the indirect effects (i.e., P values for ‘α × β”) and the insignificance of the GMV-ADOS direct effects (i.e., P values for ‘γ”) support the working hypothesis.
Figure 5—figure supplement 1
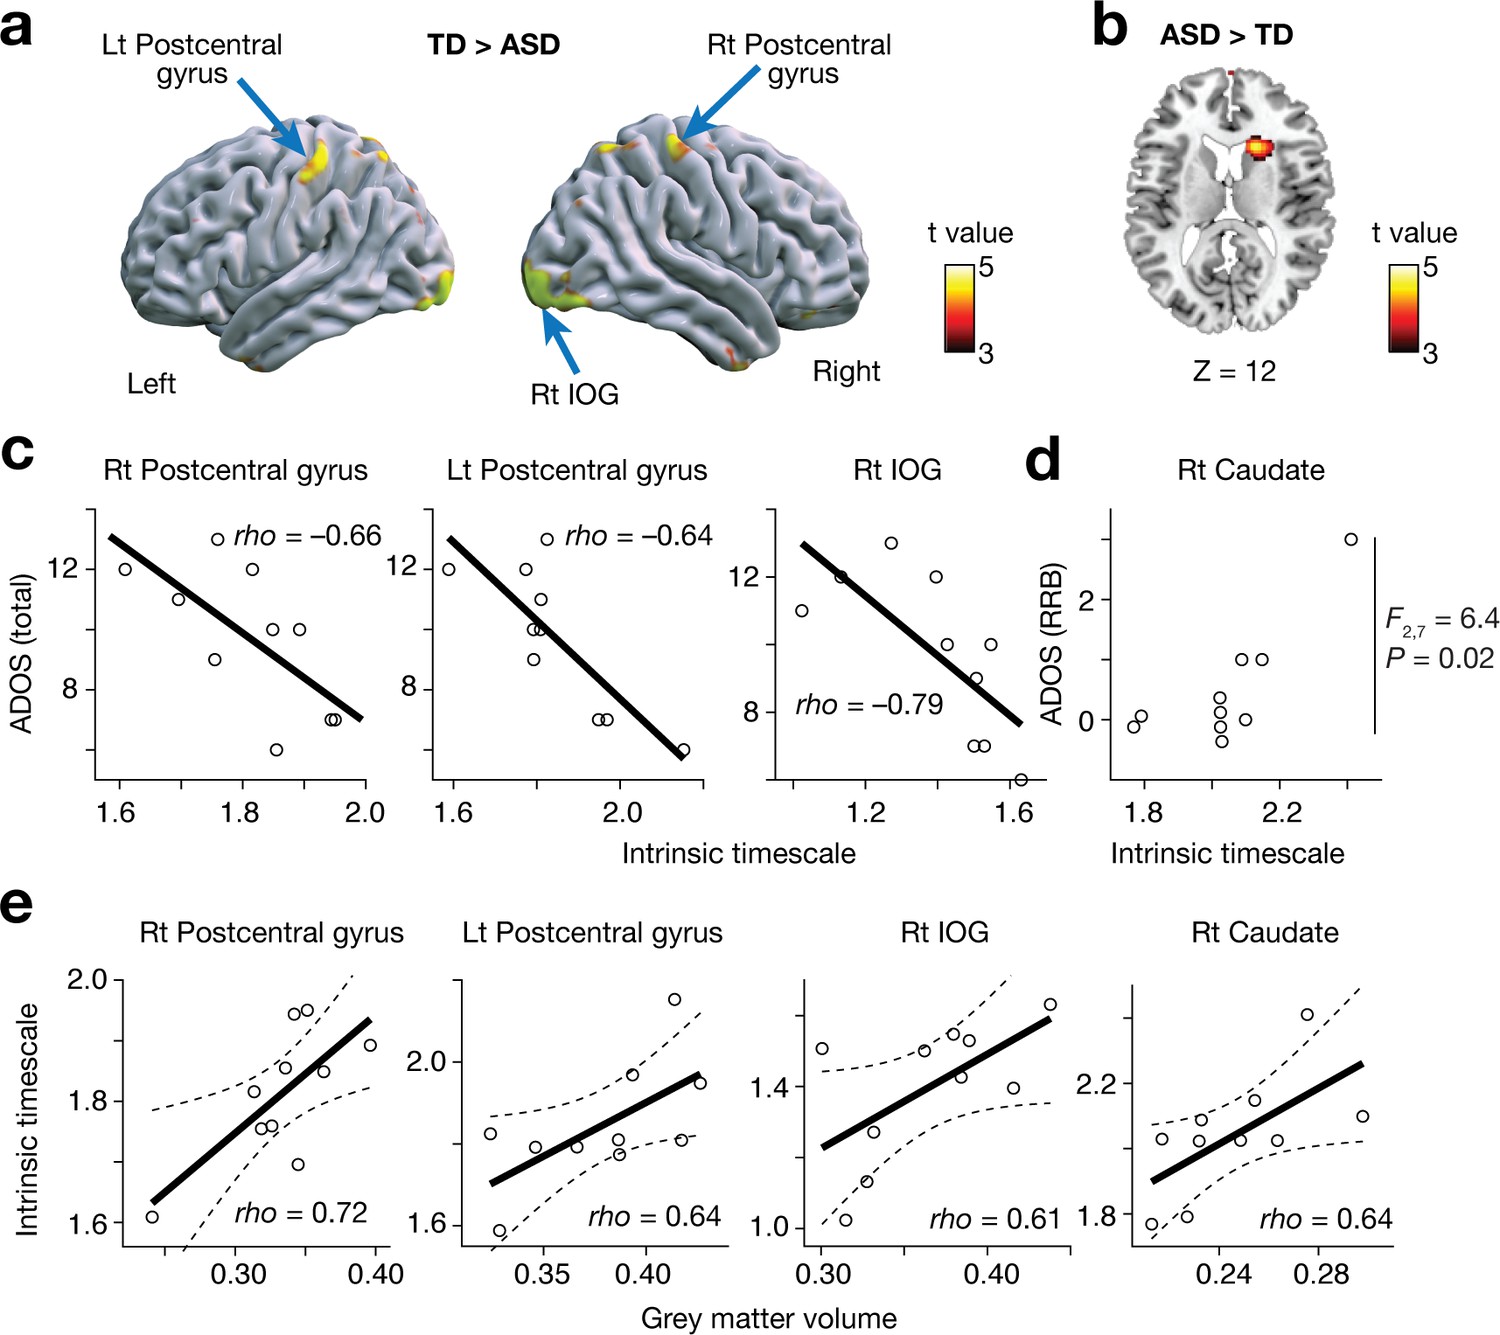
Reproducibility test 1: ETH Zürich dataset.
The main findings were replicated in an independent dataset collected in ETH Zürich. In a whole-brain analysis, the bilateral postcentral gyri and right IOG showed atypically shorter intrinsic neural timescales in autism (panel a), whereas the right caudate in autism presented an atypically long intrinsic timescale (panel b). These shorter/longer intrinsic timescales were correlated with the severity of ASD (panels c and d) and GMV (panel e). Circles in panels c-e represent participants. Dotted lines in panel e indicate 95% confidence interval.
Figure 5—figure supplement 2
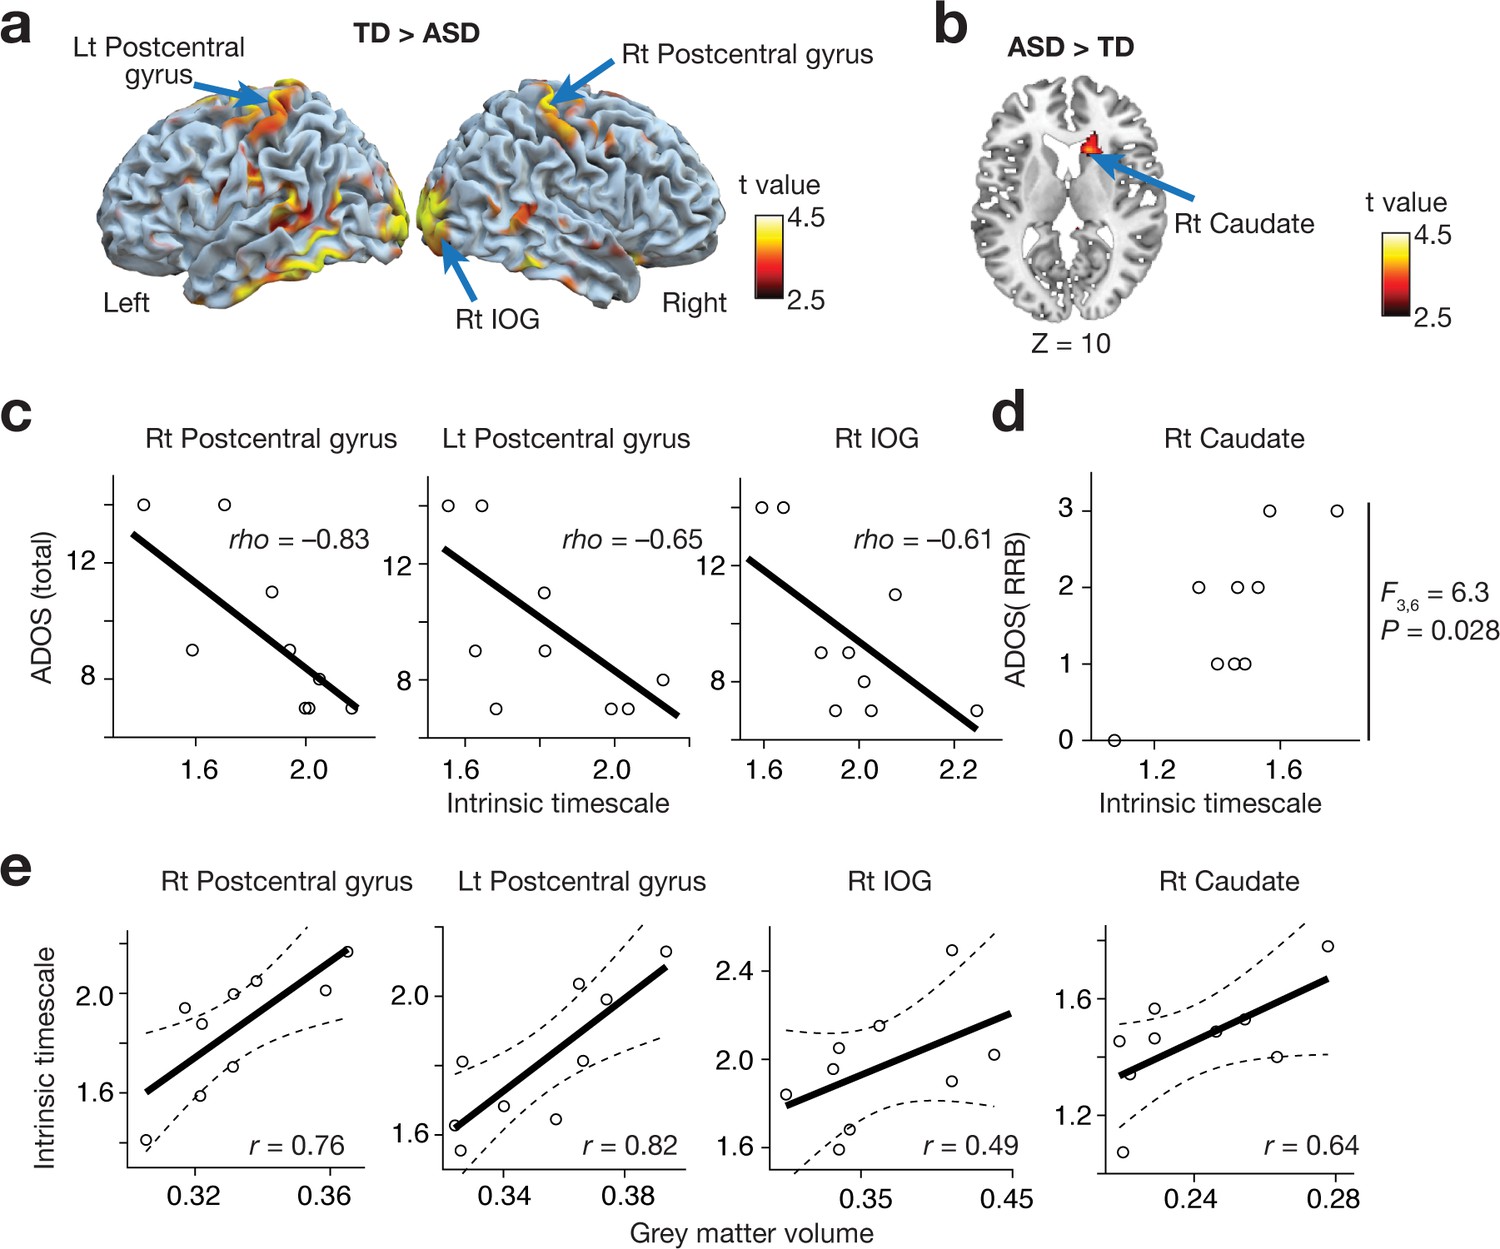
Reproducibility test 2: Indiana University dataset.
The main findings were replicated in an independent dataset collected in Indiana University. In a whole-brain analysis, the bilateral postcentral gyri and right IOG showed atypical reduction in the intrinsic neural timescale in autism (panel a), whereas the right caudate in autism presented an atypical increase (panel b). These smaller/larger intrinsic timescales were correlated with the severity of ASD (panels c and d) and GMV (panel e).
Tables
Table 1
Demographic data.
https://doi.org/10.7554/eLife.42256.006| Typically developing (TD) | Autism spectrum disorder (ASD) | P value | |
|---|---|---|---|
| Number of participants | 26 | 25 | - |
| Age | 25.3 ± 6.3 (18.1–39.4) | 27.3 ± 7.9 (18.4–50) | 0.4 |
| Sex | Male | Male | - |
| Laterality | Right-handed | Right-handed | - |
| Full IQ | 112.6 ± 12.0 (89–131) | 109.4 ± 13.6 (90–132) | 0.4 |
| Verbal IQ | 112.1 ± 12.1 (88–130) | 106.6 ± 13.8 (83–130) | 0.2 |
| Performance IQ | 110.3 ± 10.4 (90–129) | 110.9 ± 15.9 (83–133) | 0.9 |
| ADOS Social | - | 4.3 ± 1.4 (1–8) | - |
| ADOS Communication | - | 7.6 ± 2.3 (4–11_ | - |
| ADOS RRB | - | 1.1 ± 1.2 (0–3) | - |
| Mean head motion (mm) | 1.1 ± 0.6 (0.21–2.4) | 1.5 ± 0.8 (0.25–2.5) | 0.1 |
-
Mean ±SD (min–max)
Table 2
Results of whole-brain intrinsic timescale analysis
https://doi.org/10.7554/eLife.42256.008| Coordinates | ||||||
|---|---|---|---|---|---|---|
| Right/Left | Anatomical label | X | Y | Z | Cluster size | T value |
| TD > ASD | ||||||
| Right | Post-central gyrus | 58 | –14 | 44 | 470 | 5.2 |
| Left | Post-central gyrus | –58 | –14 | 40 | 309 | 4.3 |
| Right | Middle temporal gyrus | 60 | 2 | –26 | 170 | 4.8 |
| Left | Middle temporal gyrus | –70 | –26 | –6 | 321 | 4.3 |
| Right | Inferior occipital gyrus | 52 | –74 | –6 | 168 | 4.2 |
| Right | Inferior parietal lobule | 50 | –44 | 32 | 121 | 4.7 |
| Right | Middle insula | 50 | 10 | –4 | 228 | 4.3 |
| ASD > TD | ||||||
| Right | Caudate | 14 | 20 | 12 | 41 | 3.7 |
| Threshold: PFDR < 0.05. | ||||||
Additional files
-
Supplementary file 1
Supplementary table 1: Dataset for the reproducibility test. Supplementary table 2: Properties of the longitudinal dataset.
- https://doi.org/10.7554/eLife.42256.015
-
Transparent reporting form
- https://doi.org/10.7554/eLife.42256.016
Download links
A two-part list of links to download the article, or parts of the article, in various formats.
Downloads (link to download the article as PDF)
Open citations (links to open the citations from this article in various online reference manager services)
Cite this article (links to download the citations from this article in formats compatible with various reference manager tools)
Atypical intrinsic neural timescale in autism
eLife 8:e42256.
https://doi.org/10.7554/eLife.42256


