Conformational change within the extracellular domain of B cell receptor in B cell activation upon antigen binding
- Tsinghua University, China
Figures
Figure 1 with 2 supplements
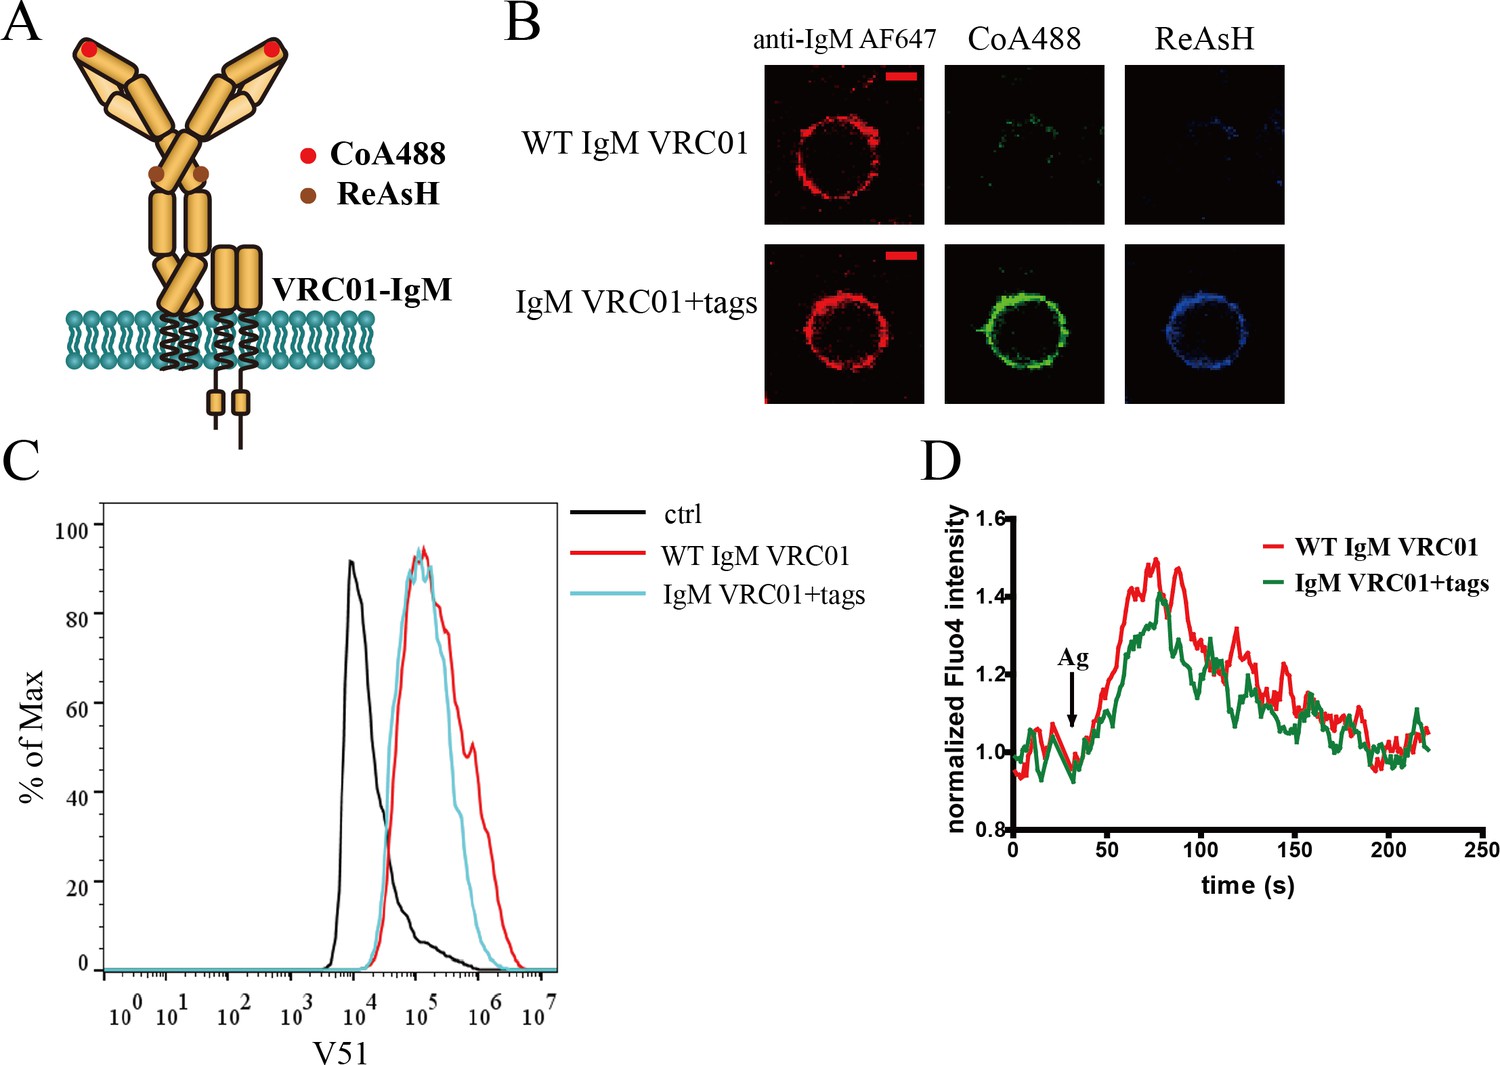
Site-specific labeling in mIg heavy chain of IgM-BCR.
(A) Schematic representation of dually tagged VRC01-IgM-BCR. ybbR tag inserted in N-terminus of IgM heavy chain labeled by CoA 488 was shown as red circle, while tetracysteine tag in Cμ2 region of IgM heavy chain labeled by ReAsH was shown as brown circle. (B) Representative confocal images of WT and dually tagged VRC01-IgM-BCR expressed in 293T cells. ybbR tag and tetracysteine tag were stained by CoA 488 and ReAsH, respectively. Alexa Fluor 647 (AF647) Fab fragment of goat anti-human IgM Fc5μ was used for BCR staining. Scale bar, 5 μm. (C) WT and dually tagged VRC01-IgM-BCR expressing 293T cells binding with V51 monomer antigen. 293T cells without BCR expression were used as a control. (D) Ca2+ mobilization analysis of A20II1.6 B cells expressing WT and dually tagged VRC01-IgM-BCR stimulated by V51 trimer antigen.
Figure 1—figure supplement 1
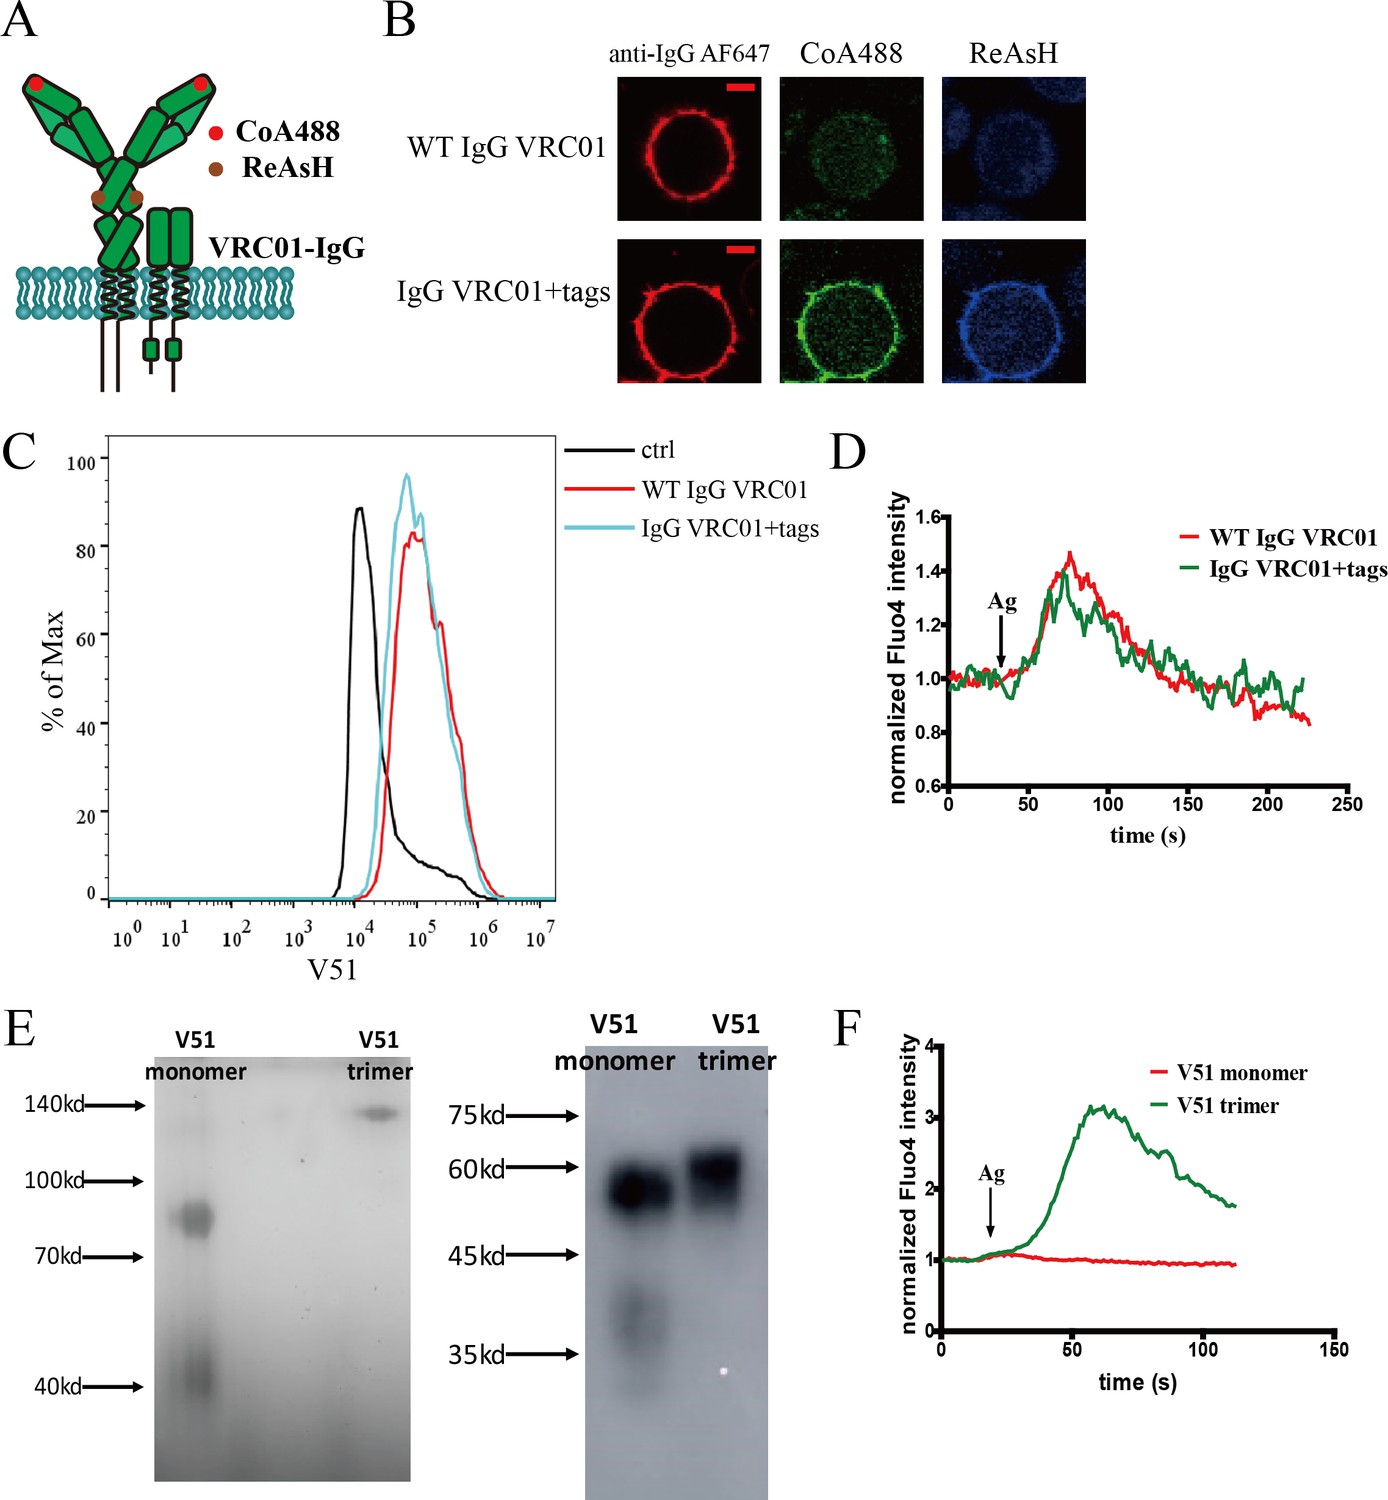
Site-specific labeling in mIg heavy chain of IgG-BCR.
(A) Schematic representation of dually tagged VRC01-IgG-BCR. ybbR tag inserted in N-terminus of IgG heavy chain labeled by CoA 488 was shown as red circle, while tetracysteine tag in Cγ2 region of IgG heavy chain labeled by ReAsH was shown as brown circle. (B) Representative confocal images of WT and dually tagged VRC01-IgG-BCR expressed in 293T cells. ybbR tag and tetracysteine tag were stained by CoA 488 and ReAsH, respectively. Alexa Fluor 647 (AF647) Fab fragment of goat anti-human IgG Fcγ was used for BCR staining. Scale bar, 5 μm. (C) WT and dually tagged VRC01-IgG-BCR expressing 293T cells binding with V51 monomer antigen. 293T cells without BCR expression were used as a control. (D) Ca2+ mobilization analysis of A20II1.6 B cells expressing WT and dually tagged VRC01-IgG-BCR stimulated by V51 trimer antigen. (E) Left: Blue native-polyacrylamide gel electrophoresis (BN-PAGE). His-tagged V51 monomer and trimer were analyzed in non-reducing condition. Right: Western blotting. His-tagged V51 monomer and trimer were analyzed using anti-His tag antibody in reducing condition. (F) Ca2+ mobilization analysis of Ramos B cells expressing WT VRC01-IgM-BCR stimulated by V51 trimer or V51 monomer antigen.
Figure 1—figure supplement 2
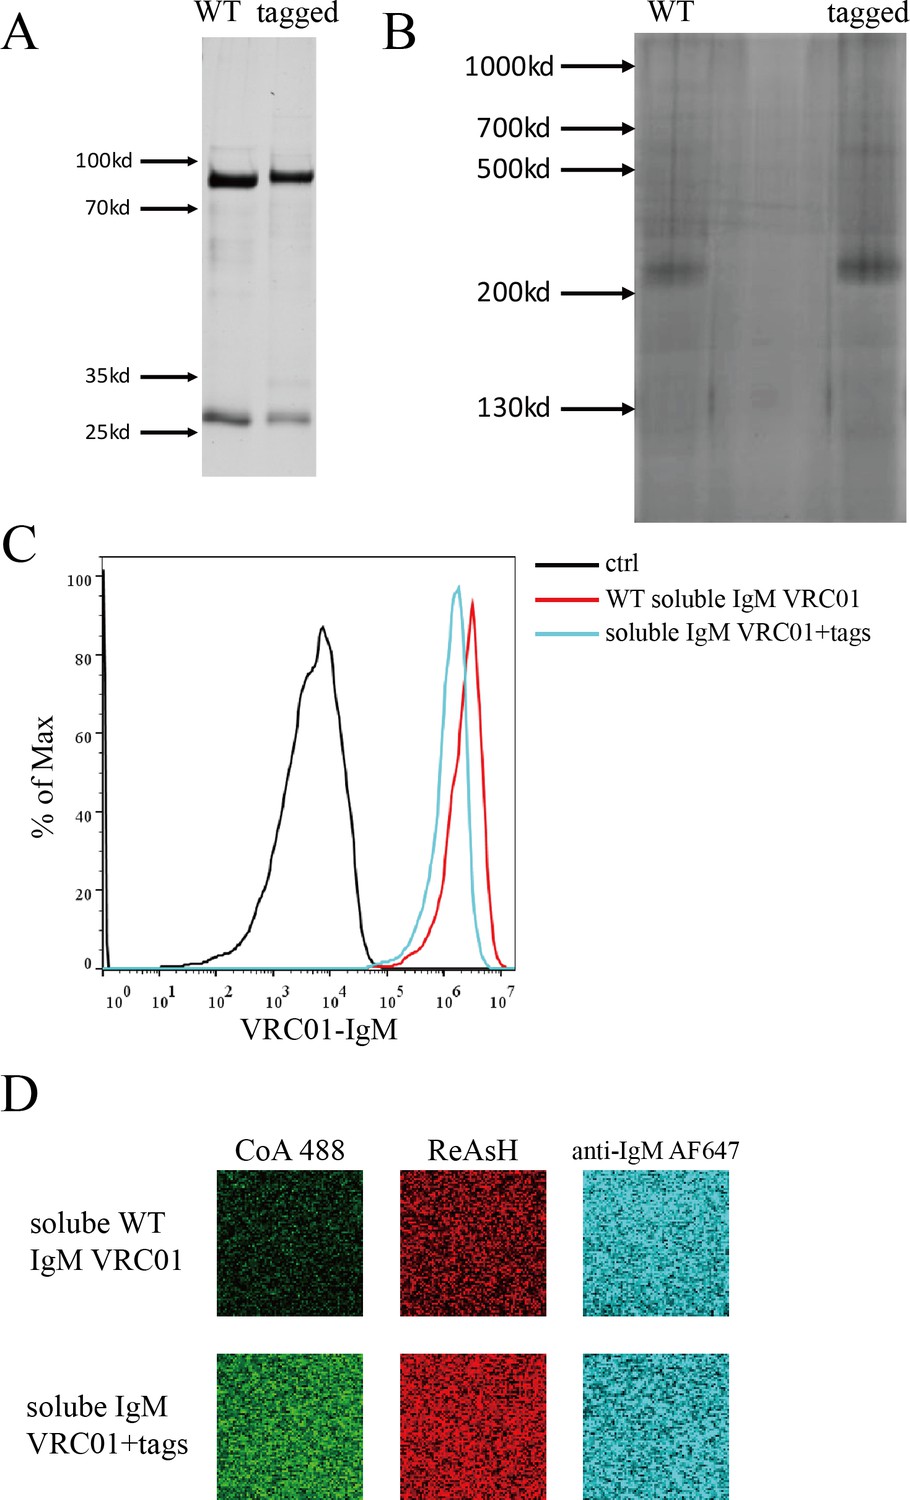
Expression of WT and tagged soluble VRC01-IgM monomer.
(A–B) SDS-PAGE (A) and BN-PAGE (B) of WT and dually tagged soluble VRC01-IgM. (C) WT and dually tagged soluble VRC01-IgM can bind with gp120 expressing 293T cells. Cells were incubated with WT or dually tagged soluble VRC01-IgM followed by staining with AF647 anti-human IgM Fc5μ. 293T cells without gp120 expression were used as a control. (D) Dually tagged soluble VRC01-IgM can be labeled by CoA 488 and ReAsH, simultaneously.
Figure 2 with 2 supplements
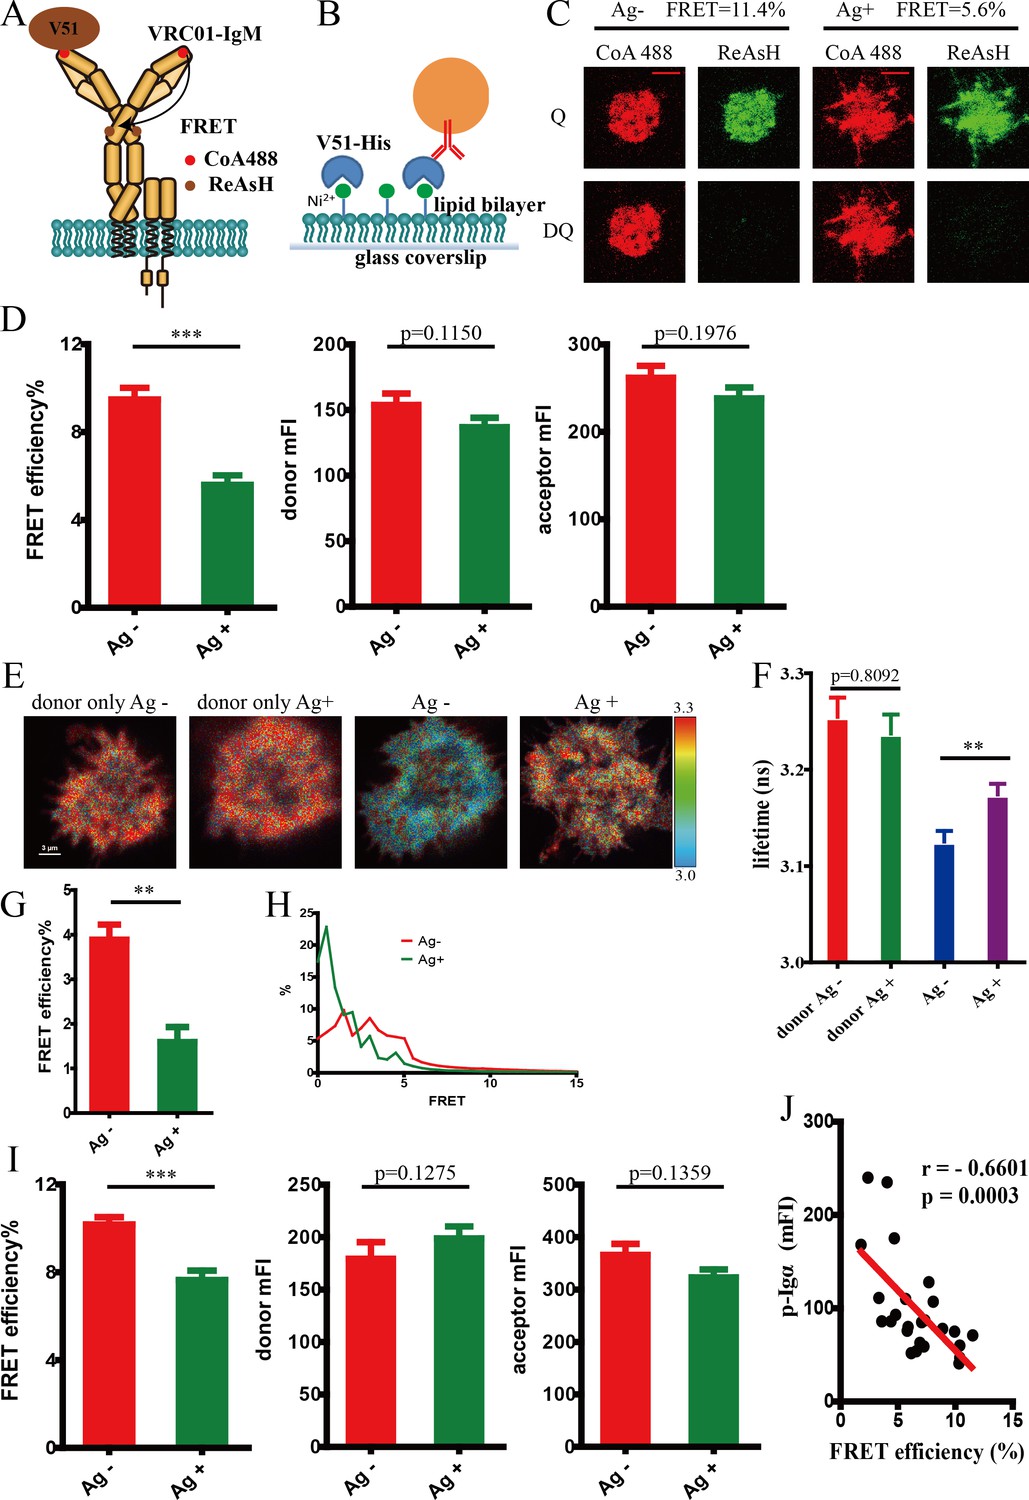
Conformational change within mIg heavy chain of VRC01-IgM-BCR upon antigen engagement.
(A) Schematic illustration showing FRET efficiency between CoA 488 label at N-terminus (red circle) and ReAsH label at Cμ2 domain (brown circle) of dually tagged VRC01-IgM-BCR. (B) Schematic illustration showing V51 monomer fused with poly-histidine tag presented on the surface of Ni2+-containing planar lipid bilayer (PLB) membranes on supported glass coverslips. (C–D) Dequenching FRET to measure the FRET efficiency between CoA 488 and ReAsH in 293T cells expressing dually tagged VRC01-IgM-BCR activated by V51 monomer antigen. Representative TIRFM images of V51-activated and non-activated 293T cells were shown. Cells with equal donor intensity and equal acceptor intensity were used for FRET analysis. Scale bar is 5 μm. Data are from at least 34 cells over five independent experiments. Q: quench; DQ: dequench. (E–H) FLIM-FRET to measure the FRET efficiency between CoA 488 and ReAsH of dually tagged VRC01-IgM-BCR expressed in 293T cells stimulated by V51 monomer antigen. (E) Representative FLIM images of V51-activated and non-activated 293T cells stained by donor only (CoA 488) or stained by donor and acceptor (CoA 488 + ReAsH) were shown. Scale bar is 3 μm. (F–G) Fluorescence lifetime and lifetime-based FRET efficiency of dually tagged VRC01-IgM-BCR expressing 293T cells. (H) FRET efficiency distribution of all measured dually tagged VRC01-IgM-BCR molecules. Data are from at least 11 cells. (I) Dequenching FRET to measure the FRET efficiency between CoA 488 and ReAsH in A20II1.6 B cells expressing dually tagged VRC01-IgM-BCR activated by V51 monomer antigen. Cells with equal donor intensity and equal acceptor intensity were used for FRET analysis. Data are from at least 28 cells. (J) The association of FRET efficiency between CoA 488 and ReAsH with the mean intensity of the p-Igα recruited into the immunological synapse in A20II1.6 B cells was indicated by Spearman's rank correlation coefficient (r). Error bars represent mean ± SEM. Two-tailed t-tests were used for the statistical comparisons. ***p<0.001; **p<0.01.
Figure 2—figure supplement 1

Conformational change within mIg heavy chain of VRC01-IgM-BCR upon antigen engagement was mainly attributed to the change of intramolecular FRET.
(A–B) Schematic illustration showing the process to deconvolve intermolecular and intramolecular FRET. In brief, tagged VRC01-IgM-BCRs were diluted by WT VRC01-IgM-BCRs to minimize intermolecular FRET. In the situation that two tags are in the same plasmid for expressing dually tagged BCR (A), most of the observed FRET signal will be intramolecular FRET. In the situation that two tags are in distinct two plasmids for expressing two types of singly tagged BCR (B), respectively, most of the observed FRET signal will be intermolecular FRET. (C–F) Dequenching FRET to measure the FRET efficiency between CoA 488 and ReAsH in 293T cells expressing tagged VRC01-IgM-BCR activated by V51 monomer antigen. Intramolecular FRET between CoA 488 and ReAsH in the same individual VRC01-IgM-BCR molecule (C) and intermolecular FRET between CoA 488 and ReAsH in two neighboring VRC01-IgM-BCR molecules (D) were shown. Intramolecular FRET (E) and intermolecular FRET (F) between CoA 488 and ReAsH without dilution were also shown. Cells with equal donor intensity and equal acceptor intensity were used for FRET analysis. Data are from at least 21 cells over three independent experiments. Two-tailed t-tests were used for the statistical comparisons. ***p<0.001; **p<0.01.
Figure 2—figure supplement 2
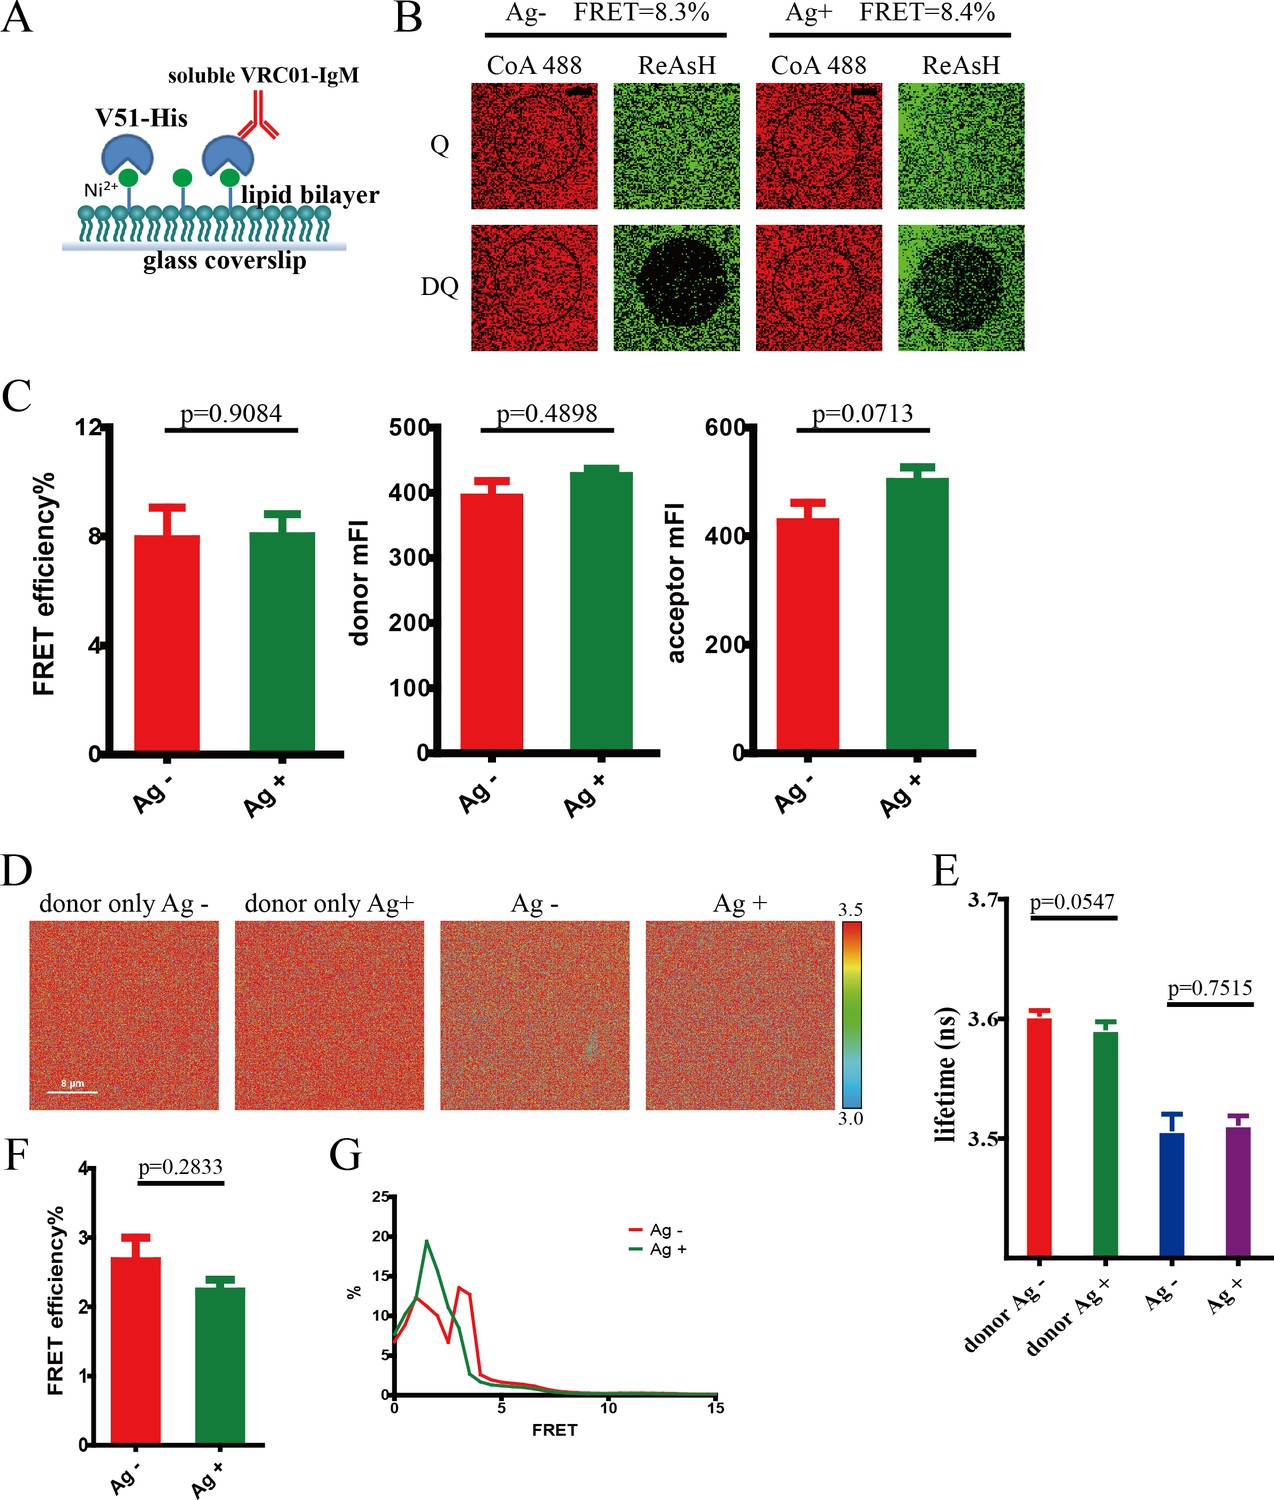
Conformational change within Ig heavy chain of soluble VRC01-IgM monomer upon antigen engagement.
(A) Schematic presentation of soluble VRC01-IgM monomer binding with V51 monomer presented on the surface of Ni2+-containing PLB membranes on supported glass coverslips. (B–C) Dequenching FRET to measure the FRET efficiency between CoA 488 and ReAsH in dually tagged soluble VRC01-IgM. Representative confocal images of V51-activated and non-activated soluble VRC01-IgM molecules on glass coverslip were shown. Data are from at least 13 images (38.5 × 38.5 μm). (D–G) FLIM-FRET to measure the FRET efficiency between CoA 488 and ReAsH of dually tagged soluble VRC01-IgM-BCR molecules stimulated by V51 monomer antigen. (D) Representative FLIM images of V51-activated and non-activated soluble VRC01-IgM molecules stained by donor only (CoA 488) or stained by donor and acceptor (CoA 488 + ReAsH) were shown. Scale bar is 8 μm. (E–F) Fluorescence lifetime and lifetime-based FRET efficiency of dually tagged soluble VRC01-IgM-BCR molecules. Data are from at least six images (30 × 30 μm). (G) FRET efficiency distribution of all measured dually tagged VRC01-IgM-BCR molecules. Error bars represent mean ± SEM. Two-tailed t-tests were used for the statistical comparisons.
Figure 3 with 2 supplements
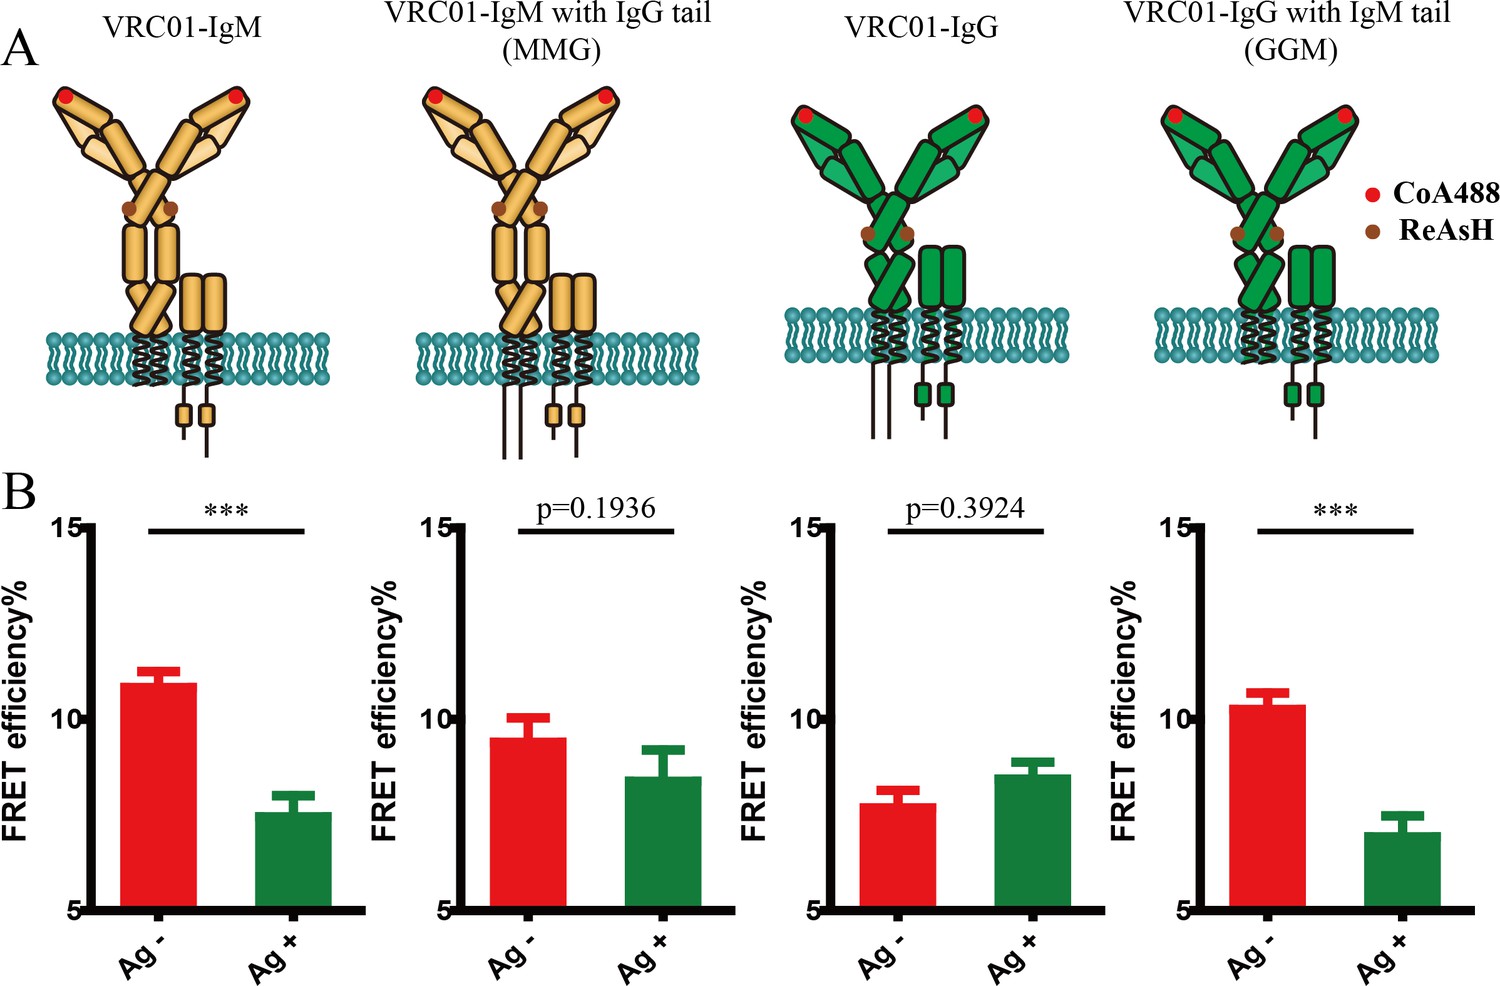
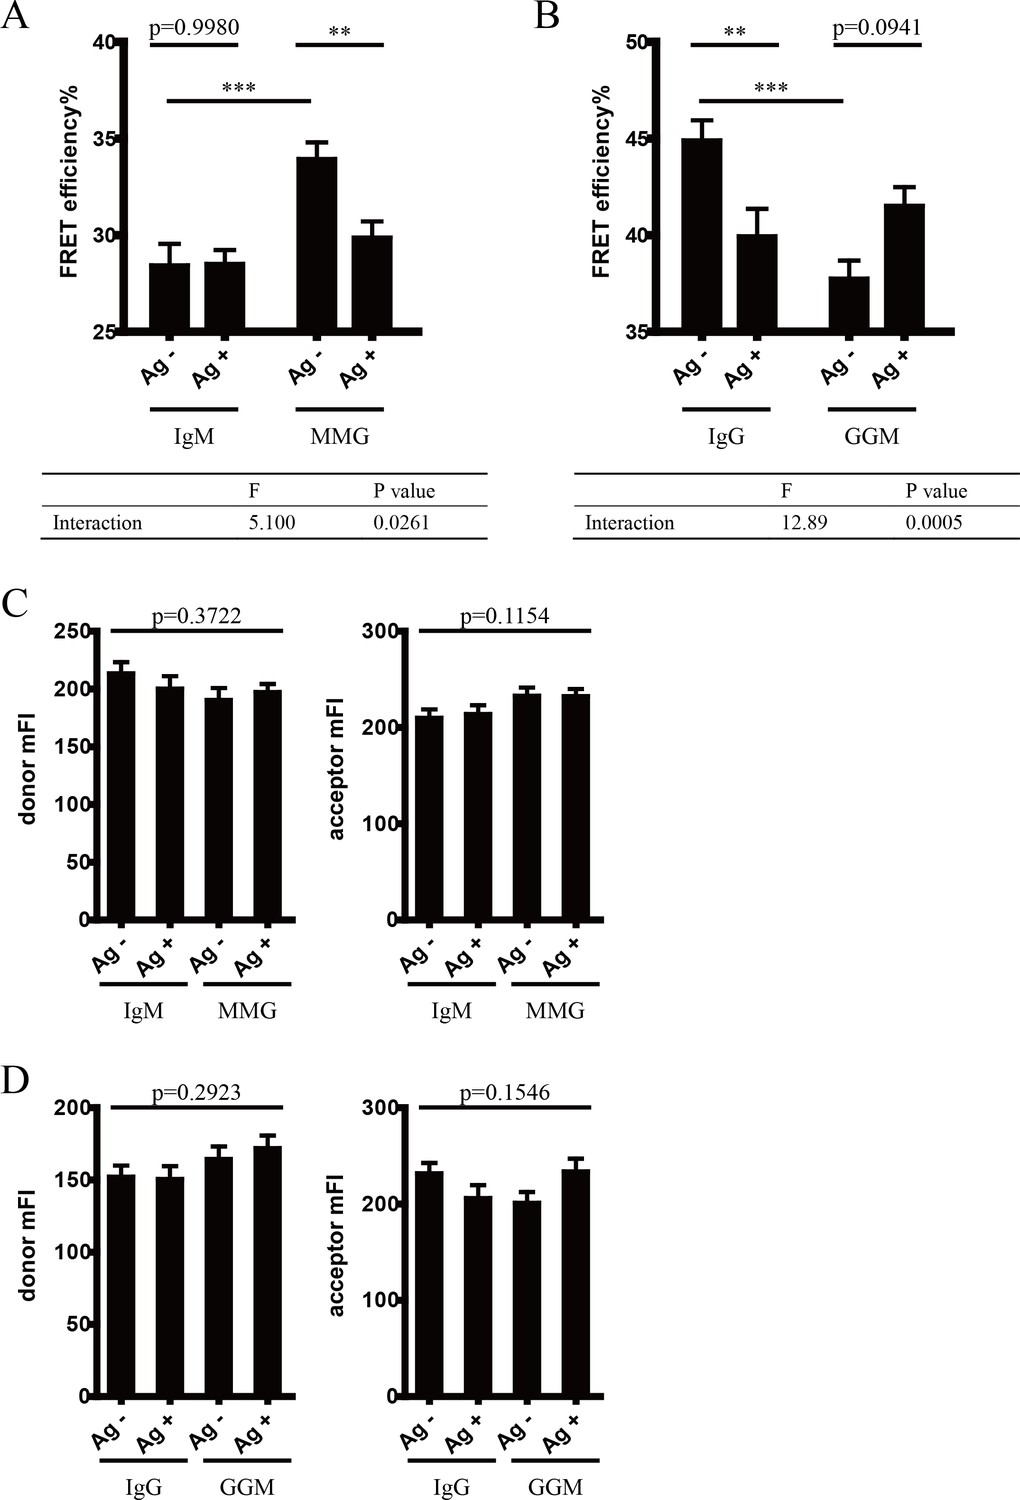
Conformational change within mIg heavy chain is dependent on the cytoplasmic tail.
(A) Schematic illustration of different types of VRC01-BCR equipped with different cytoplasmic tail. FRET efficiency between CoA 488 label at N-terminus (red circle) and ReAsH at Cμ2 domain (or Cγ2 portion, brown circle) of dually tagged VRC01-BCR was examined. (B) Dequenching FRET to measure the FRET efficiency between CoA 488 and ReAsH in 293T cells expressing dually tagged VRC01-BCR activated by V51 monomer antigen. From left to right: IgM, MMG, IgG, GGM. Error bars represent mean ± SEM. Data are from at least 19 cells over two independent experiments. Two-tailed t-tests were used for the statistical comparisons. ***p<0.001.
Figure 3—figure supplement 1
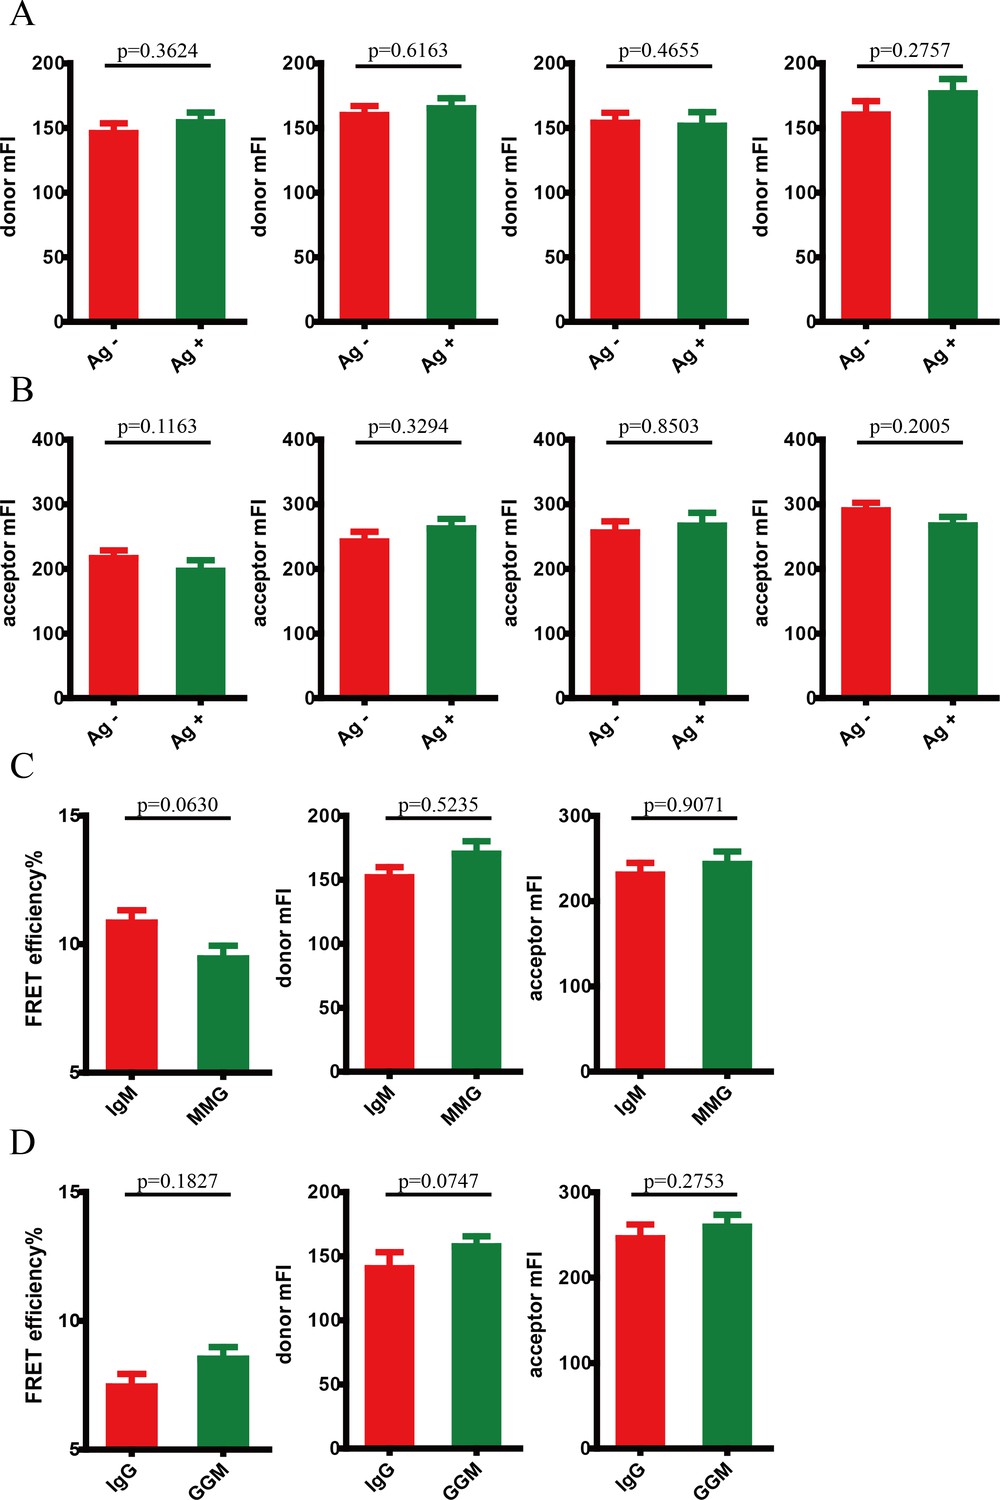
Conformational change within mIg heavy chain is dependent on the cytoplasmic tail.
(A–B) Cells with equal donor intensity (A) and equal acceptor intensity (B) were used for FRET analysis. From left to right: IgM, MMG, IgG, GGM. (C–D) Dequenching FRET to measure the FRET efficiency between CoA 488 and ReAsH in 293T cells expressing dually tagged VRC01-BCR in the absence of antigen. (C) Comparison between IgM and MMG; (D) comparison between IgG and GGM. Error bars represent mean ± SEM. Two-tailed t-tests were used for the statistical comparisons.
Figure 3—figure supplement 2
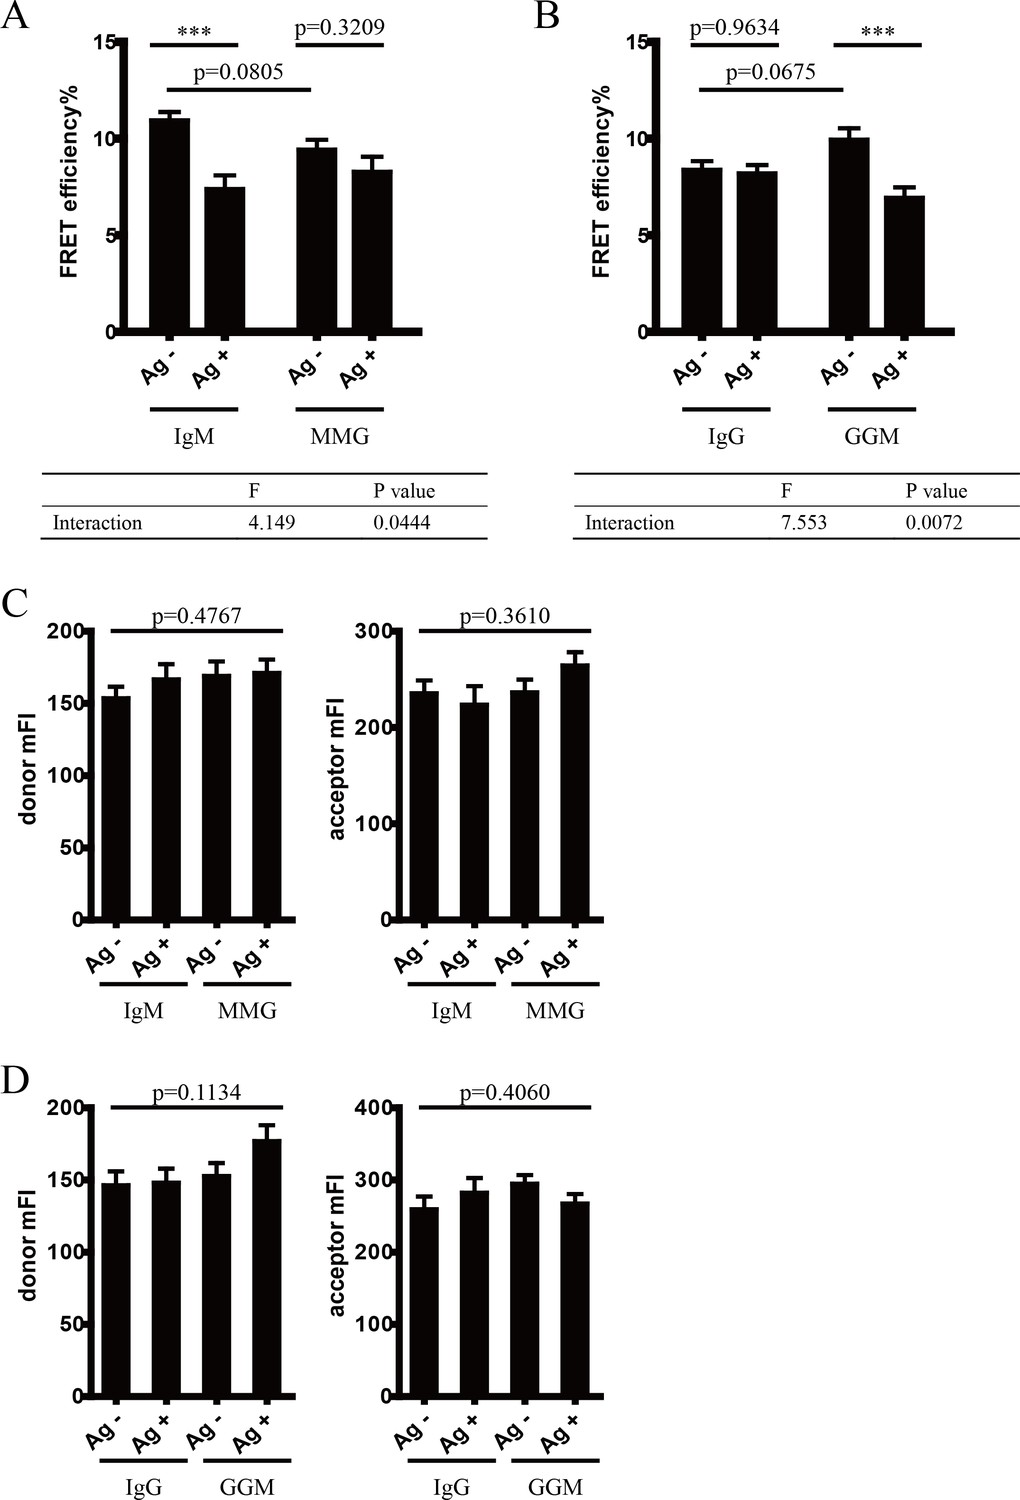
Conformational change within mIg heavy chain is dependent on the cytoplasmic tail.
(A–B) Two-way ANOVA was used for analysis of the interaction effect between Ig cytoplasmic tail and antigen engagement. Two-way ANOVA with Sidak’s correction for multiple comparisons was used for statistical comparison between each group. (A) Comparison between IgM and MMG; (B) comparison between IgG and GGM. (C–D) Cells with comparable fluorescent intensity of donor and acceptor were used for analysis. One-way ANOVA was applied. (C) Comparison between IgM and MMG; (D) comparison between IgG and GGM. ***p<0.001.
Figure 4 with 3 supplements
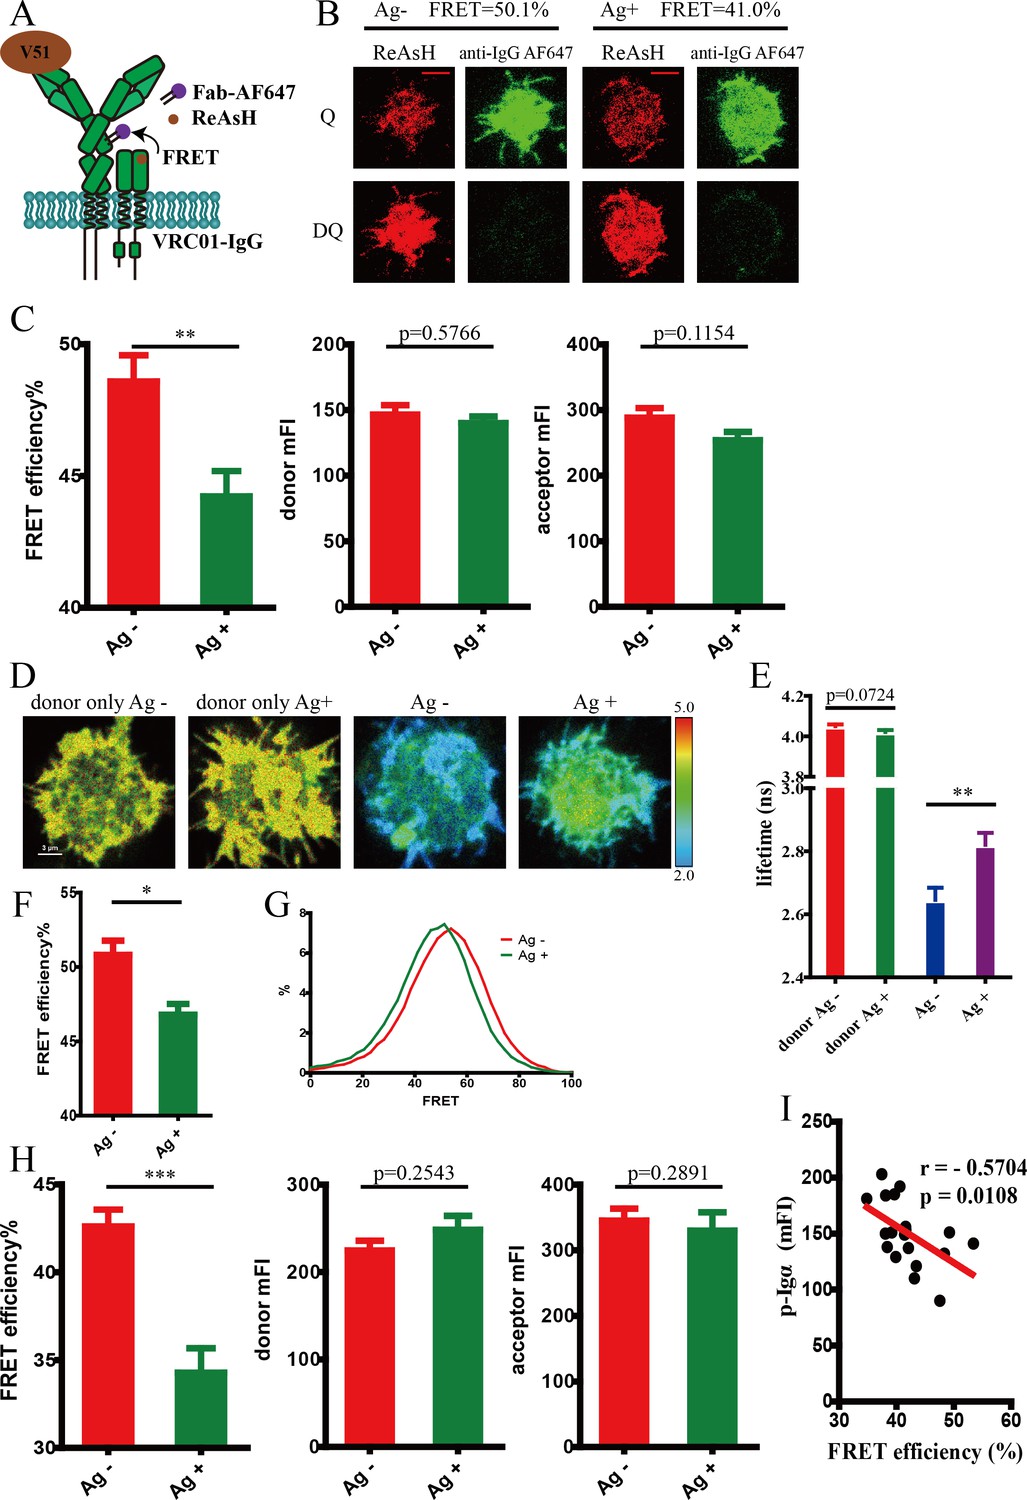
Conformational change in the spatial relationship between mIg heavy chain and Igβ in VRC01-IgG-BCR upon antigen engagement.
(A) Schematic illustration showing FRET efficiency between ReAsH label in Igβ (brown circle) and AF647 label in Fc region (purple circle) of tagged VRC01-IgG-BCR. (B–C) Dequenching FRET to measure the FRET efficiency between ReAsH and AF647 in 293T cells expressing tagged VRC01-IgG-BCR activated by V51 monomer antigen. Representative TIRFM images of V51-activated and non-activated 293T cells were shown. Cells with equal donor intensity and equal acceptor intensity were used for FRET analysis. Scale bar is 5 μm. Data are from at least 30 cells over two independent experiments. Q: quench; DQ: dequench. (D–G) FLIM-FRET to measure the FRET efficiency between ReAsH and AF647 of tagged VRC01-IgG-BCR expressed in 293T cells stimulated by V51 monomer antigen. (D) Representative FLIM images of V51-activated and non-activated 293T cells stained by donor only (ReAsH) or stained by donor and acceptor (ReAsH +AF647) were shown. Scale bar is 3 μm. (E–F) Fluorescence lifetime and lifetime-based FRET efficiency of tagged VRC01-IgG-BCR expressing 293T cells. (G) FRET efficiency distribution of all measured tagged VRC01-IgG-BCR molecules. Data are from at least nine cells. (H) Dequenching FRET to measure the FRET efficiency between ReAsH and AF647 in A20II1.6 B cells expressing tagged VRC01-IgG-BCR activated by V51 monomer antigen. Cells with equal donor intensity and equal acceptor intensity were used for FRET analysis. Data are from at least 24 cells. (I) The association of FRET efficiency between ReAsH and AF647 with the mean intensity of the p-Igα recruited into the immunological synapse in A20II1.6 B cells was indicated by Spearman's rank correlation coefficient (r). Error bars represent mean ± SEM. Two-tailed t-tests were used for the statistical comparisons. ***p<0.001; **p<0.01; *p<0.05.
Figure 4—figure supplement 1

Site-specific labeling in Igβ of IgM-BCR.
(A) Schematic representation of tagged VRC01-IgM-BCR. Tetracysteine tag in extracellular domain of Igβ labeled by ReAsH was shown as brown circle. Fab fragment of goat anti-human IgM Fc5μ was shown as purple circle. (B) Representative confocal images of WT and tagged VRC01-IgM-BCR expressed in 293T cells. Tetracysteine tag was stained by ReAsH. Fc portion of IgM heavy chain was stained by AF647 Fab fragment of goat anti-human IgM Fc5μ. Scale bar is 5 μm. (C) WT and tagged VRC01-IgM-BCR expressing 293T cells binding with V51 monomer antigen. 293T cells without BCR expression were used as a control. (D) Ca2 +mobilization analysis of A20II1.6 B cells expressing WT and tagged VRC01-IgM-BCR stimulated by V51 trimer antigen.
Figure 4—figure supplement 2

Site-specific labeling in Igβ of IgG-BCR.
(A) Schematic representation of tagged VRC01-IgG-BCR. Tetracysteine tag in extracellular domain of Igβ was shown as brown circle. Fab fragment of goat anti-human IgG Fcγ was shown as purple circle. (B) Representative confocal images of WT and tagged VRC01-IgG-BCR expressed in 293T cells. Tetracysteine tag was stained by ReAsH. Fc portion of IgG heavy chain was stained by AF647 Fab fragment of goat anti-human IgG Fcγ. Scale bar is 5 μm. (C) WT and tagged VRC01-IgG-BCR expressing 293T cells binding with V51 monomer antigen. 293T cells without BCR expression were used as a control. (D) Ca2+ mobilization analysis of A20II1.6 B cells expressing WT and tagged VRC01-IgG-BCR stimulated by V51 trimer antigen.
Figure 4—figure supplement 3
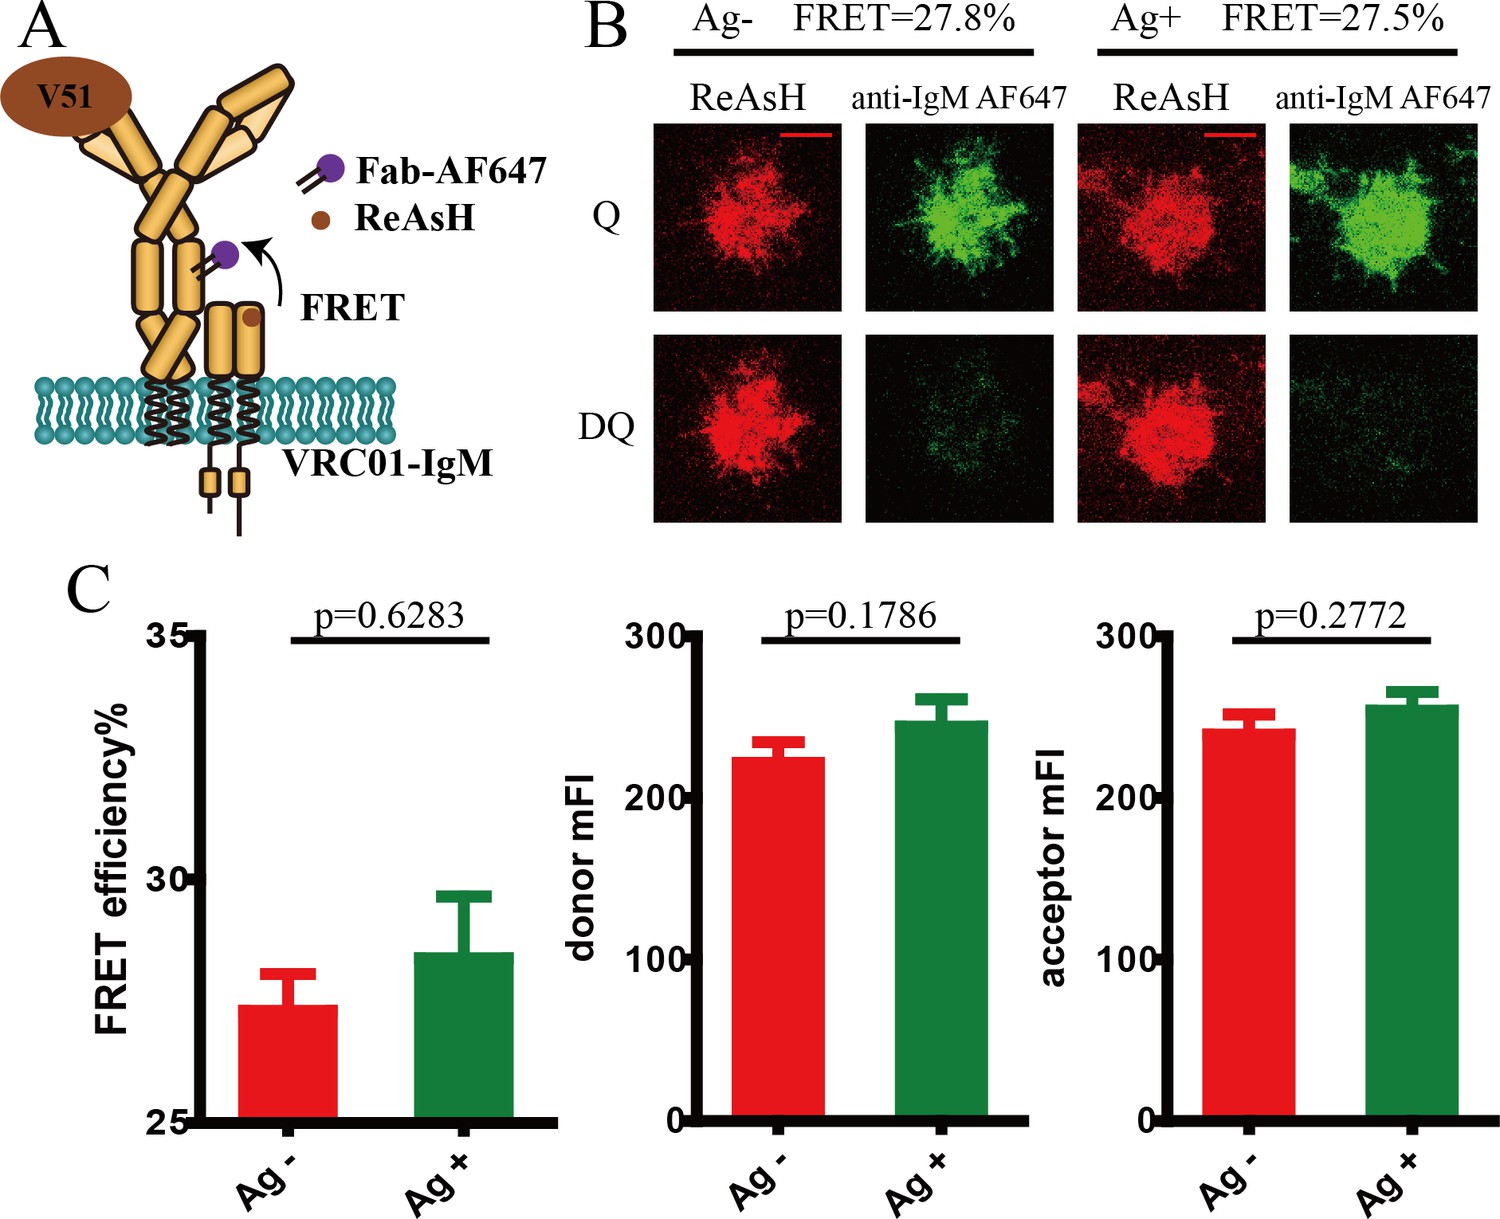
Conformational change in the spatial relationship between mIg heavy chain and Igβ in VRC01-IgM-BCR upon antigen engagement.
(A) Schematic illustration showing FRET efficiency between ReAsH label in Igβ (brown circle) and AF647 label in Fc region (purple circle) of tagged VRC01-IgM-BCR. (B–C) Dequenching FRET to measure the FRET efficiency between ReAsH and AF647 in 293T cells expressing tagged VRC01-IgM-BCR activated by V51 monomer antigen. Representative TIRFM images of V51-activated and non-activated 293T cells were shown. Cells with equal donor intensity and equal acceptor intensity were used for FRET analysis. Scale bar is 5 μm. Data are from at least 20 cells over two independent experiments. Q: quench; DQ: dequench.
Figure 5 with 2 supplements
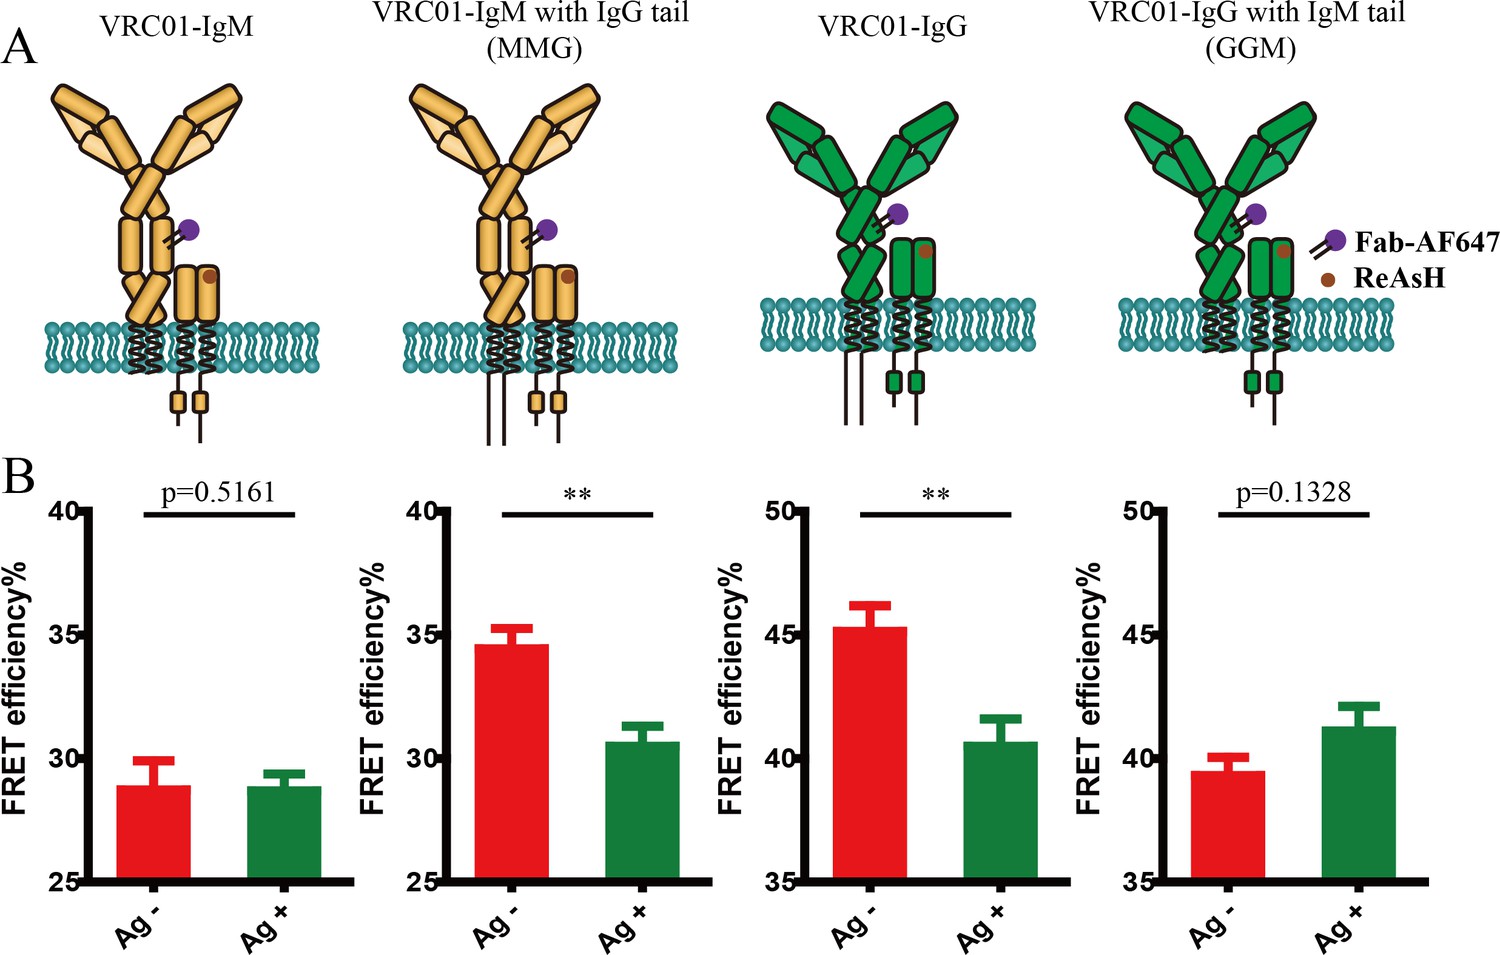
Conformational change in the spatial relationship between mIg heavy chain and Igβ is dependent on the cytoplasmic tail.
(A) Schematic illustration of different types of VRC01-BCR equipped with different cytoplasmic tail. FRET efficiency between ReAsH label at extracellular domain of Igβ (brown circle) and AF647 label at Fc portion (purple circle) of tagged VRC01-BCR was detected. (B) Dequenching FRET to measure the FRET efficiency between ReAsH and AF647 in 293T cells expressing tagged VRC01-BCR activated by V51 monomer antigen. From left to right: IgM, MMG, IgG, GGM. Error bars represent mean ± SEM. Data are from at least 19 cells over two independent experiments. Two-tailed t-tests were used for the statistical comparisons. **p<0.01.
Figure 5—figure supplement 1
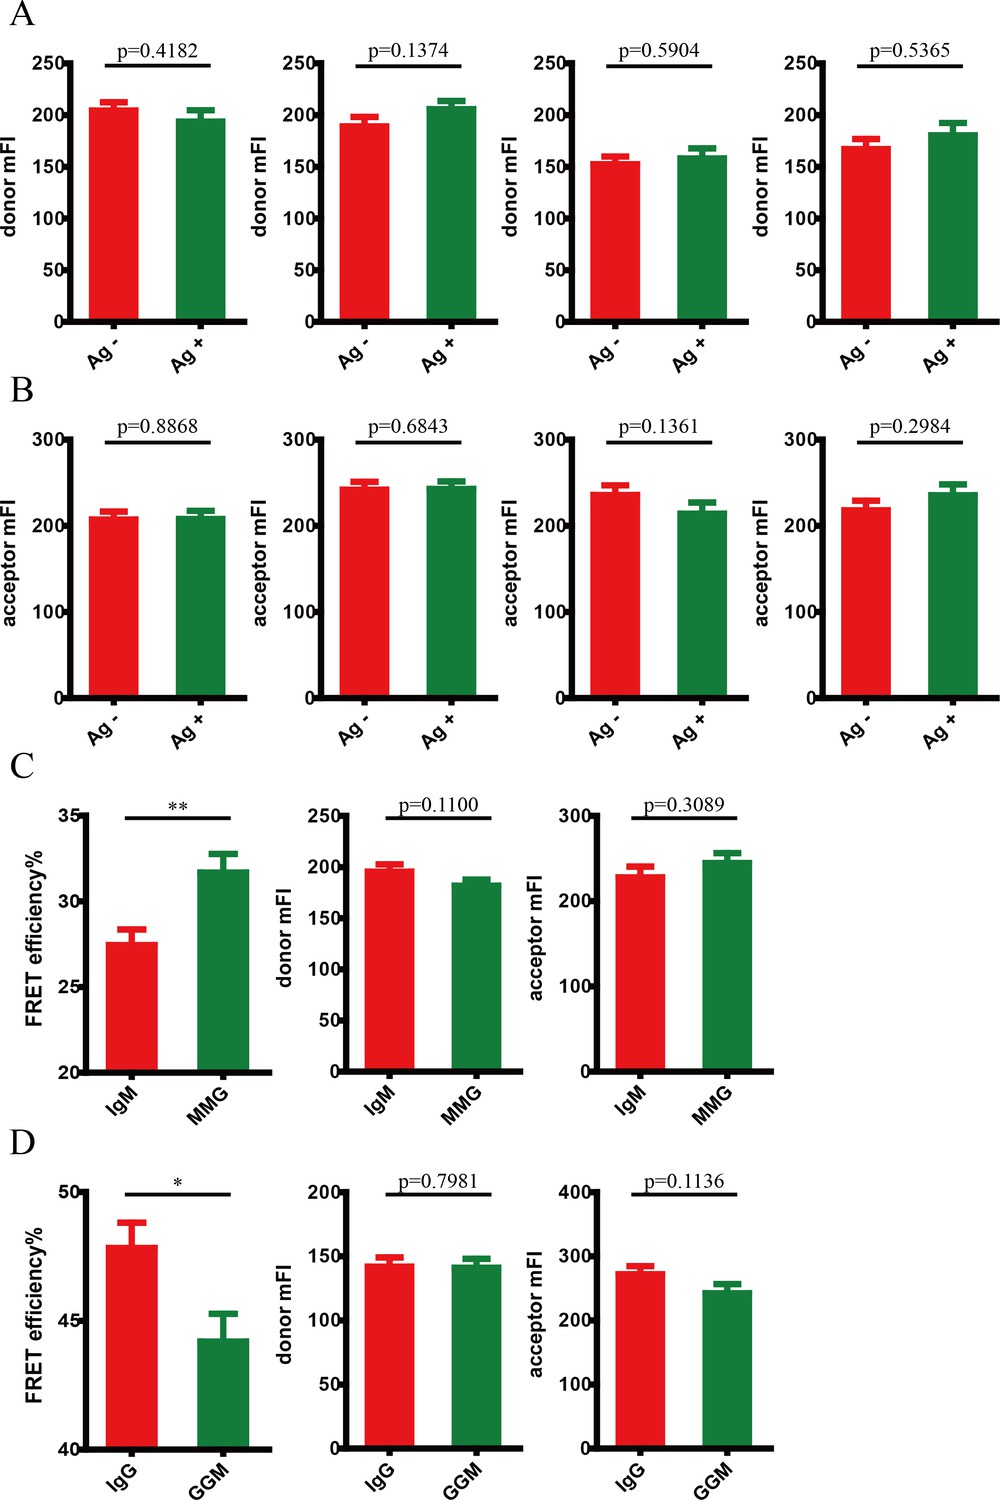
Conformational change in the spatial relationship between mIg heavy chain and Igβ is dependent on the cytoplasmic tail.
(A–B) Cells with equal donor intensity (A) and equal acceptor intensity (B) were used for FRET analysis. From left to right: IgM, MMG, IgG, GGM. Error bars represent mean ± SEM. (C–D) Dequenching FRET to measure the FRET efficiency between ReAsH and AF647 in 293T cells expressing tagged VRC01-BCR in the absence of antigen. (C) Comparison between IgM and MMG; (D) comparison between IgG and GGM. Two-tailed t-tests were used for the statistical comparisons. **p<0.01; *p<0.05.
Figure 5—figure supplement 2
Conformational change in the spatial relationship between mIg heavy chain and Igβ is dependent on the cytoplasmic tail.
(A–B) Two-way ANOVA was used for analysis of the interaction effect between Ig cytoplasmic tail and antigen engagement. Two-way ANOVA with Sidak’s correction for multiple comparisons was used for statistical comparison between each group. (A) Comparison between IgM and MMG; (B) comparison between IgG and GGM. (C–D) Cells with comparable fluorescent intensity of donor and acceptor were used for analysis. One-way ANOVA was applied. (C) Comparison between IgM and MMG; (D) comparison between IgG and GGM. ***p<0.001; **p<0.01.
Figure 6

Cartoon models of BCR conformational change.
(A) Conformational change model of IgM-BCR activation. Upon antigen engagement, distance between N-terminus and Cμ2 domain within mIgM increases, which might be resulted from stretching or bending of the hinge region. This conformational change might trigger the potential conformational change within Fc domain to expose the clustering interface in Cμ4 domain. (B) Conformational change model of IgG-BCR activation. After binding with antigen, potential conformational change within Cγ3 domain occurs independently of the distance change between N-terminus and Cγ2 within mIgG. Then the proximity between mIg and Igα/β decreases, which might be involved with the dissociation between IgG cytoplasmic tail plasma membrane. The exposure of the clustering interface in Cμ4 (or Cγ3) domain will then promote BCR clustering.
Author response image 1

Labeling of ybbR tag in Fc region or Igα/β of VRC01-IgM-BCR.
Author response image 2
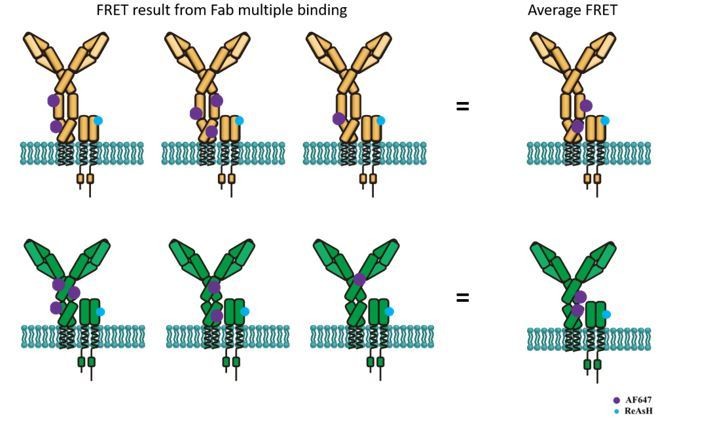
Schematic illustration showing average FRET between ReAsH labeled at Igβ and AF647-conjugated polyclonal Fab fragment of antibody in Fc region.
Top: FRET between ReAsH and AF647 (binding to IgM Fc5μ, which contains most of Cμ3/4 region) in IgM-BCR. Down: FRET between ReAsH and AF647 in IgG-BCR.
Author response image 3
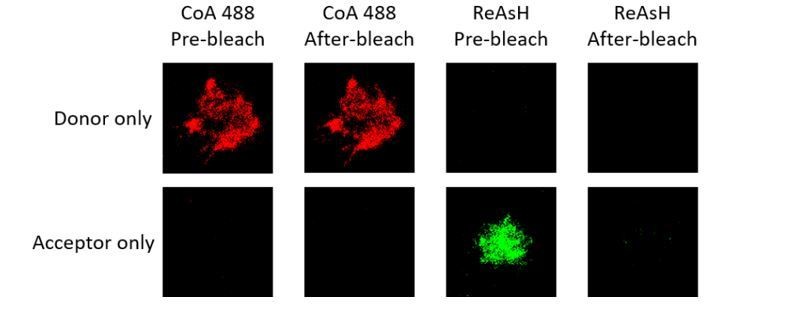
Representative images of donor only and acceptor only samples of tagged VRC01-IgM-BCR before and after acceptor photobleaching.
Author response image 4

Representative images of donor only (ReAsH labeled in Igβ) and acceptor only (AF647 labeled in Fcγ region) samples of tagged VRC01-IgG-BCR before and after acceptor photobleaching.
Author response image 5
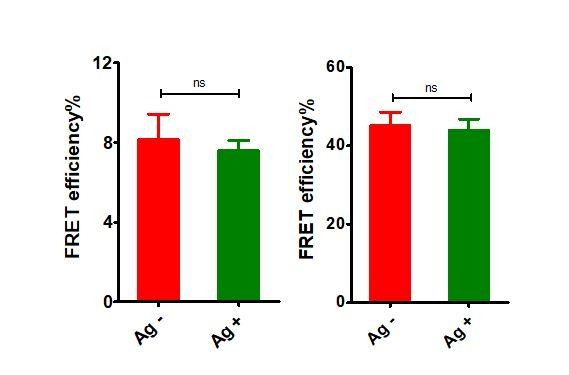
“FRET efficiency” in donor only (ReAsH labeled in Igβ) and acceptor only (AF647 labeled in Fcγ region) samples of tagged VRC01-IgG-BCR upon antigen engagement.
Left: donor only samples; Right: acceptor only samples.
Author response image 6
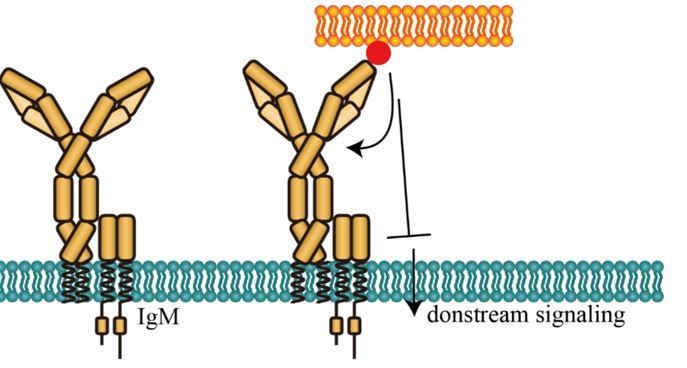
Potential inhibitory effect of conformational change between N terminus and Cμ2 domain of mIg in IgM-BCR.
Author response image 7
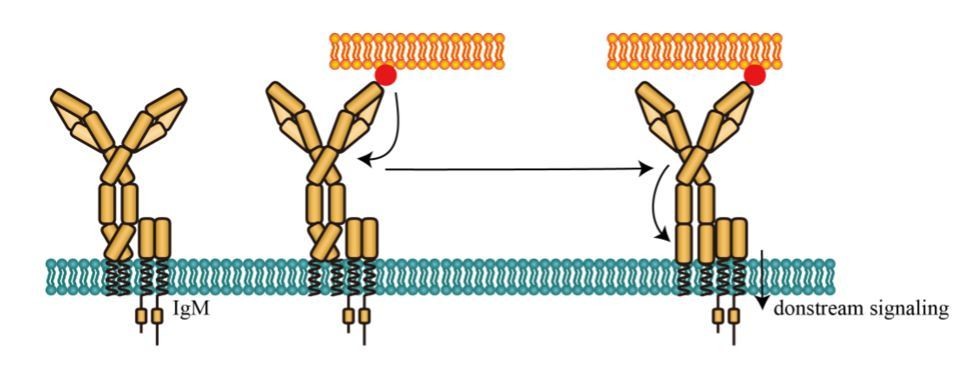
Potential activating effect of conformational change between N terminus and Cμ2 domain of mIg in IgM-BCR.
Author response image 8
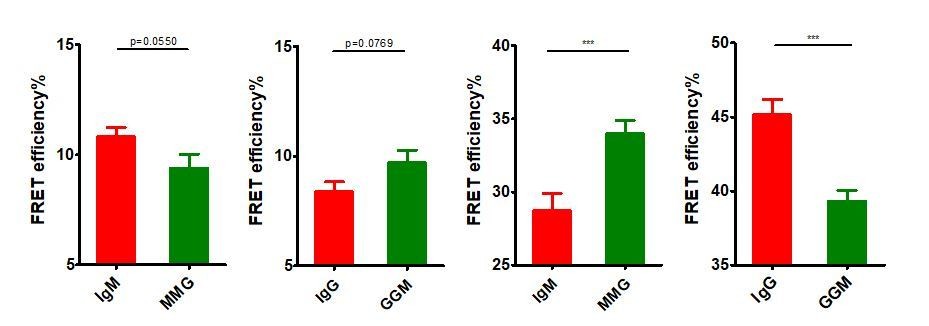
Basal FRET comparison in BCRs with distinct Ig cytoplasmic tail using two-tailed t-test.
From left to right: IgM vs. MMG in Figure 3, IgG vs. GGM in Figure 3, IgM vs. MMG in Figure 5, IgG vs. GGM in Figure 5.
Author response image 9

FRET efficiency, mean fluorescent intensity of donor and mean fluorescent intensity of acceptor before matching the fluorescent intensity of control group and antigen group were shown.
Since the fluorescent intensity of donor in control group was significantly lower, a subset of cells with comparable donor fluorescent intensity were selected as shown in red square for further analysis (top). FRET efficiency, mean fluorescent intensity of donor and mean fluorescent intensity of acceptor after matching the fluorescent intensity of control group and antigen group were shown (bottom).
Additional files
-
Transparent reporting form
- https://doi.org/10.7554/eLife.42271.019
Download links
A two-part list of links to download the article, or parts of the article, in various formats.
Downloads (link to download the article as PDF)
Open citations (links to open the citations from this article in various online reference manager services)
Cite this article (links to download the citations from this article in formats compatible with various reference manager tools)
Conformational change within the extracellular domain of B cell receptor in B cell activation upon antigen binding
eLife 8:e42271.
https://doi.org/10.7554/eLife.42271


