A generally conserved response to hypoxia in iPSC-derived cardiomyocytes from humans and chimpanzees
- University of Chicago, United States
Figures
Figure 1 with 5 supplements
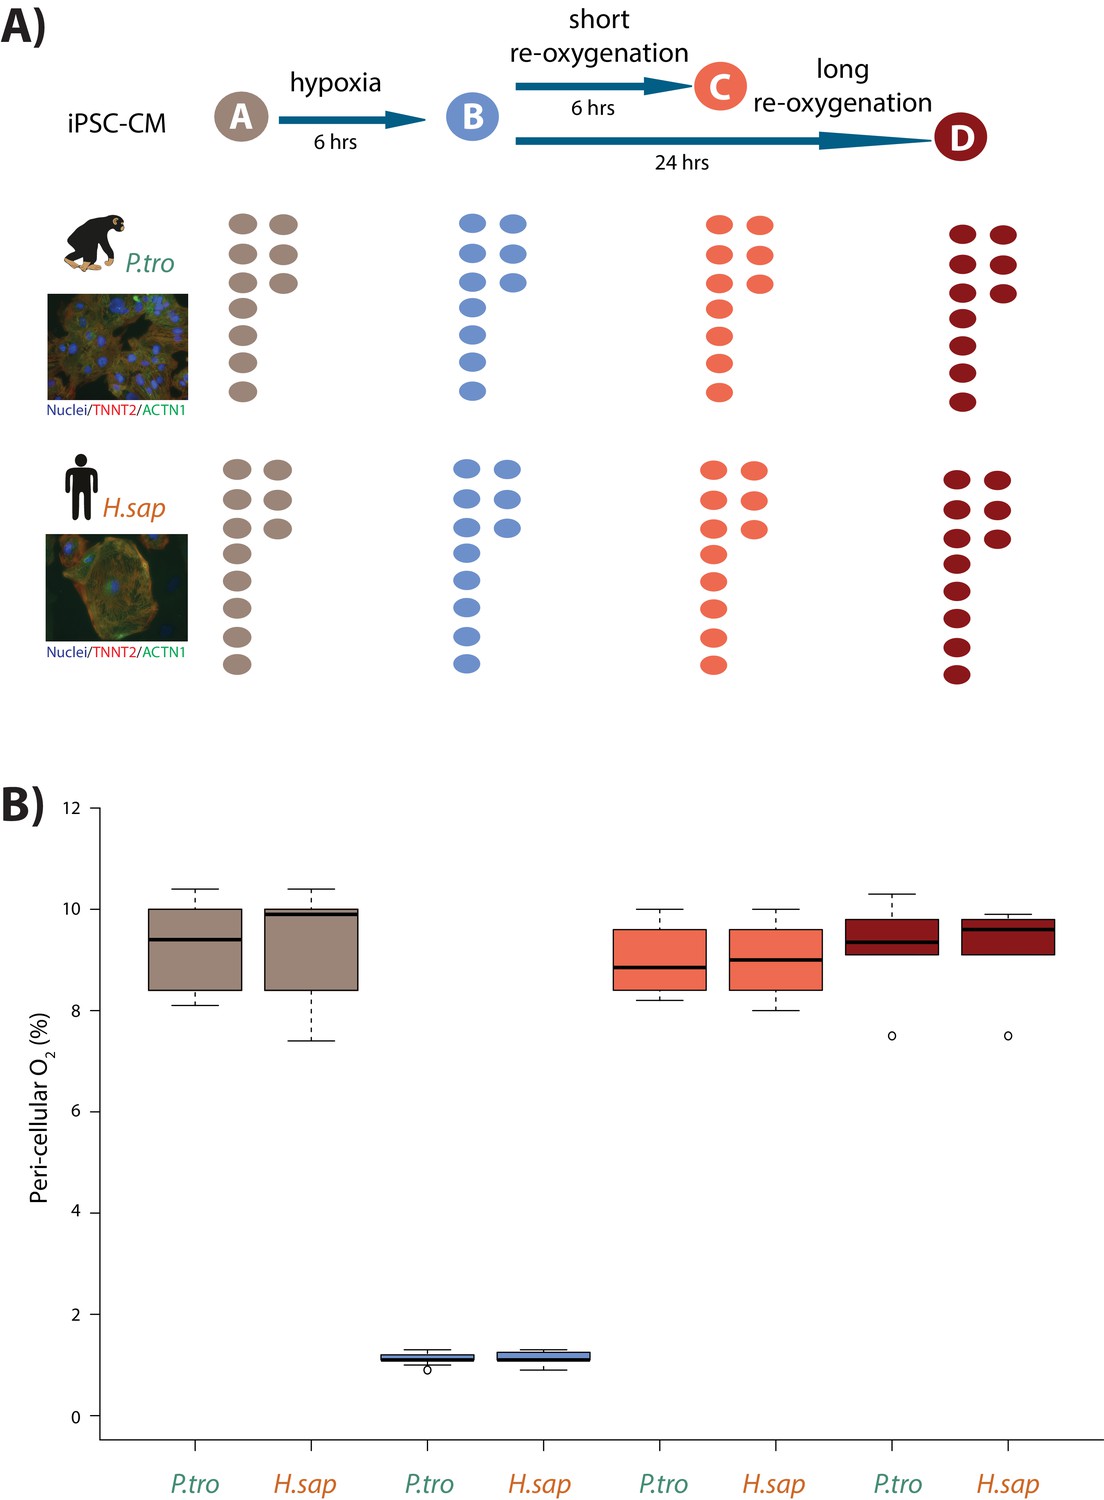
Induction of hypoxia in human and chimpanzee iPSC-CMs.
(A) Experimental design of the study. Cardiomyocytes were differentiated from iPSCs from eight human (H.sap), and seven chimpanzee (P.tro) individuals together with replicates from three individuals of each species. For the oxygen stress experiment iPSC-CMs in each species were cultured in normoxic conditions (10% O2 - condition A) for 6 hr prior to induction of hypoxia at 1% O2 for 6 hr (condition B). Following hypoxia, iPSC-CMs were re-oxygenated to 10% O2 for 6 hr (condition C), or 24 hr (condition D). (B) Peri-cellular O2 levels measured at each stage of the experiment for each experimental batch. Also see Figure 1—figure supplements 1–5.
Figure 1—figure supplement 1
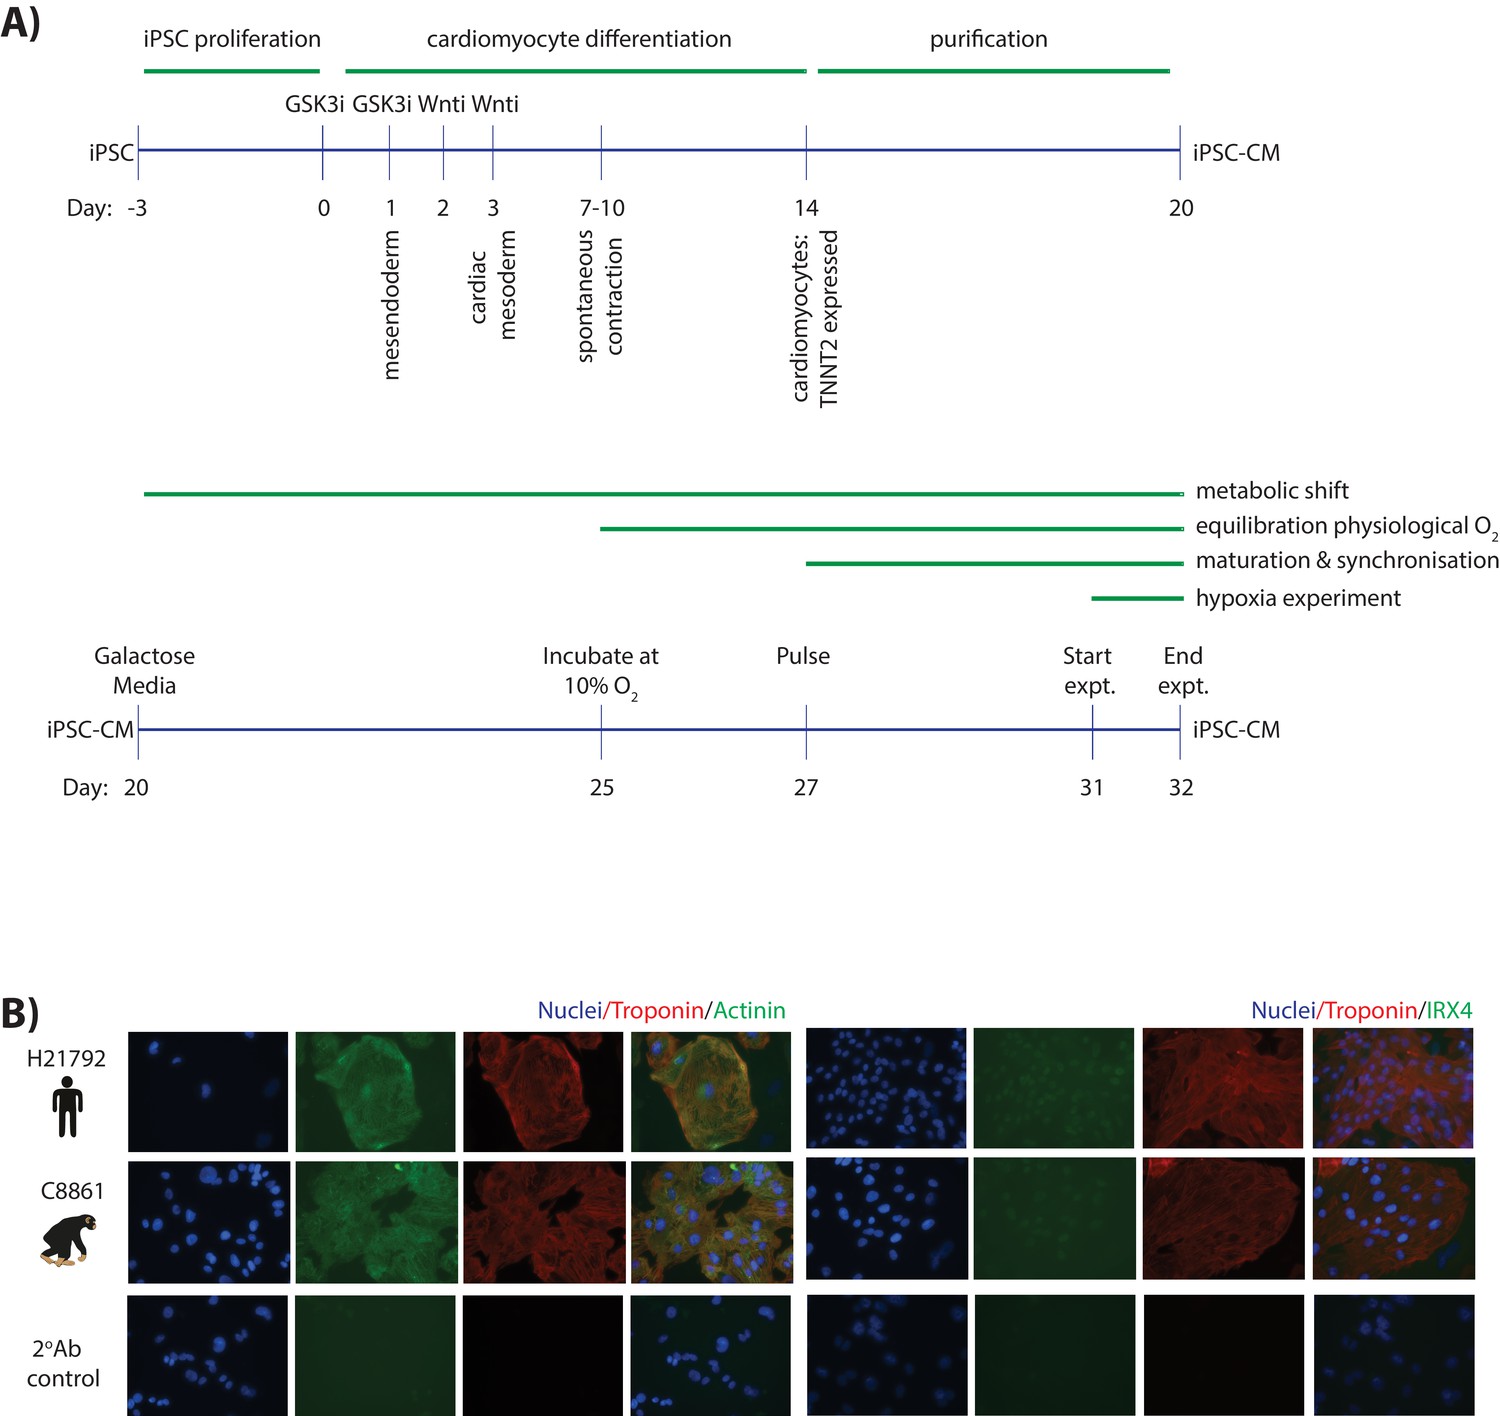
Cardiomyocytes can be differentiated from iPSCs from both humans and chimpanzees.
(A) Schematic representation of the protocol used to differentiate cardiomyocytes from human and chimpanzee iPSC lines (see Materials and methods for a detailed description). (B) Immunostaining of cardiomyocyte-specific markers in iPSC-CMs from a representative human and chimpanzee individual. The cytoplasmic markers TNNT2 (green) and ACTN1 (red) are shown in the left panel. The nuclear marker IRX4 (green), together with TNNT2 is shown in the right panel. Nuclei are stained with Hoechst. Staining of iPSC-CMs incubated with a fluorescently-tagged secondary antibody, without a prior incubation with primary antibody, is included as a negative control in the bottom panel.
Figure 1—figure supplement 2
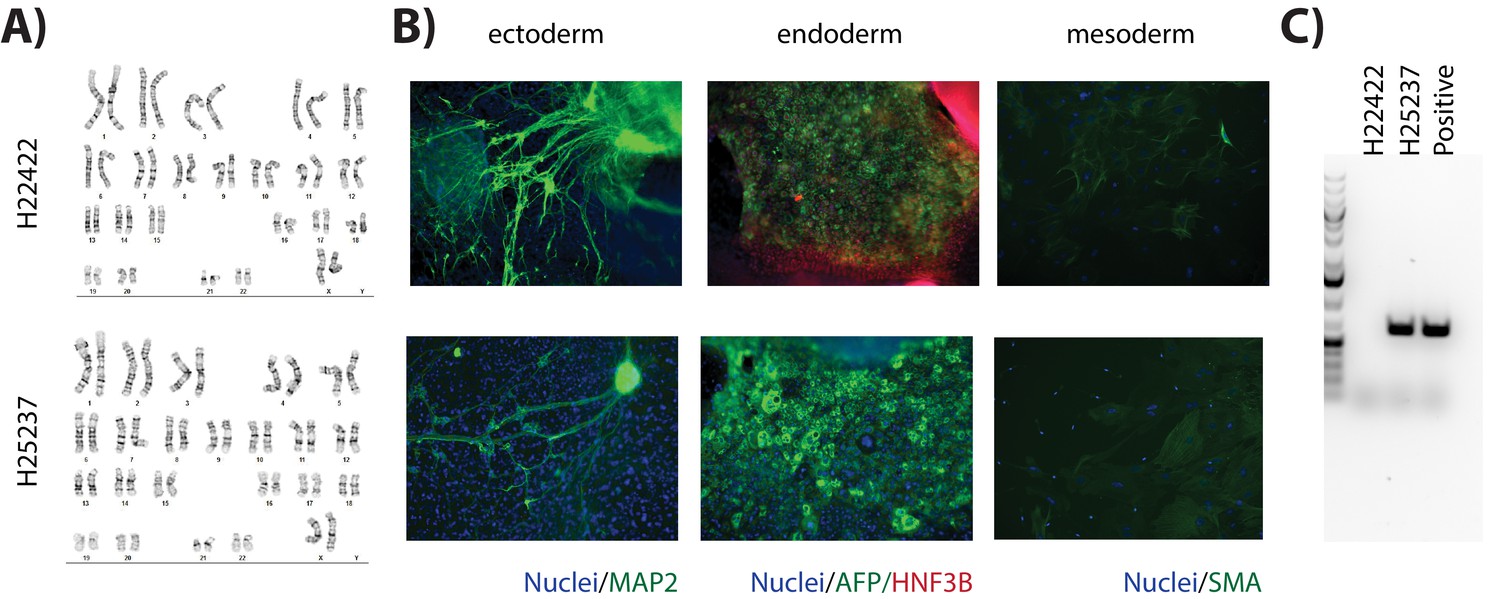
New human iPSC lines are pluripotent and display normal karyotypes.
(A) Metaphase spreads of H22422 and H25237 iPSC lines. (B) Spontaneous differentiation of embryoid bodies to the three germ layers: ectoderm (expressing MAP2), endoderm (expressing AFP and HNF3B), and mesoderm (expressing SMA). (C) PCR products of the episomal vector used to reprogram the iPSCs from fibroblasts. While the H22422 line no longer has episomal reprogramming vector sequence present, the H25237 line tested positive for vector sequence.
Figure 1—figure supplement 3

iPSC-CM purity is similar in humans and chimpanzees.
(A) Flow cytometry profiles of TNNT2-positive cells in (i) iPSC-CMs from a representative chimpanzee and human individual, (ii) iPSCs from a representative chimpanzee and human individual, (iii) iPSC-CMs incubated without TNNT2 antibody or viability stain (unlabeled), and (iv) iPSC-CMs incubated with viability stain only. Gates represent a conservative and lenient threshold for identifying TNNT2-positive cells. (B) The proportion of TNNT2-postive cells in each human and chimpanzee sample at both the lenient and conservative threshold.
Figure 1—figure supplement 4
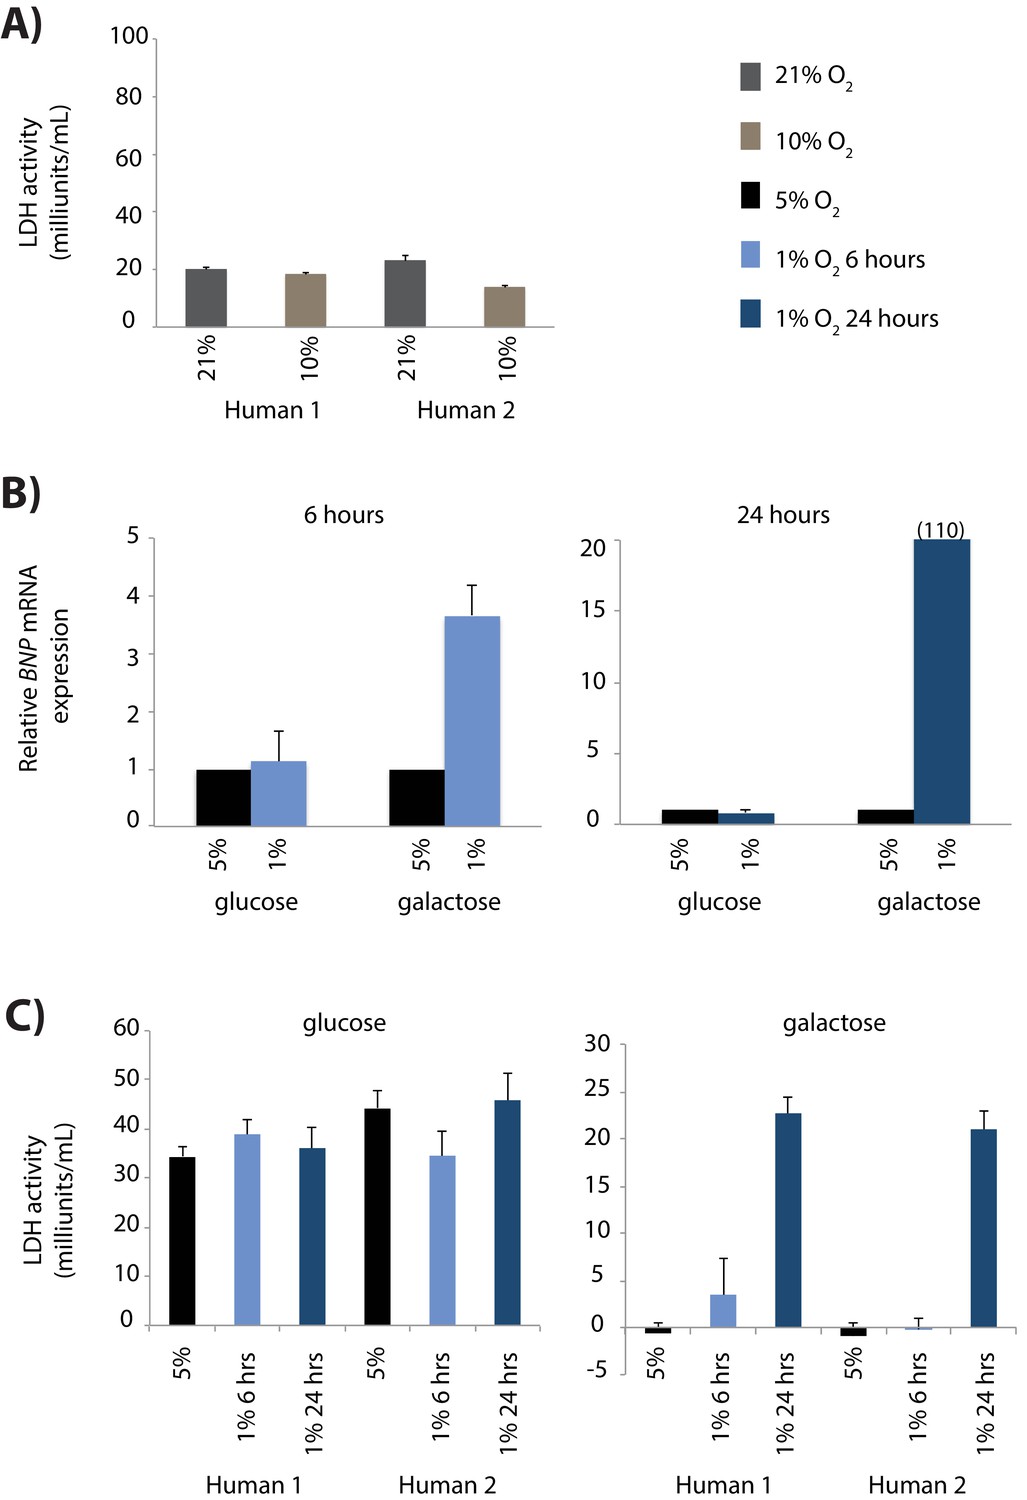
Optimising the induction of a hypoxic response in iPSC-CMs.
(A) Level of cellular toxicity (LDH activity) for two human iPSC-CM samples cultured at 21% oxygen, or at 10% oxygen for seven days. (B) mRNA expression of the BNP gene, a marker of cell stress, after iPSC-CMs are exposed to 6 or 24 hr of 1% oxygen, compared to iPSC-CMs cultured at 5% oxygen. mRNA levels were measured by qPCR, and expressed relative to 18S rRNA levels. Expression is measured in cells either cultured in media containing glucose or galactose as a carbohydrate source. (C) Level of cellular stress induced in the conditions described in (B).
Figure 1—figure supplement 5
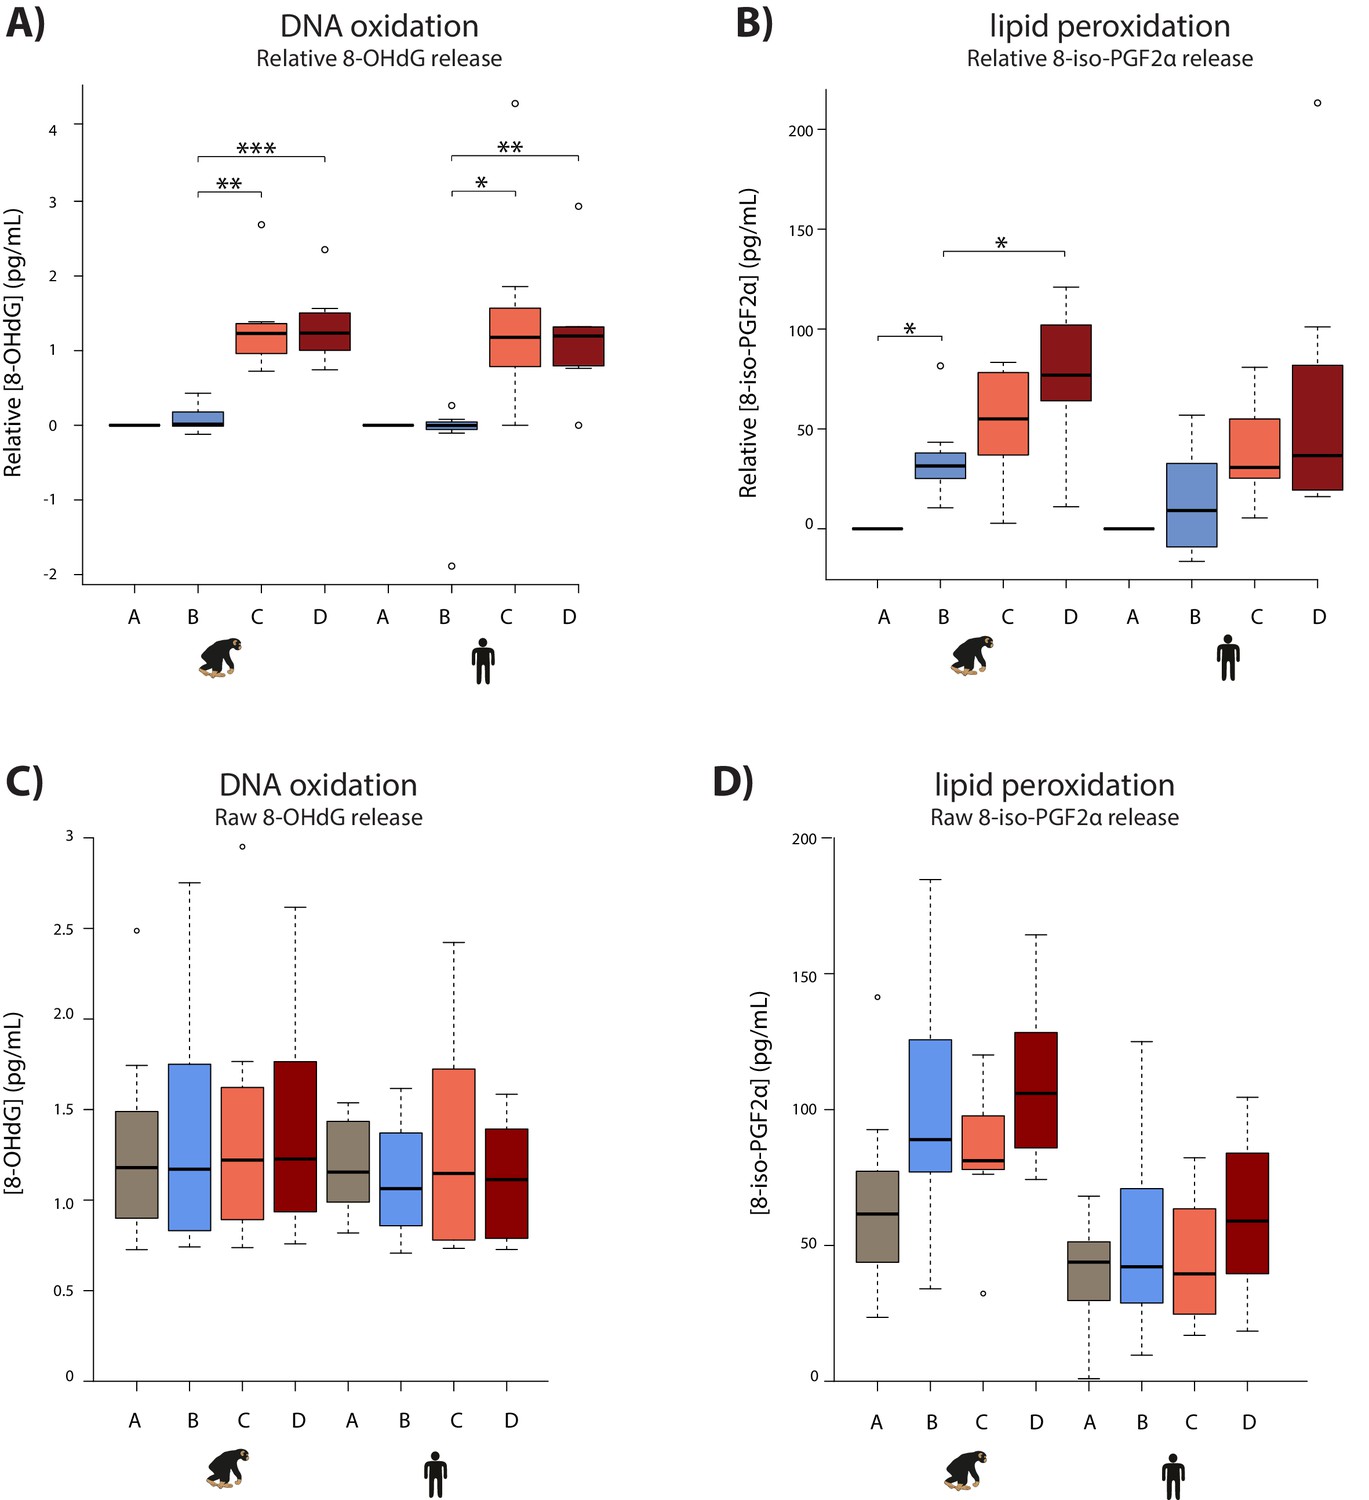
Hypoxia induces oxidative damage in both species.
(A) Levels of 8-OHdG, a measure of oxidative DNA damage, in the cell culture media from each individual. Values are normalized to normoxia or hypoxia values that is A (A-A), B (B-A), C (C-B), and D (D-B). (B) Levels of 8-iso-PGF2α, a measure of lipid peroxidation, in the cell culture media from each phase of the experiment in each species as in (A). (C) Raw values associated with 8-OHdG release. (D) Raw values associated with 8-iso-PGF2α release. Values from the baseline normoxic (brown), hypoxic (blue), short-term re-oxygenation (coral), and long-term re-oxygenation (dark red) conditions are shown in each species. Asterisk denotes a significant difference between conditions (*p<0.05, **p<0.005, ***p<0.0005).
Figure 2 with 7 supplements

Hypoxia induces a gene expression response in humans and chimpanzees.
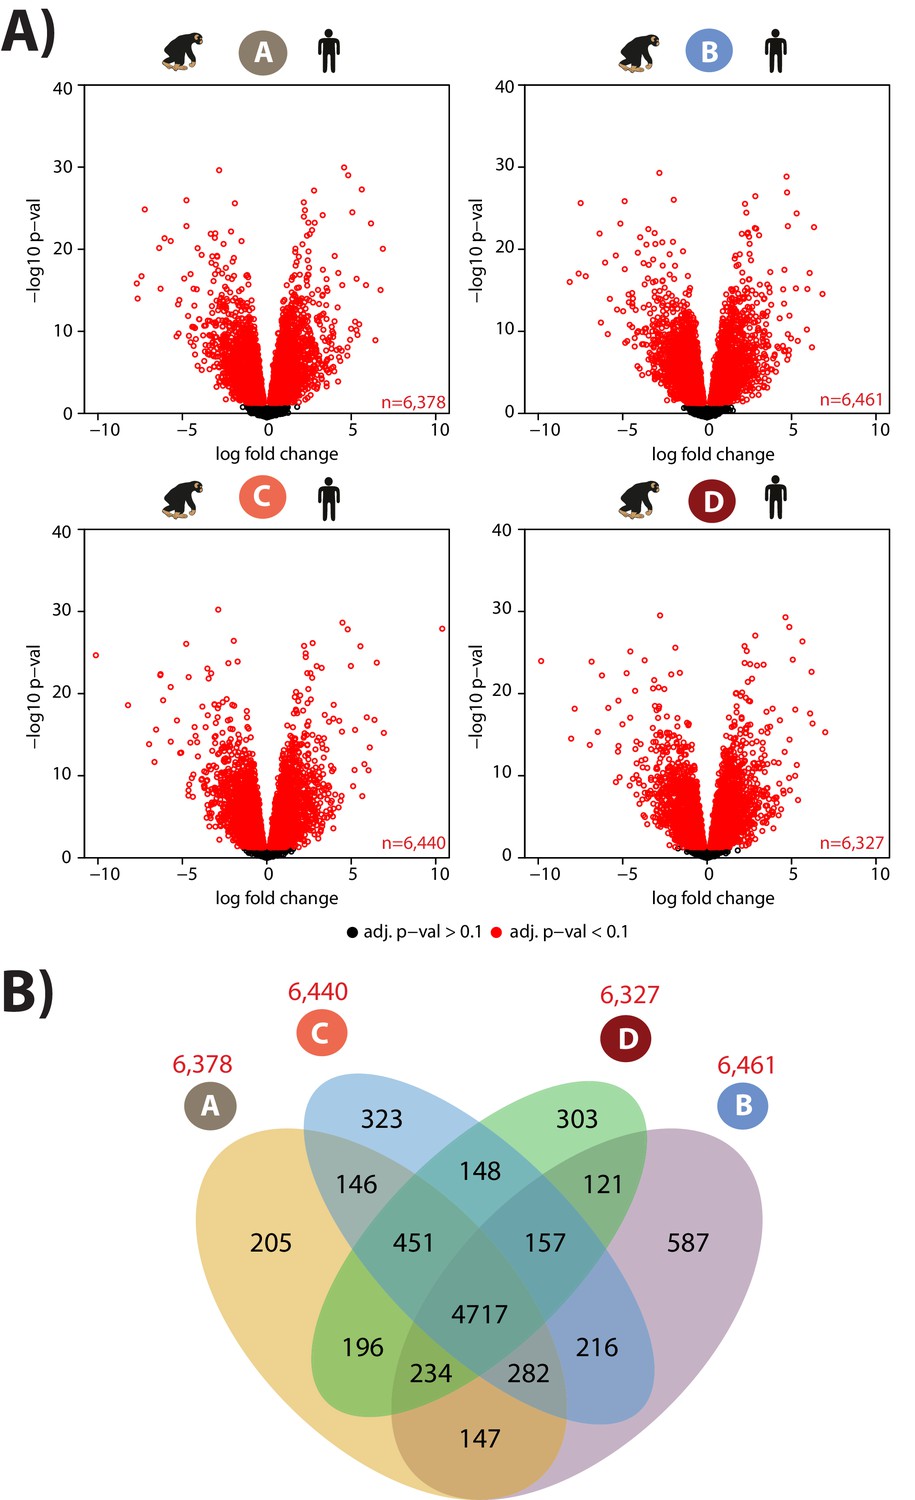
(A) Volcano plots representing genes that are differentially expressed (DE; 10% FDR) in pairwise comparisons across conditions in each species independently. In a comparison of A vs. B, genes that are up-regulated in hypoxia are represented in blue, and genes that are up-regulated in normoxia are represented in brown. Genes that are up-regulated in condition C are represented in coral, and genes that are up-regulated in D are represented in dark red. (B) Overlap of genes that are differentially expressed in pairs of conditions in each species independently. Also see Figure 2—figure supplements 1–7.
Figure 2—figure supplement 1
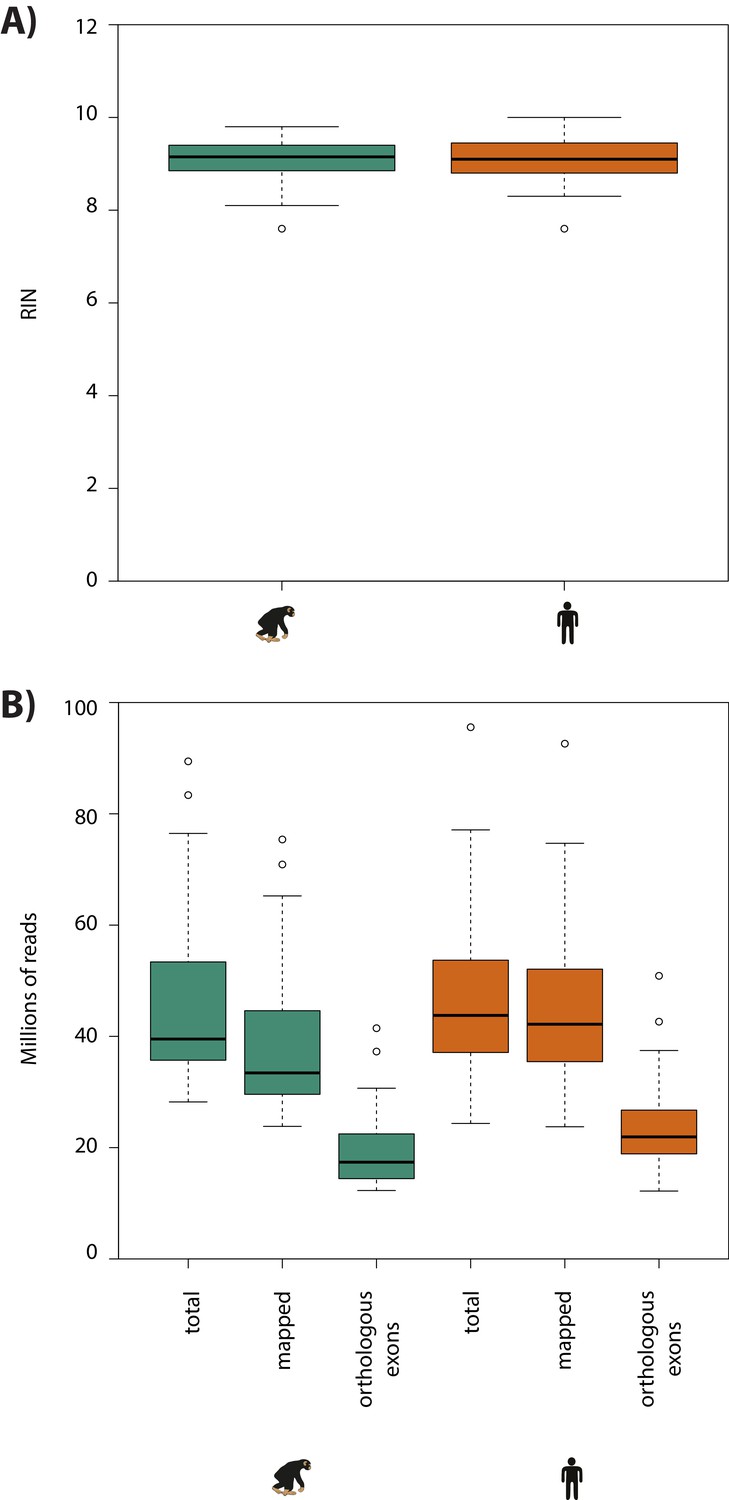
RNA-seq sample quality is similar between species.
(A) RNA integrity levels across all human and chimpanzee samples. (B) The total number of RNA-seq reads, the number of reads aligned to each species’ genome, and the number of reads that map to orthologous exons is shown for each species.
Figure 2—figure supplement 2
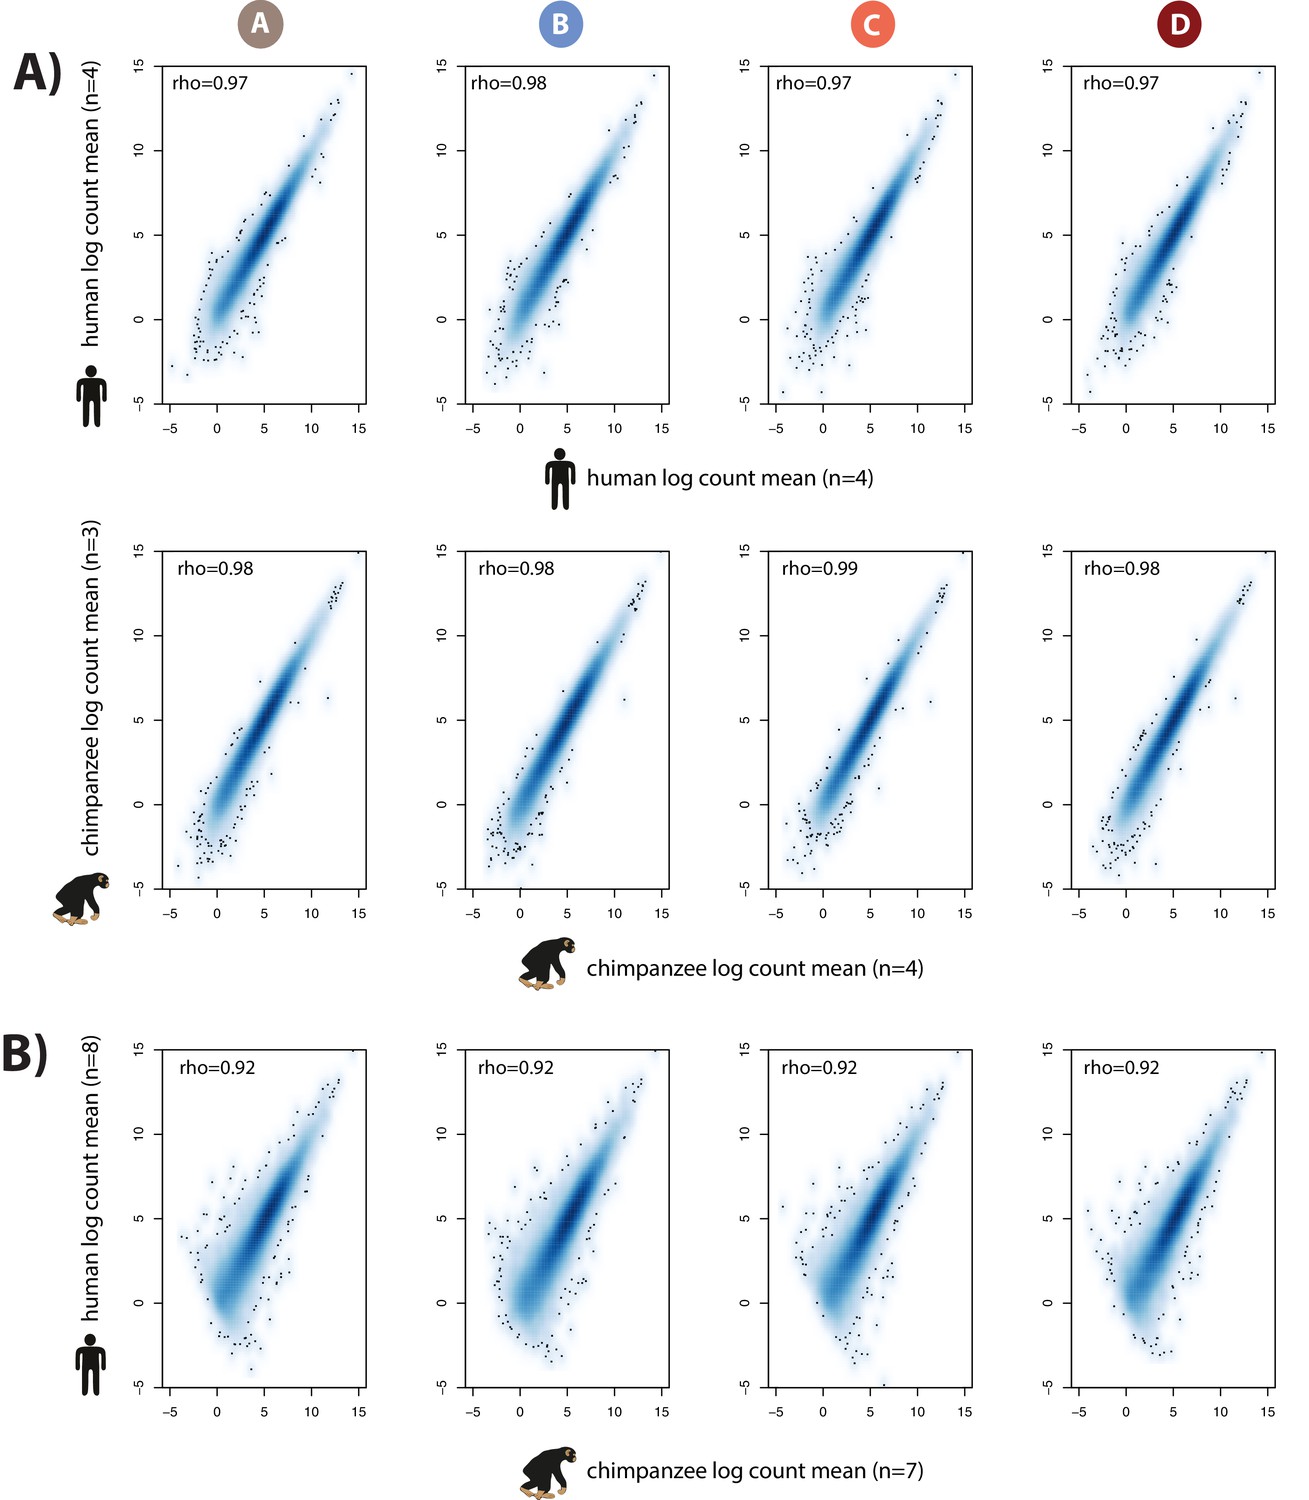
Inter-species variability in read counts is greater than intra-species variability.
(A) Spearman correlation of per-gene RNA-seq read counts between individuals of the same species within a condition. Mean read counts per gene in four human individuals versus mean read counts per gene in four independent human individuals are shown in the top panel. Mean read counts in four chimpanzee individuals versus mean read counts in three independent chimpanzee individuals are shown in the lower panel. Each column represents one of the four conditions – A, B, C and D. (B) Mean chimpanzee (seven individuals) read counts versus mean human (eight individuals) read counts.
Figure 2—figure supplement 3
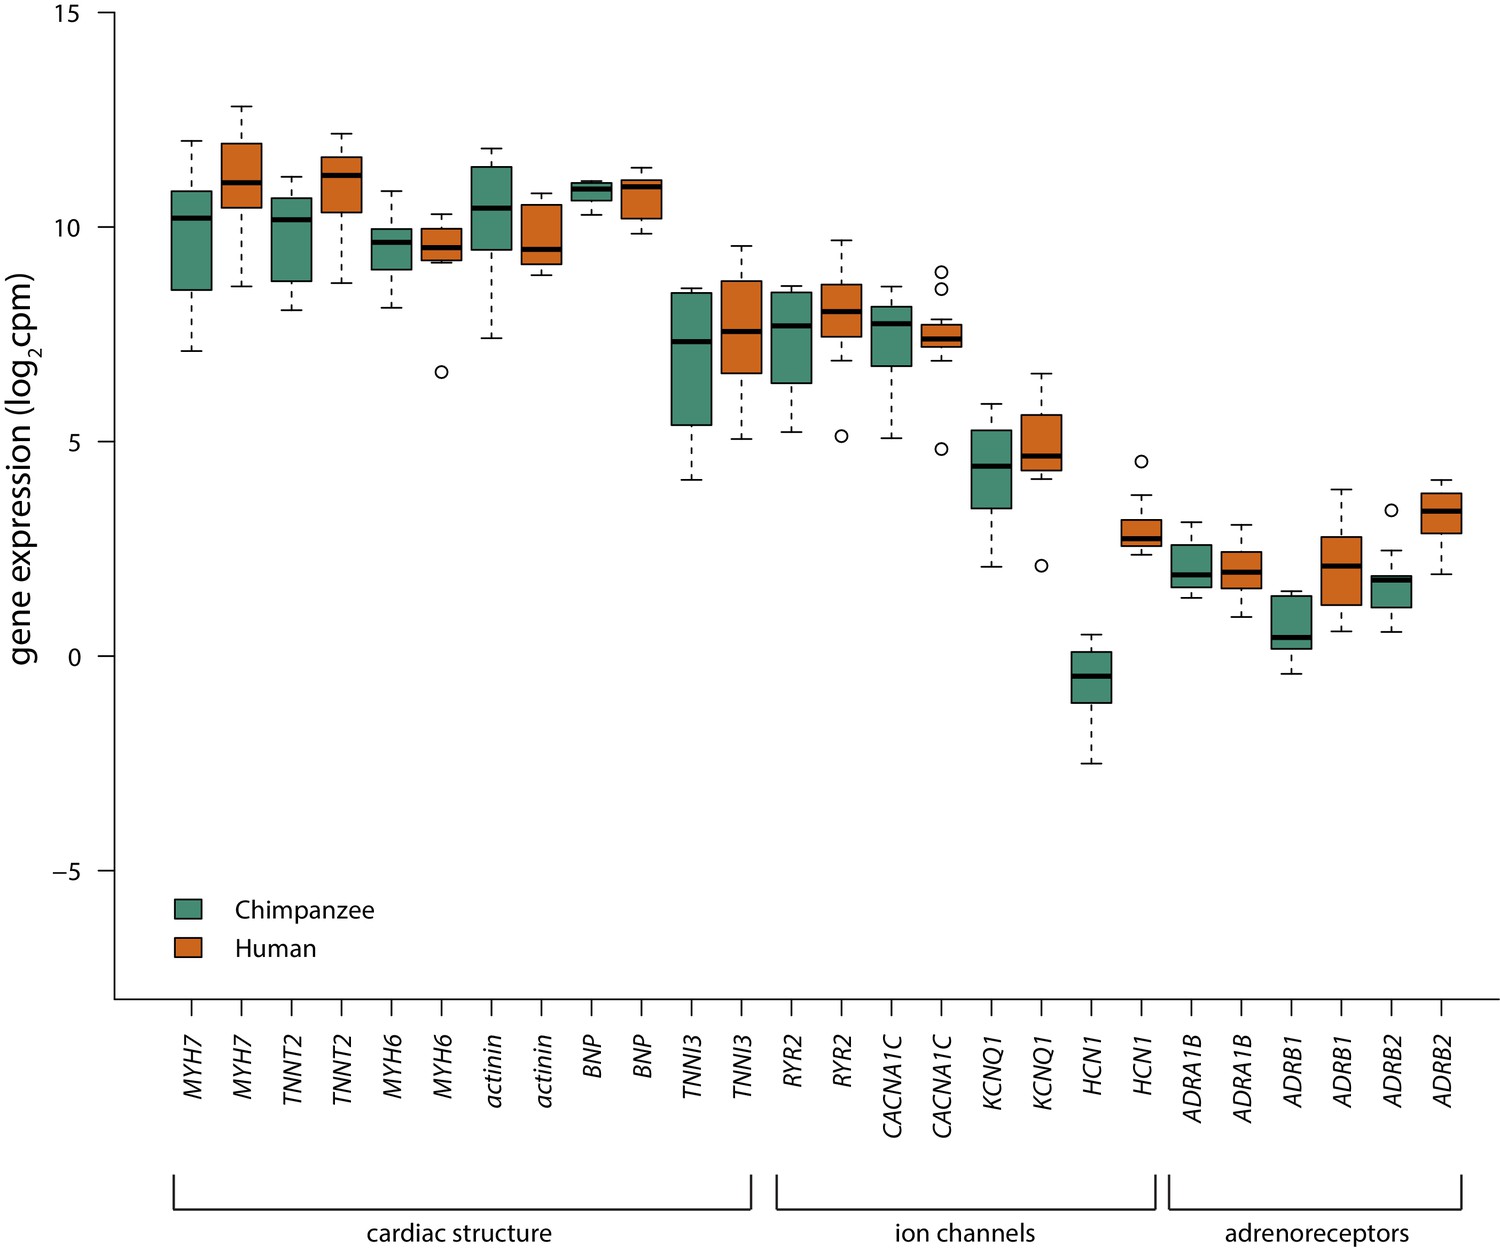
Range of cardiomyocyte genes are expressed in human and chimpanzee iPSC-CMs.
Log2cpm values of cardiac structure, ion channel and adrenoreceptor genes expressed in cardiomyocytes (Burridge et al., 2014) in human (orange) and chimpanzee (green) iPSC-CM samples. Condition A (normoxia) values are plotted for each sample.
Figure 2—figure supplement 4
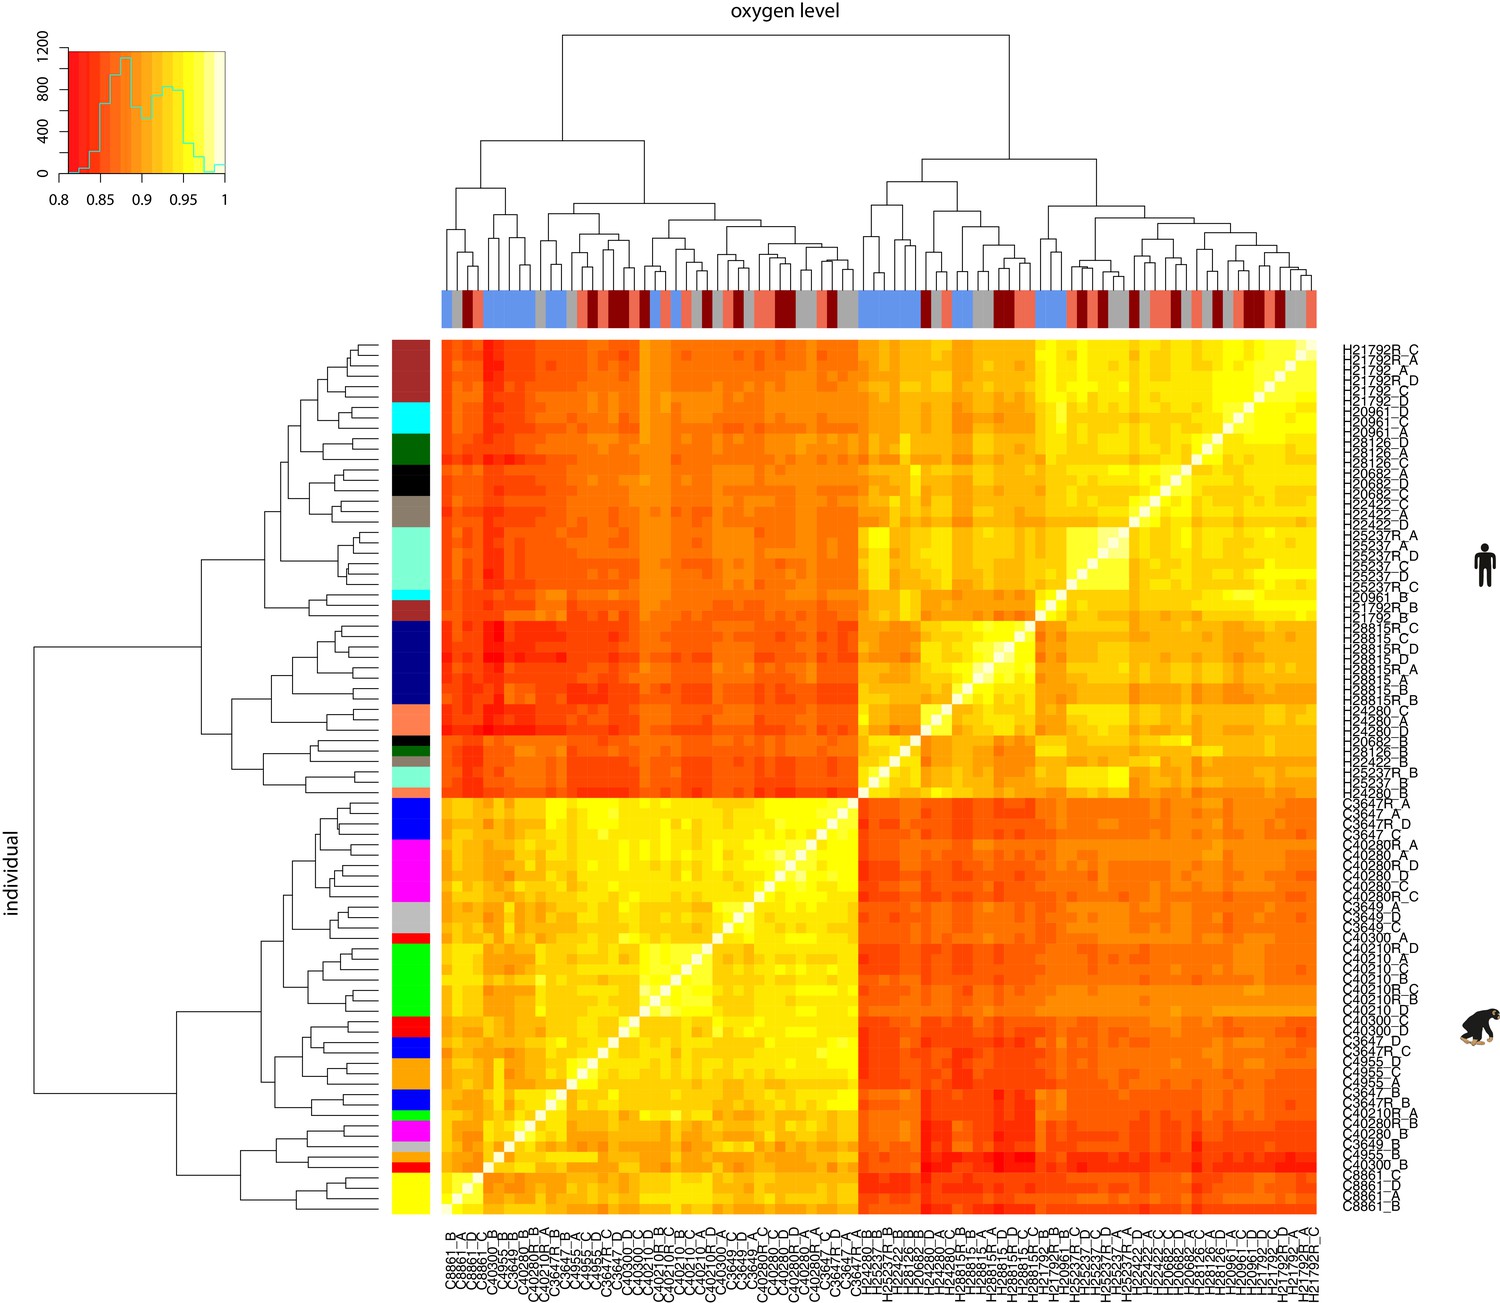
RNA-seq samples cluster by species and then by oxygen level or individual.
Spearman correlation of between-sample RUVs-normalised log2cpm values. X-axis bar represents the oxygen level: brown: 10% oxygen baseline (A), blue: 6 hr after 1% oxygen (B), coral: 6 hr of re-oxygenation at 10% oxygen after hypoxia (C), dark red: 24 hr of re-oxygenation at 10% oxygen after hypoxia (D). Y-axis bar represents the individual: each colour represents the individual from which the samples came. There are four samples per individual except for the six individuals with replicates, which have eight samples.
Figure 2—figure supplement 5

Species and individual are most correlated with the first two principal components in PCA.
(A) PCA of the corrected RNA-seq count data (RUVs-normalized counts following removal of four factors of unknown variation) showing the first three PCs. Colours indicate condition, while shapes indicate the individual, which the samples came from. Human samples are designated by ‘H’ and chimpanzee samples by ‘C’. (B) Significance of the correlation between various biological and recorded technical factors and the first six principal components following PCA. –log10p values are plotted. (C) PCA including only the 7,000 most variable genes in the analysis.
Figure 2—figure supplement 6
Inter-species results are recapitulated using a subset of the data.
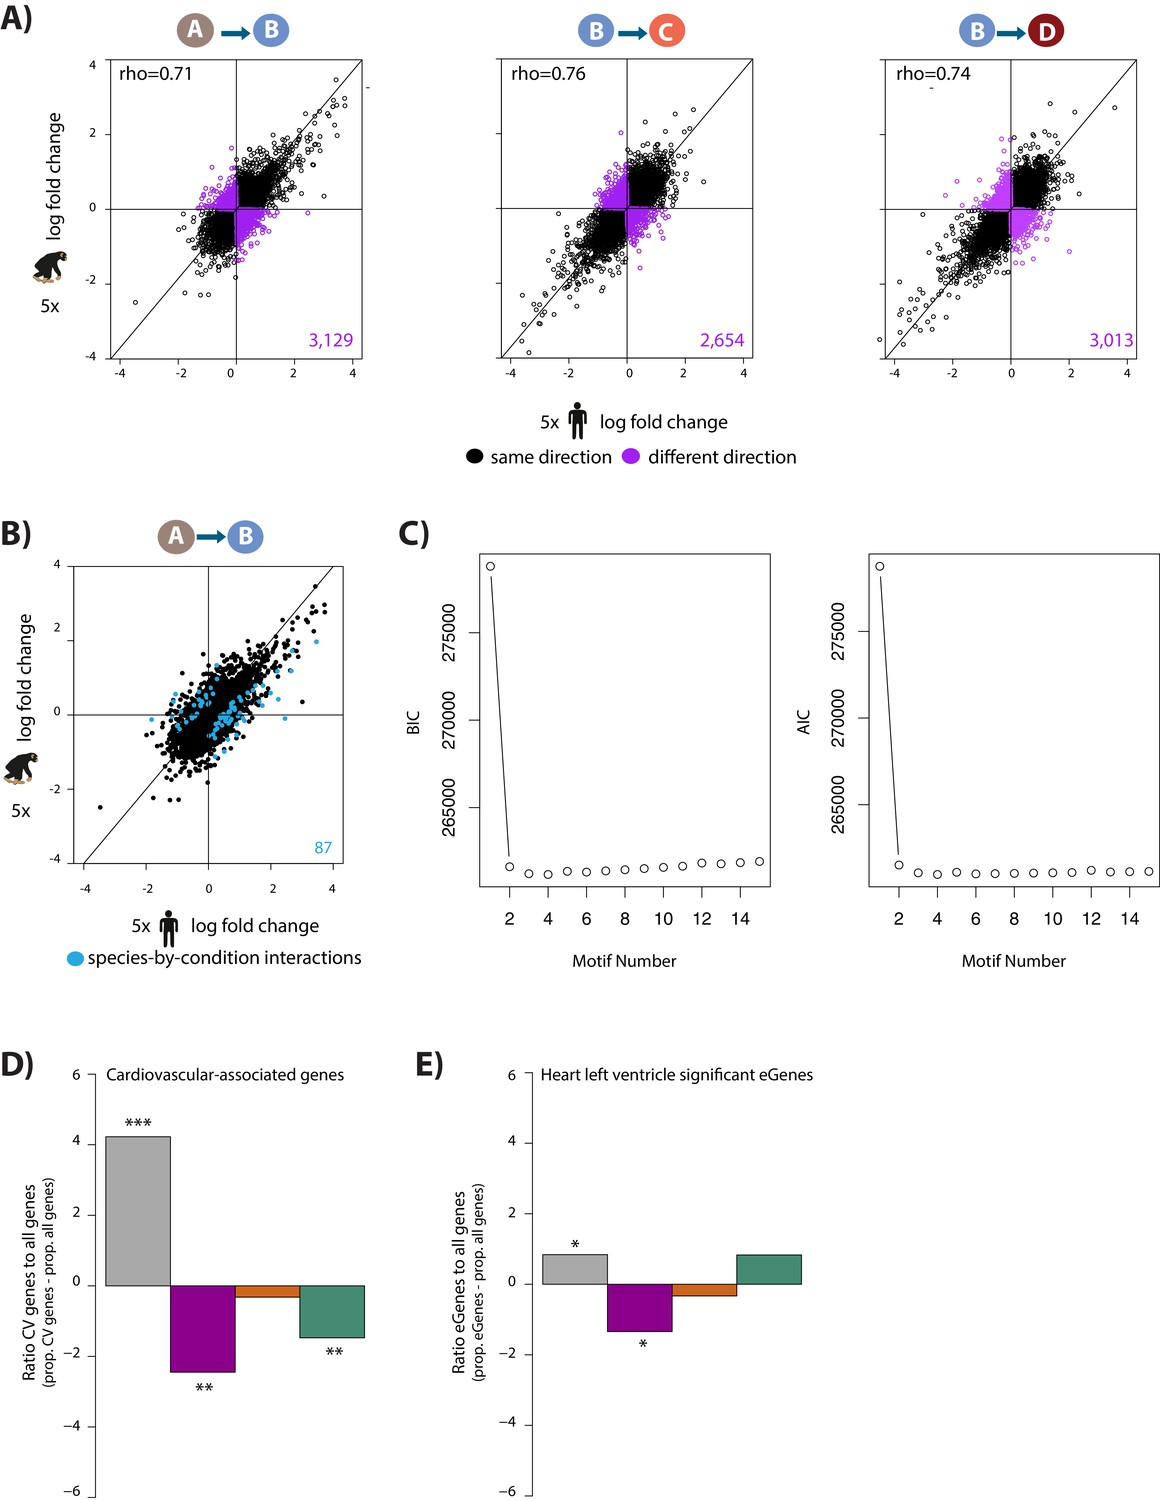
(A) The log fold change in expression of 11,974 genes between pairs of conditions in five humans on the x-axis, and five chimpanzees on the y-axis. All samples are free of episomal reprogramming vector. Genes whose expression change is in the same direction in both species are shown in black, and genes whose expression change direction differs between species are shown in purple. (B) The log fold change in expression of 11,974 genes between normoxia (A) and hypoxia (B) in humans on the x-axis, and chimpanzees on the y-axis. Genes with a species-by-condition interaction are represented in blue. (C) BIC and AIC associated with increasing the number of ‘correlation motifs’ in Cormotif. D) The proportion of cardiovascular-associated genes (CV) (Cardiovascular GO Annotation Initiative) in each response category: non-response (grey), conserved response (magenta), human-specific response (orange), and chimpanzee-specific response (green), relative to the proportion of all genes in each category. (E) The proportion of heart left ventricle eGenes in each response category, relative to the proportion of all genes in each category (GTEx Consortium). Asterisk denotes a significant difference between cardiovascular genes/eGenes in each response category, and all genes within a response category (*p<0.05, **p<0.005, ***p<0.0005).
Figure 2—figure supplement 7
Thousands of genes are differentially expressed between species in each condition.
(A) Genes that are significantly differentially expressed (adjusted p value of < 0.1) between species are shown in red. (B) Overlap of genes that are differentially expressed between species within a condition.
Figure 3
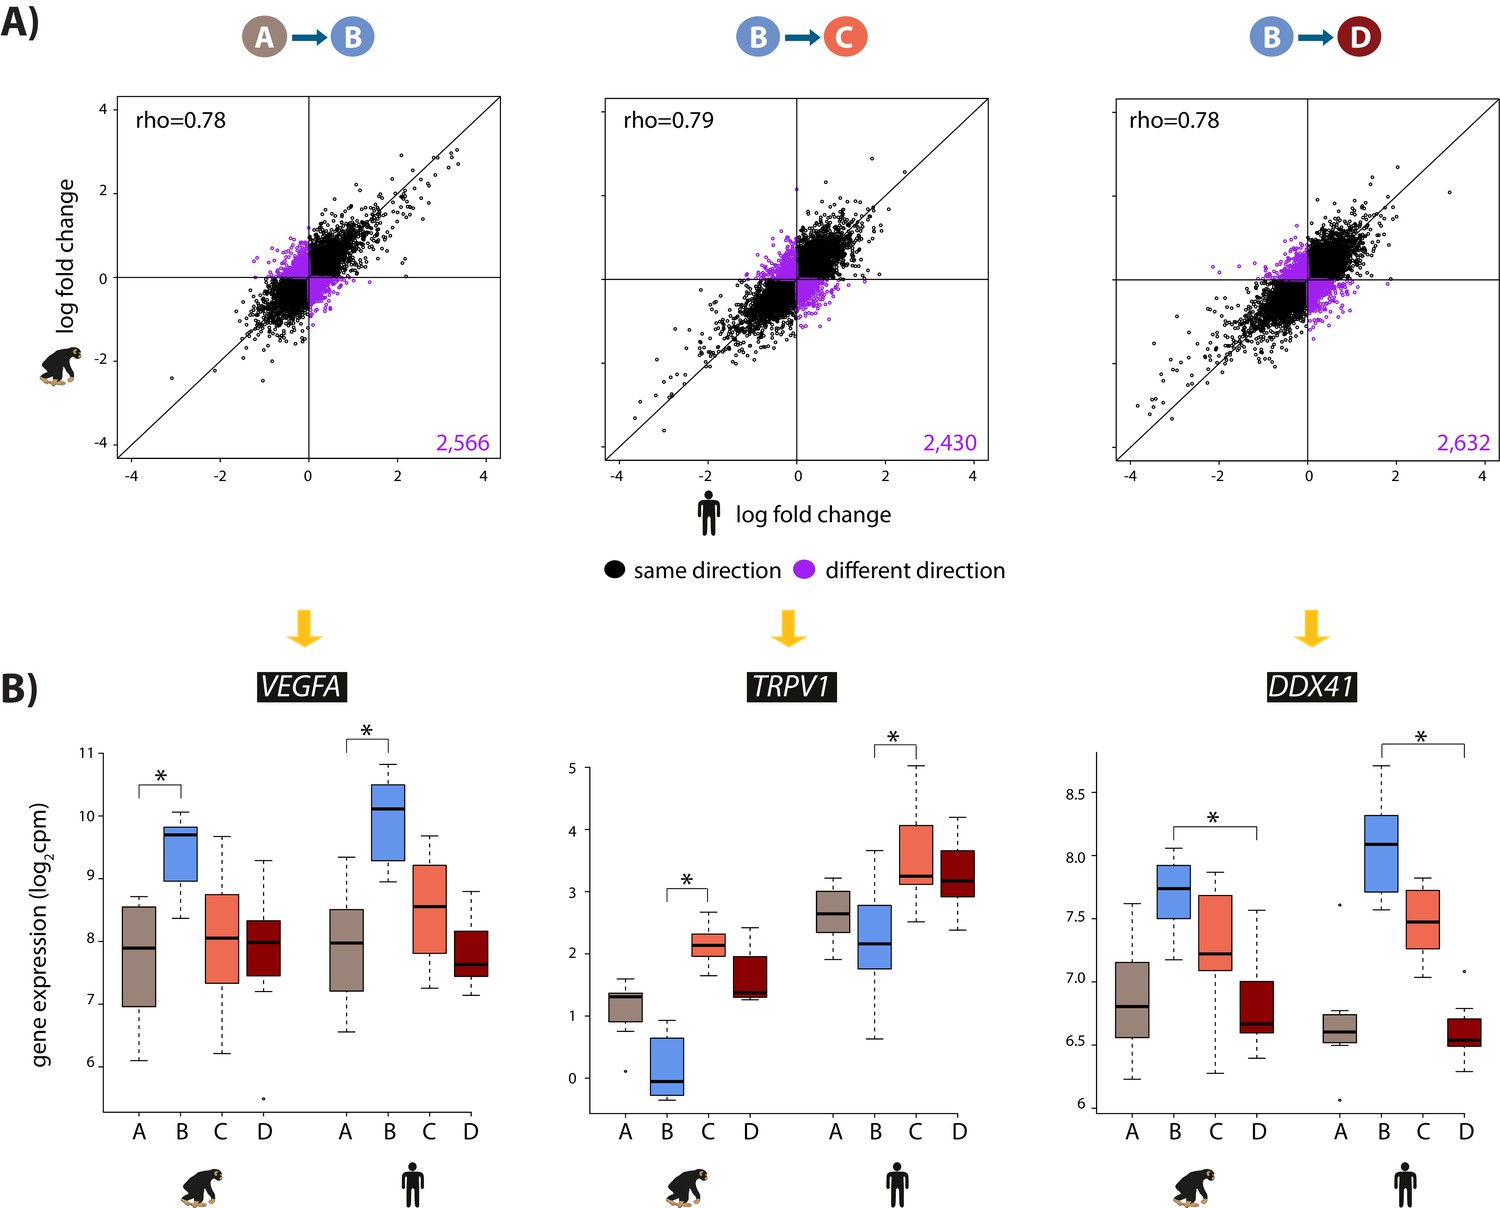
The hypoxic gene expression response is highly correlated across species.
(A) The log fold change in expression of 11,974 genes between pairs of conditions in humans on the x-axis, and chimpanzees on the y-axis. Genes whose expression changes in the same direction in both species are represented in black, and genes whose expression change direction differs across species are represented in purple. (B) Examples of genes that are differentially expressed in both species in A vs. B (VEGFA), B vs. C (TRPV1), and B vs. D (DDX41) are shown. Asterisk denotes a statistically significant difference in expression between conditions (10% FDR).
Figure 4 with 1 supplement

147 genes show a species-specific response following hypoxia.
Middle panel: The log fold change in expression of 11,974 genes between normoxia (A) and hypoxia (B) in humans on the x-axis, and chimpanzees on the y-axis. Genes with a species-by-condition interaction are represented in blue. All species-by-condition interactions affected the hypoxic condition; therefore only a representative pairwise comparison is shown (A vs. B). An example of a gene that responds in chimpanzees only (LRRC25) is shown in the left panel, and an example of a gene that responds only in humans (RASD1) is shown in the right panel. Also see Figure 4—figure supplement 1.
Figure 4—figure supplement 1
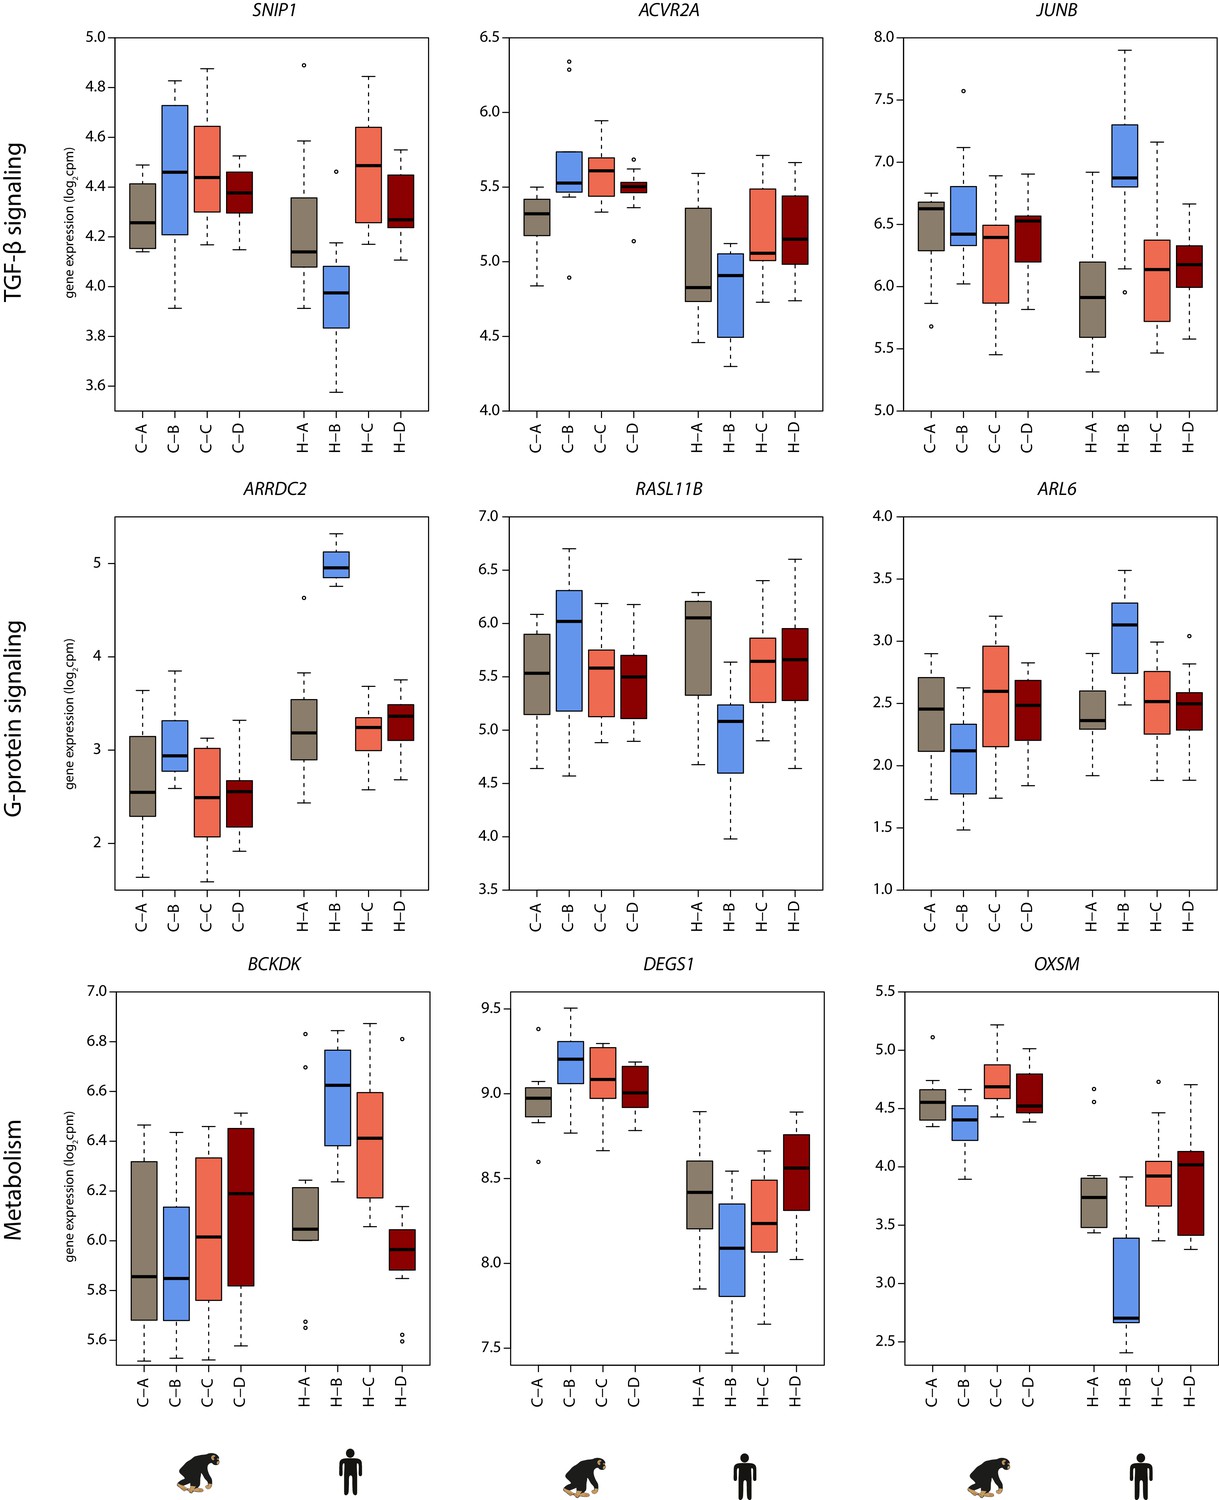
Genes responding in a species-specific manner have a variety of cellular functions.
Examples of genes with a species-by-condition interaction that can be classified as having functions related to TGF-β signaling, G-protein signaling and metabolism. Gene expression values (log2cpm) in the baseline normoxic (A: brown), hypoxic (B: blue), short-term re-oxygenation (C: coral), and long-term re-oxygenation (D: dark red) conditions are shown for each species (C- chimpanzee; H- human).
Figure 5 with 1 supplement
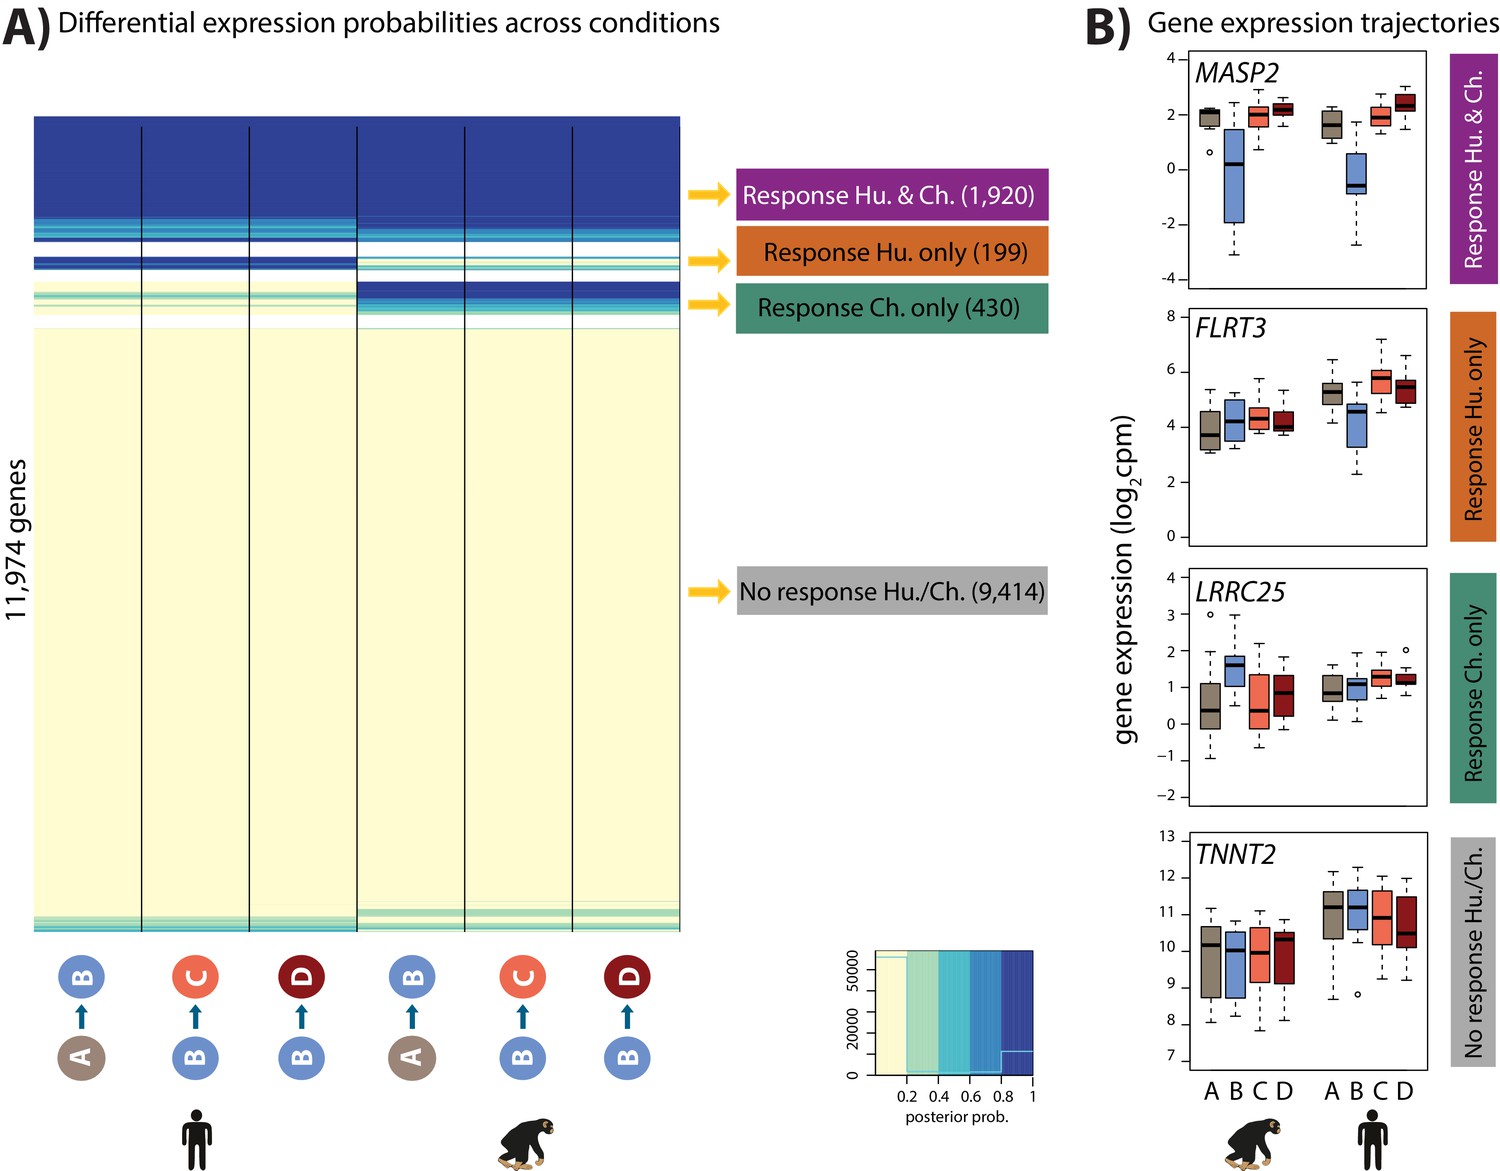
Four gene expression response categories can be classified following hypoxia.
(A) Posterior probabilities of genes being differentially expressed across pairs of conditions. Genes are categorized based on their posterior probabilities: genes with a p<0.5 across all tests are designated as ‘Non-response genes’ (grey), genes with a p>0.5 across all tests are designated as ‘Conserved response genes’ (magenta), genes with p>0.5 in human comparisons only are designated as ‘Human-specific response genes’ (orange), and genes with p>0.5 in chimpanzee comparisons only are designated as ‘Chimpanzee-specific response genes’ (green). (B) Examples of genes belonging to each of the four categories. Also see Figure 5—figure supplement 1.
Figure 5—figure supplement 1
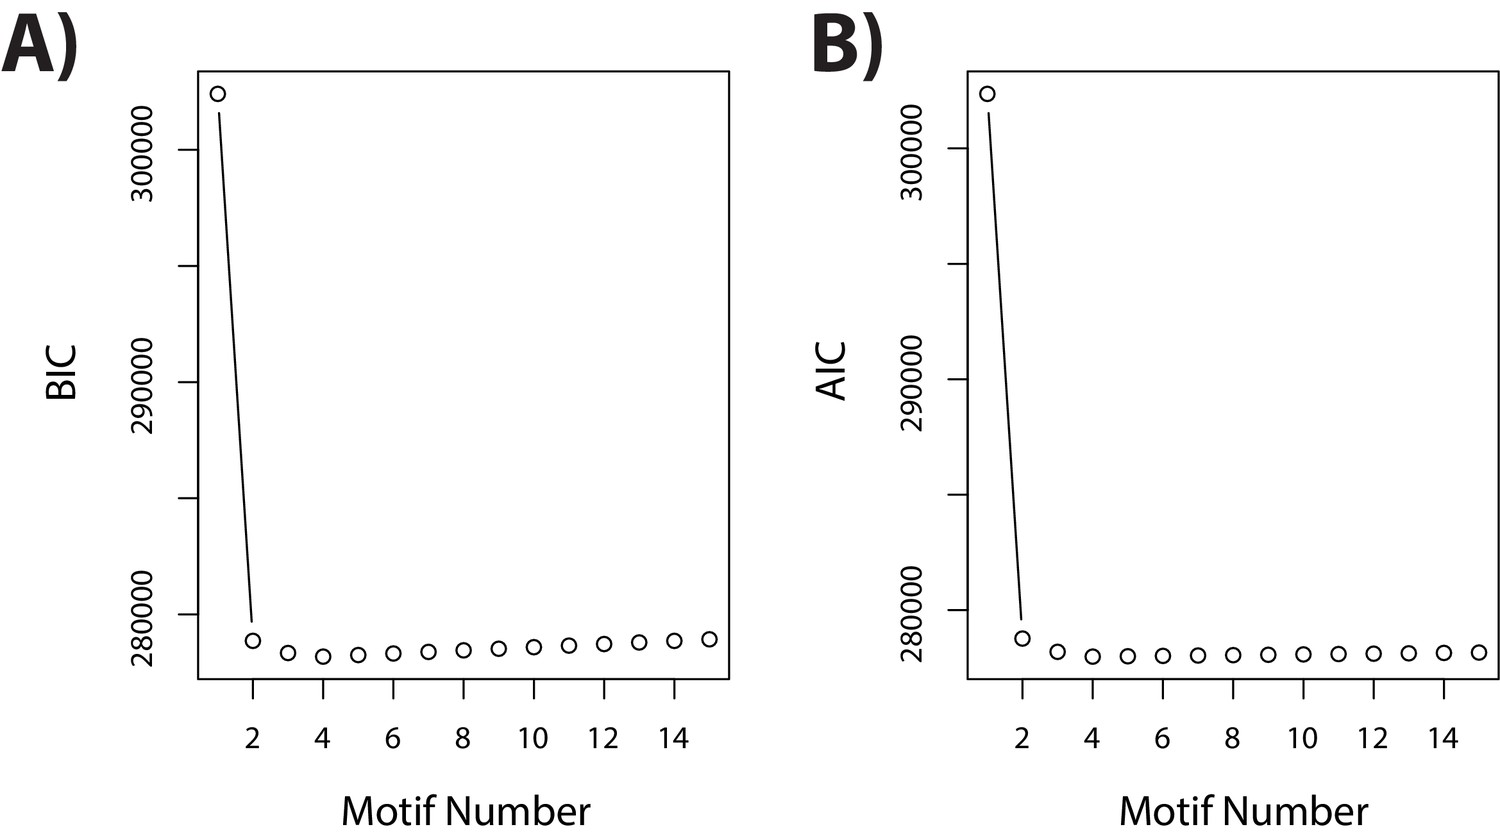
Four patterns of gene expression predominate across the course of the experiment.
(A) Bayesian information criterion (BIC) associated with increasing the number of ‘correlation motifs’ in the Cormotif R package. (B) Akaike information criterion (AIC) associated with increasing the number of ‘correlation motifs’.
Figure 6 with 2 supplements
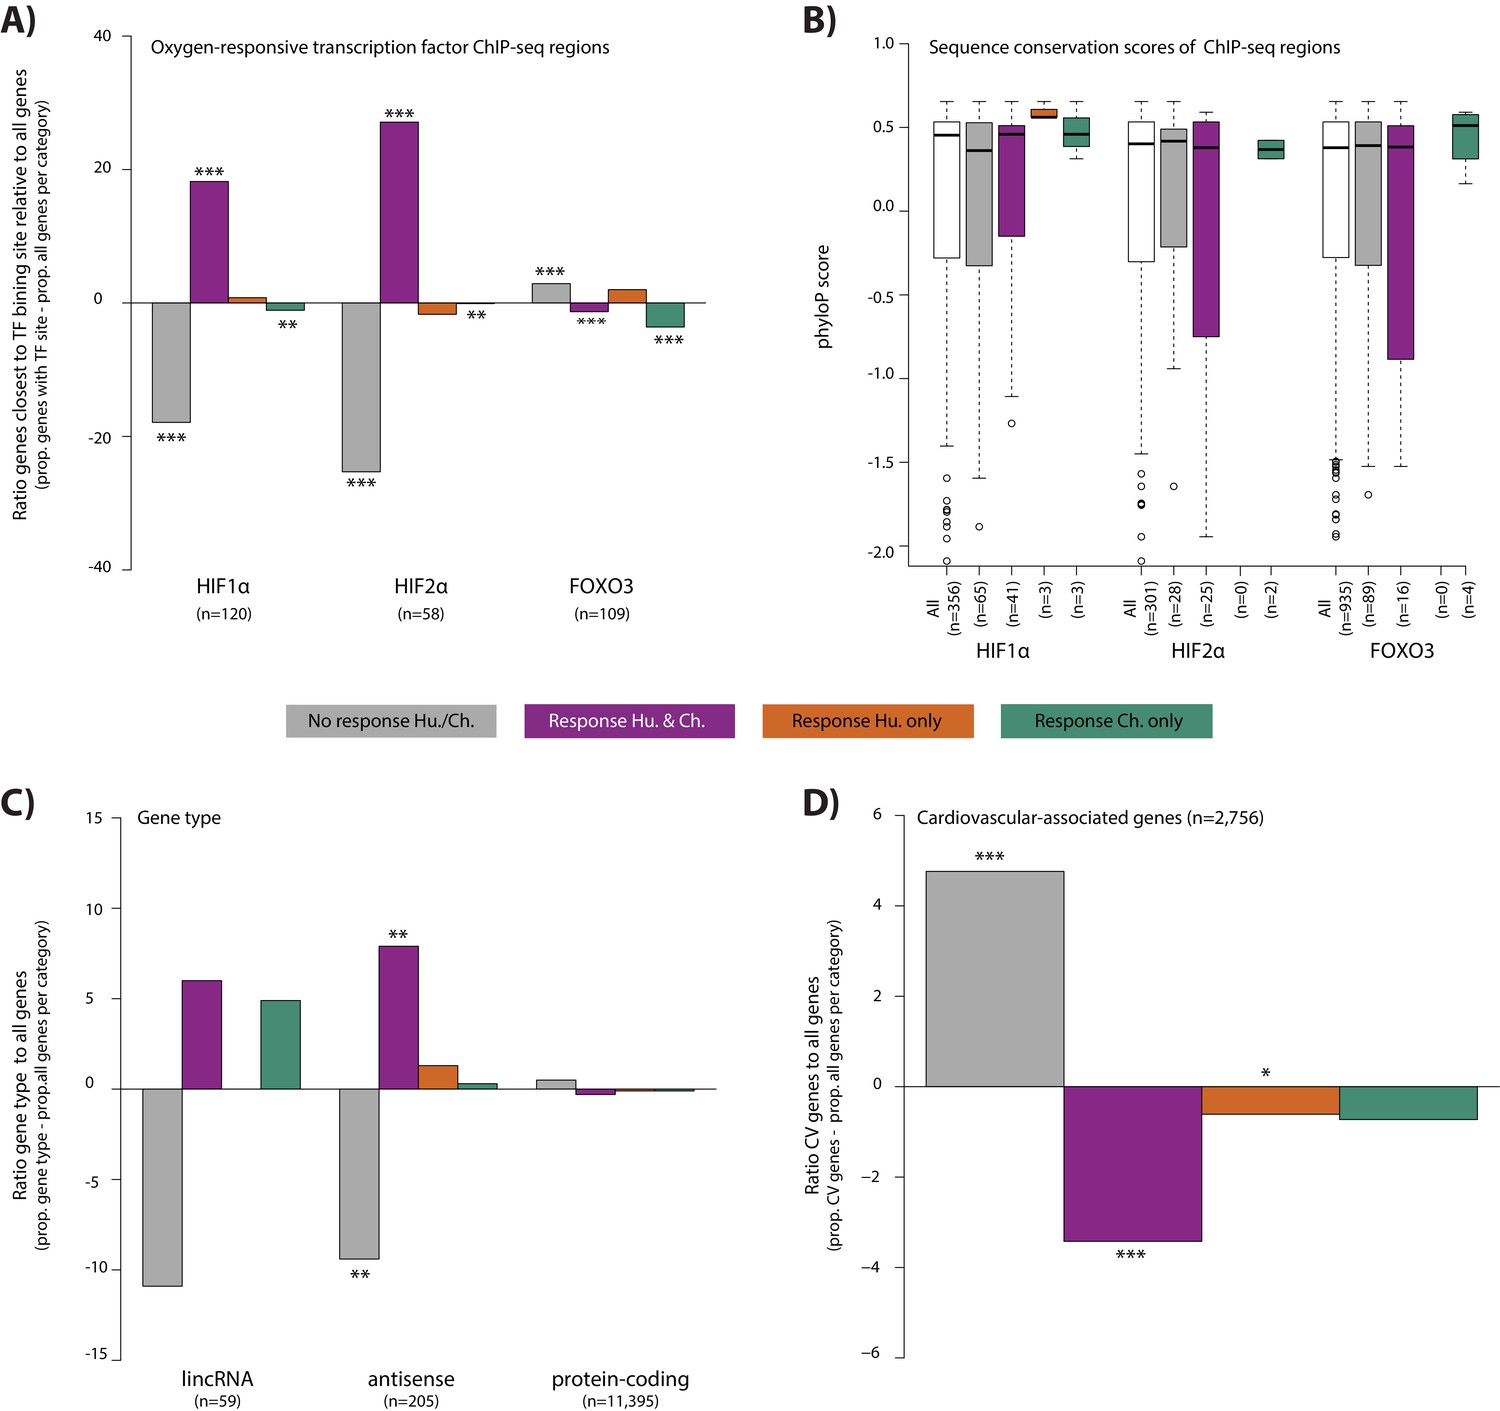
Conserved hypoxic response genes are enriched for nearby HIF transcription factor binding locations, and depleted for cardiovascular-associated genes.
(A) The proportion of genes close to HIF1α, HIF2α and FOXO3 transcription factor binding locations (Schodel et al., and Eijkelenboom et al.) in each response category relative to the proportion of all genes within a response category. (B) The sequence conservation score (phyloP) of each transcription factor binding location stratified by their proximity to response genes. (C) The proportion of genes annotated as lincRNAs, antisense transcripts and protein-coding genes in each response category relative to the proportion of all genes within a response category. (D) The proportion of cardiovascular-associated (CV) genes (Cardiovascular GO Annotation Initiative) in each response category relative to the proportion of all genes within a response category. Response categories are: non-response (grey), conserved response (magenta), human-specific response (orange), and chimpanzee-specific response (green). Asterisk denotes a significant difference between the proportion of the gene set in each response category, and the proportion of all genes within a response category (Chi-squared test; *p<0.05, **p<0.005, ***p<0.0005). Also see Figure 6—figure supplements 1–2.
Figure 6—figure supplement 1
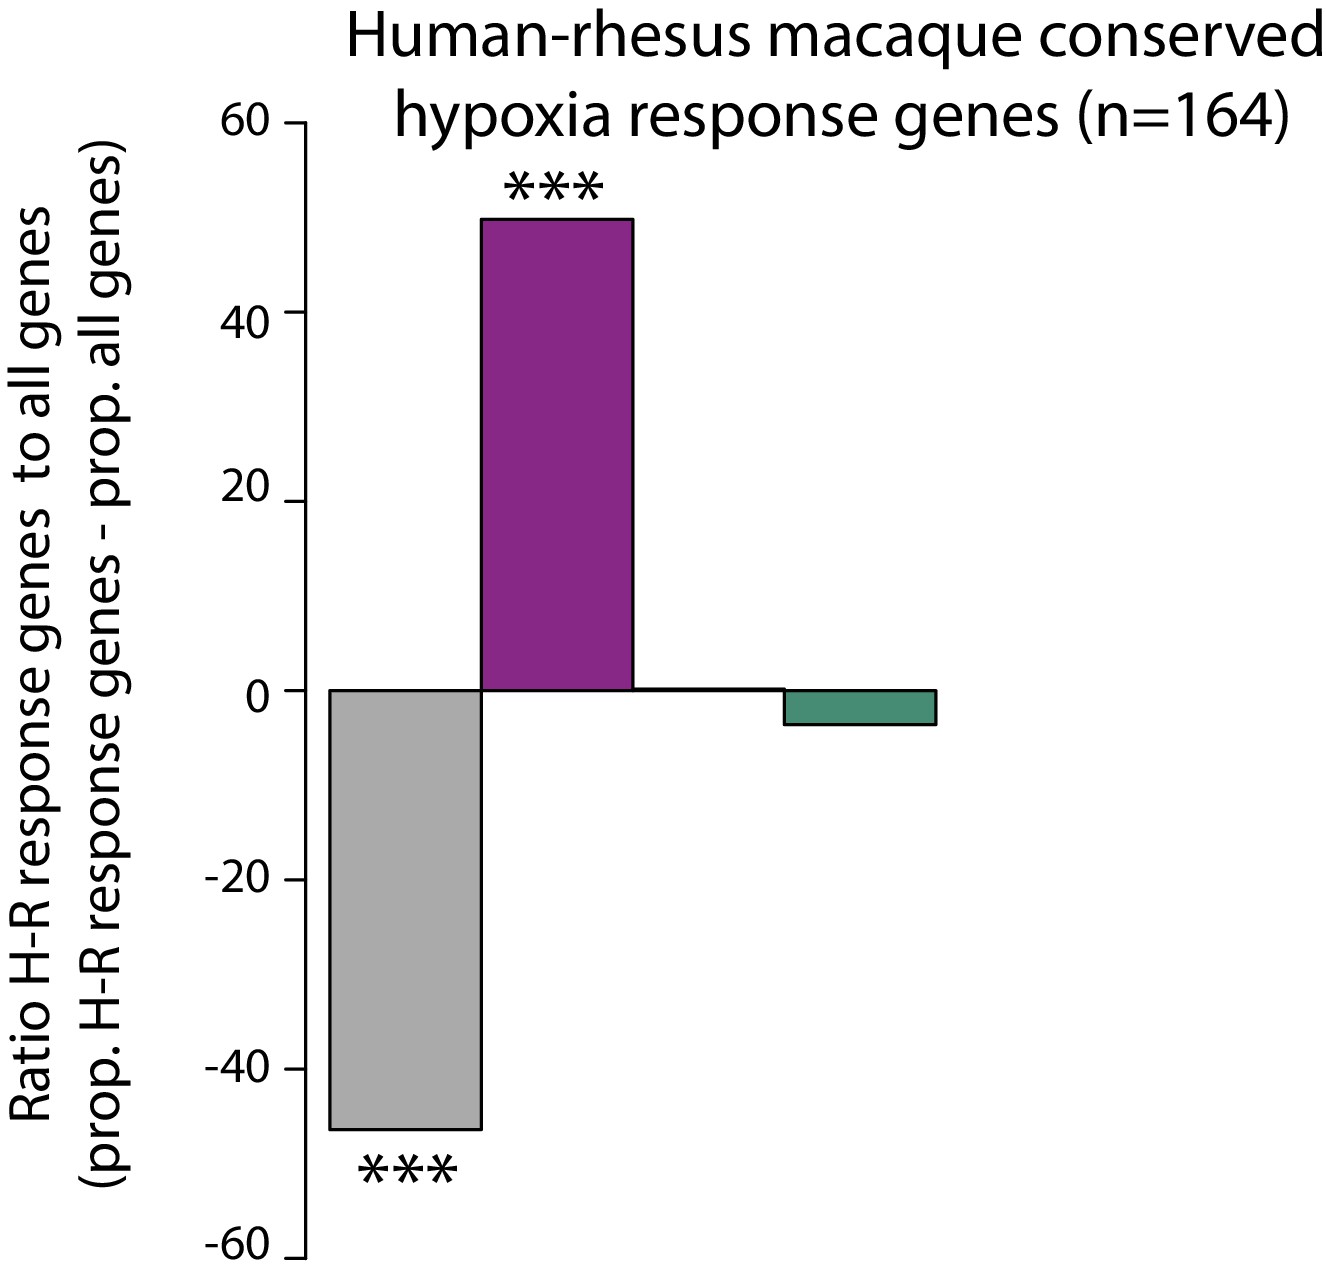
Conserved response genes are enriched in an orthogonal hypoxia data set.
The proportion of human-rhesus macaque conserved hypoxic response genes (Zhao et al.) in each response category: non-response (grey), conserved response (magenta), human-specific response (orange), and chimpanzee-specific response (green), relative to the proportion of all genes in each category. Asterisk denotes a significant difference between human-rhesus macaque conserved hypoxic response genes in each response category, and all genes within a response category (***p<0.0005).
Figure 6—figure supplement 2

Conserved response genes are enriched in stress response pathways.
KEGG pathway enrichment of genes within the four response categories. Enrichment is calculated relative to all expressed genes. Dashed red line indicates a 10% FDR threshold. Viral_carcin: viral carcinogenesis, RCC: renal cell carcinoma, CC: colorectal cancer, DV_axis_form: dorso-ventral axis formation, insulin_res: insulin resistance, Ubqn_prote: ubiquitin-mediated proteolysis, HS_infect: herpes simplex infection, BER: base excision repair, DCM: dilated cardiomyopathy, ARVC: arrhythymogenic right ventricular cardiomyopathy, HCM: hypertrophic cardiomyopathy, ECM_rec_int: ECM-receptor interaction, CAM: cell adhesion molecules, ADR_sig_CM: adrenergic signaling in cardiomyocytes, Purine_metab: purine metabolism.
Figure 7 with 4 supplements
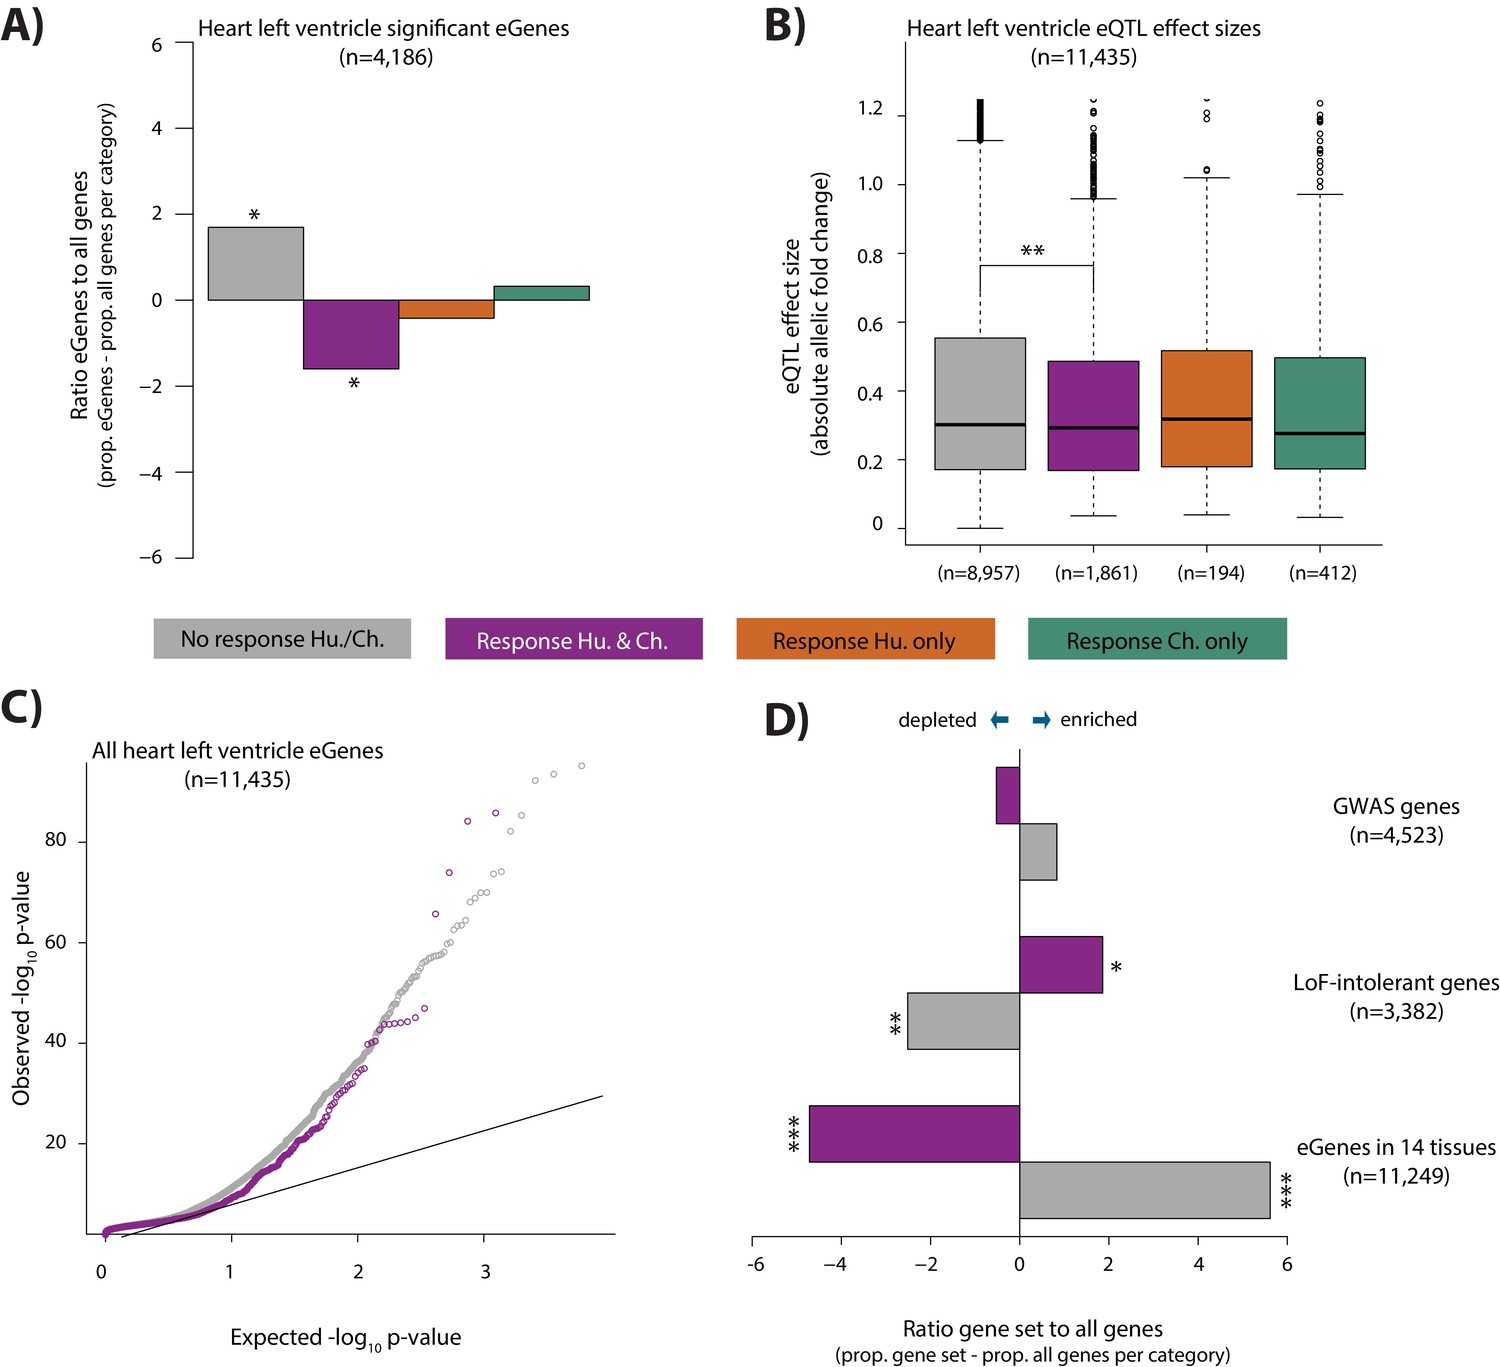
eGenes in heart tissue are depleted in conserved hypoxic response genes, while loss-of-function intolerant genes are enriched.
(A) The proportion of heart left ventricle eGenes (GTEx Consortium) in each response category, relative to the proportion of all genes in each category. (B) eQTL effect size (defined as allelic fold change) of eGenes within the non-response, conserved response, human-specific, and chimpanzee-specific response categories. (C) QQ-plot representing all eGenes identified in heart left ventricle that overlap the non-response category (grey), and conserved response category (magenta). (D) The proportion of genes within three gene sets in the non-response and conserved response categories relative to the proportion of all genes within a response category. Gene sets include GWAS-associated genes (Lek et al., 2016), loss-of-function (LoF) intolerant genes (Lek et al., 2016), and eGenes identified in 14 tissues by the GTEx consortium. Also see Figure 7—figure supplements 1–4.
Figure 7—figure supplement 1
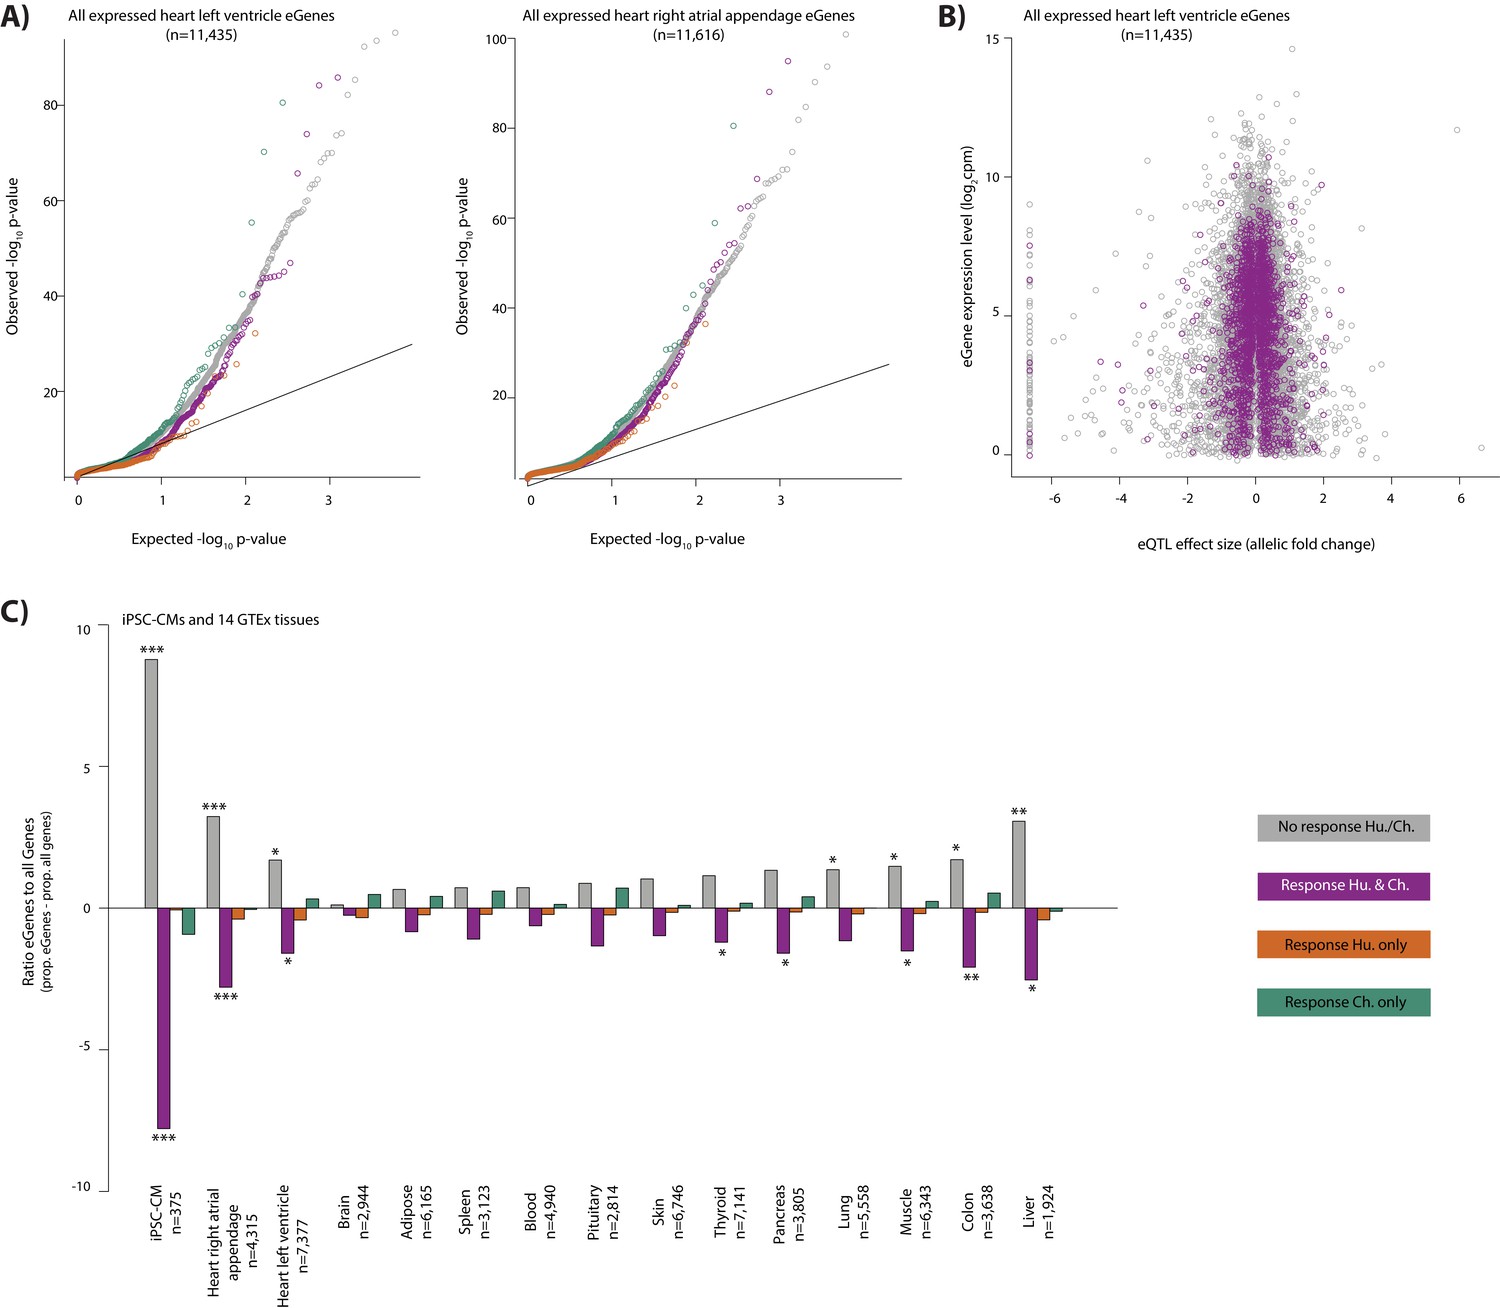
Conserved response genes are depleted for eGenes across tissues.
(A) QQ-plot representing all eGenes in heart left ventricle and heart right atrial appendage (GTEx Consortium) that overlap each response category. (B) The relationship between the heart left ventricle eQTL effect size, and mean expression level of the corresponding eGene, for genes in the conserved and non-response categories. (C) The proportion of eGenes in 14 GTEx tissues and iPSC-derived cardiomyocytes (iPSC-CM) (Banovich et al.) in each response category relative to the proportion of all genes in each response category. Response categories are: non-response (grey), conserved response (magenta), human-specific response (orange), and chimpanzee-specific response (green). Asterisk denotes a significant difference between the proportion of eGenes in each response category, and the proportion of all genes within a response category (*p<0.05, **p<0.005, ***p<0.0005).
Figure 7—figure supplement 2
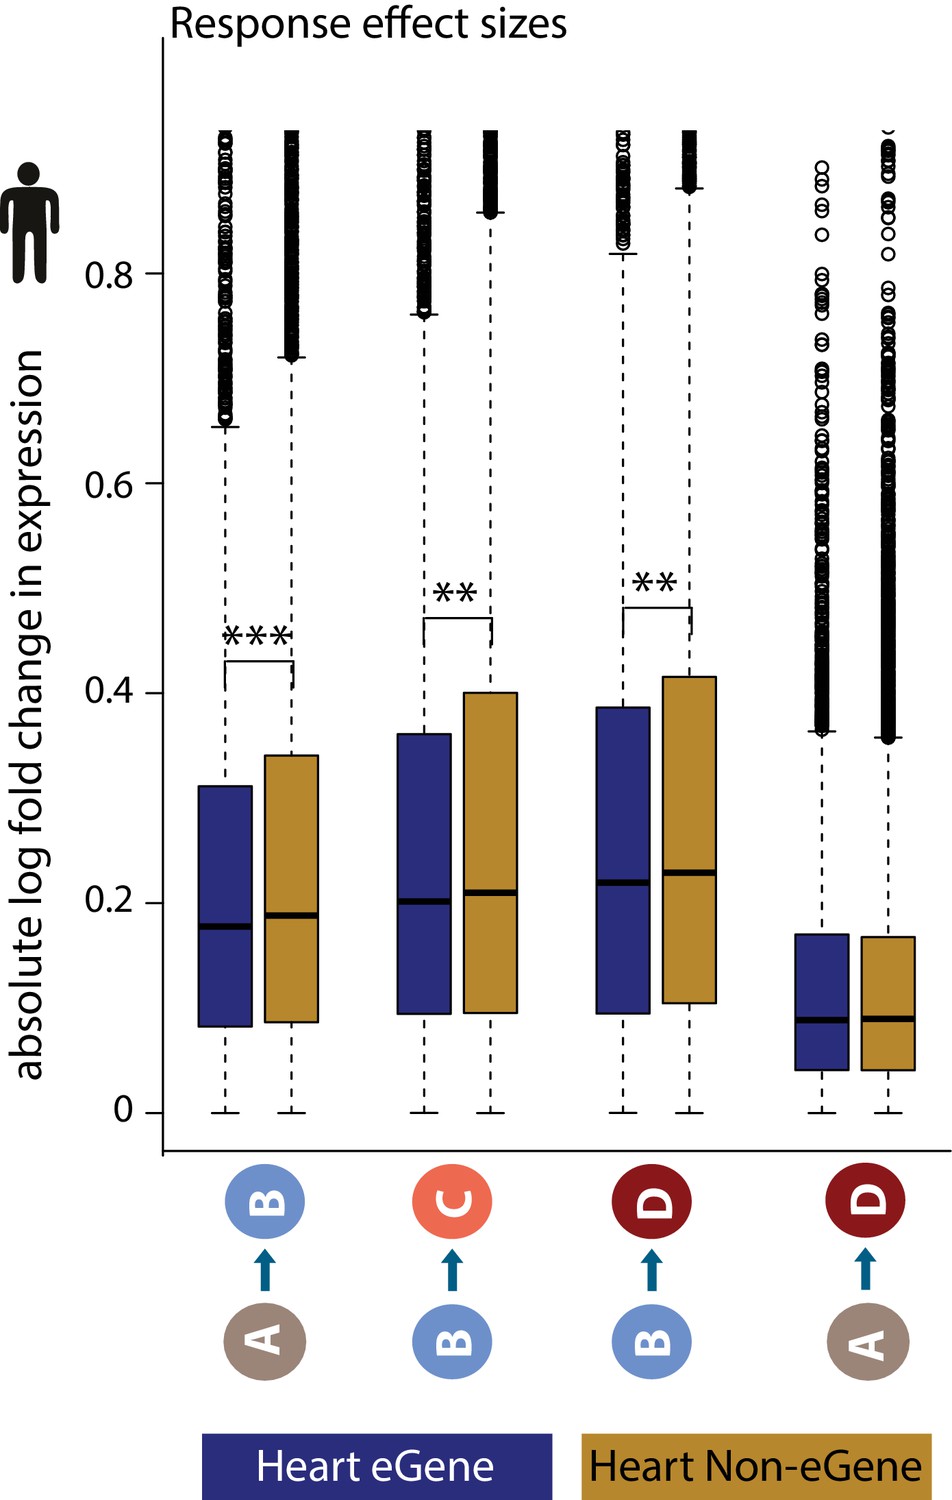
eGenes have lower gene expression response effect sizes between conditions, than non-eGenes.
The absolute log fold change in human gene expression between pairs of conditions in genes that are classified as eGenes in heart left ventricle (blue), and genes which do not show evidence for variability in expression based on genotype (non-eGenes; mustard). Asterisk denotes a significant difference between gene sets (**p<0.005, ***p<0.0005).
Figure 7—figure supplement 3
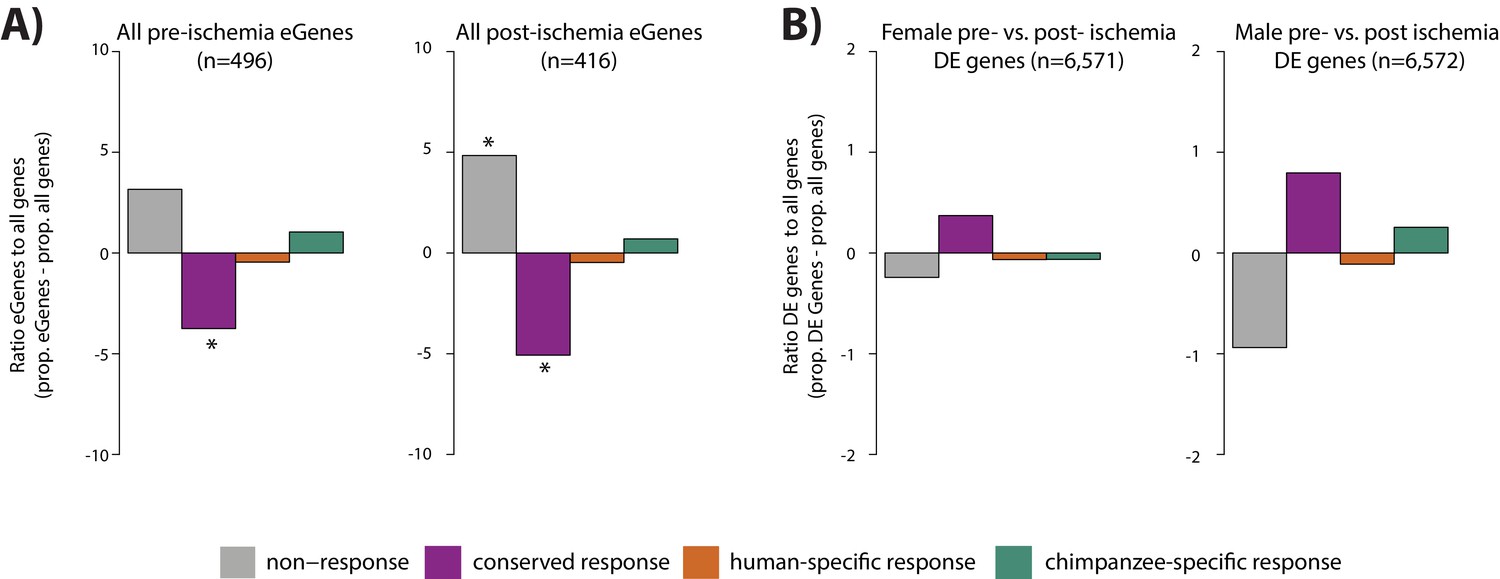
Conserved hypoxic response genes are depleted of ischemia eGenes, and enriched for ischemia response genes.
(A) The proportion of all pre- and post-ischemia eGenes in each response category relative to the proportion of all genes in each category (Stone et al., 2019). (B) The proportion of differentially expressed genes (pre- vs. post-ischemia) in each response category relative to the proportion of all genes in each category. Individuals are stratified by sex as reported in Stone et al. Response categories are: non-response genes (grey), conserved response genes (magenta), human-specific response (orange), and chimpanzee-specific response (green). Asterisk denotes a significant difference between eGenes in each response category, and all genes within a response category (*p<0.05).
Figure 7—figure supplement 4
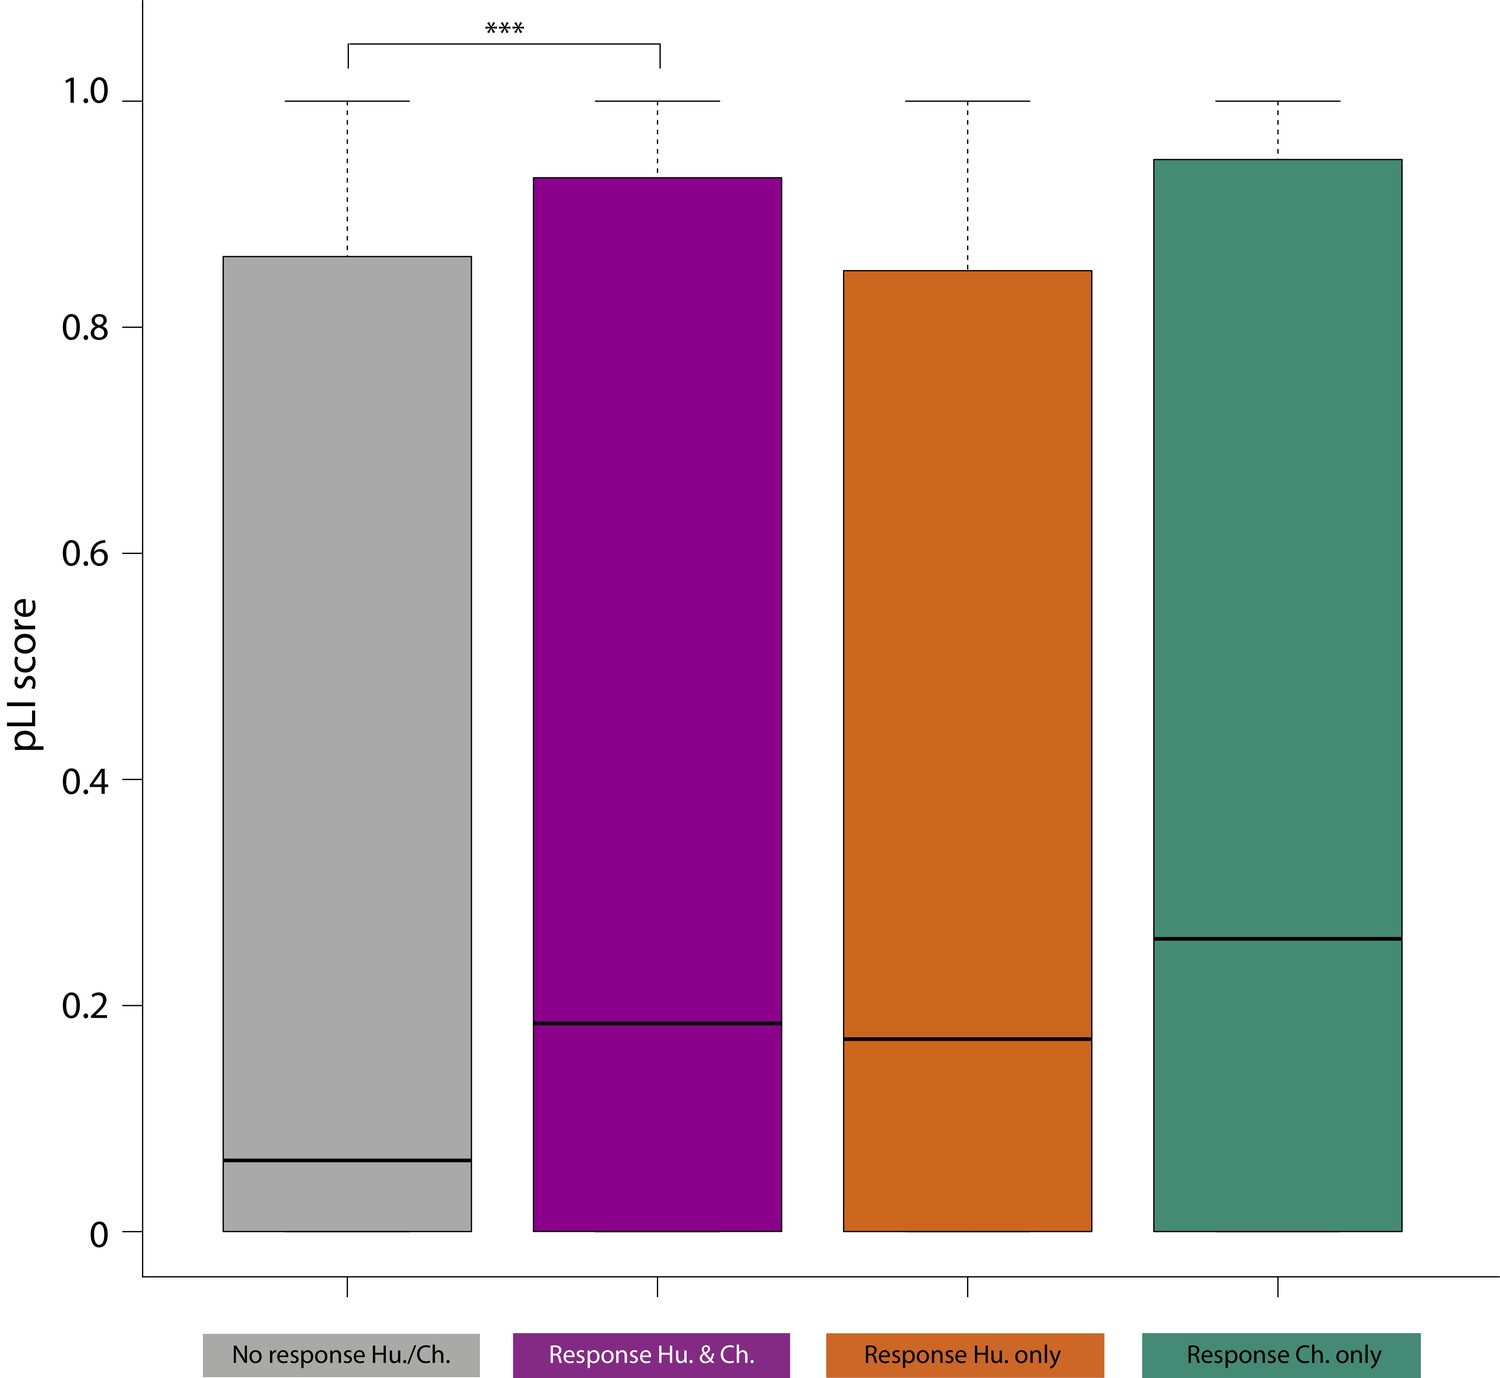
pLI scores of conserved response genes are higher than non-response genes.
Distribution of pLI (probability of being loss-of-function intolerant) scores for each gene within the non-response (grey), conserved response (magenta), human-specific response (orange) and chimpanzee-specific response (green) categories. pLI scores were obtained from Lek et al. (2016). Asterisk denotes a significant difference between categories (***p<0.0005).
Figure 8
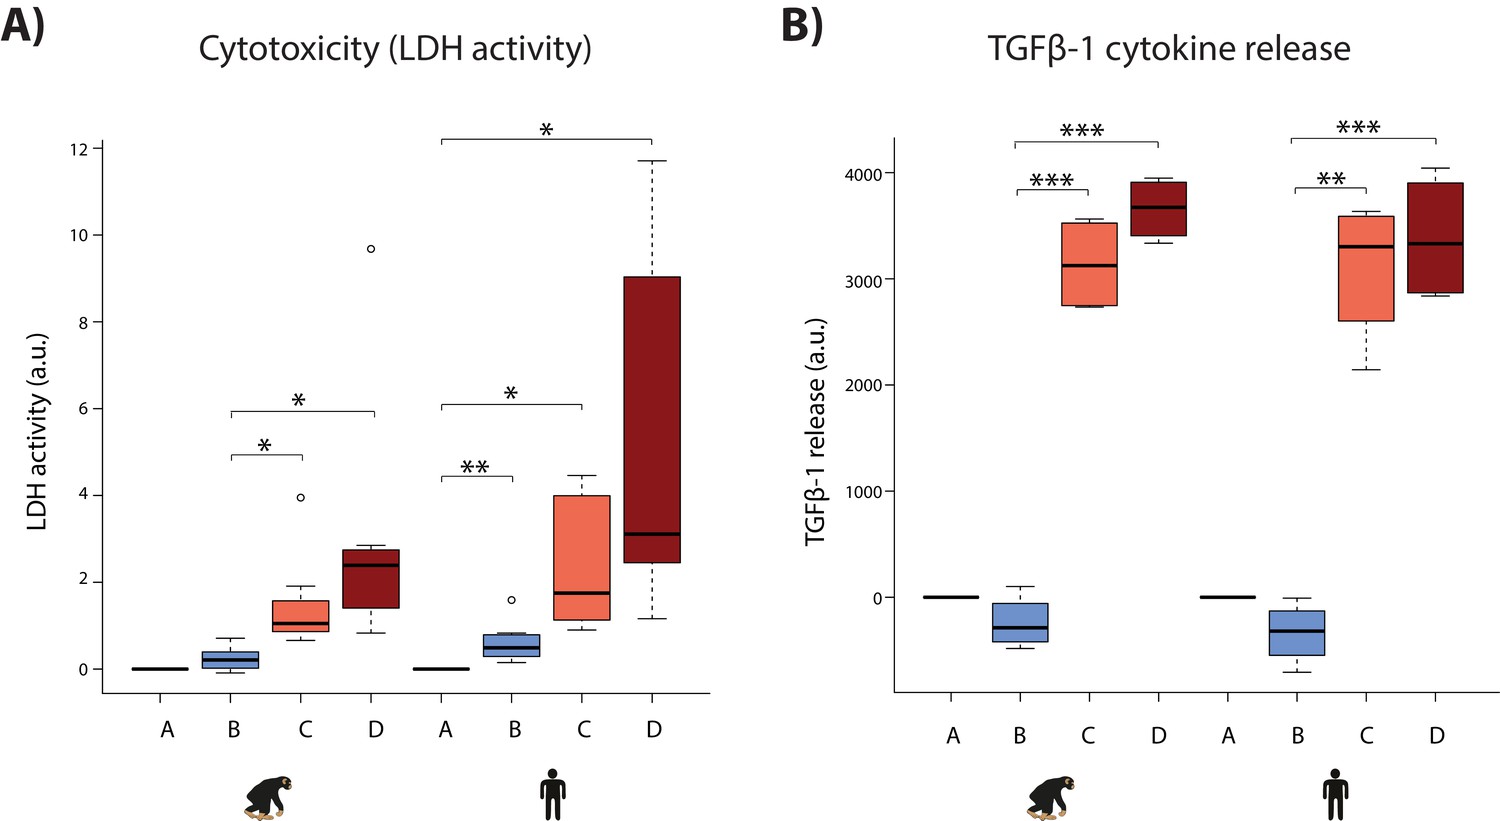
Hypoxia induces cytotoxicity and cytokine release in both species.
(A) Levels of LDH activity, a measure of cytotoxicity, in the cell culture media from each phase of the experiment in all samples from each species. (B) Levels of TGFβ−1, a pro-fibrotic cytokine, in the cell culture media from four representative individuals of each species. Values are normalized to normoxia or hypoxia values that is A (A-A), B (B-A), C (C-B), and D (D-B). Values from the baseline normoxic (A: brown), hypoxic (B: blue), short-term re-oxygenation (C: coral), and long-term re-oxygenation (D: dark red) conditions are shown in each species. Asterisk denotes a significant difference between conditions (*p<0.05, **p<0.005, ***p<0.0005).
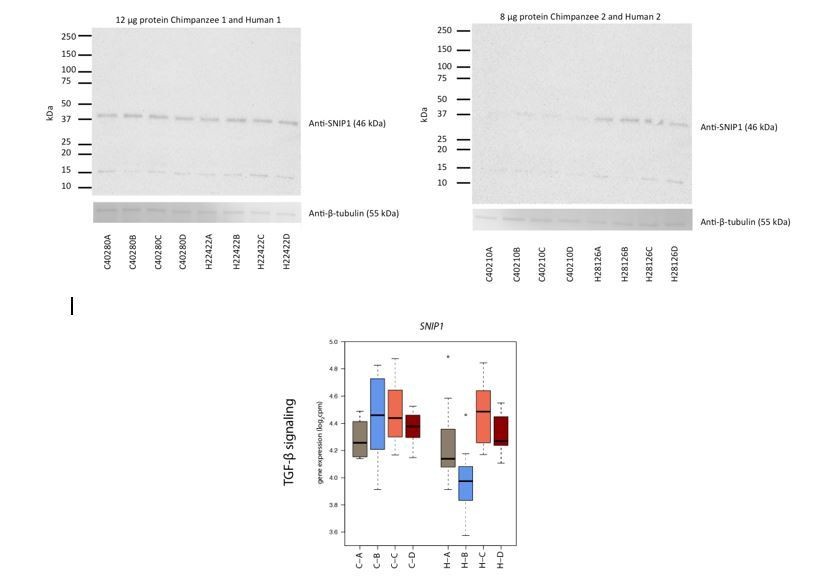
Author response image 1
Tables
Key resources table
| Reagent type (species) or resource | Designation | Source or reference | Identifiers | Additional information |
|---|---|---|---|---|
| Cell line (H.sapiens, Female) | H20682 iPSC | Ward et al., 2018 | ||
| Cell line (H.sapiens, Male) | H20961 iPSC | Burrows et al., 2016 | ||
| Cell line (H.sapiens, Female) | H21792 iPSC | Ward et al., 2018 | ||
| Cell line (H.sapiens, Female) | H22422 iPSC | This study | Age 19, Caucasian, fibroblast origin | |
| Cell line (H.sapiens, Female) | H24280 iPSC | Pavlovic et al., 2018 | ||
| Cell line (H.sapiens, Female) | H25237 iPSC | This study | Age unknown, Caucasian, fibroblast origin | |
| Cell line (H.sapiens, Male) | H28126 iPSC | Burrows et al., 2016 | ||
| Cell line (H.sapiens, Male) | H28815 iPSC | Ward et al., 2018 | ||
| Cell line (P.troglodytes, Female) | C3647 iPSC | Gallego Romero et al., 2015 | ||
| Cell line (P.troglodytes, Male) | C3649 iPSC | Gallego Romero et al., 2015 | ||
| Cell line (P.troglodytes, Female) | C40210 iPSC | Gallego Romero et al., 2015 | ||
| Cell line (P.troglodytes, Female) | C40280 iPSC | Gallego Romero et al., 2015 | ||
| Cell line (P.troglodytes, Female) | C40300 iPSC | Pavlovic et al., 2018 | ||
| Cell line (P.troglodytes, Male) | C4955 iPSC | Gallego Romero et al., 2015 | ||
| Cell line (P.troglodytes, Male) | C8861 iPSC | Gallego Romero et al., 2015 |
Additional files
-
Supplementary file 1
Document containing Tables S1-3.
- https://doi.org/10.7554/eLife.42374.031
-
Supplementary file 2
Table with species-by-condition interaction genes.
- https://doi.org/10.7554/eLife.42374.032
-
Supplementary file 3
Table with all genes assigned to the four gene expression response categories.
- https://doi.org/10.7554/eLife.42374.033
-
Transparent reporting form
- https://doi.org/10.7554/eLife.42374.034
Download links
A two-part list of links to download the article, or parts of the article, in various formats.
Downloads (link to download the article as PDF)
Open citations (links to open the citations from this article in various online reference manager services)
Cite this article (links to download the citations from this article in formats compatible with various reference manager tools)
A generally conserved response to hypoxia in iPSC-derived cardiomyocytes from humans and chimpanzees
eLife 8:e42374.
https://doi.org/10.7554/eLife.42374


