Distinct mesoderm migration phenotypes in extra-embryonic and embryonic regions of the early mouse embryo
- Université Libre de Bruxelles, Belgium
- Walloon Excellence in Lifesciences and Biotechnology, Belgium
Figures
Figure 1 with 1 supplement
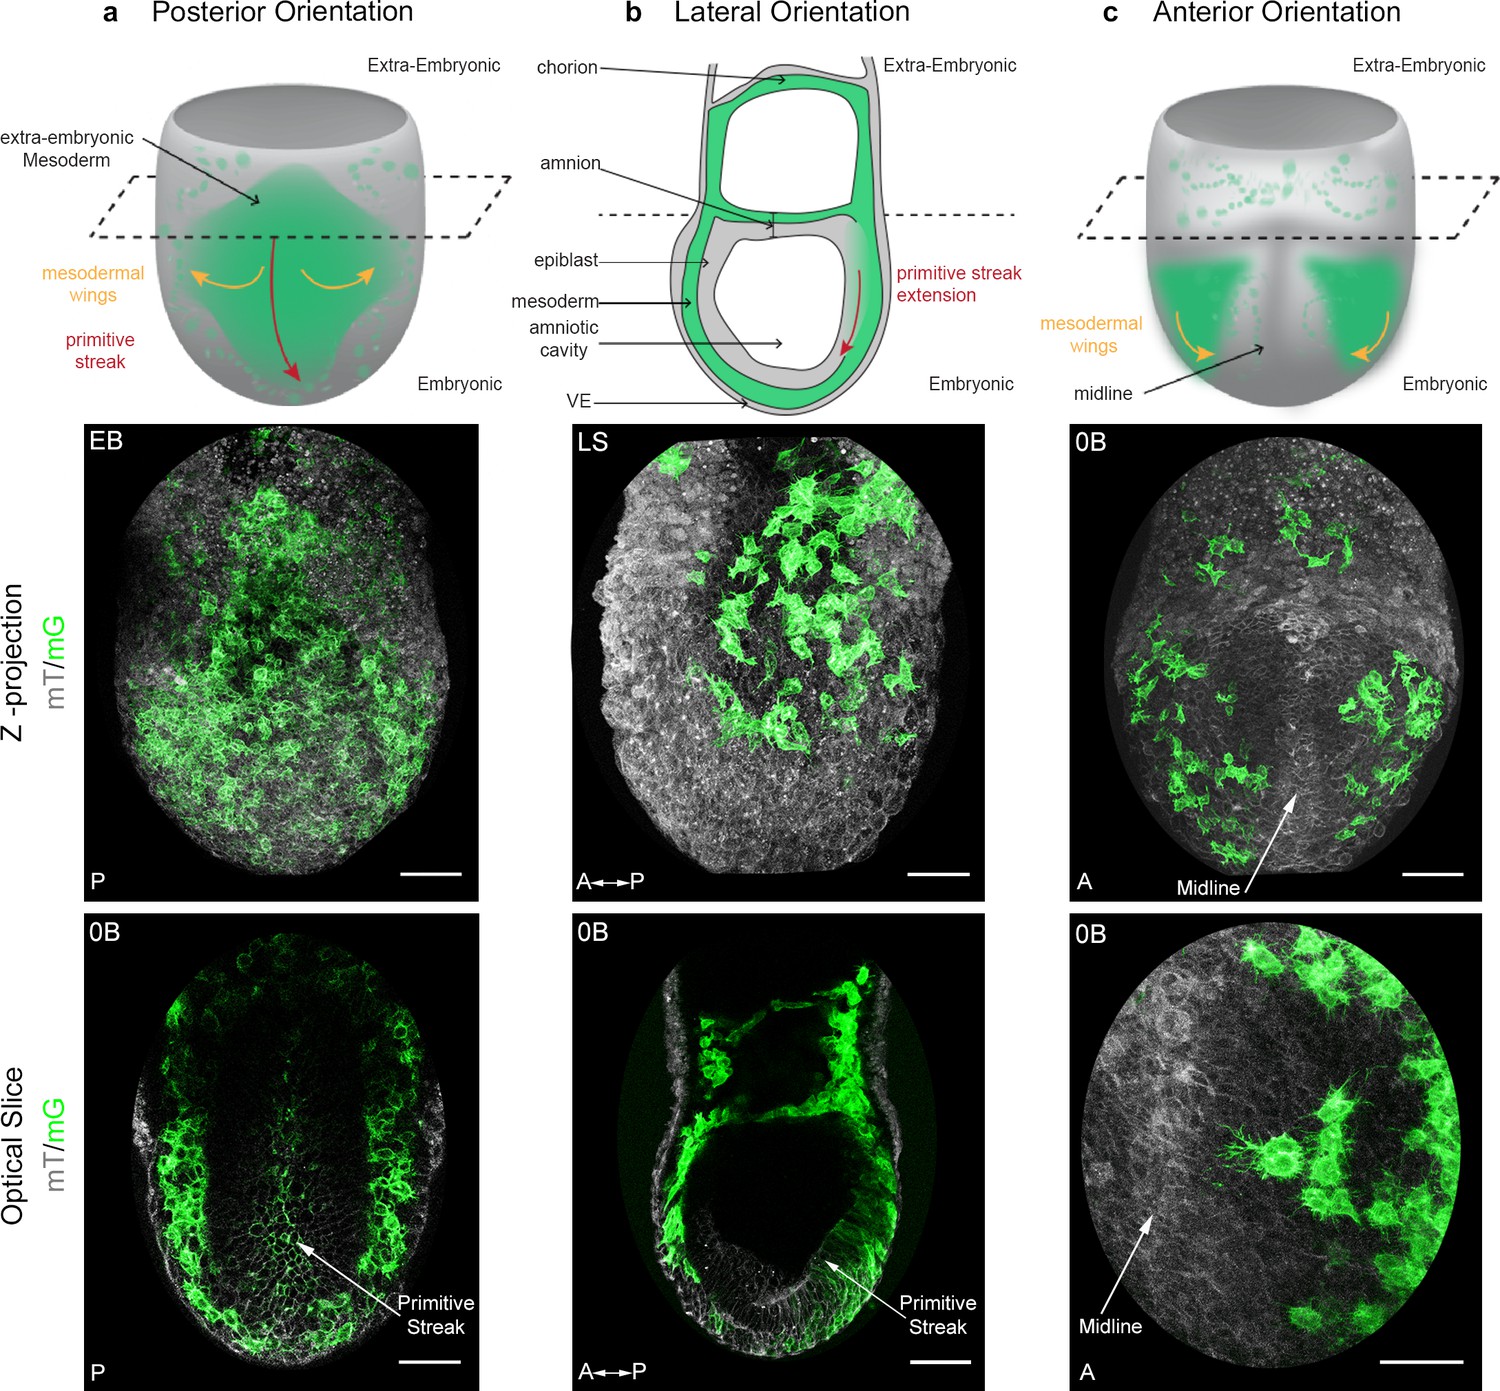
Mosaic membrane GFP labeling of nascent mesoderm allows following individual cell migration through embryo live imaging.
(a) Posterior view. Top: 3D scheme with mesoderm layer in green and the rest of the embryo in grey. The dashed line separates embryonic and extra-embryonic regions. Middle: Z-projection of two-photon stack. Bottom: optical slice highlighting the primitive streak. (b) Lateral view, anterior to the left. Top: 2D scheme. Middle: Z-projection of two-photon stack showing cells progression from posterior to anterior. Bottom: sagittal optical slice. (c) Anterior view. Top: 3D scheme. Middle: Z-projection of two-photon stack with most anterior cells reaching the midline. Bottom: optical slice zoomed on filopodia extending towards the midline. All embryos were dissected at E7.25 and are at Late Streak/Early Bud stage. VE: Visceral Endoderm; mG: membrane GFP, in green; mT: membrane dtTomato, in grey; EB: Early Bud; LS: Late Streak; 0B: Zero Bud. (Scale bars: 50 μm).
Figure 1—figure supplement 1
Live imaging of Brachyury (T)-Cre; mTmG embryos.
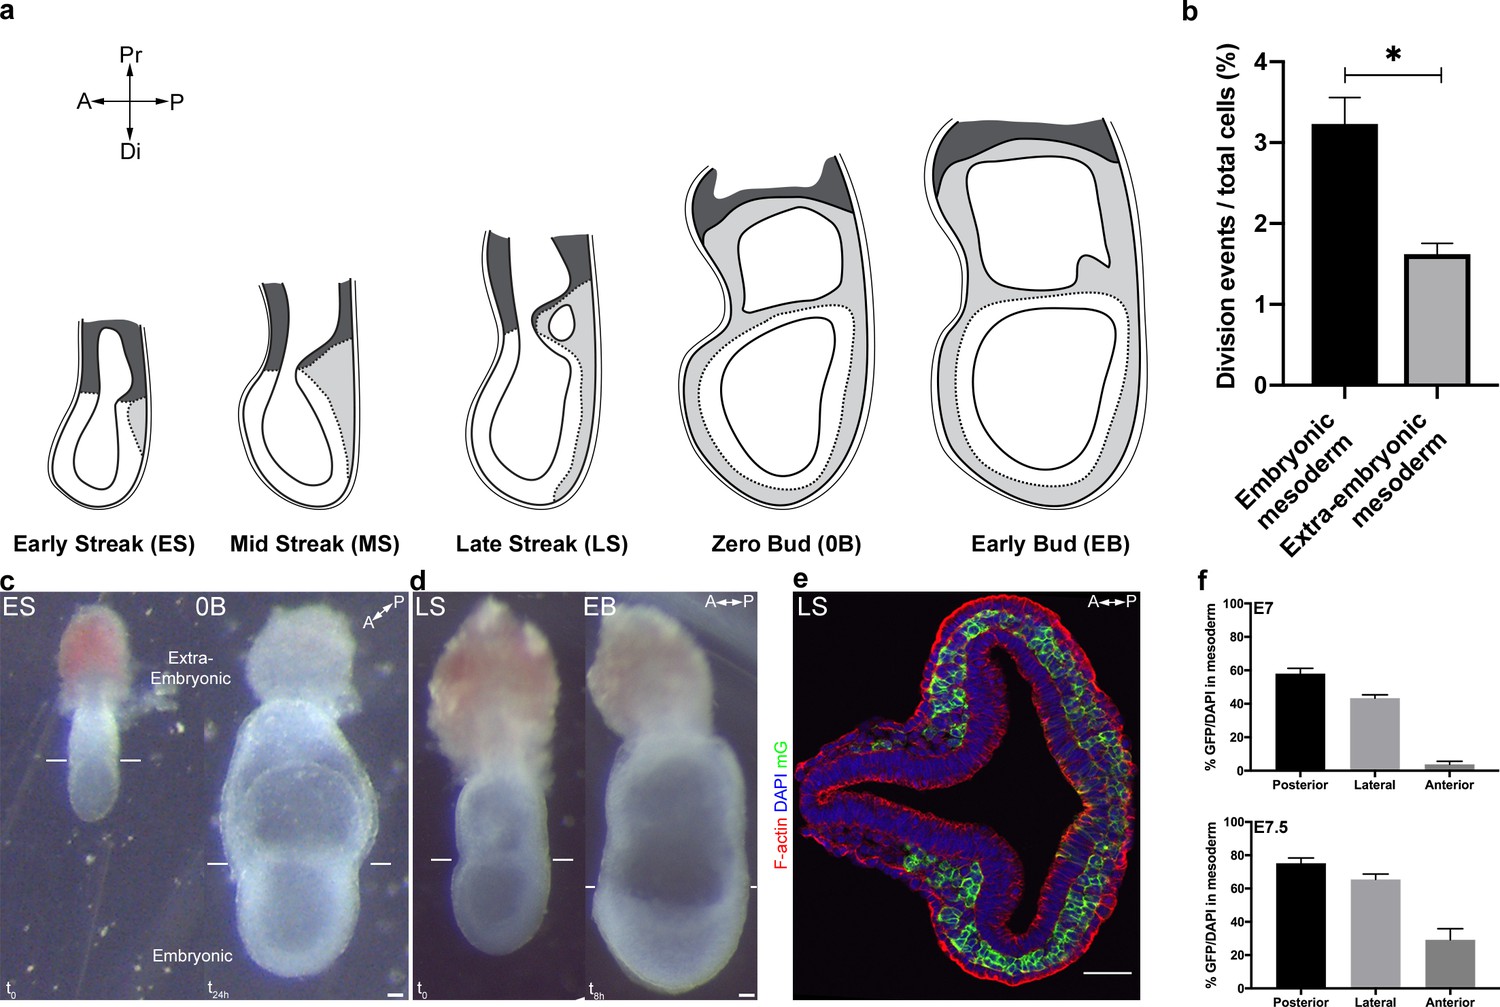
(a) Sketches showing mouse embryo anatomical landmarks used for staging between Early Streak and Early Bud stages. (b) Quantification of embryonic and extra-embryonic mesoderm cell division events (mean ± SEM, n=4 embryos, p=0.0286, Figure 1—figure supplement 1—source data 1.). Cells were observed over an average of 360 min. Cells migrating close to the embryonic/extra-embryonic interface were not taken into consideration. (c) Ex vivo growth of an embryo dissected at E6.75 (Early Streak stage, left panel), after imaging for 12 hr using confocal imaging plus 12 hr of subsequent culture (Zero Bud stage, right panel). (d) Ex vivo growth of an embryo dissected at E7.25 (Late Streak stage, left panel), after 8 hr two-photon imaging (Early Bud stage, right panel). (e) Transverse section at primitive streak level of a E7.5 (Late Streak stage) T-Cre; mTmG embryo stained for F-actin (Phalloidin, red) and nuclei (DAPI, blue) (scale bar: 50 μm). (f) Quantification of mosaicism as the ratio of GFP + cells/all cells in the mesoderm layer (identified anatomically between the epiblast and the visceral endoderm) in anterior, posterior and lateral quadrants at different stages of gastrulation: E7 (Mid Streak stage) and E7.5 (Early Bud stage) (mean ± SEM, n=5 embryos for each stage). P values were calculated using the Mann–Whitney–Wilcoxon. A: Anterior, P: Posterior, Pr: Proximal, Di: Distal, mGFP: membrane GFP, in green.
-
Figure 1—figure supplement 1—source data 1
Division events in mesoderm cells.
- https://doi.org/10.7554/eLife.42434.005
Figure 2
Embryonic and extra-embryonic mesoderm populations have different morphology and migration pattern.
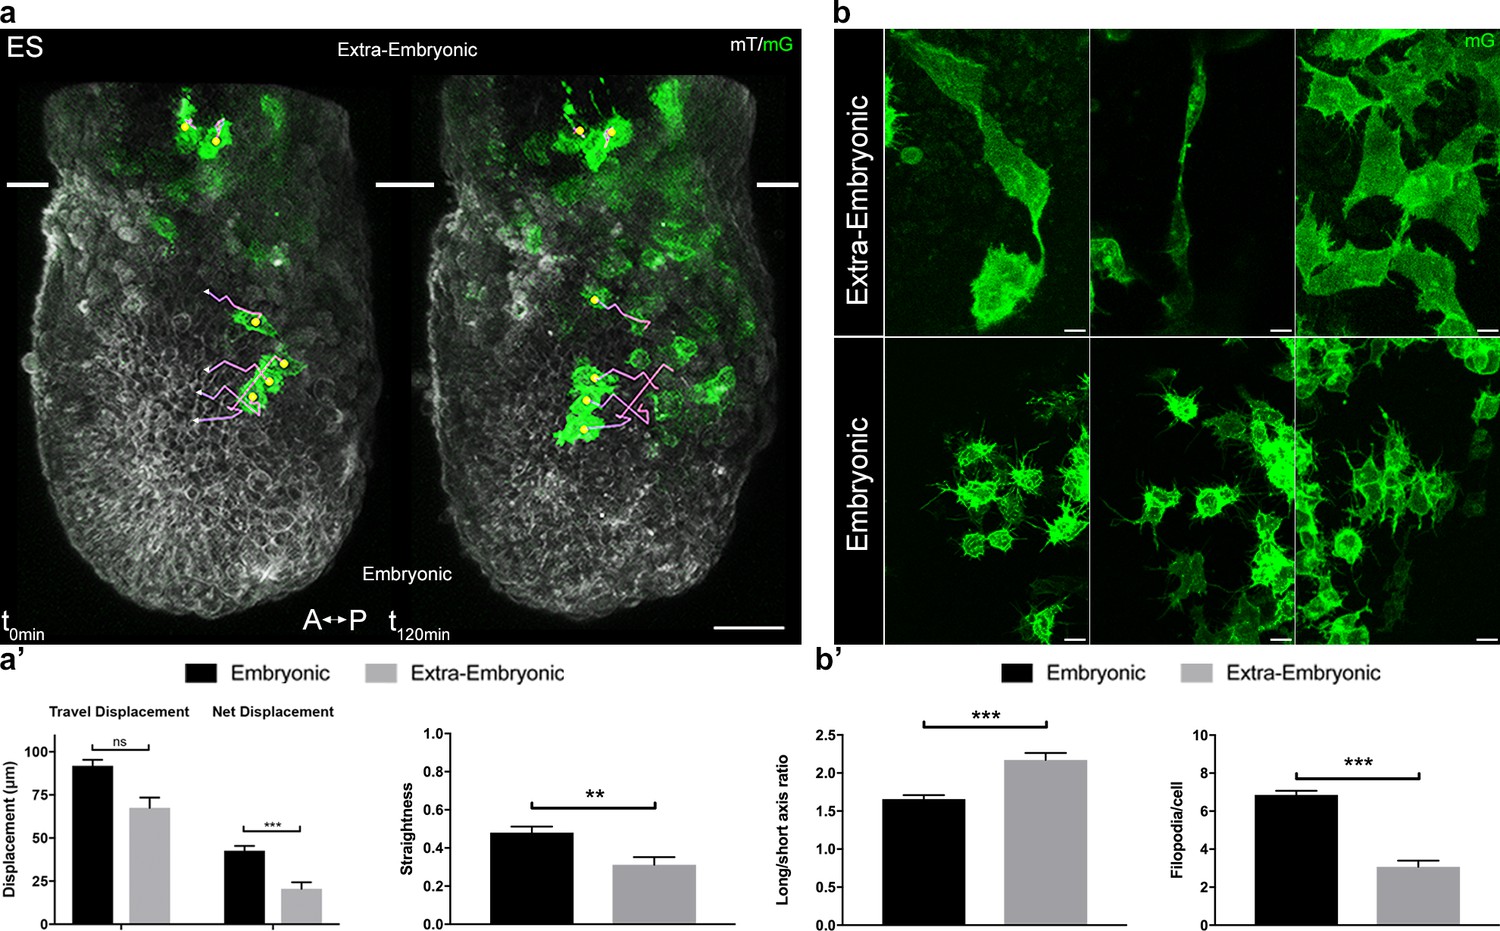
(a) Z-projections of confocal stacks from a T-cre; mTmG embryo dissected at E6.75 (Early Streak), with cell migration tracking for 120 min. Anterior to the left. White lines mark the embryonic/extra-embryonic boundary. (Scale bar: 50 μm). (a’) Quantification (mean ± SEM) of travel and net displacement (Left) and path straightness (Right, on a scale of 0 to 1) of embryonic (black, n=34 from 4 Early/Mid Streak embryos) and extra-embryonic (grey, n=17 cells) mesoderm cells. Data can be found in Table 1 and Figure 2—source data 1. (b) Embryonic and extra-embryonic mesoderm cell shapes (images extracted from 4 Late Streak embryos) (Z-projections of two-photon stacks, scale bar: 10 μm). (b’) Left: Long/short axis ratio of 2D inner ellipse as quantification of cell stretch (mean ± SEM, n=85 embryonic cells in black, n=83 extra-embryonic cells in grey, out of 8 Mid Streak to Zero Bud stages embryos). Right: Quantification (mean ± SEM) of number of filopodia per cell per time point, in embryonic (black, n=167 cells out of 5 Mid Streak to Early Bud stages embryos) and extra-embryonic (grey, n=28 cells) mesoderm cells. Data can be found in Table 2, Figure 2—source data 2 and 3. P values were calculated using the Mann–Whitney–Wilcoxon. mG: membrane GFP, in green; mT: membrane dtTomato, in grey.
-
Figure 2—source data 1
Embryonic and extra-embryonic mesoderm cells tracking: List detailing individual cells tracking, volume and surface measurement results.
- https://doi.org/10.7554/eLife.42434.012
-
Figure 2—source data 2
Embryonic and extra-embryonic mesoderm shape measurements.
- https://doi.org/10.7554/eLife.42434.013
-
Figure 2—source data 3
Embryonic and extra-embryonic mesoderm cells filopodia: Filopodia number/cell/time point and filopodia length measurements.
- https://doi.org/10.7554/eLife.42434.014
Figure 3
Cell shape changes of migrating mesoderm.
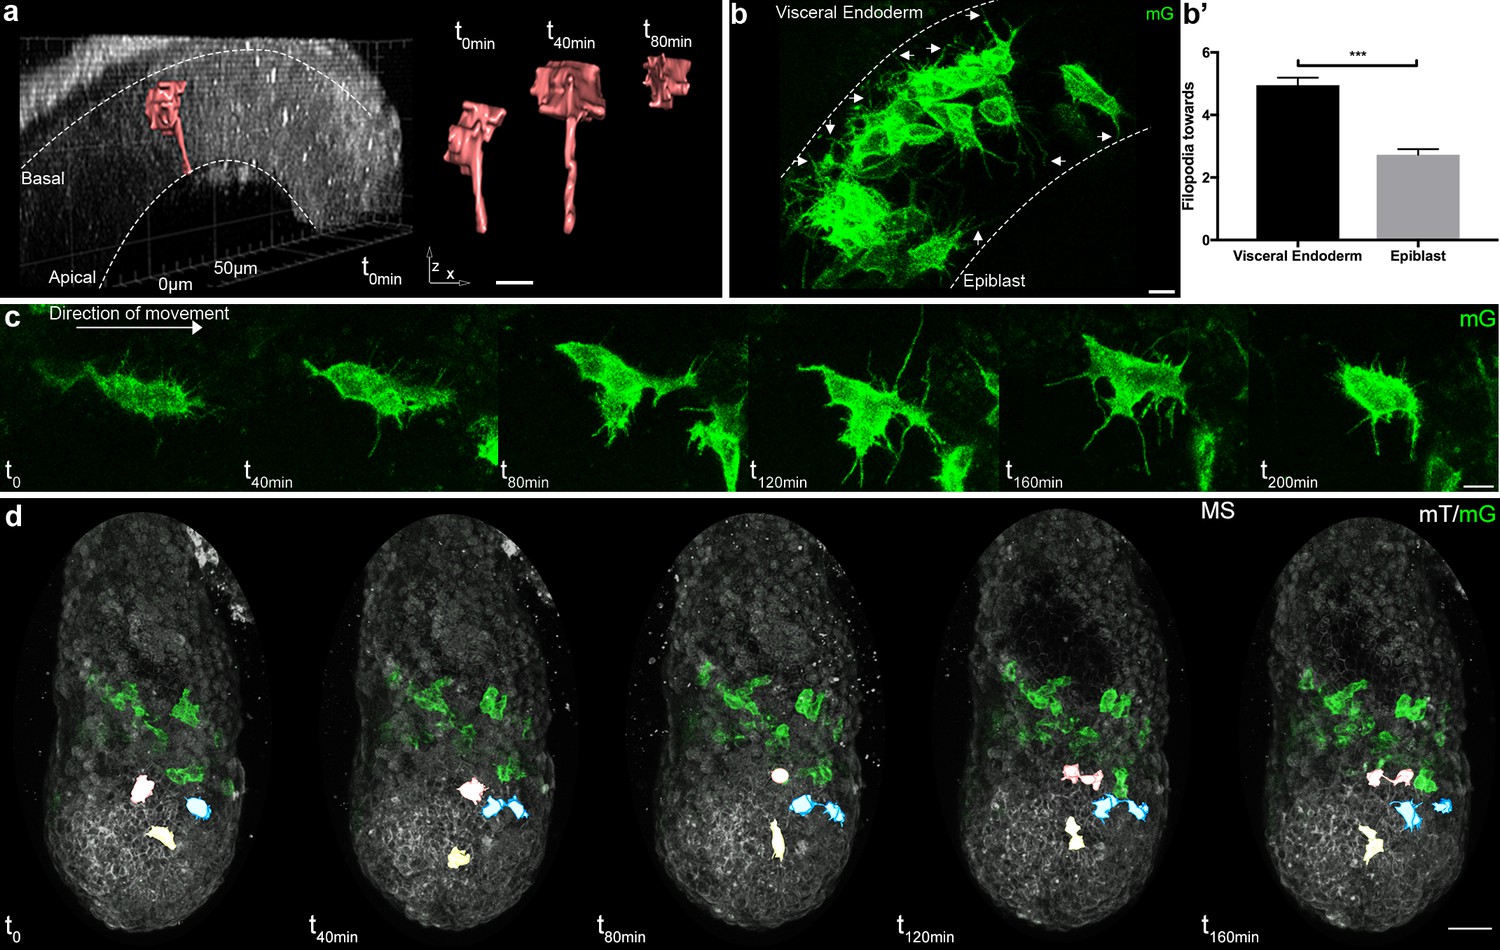
(a) Cell shape progression of nascent mesoderm delaminating at the primitive streak of a Mid Streak embryo (Z-projection of two-photon stack, scale bar: 10 μm). (b) Mesoderm cells extend filopodia (arrows) towards epiblast and visceral endoderm. Embryo is at Late Streak stage. (Z-projection of two-photon stack, scale bar: 10 μm). (b’) Quantification of filopodia per cell per time point as mean ± SEM, n=40 cells out of 4 Late Streak embryos for each, p<0.0001. P value was calculated using the t test. Data can be found in Figure 3—source data 1. (c) Montage of a mesoderm cell (from a Mid Streak stage embryo) displaying seeking behavior (Z-projection of two-photon stack, scale bar: 10 μm). (d) Mesoderm cells are highlighted, through manual segmentation, in red, blue and yellow to track cell behavior after division (Z-projection of confocal stacks from a Mid Streak stage embryo, anterior view, scale bar: 50 μm). mG: membrane GFP, in green; mT: membrane dtTomato, in grey.
-
Figure 3—source data 1
Mesoderm cells filopodia extended towards Visceral Endoderm and Epiblast.
- https://doi.org/10.7554/eLife.42434.018
-
Figure 3—source data 2
Quantification of daughter cells trajectory.
- https://doi.org/10.7554/eLife.42434.019
-
Figure 3—source data 3
Quantification of trajectory of cells in close proximity.
- https://doi.org/10.7554/eLife.42434.020
-
Figure 3—source data 4
Quantification of trajectory of cells after collision.
- https://doi.org/10.7554/eLife.42434.021
Figure 4 with 1 supplement
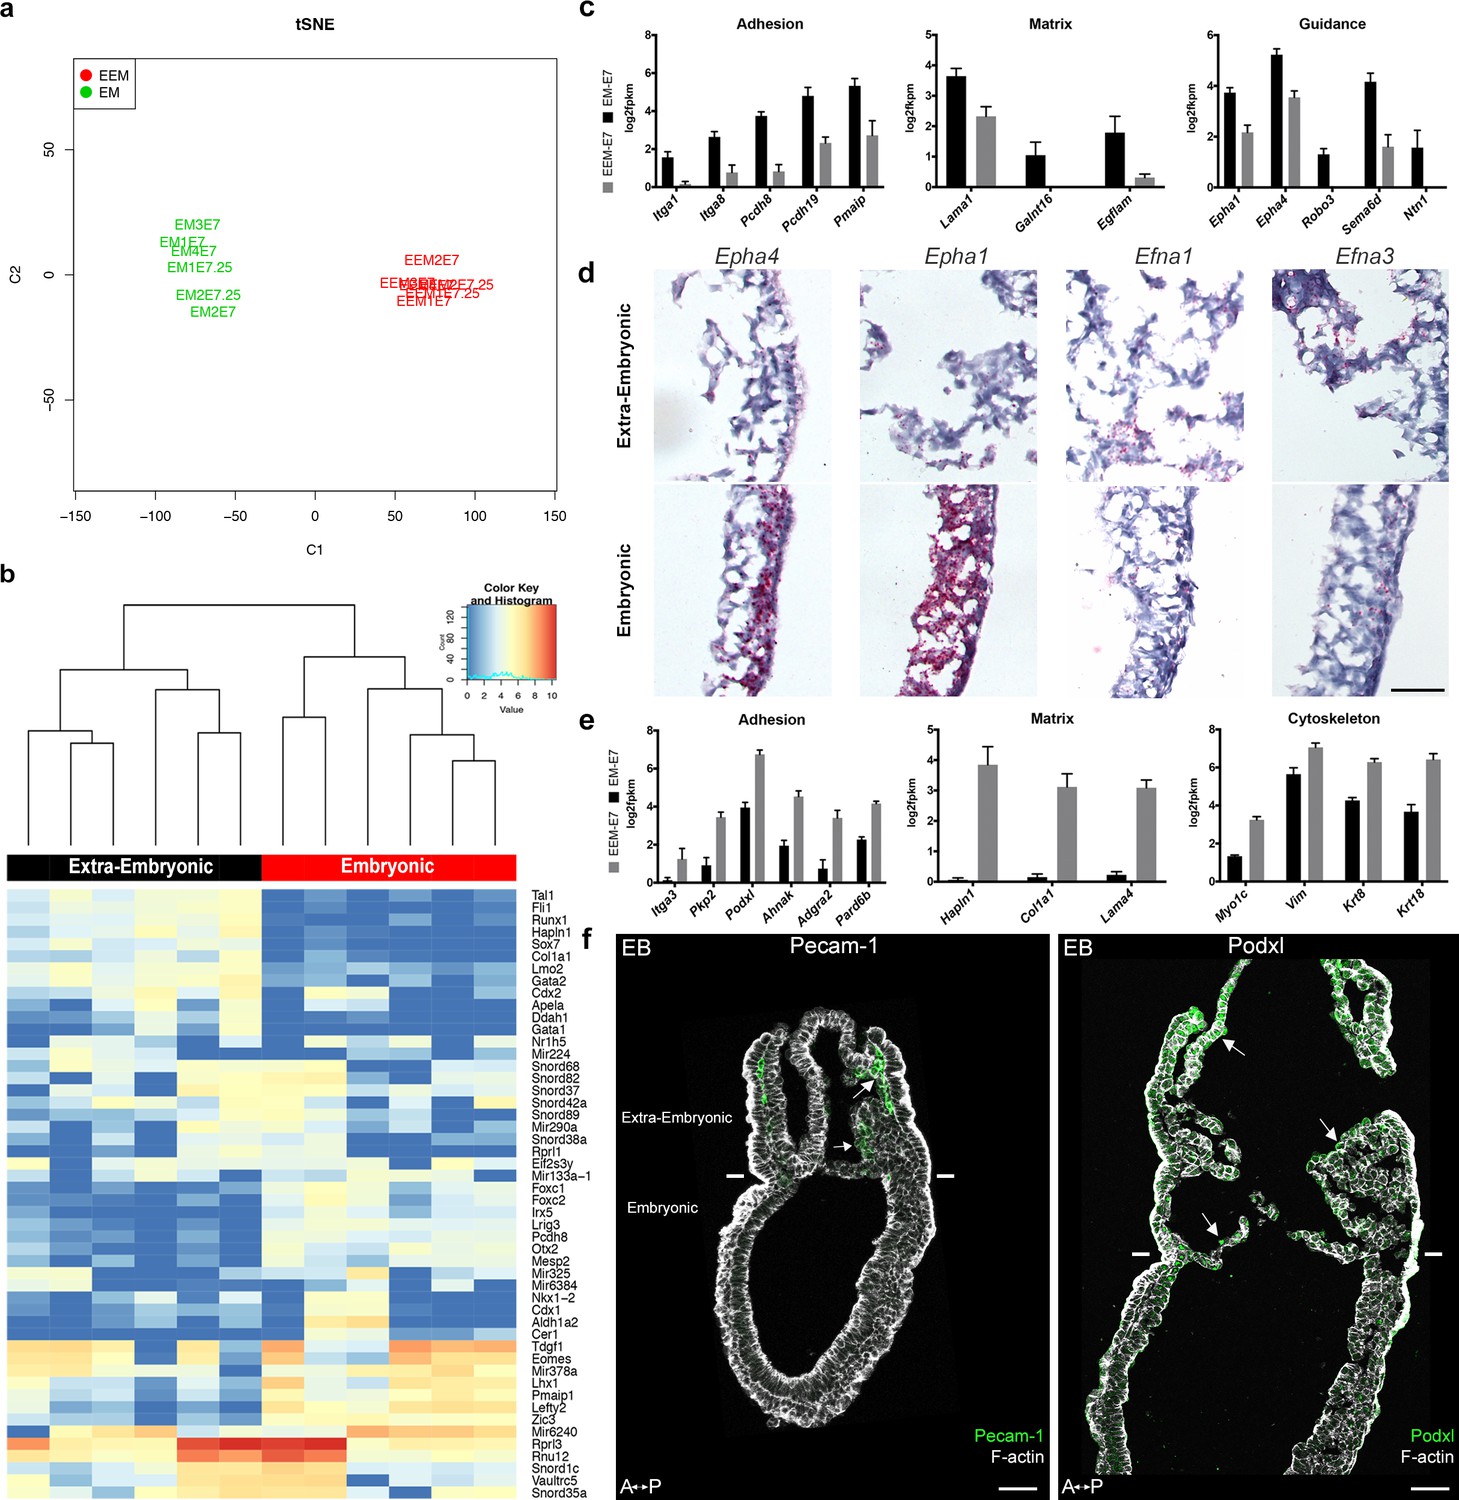
Transcriptomes of mesoderm populations identify differences between embryonic and extra-embryonic mesoderm.
(a) t-Distributed Stochastic Neighbor Embedding (t-SNE) confirms grouping of similar biological samples at E7 (Mid Streak stage) and E7.25 (Late Streak stage). EM: Embryonic mesoderm; EEM: Extra-Embryonic mesoderm. More sample information can be found in Figure 4—source data 1. (b) Heat map showing differentially expressed genes between embryonic and extra-embryonic mesoderm with the highest statistical significance. (c, e) Selection of genes with higher expression in embryonic (c) or extra-embryonic (e) mesoderm, represented as mean ± SEM of log2 fpkm at E7 (n=4 biological replicates, p<0.01), with embryonic in black and extra-embryonic in grey. All represented genes are also significantly differentially regulated at E7.25. Data can be found in Figure 4—source data 2 and 3. (d) In situ hybridization of sagittal sections (anterior to the left) from Zero to Early Bud stages embryos highlighting transcripts for Epha4, Epha1, Efna1 and Efna3, represented by red dots, in the posterior region. Entire embryo sections are shown in Figure 4—figure supplement 1. (Scale bar: 100 μm) (f) Sagittal sections (anterior to the left) from Early Bud stage embryos stained for Platelet endothelial cell adhesion molecule 1 (left panel, Pecam-1 in green, Z-projection of confocal stack), Podocalyxin (right panel, Podxl in green, optical slice), and F-actin (Phalloidin, grey). See same section stained for mGFP in Figure 4—figure supplement 1. White lines mark the embryonic/extra-embryonic boundary. (Scale bars: 50 μm).
-
Figure 4—source data 1
Description and quality control of samples used for RNA-seq.
EM: Embryonic mesoderm; EEM: Extra-Embryonic mesoderm.
- https://doi.org/10.7554/eLife.42434.026
-
Figure 4—source data 2
Expression Levels.
Table containing expression levels in log2 FPKM computed using the rpkm edgeR method.
- https://doi.org/10.7554/eLife.42434.027
-
Figure 4—source data 3
Ranked list of differential expression.
Column 1: gene name, Column 2: log2 Fold change between EM_E7.0 and EEM_E7.0, Column 3: log2 Fold change between EM_E7.25 and EEM_E7.25, Column 4: log2 Count Per Million, Column 5: F-test value, Column 6: F-test pvalue, Column 7: F-test FDR (Benjamini-Hochberg).
- https://doi.org/10.7554/eLife.42434.028
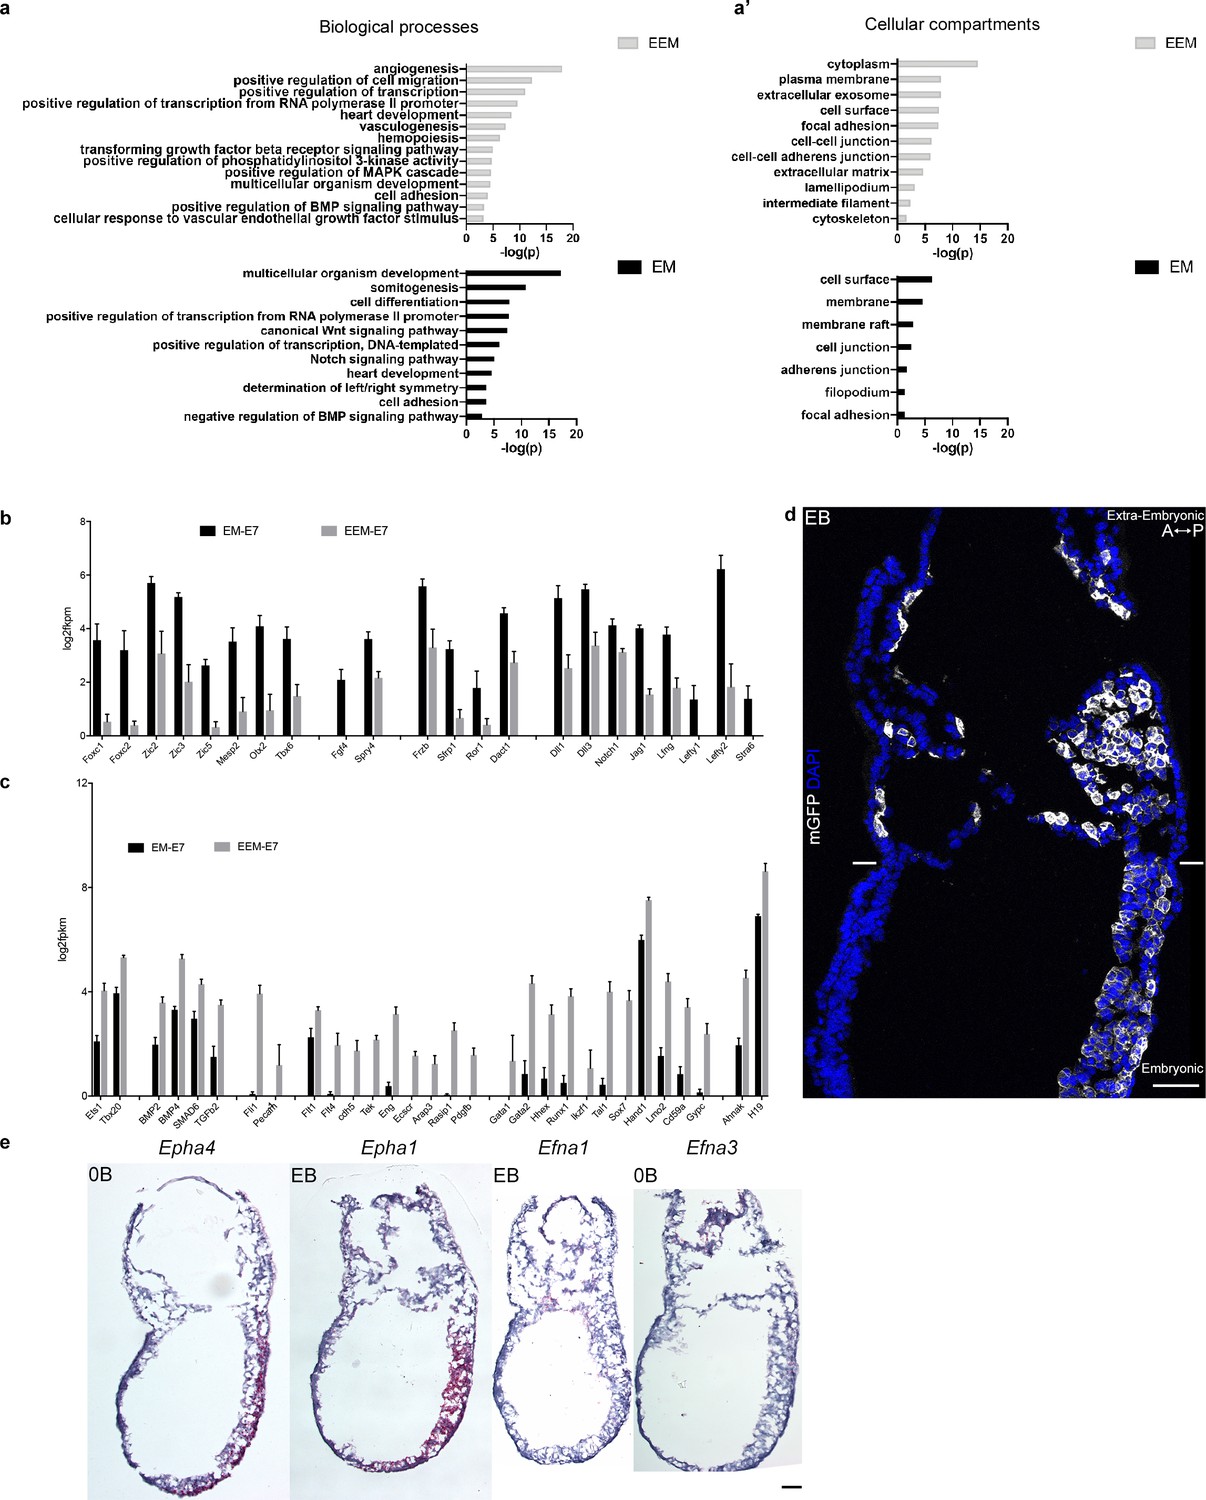
Figure 4—figure supplement 1
Mouse embryonic and extra-embryonic mesoderm transcriptomes.
(a and a’) Gene ontology enrichment of gene clusters related to (a) biological processes and (a’) cellular compartments with higher expression in extra-embryonic (top, grey) or embryonic (bottom, black) mesoderm at E7 and E7.25. (b,c) Selection of genes known to have higher expression in (b) extra-embryonic or (c) embryonic mesoderm, represented as mean ± SEM of log2 fpkm at E7 (n=4 biological replicates, p<0.001), with embryonic in black and extra-embryonic in grey. EM: Embryonic mesoderm and EEM: Extra-Embryonic mesoderm. Data can be found in Figure 4—source data 2 and 3. (d) Optical slice of sagittal section (anterior to the left) from Early Bud stage embryo with membrane GFP in grey and nuclei in blue (DAPI) (Scale bar: 50 μm) (e) In situ hybridization of sagittal sections (anterior to the left) from Zero to Early Bud stages embryo highlighting transcripts from Epha4, Epha1, Efna1 and Efna3, represented by red dots (Scale bar: 100 μm).
Figure 5

Embryonic and extra-embryonic mesoderm cells have distinct cytoskeleton composition.
(a) Z-projections of confocal stack of a sagittal section from an Early Bud stage embryo stained for Vimentin, F-Actin (Phalloidin), and nuclei (DAPI). (b, d) Z-projections of confocal stacks of sagittal sections from Late Streak (b) and Early Bud (c: 20x, d: 40x) stages embryos stained for Keratin 8 (grey) and nuclei (DAPI, blue). (e) Z-projection of two-photon stack of a whole-mount T-Cre; LifeAct-GFP (green) Late Streak embryo. Anterior is to the left. (Scale bars: 50 μm).
Figure 6 with 2 supplements

Rhoa and Rac1 mesoderm-specific mutants display impaired migration of embryonic mesoderm.
(a) Z-projection and (b) frontal optical slice of wild-type (WT) and RhoaΔmesoderm embryos. Dashed lines mark the epiblast. (c) Z-projection and (d) sagittal optical slice of wild-type and Rac1Δmesoderm embryos highlighting the accumulation of mesoderm cells next to the primitive streak (*). Dashed lines mark the epiblast. (e) Z-projections of wild-type and RhoaΔmesoderm embryos (oblique anterior view, posterior to the right, two-photon) show impaired mesoderm migration in embryonic but not extra-embryonic regions. (f) Z-projections of wild-type and Rac1Δmesoderm embryos (anterior view, confocal) show impaired mesoderm migration in embryonic but not extra-embryonic regions. Each mutant is compared to a wild-type littermate in similar orientation. White lines mark the embryonic/extra-embryonic boundary. mG: membrane GFP, in green; mT: membrane dtTomato, in grey. (Scale bar: 50 μm).
Figure 6—figure supplement 1
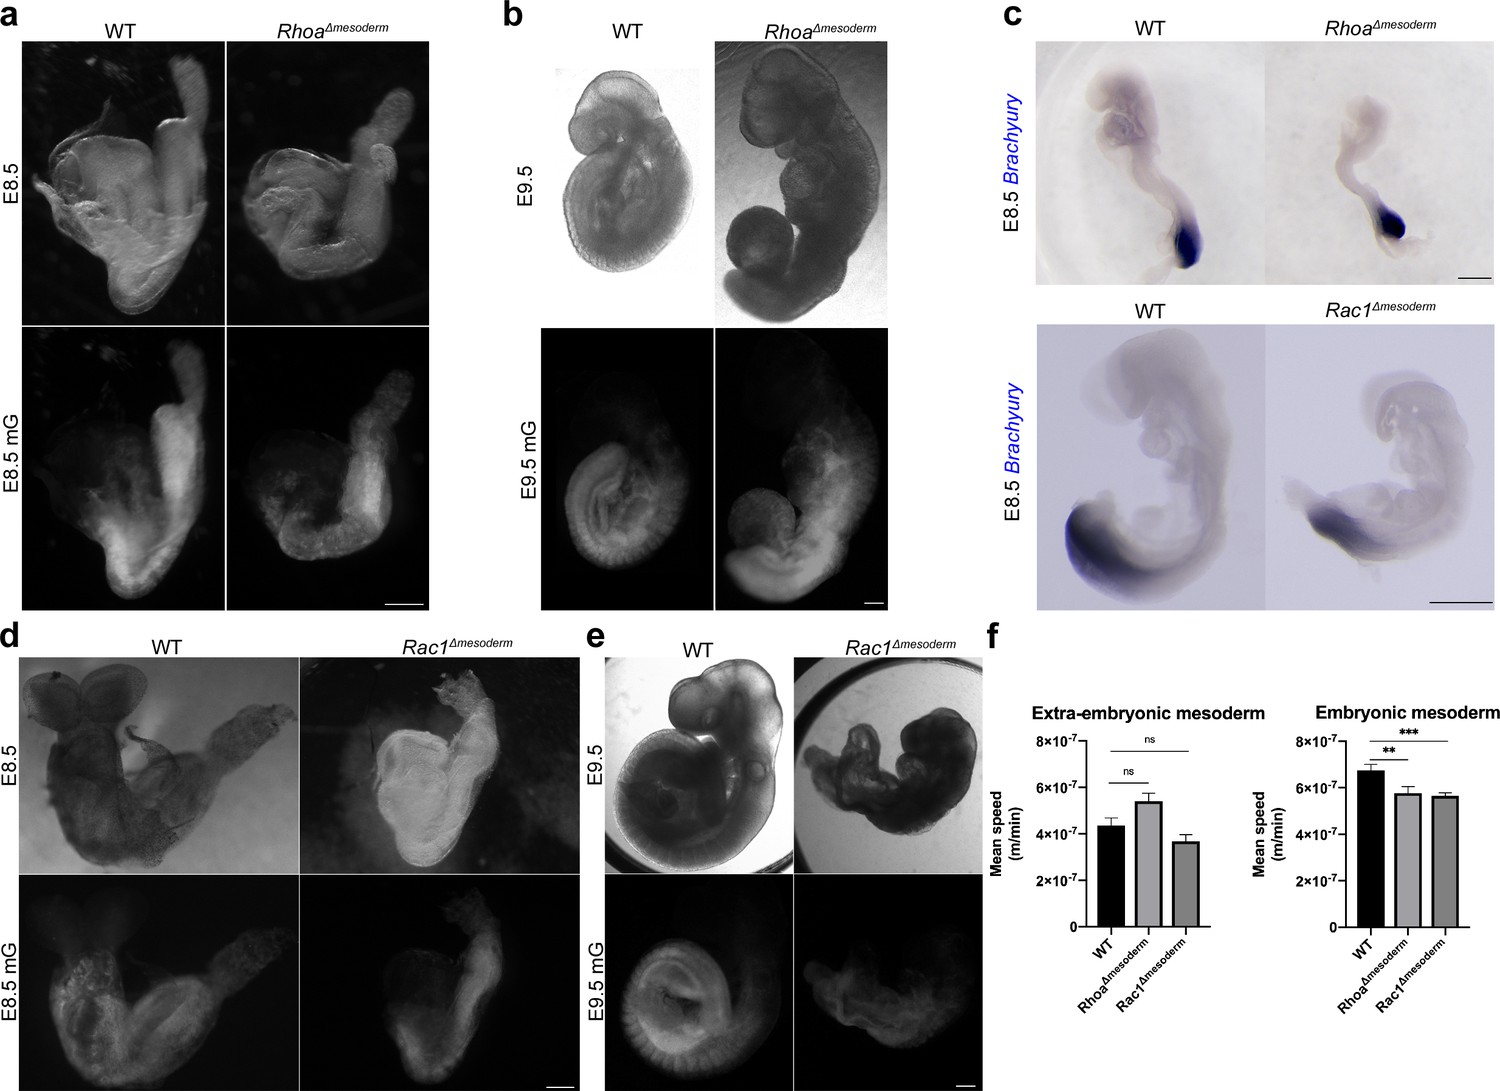
Phenotypes of Rac1 and Rhoa mesoderm-specific mutants post gastrulation.
(a, b) Bright field (top) and mGFP epifluorescence (bottom) images of RhoaΔmesoderm embryos at E8.5 and E9.5 (c) In situ hybridization for Brachyury at E8.5 of RhoaΔmesoderm (top) and Rac1Δmesoderm (bottom) embryos. (d, e) Bright field (top) and mGFP epifluorescence (bottom) images of Rac1Δmesoderm embryos at E8.5 and E9.5. All mutants are compared to a wild-type littermate. mGFP: membrane GFP, in grey (Scale bars: 200 μm). (f) Mesoderm mean speed (m/min) (mean ± SEM, p<0.014 and p<0.0005 respectively) for wild-type (n=34), RhoaΔmesoderm (n=32), and Rac1Δmesoderm (n=35) cells in embryonic (left) and extra-embryonic (right) regions. P values were calculated using the t test. Data can be found in Figure 6—figure supplement 1—source data 1 and 2.
-
Figure 6—figure supplement 1—source data 1
Tracking of embryonic RhoaΔmesoderm and Rac1Δmesoderm mesoderm cells.
- https://doi.org/10.7554/eLife.42434.035
-
Figure 6—figure supplement 1—source data 2
Tracking of extra-embryonic RhoaΔmesoderm and Rac1Δmesoderm mesoderm cells.
- https://doi.org/10.7554/eLife.42434.036
Figure 6—figure supplement 2
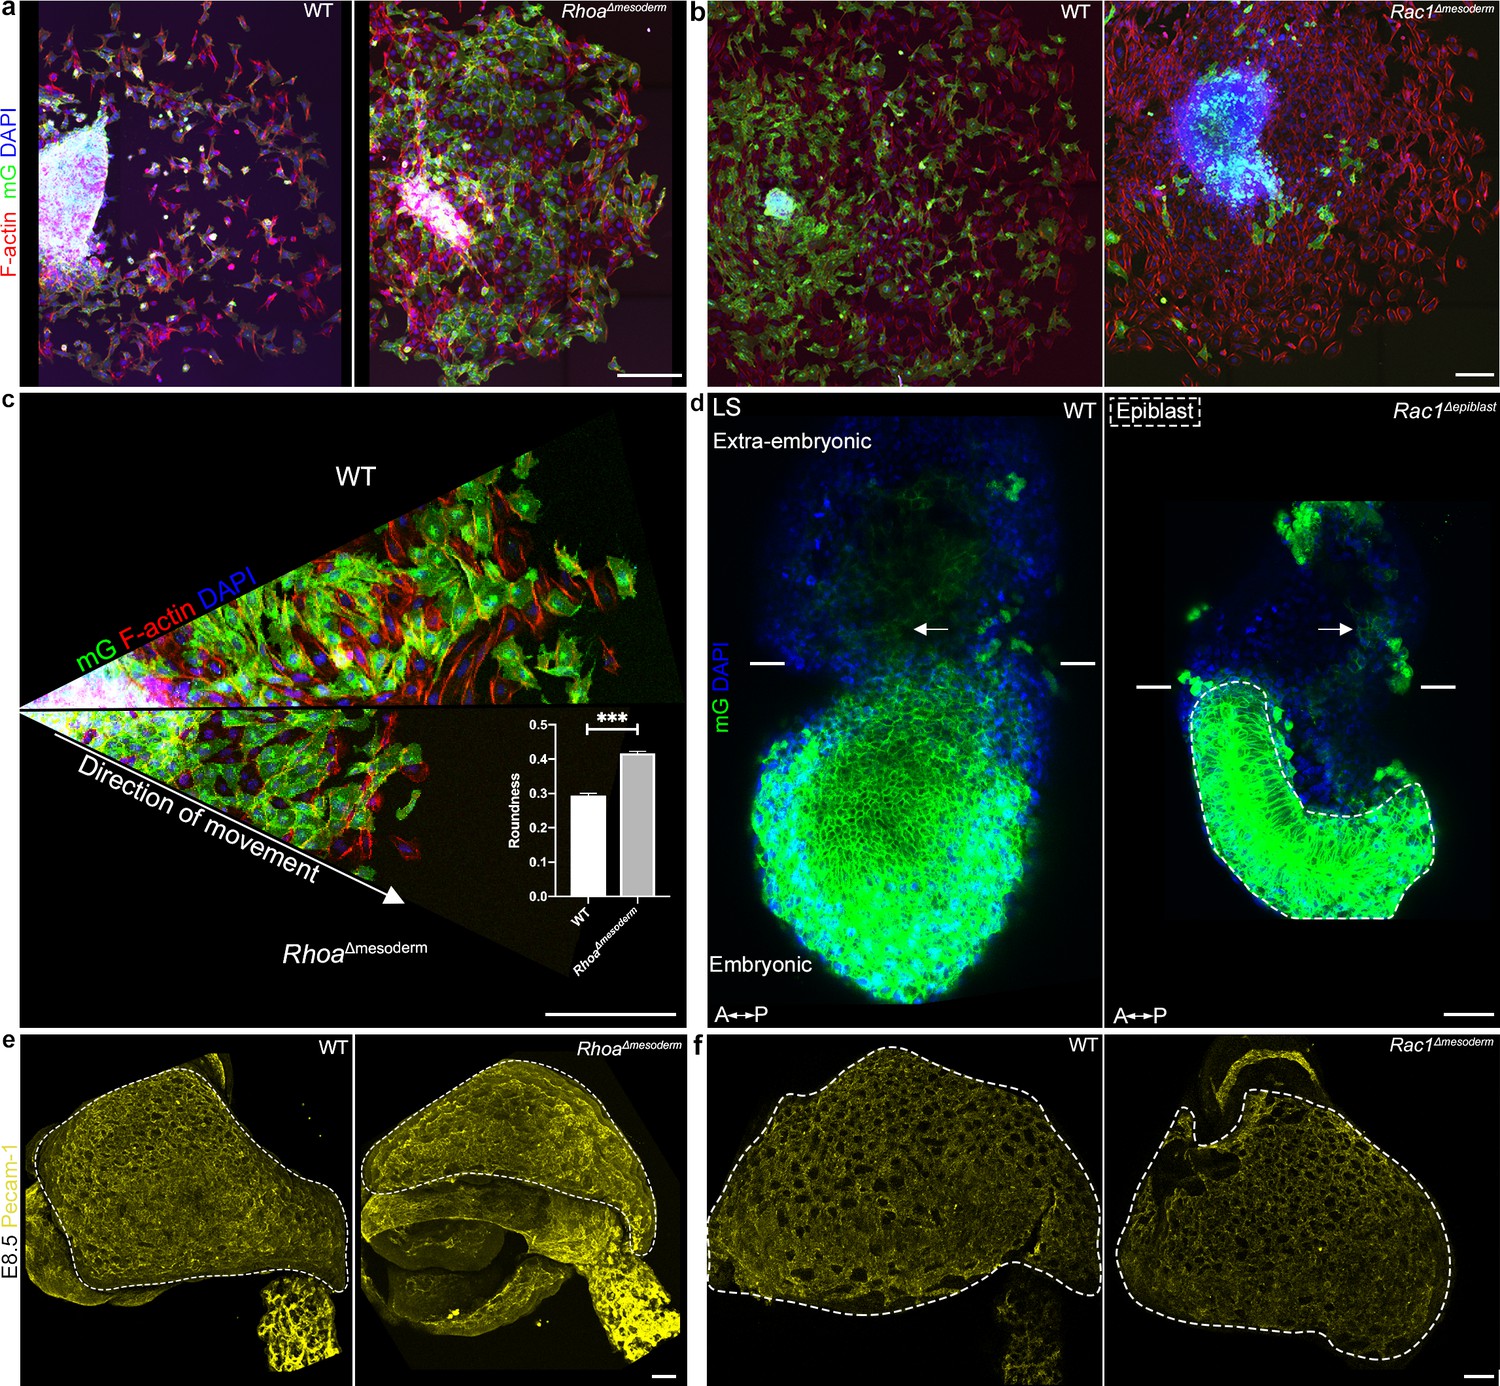
Cellular details in Rhoa and Rac1 mesoderm-deleted embryos.
(a, b) Embryonic mesoderm explants from (a) mTmG; RhoaΔmesoderm, and (b) mTmG; Rac1Δmesoderm Mid/Late Streak embryos cultured on fibronectin for (a) 48 hr and (b) 30 hr, stained for F-actin (Phalloidin, in red) and nuclei (DAPI, in blue). mG: membrane GFP, in green. (n=3 for Rac1, 4 for Rhoa; similar phenotype in 2/3 mutants for Rac1 and 3/4 mutants for Rhoa). (Scale bars: 200 μm for a, and 50 μm for b). (c) Radial expansion from embryonic mesoderm explant of mTmG; RhoaΔmesoderm embryo, after 48 hr of culture on fibronectin. Explants images were fitted inside their corresponding circle, and cropped in the form of cone from the center. (Scale bars: 100 μm). (c) Roundness quantification (mean ± SEM) in wild-type and RhoaΔmesoderm mesoderm explants. (n=250 cells for wild-type, 272 for RhoaΔmesoderm, p<0.0001). Data can be found in Figure 6—figure supplement 2—source data 1. (d) Z-projections of middle slices from two-photon stacks of wild-type (left) and Rac1Δepiblast (right) embryos expressing mGFP in epiblast-derived (Sox2-Cre) cells. Anterior is to the left. Arrows point to extra-embryonic mesoderm. Dashes line the epiblast (Scale bars: 50 μm). (e, f) Whole-mount E8.5 (e) RhoaΔmesoderm and (f) Rac1Δmesoderm embryos stained for Pecam-1 (in yellow, n=2 for Rhoa, 8 for Rac1). Dashed lines mark the yolk sac. (Scale bars: 100 μm). P values were calculated using the Mann–Whitney–Wilcoxon. All mutants are compared to a wild-type littermate.
-
Figure 6—figure supplement 2—source data 1
Quantification of cell shape in mesoderm explants from wild-type and RhoaΔmesoderm embryos.
- https://doi.org/10.7554/eLife.42434.038
Figure 7
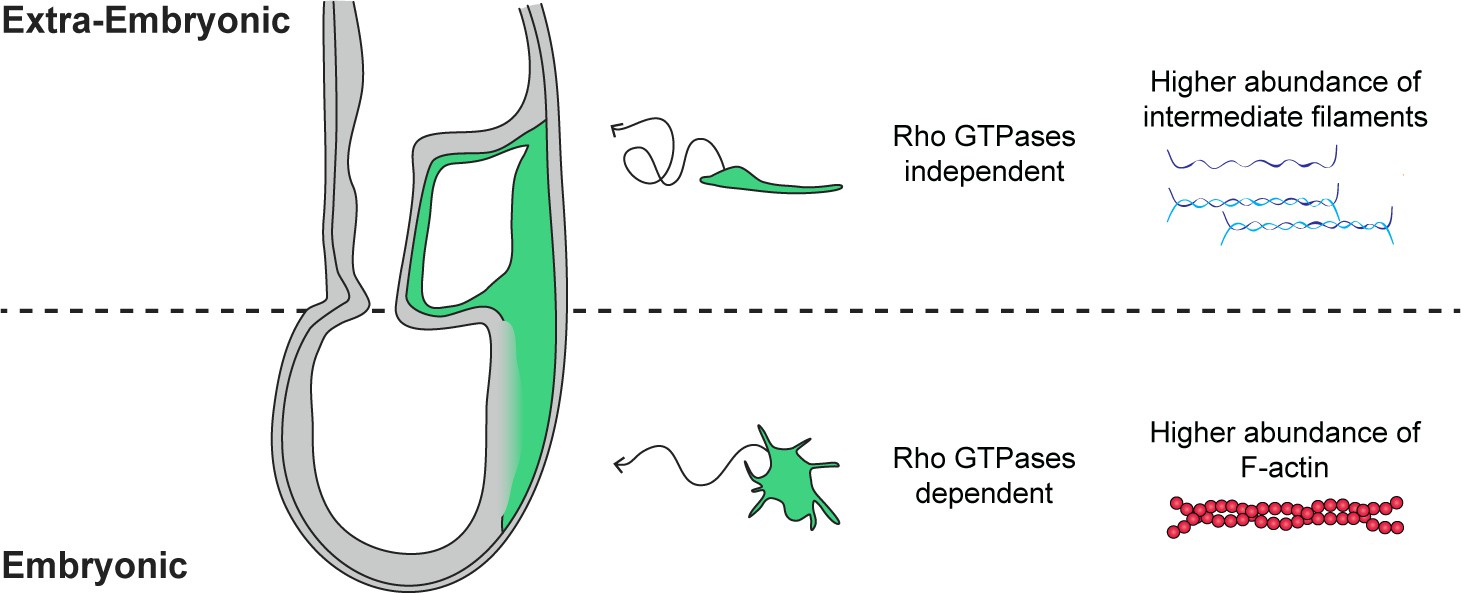
Embryonic and extra-embryonic mesoderm cells show distinct shape, trajectory, Rho GTPases dependency, and cytoskeletal composition during gastrulation in the mouse embryo.
In the extra-embryonic region (top), mesoderm cells are stretched, with higher Keratin 8 and Vimentin abundance. Their displacement is convoluted and does not depend on Rho GTPases. In the embryonic region (bottom), mesoderm cells are compact with numerous filopodia and have higher F-actin abundance. Cells have straighter trajectories and require Rho GTPases. The embryo scheme represents a sagittal section with anterior to the left. Green and grey label mesoderm and other layers, respectively.
Videos
Video 1
Mesoderm cells migrating towards extra-embryonic and embryonic regions.
Z-projections of confocal stacks from a T-Cre; mTmG embryo dissected at E6.75 (Early Streak stage) and imaged for 320 min. Mesoderm cells express membrane GFP (green); all other cells express membrane dtTomato (red). Anterior oblique orientation with posterior to the right (scale bar: 50 μm).
Video 2
‘Trial and error’ trajectories.
Z-projections of confocal stacks from a T-Cre; mTmG embryo dissected at E6.75 (Mid Streak stage) and imaged for 260 min. Mesoderm cells express membrane GFP (green); all other cells express membrane dtTomato (red). Anterior oblique orientation with posterior to the right (scale bar: 50 μm).
Video 3
Tracking mesoderm migration.
3D snapshots of confocal stacks from a T-Cre; mTmG embryo dissected at E6.75 (Early Streak stage) and imaged for 180 min, with manually highlighted cells tracked throughout the time lapse. Video shows highlighted cells first, then the original images (membrane GFP, in green) in a looping fashion for comparison. All other cells express membrane dtTomato (grey). Lateral orientation with anterior to the left (scale bar: 50 μm).
Video 4
Tracking mesoderm migration.
3D snapshots of confocal stacks from a T-Cre; mTmG embryo dissected at E6.75 (Early Streak stage) and imaged for 160 min, with manually highlighted cells tracked throughout the time lapse. Video shows highlighted cells first, then the original images (membrane GFP, in green) in a looping fashion for comparison. All other cells express membrane dtTomato (grey). Lateral orientation with anterior to the left (scale bar: 50 μm).
Video 5
Extra-embryonic mesoderm migration is characterized by low net displacement.
Z-projection of confocal stack from a T-Cre; mTmG embryo dissected at E6.75 (Early Streak stage) and imaged for 860 min cropped to show extra-embryonic mesoderm cells. Mesoderm cells express membrane GFP (green) (scale bar: 10 μm).
Video 6
Mesoderm extends filopodia towards epiblast and visceral endoderm.
Two-Photon stack of a T-Cre; mTmG embryo at Late Streak stage. The stack progresses from anterior to posterior. Mesoderm cells express membrane GFP (green); all other cells express membrane dtTomato (grey) (scale bar: 50 μm).
Video 7
Searching behavior.
Z-projection of two-photon stack from a T-Cre; mTmG embryo at Mid Streak stage imaged for 100 min. Arrow points at embryonic mesoderm cell. Mesoderm cells express membrane GFP (green); all other cells express membrane dtTomato (grey) (scale bar: 50 μm).
Video 8
LifeAct-GFP expression is higher in embryonic mesoderm.
3D snapshots of two-photon stacks from a T-Cre; LifeAct-GFP embryo dissected at E7.25 (Late Streak stage) and imaged for 295 min. Images were processed with the ZEN blue denoise function. LifeAct-GFP (in green) highlights F-actin. The bright specks in extra-embryonic on the right side are debris. Lateral orientation with anterior to the left (3D scale bar: 50 μm).
Video 9
Mesoderm explant.
Z-projection of confocal stack of mesoderm explant from a T-Cre; mTmG embryo dissected at E7.5 (Late Streak stage). The explant was imaged for 750 min every 15 min.
Video 10
RhoaΔmesoderm explant undergoes compaction before cell migration.
Z-projection of confocal stack of mesoderm explant from a T-Cre; mTmG; Rhoa fl/- embryo dissected at E7.5 (Late Streak stage). The explant was imaged for 750 min every 15 min.
Video 11
RhoaΔmesoderm embryos display an accumulation of mesoderm near the primitive streak.
Two-photon Z stack of a T-Cre; mTmG; Rhoa fl/- embryo at Late Streak stage. Mesoderm cells express membrane GFP (green); all other cells express membrane dtTomato (grey). Anterior oblique orientation with anterior to the left (scale bar: 50 μm).
Video 12
Mesoderm migration tracking in RhoaΔmesoderm embryo.
3D snapshots of stacks from a T-Cre; mTmG; Rhoa fl/- embryo dissected at E7.25 (Mid Streak stage) and imaged using two-photon microscopy for 120 min showing highlighted cells, which are tracked throughout the time lapse. The video shows the highlighted cells first, then the original images (Membrane GFP, in green) in a looping fashion for comparison. All other cells express membrane dtTomato (grey). Anterior oblique orientation with anterior to the left (scale bar: 50 μm).
Video 13
Mesoderm migration tracking in RhoaΔmesodermembryo.
3D snapshots of stacks from a T-Cre; mTmG; Rhoa fl/- embryo dissected at E7.25 (Mid Streak stage) and imaged using two-photon microscopy for 100 min showing highlighted cells, which are tracked throughout the time lapse. The video shows the highlighted cells first, then the original images (Membrane GFP, in green) in a looping fashion for comparison. All other cells express membrane dtTomato (grey). Anterior oblique orientation with anterior to the left (scale bar: 50 μm).
Video 14
Mesoderm migration tracking in Rac1Δmesoderm embryo.
3D snapshots of two-photon stack from a T-Cre; mTmG; Rac1 fl/- embryo dissected at E7.25 (Mid Streak stage) and imaged for 80 min showing highlighted cells, which are tracked throughout the time lapse. The video shows the highlighted cells first, then the original images (Membrane GFP, in green) in a looping fashion for comparison. All other cells express membrane dtTomato (grey). Lateral orientation with anterior to the left (scale bar: 50 μm).
Video 15
Mesoderm migration tracking in Rac1Δmesodermembryo.
3D snapshots of confocal stacks from a T-Cre; mTmG; Rac1 fl/- embryo dissected at E6.75 (Early Streak stage) and imaged for 120 min showing highlighted cells, which are tracked throughout the time lapse. The video shows the highlighted cells first, then the original images (Membrane GFP, in green) in a looping fashion for comparison. All other cells express membrane dtTomato (red). Anterior orientation (scale bar: 50 μm).
Tables
Table 1
Tracking details for embryonic and extra-embryonic mesoderm.
Cells were tracked for approximately 150 min. P values were calculated using the Mann–Whitney–Wilcoxon. Data can be found in Figure 2—source data 1.
| Net displacement (μm) | Travel displacement (μm) | Straightness | Mean speed (μm/min) | ||||||
|---|---|---|---|---|---|---|---|---|---|
| Mean | SEM | Mean | SEM | Mean | SEM | Mean | SEM | N | |
| Extra-embryonic | 20.58 | 3.74 | 67.50 | 6.01 | 0.31 | 0.04 | 0.44 | 0.03 | 17 |
| Embryonic | 42.64 | 2.79 | 91.86 | 3.51 | 0.48 | 0.03 | 0.67 | 0.03 | 34 |
| P-value | 7.93E-05 | 5.29E-01 | 1.54E-03 | 1.99E-05 | |||||
Table 2
Cell shape, size, and filopodia comparison between embryonic and extra-embryonic mesoderm.
P values were calculated using the Mann–Whitney–Wilcoxon for surface, long/short axis and filopodia/cell/time point and the t test for volume, and filopodia length. Data can be found in Figure 2—source data 2 and 3.
| Volume (μm3) | Surface (μm2) | Long/short axis | Filopodia/cell | Filopodia length (μm) | ||||||||
|---|---|---|---|---|---|---|---|---|---|---|---|---|
| Mean | SEM | Mean | SEM | Mean | SEM | N | Mean | SEM | Mean | SEM | N | |
| Extra-embryonic | 4253.03 | 234.80 | 2438.82 | 105.59 | 2.17 | 0.09 | 83 | 3.07 | 0.32 | 6.20 | 0.37 | 28 |
| Embryonic | 2002.08 | 81.36 | 1308.63 | 39.14 | 1.66 | 0.05 | 85 | 6.86 | 0.21 | 8.00 | 0.14 | 167 |
| P-value | 2.10E-16 | 5.41E-19 | 3.04E-05 | 3.28E-11 | 5.24E-04 | |||||||
Key resources table
| Reagent type (species) or resource | Designation | Source or reference | Identifiers | Protocol |
|---|---|---|---|---|
| Genetic reagent (Mus musculus) | T-Cre | PMID: 18708576 | RRID:MGI:3811072 | |
| Genetic reagent (Mus musculus) | Sox2-Cre | PMID: 12617844; The Jackson Laboratories | TJL: 008454 | |
| Genetic reagent (Mus musculus) | mTmG | PMID: 17868096; The Jackson Laboratories | TJL: 007676 | |
| Genetic reagent (Mus musculus) | Rac1 conditional mutant | PMID: 14564011 | RRID:MGI:3579087 | |
| Genetic reagent (Mus musculus) | Rhoa conditional mutant | PMID: 21209320 | ||
| Genetic reagent (Mus musculus) | LifeAct-mEGFP | PMID: 22658956 | ||
| Antibody | Goat polyclonal anti-Pecam-1 | R and D systems | AF3628 | IF 1/500 |
| Antibody | Rabbit polyclonal anti-Podocalyxin | EMD Millipore | ABD27 | IF 1/200 |
| Antibody | Rat monoclonal anti-Keratin 8 | Developmental Studies Hybridoma Bank | TROMA-I; AB_531826 | IF 1/100 |
| Antibody | Rabbit monoclonal anti-Vimentin | abcam | ab 92547 | IF 1/200 |
| Antibody | Donkey polyclonal anti rabbit Alexa Fluor 488 | Life technologies | A21206 | IF 1/500 |
| Antibody | Goat polyclonal anti rabbit Alexa Fluor 647 | Life technologies | A21244 | IF 1/500 |
| Antibody | Chicken polyclonal anti rat Alexa Fluor 647 | Life technologies | A21472 | IF 1/500 |
| Antibody | Donkey polyclonal anti goat Alexa Fluor 647 | Jackson | A21447 | IF 1/500 |
| Other | TRITC-Phalloidin | Invitrogen | A12380 | 1/200 |
| Other | DAPI | Sigma | D9542 | 1/1000 |
| Commercial assay or kit | RNAscope | ACDbio | ACDbio: 322350 |
Additional files
-
Transparent reporting form
- https://doi.org/10.7554/eLife.42434.045
Download links
A two-part list of links to download the article, or parts of the article, in various formats.
Downloads (link to download the article as PDF)
Open citations (links to open the citations from this article in various online reference manager services)
Cite this article (links to download the citations from this article in formats compatible with various reference manager tools)
Distinct mesoderm migration phenotypes in extra-embryonic and embryonic regions of the early mouse embryo
eLife 8:e42434.
https://doi.org/10.7554/eLife.42434


