State transitions in the substantia nigra reticulata predict the onset of motor deficits in models of progressive dopamine depletion in mice
- Carnegie Mellon University, United States
- Boston Children’s Hospital and Harvard Medical School, United States
- University of California, Berkeley, United States
- Johns Hopkins University School of Medicine, United States
Figures
Figure 1

SNr pathophysiology at late stages of dopamine depletion is similar between acutely and gradually depleted mice.
(A) Schematic of in vivo recording setup depicting head-restrained mouse on top of a freely moving wheel with a sensor to record wheel movement and a linear silicone probe to record SNr units. (B) Sagittal section showing recording locations, revealed with an immunostain against Iba-1. Scale Bar = 100 µm. (C) Representative examples of single-units in the SNr recorded from control, end-stage acute (A5%), or end-stage gradual conditions (G5%). (D) Box plot of firing rates of all single units recorded in each condition. N’s denote number of single units in each condition. Grey squares indicate medians for individual mice. KW, χ2(2) = 40.463, p < 0.0001, pairwise, **p < 0.005 from Ctl. (E) Box plot of CVISI of all single units recorded in each condition. KW, χ2(2) = 101.830, p < 0.0001, pairwise, **p < 0.005. (F) Proportion of ‘not bursty,’ ‘bursty,’ and ‘highly bursty’ units in each condition (see Materials and methods). Pearson, χ2(4) = 80.591, p < 0.0001, z-test, **p < 0 .005 from Ctl. (G) Representative LFP spectrograms from Ctl, A5%, and G5% with box highlighting β frequency range (13–30 Hz). (H) Mean fractional β power (power in β relative to power 1–100 Hz) at each stage of depletion. Grey squares indicate animal means. ANOVA, p = 0.076. (I) Example cross-correlogram showing synchronous spiking between a pair of simultaneously recorded SNr units. Horizontal dotted line is 99% confidence interval. (J) Proportion of synchronous pairs in each condition (calculated as a percentage of total pairs); grey squares indicate proportion of synchronous pairs calculated per animal. ANOVA, F(2) = 3.992, p = 0.035, Dunnett, *p < 0.05 from Ctl. (K) Top: Classifier trained to predict the probability that a neuron belongs to A5%, G5% groups using: FR, firing rate; IR, irregularity; B, percent spikes in bursts; synchrony and all pair-wise multiplicative interactions (‘ETC.’). Bottom: predicted probabilities of A5% and G5% group membership were summed across neurons from each held-out mouse (jack-knife), and thresholded using a Winner-Take-All criterion (WTA). See: Materials and methods. (L) Mean cross-validated accuracy of predicting which depletion model led to endstage in each mouse (500 permutations; ± CI95). Right-tail t-test vs. chance, 50%, p = 0.3842, n = 16 mice. Grey squares indicate mean prediction for each mouse. Inset text indicates mice predicted >chance/ total mice. (M) Same as J but predicting A5% and G5% combined (5%) vs Ctl. Right-tail t-test vs. chance, 50%, p = 7.87×10⁻⁶, n = 23 mice. (N) Coefficients from average model in M describing successful 5% vs. Ctl discrimination. Significance by CI95. *p < 0.05, **p < 0.01, ***p < 0.001.
Figure 2
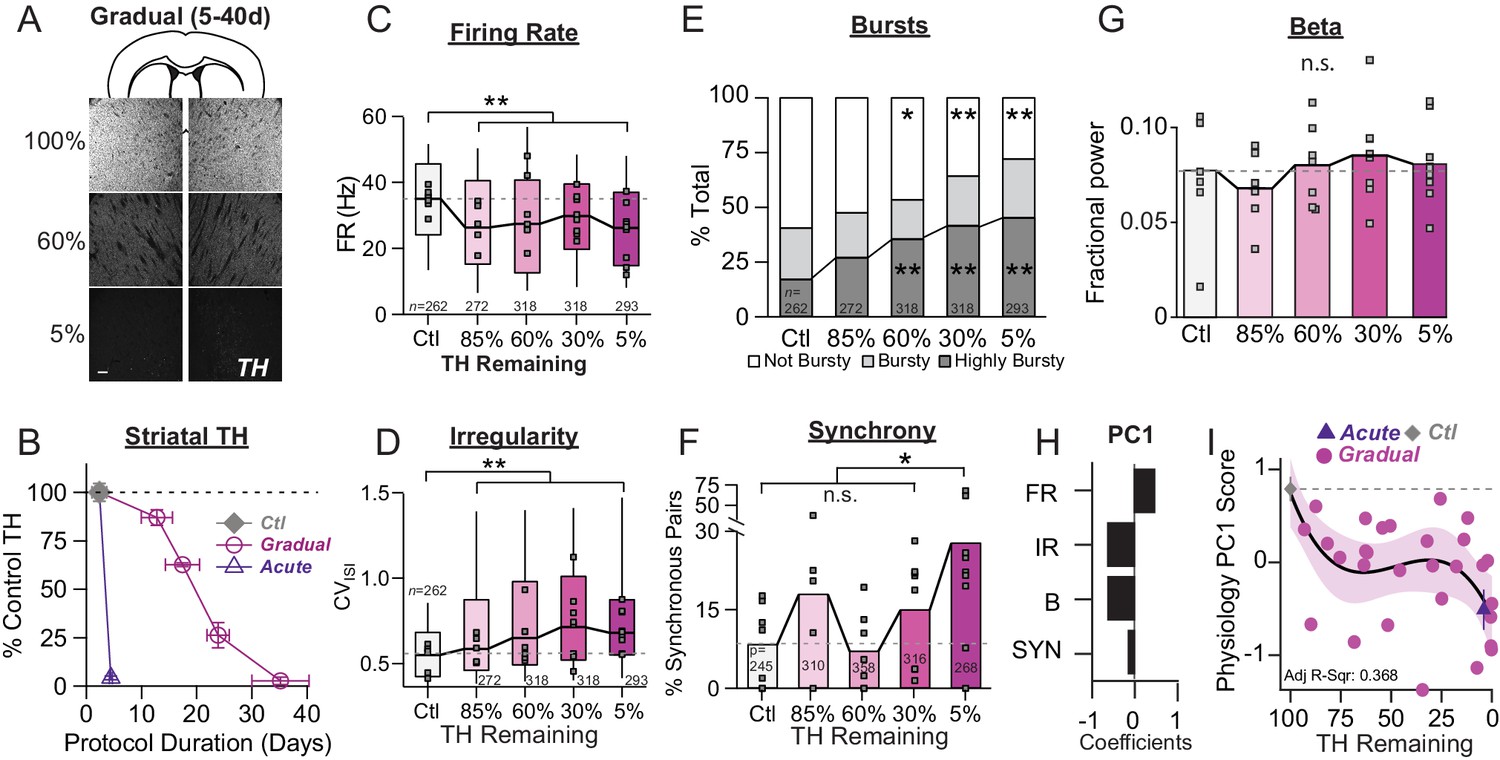
Onset and progression of SNr pathophysiology during gradual dopamine depletion with 6-OHDA.
(A) Coronal sections showing representative images of TH immunoreactivity (TH-IR) in the dorsal striatum of mice treated with saline or bilateral injections of 6-OHDA (‘60%’ after three injections or ‘5%' after six injections). Scale Bar = 100 µm. (B) Graph showing the trajectory of dopamine depletion induced by 6-OHDA infusions in acutely vs. gradually depleted mice. Percent TH remaining (relative to saline controls) is graphed as a function of protocol duration, measured from the day of first 6-OHDA infusion to day of sacrifice following in vivo recordings. (C) Box plot of firing rates of all neurons recorded at each stage of depletion. Grey squares indicate animal medians. KW, χ2(4) = 41.846, p < 0.0001, pairwise, **p < 0.005 from Ctl. (D) Box plot of CVISI recorded for all neurons at each stage of depletion. Grey squares indicate animal medians. KW, χ2(4) = 72.039, p < 0.0001, pairwise, **p < 0.005 from Ctl. (E) Proportion of ‘not bursty,’ ‘bursty,’ and ‘highly bursty’ units at each stage of depletion. Pearson, χ2(8) = 78.856, p < 0.0001, z-test, *p < 0.05 and **p < 0.005 from Ctl. (F) Proportion of synchronous pairs at each stage of depletion (calculated as a percentage of total pairs sampled at that stage); grey squares indicate proportion of synchronous pairs for each mouse. ANOVA, F(4) = 2.753, p = 0.045, Dunnett, *p < 0.05 from Ctl. (G) Mean fractional β power (power in β relative to power 1–100 Hz) at each stage of depletion. Grey squares indicate animal means. ANOVA, p = 0.7557. (H) 1stprincipal component coefficients from PCA performed on Ctl, Gradual and Acute single unit physiology: FR, unit firing rate; IR, unit irregularity (CVISI); B, unit percent spikes in bursts; SYN, percent synchronous pairs per mouse (see Materials and methods). (I) Mean animal physiology PC1 scores as a function of dopamine loss with model fit to Ctl and Gradual animals. Shaded region indicates CI95 of fit (see Materials and methods); Avg ± SEM for Ctl and Acute indicated.
Figure 3
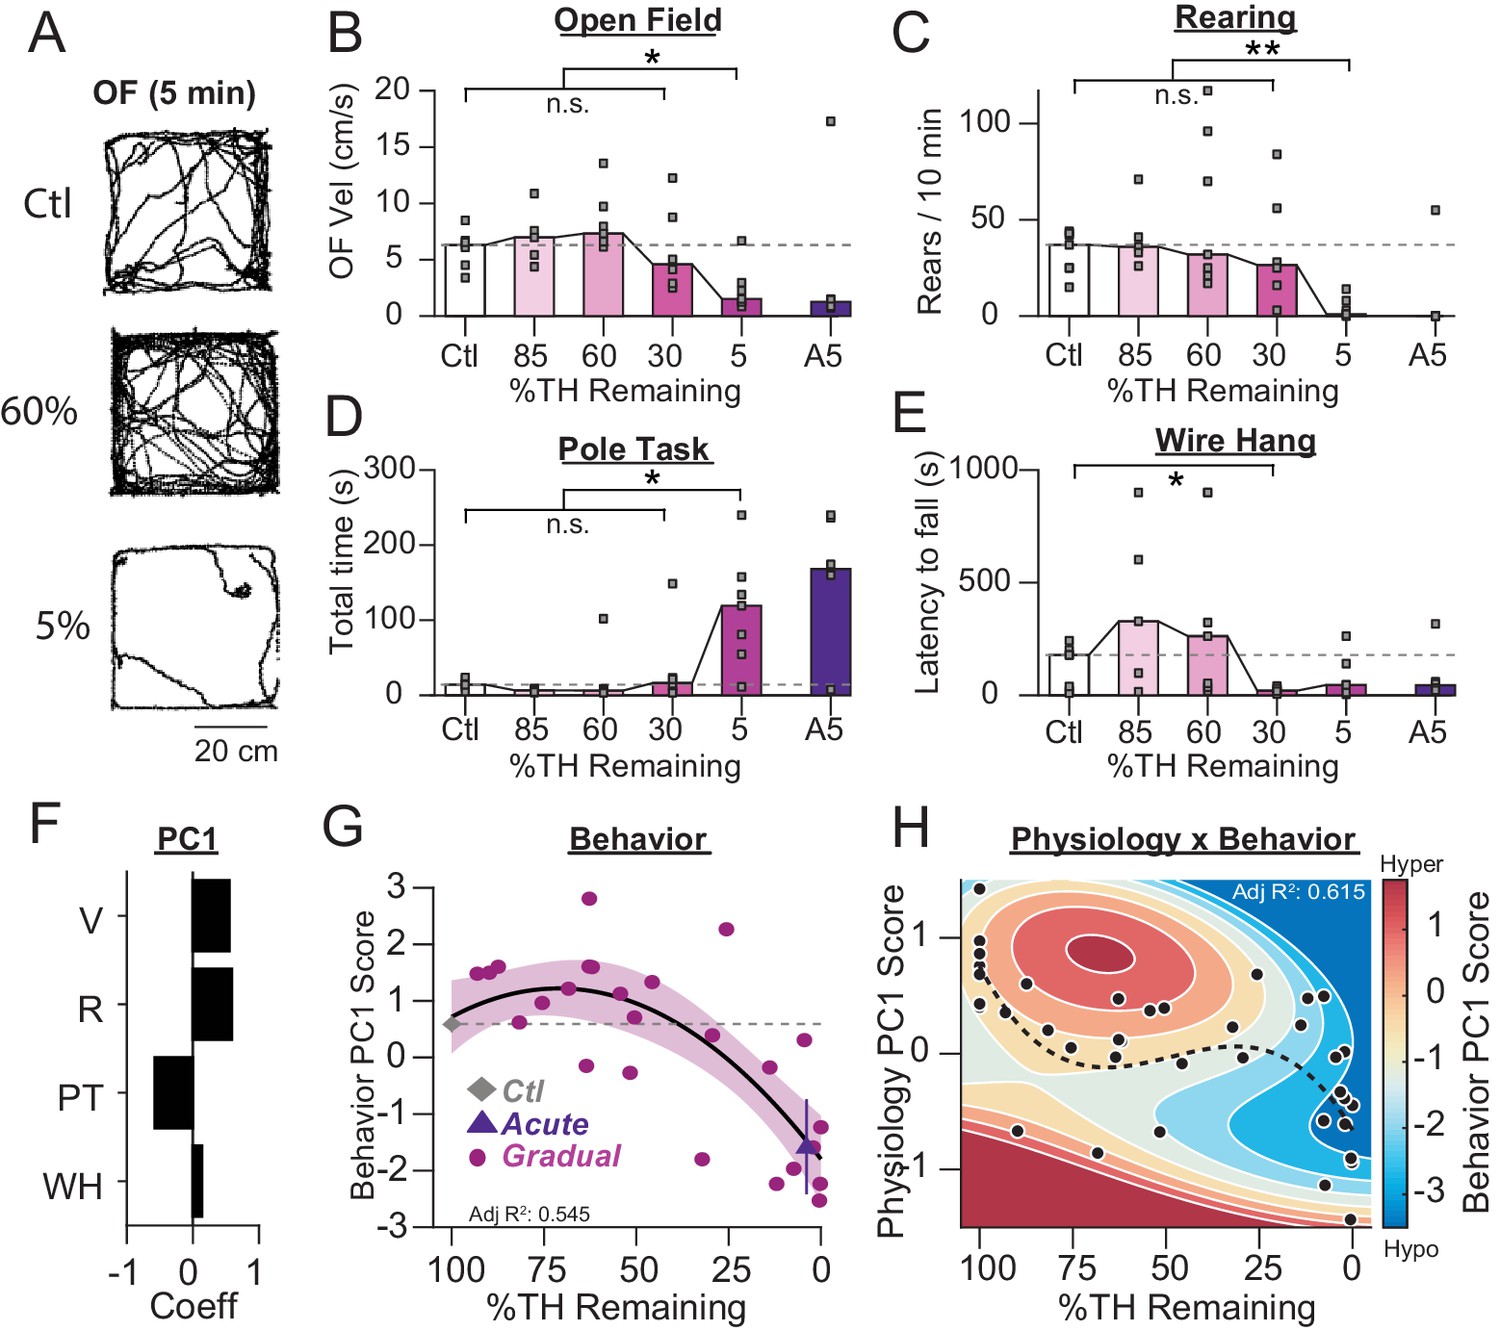
Motor deficits emerge at late stages of dopamine loss in 6-OHDA-treated mice.
(A) Example raw open field movement traces from a Ctl, Gradual 60% and Gradual 5% mouse in a 5 min period. (B) Mouse open field velocity across depletion conditions. KW, χ2(4) = 14.013, p = 0.007, pairwise, *p < 0.05 from Ctl. (C) Rears per 10 min, across conditions. KW, χ2(4) = 15.839, p = 0.003, pairwise, **p < 0.005 from Ctl. (D) Total time completing a pole task. KW, χ2(4) = 14.796, p = 0.005, pairwise, *p < 0.05 from Ctl. (E) Wire hang duration across conditions. KW, χ2(4) = 9.666, p = 0.046. (F) 1stprincipal component coefficients for behavioral metrics. V, velocity; R, rearing; PT, pole task; WH, wire hang. (G) Mean animal behavior PC1 scores as a function of dopamine loss with model fit to Ctl and Gradual animals. Shaded region indicates CI95 of fit (see Materials and methods). Average values (±SEM) from Ctl (grey diamond) and acutely depleted mice (purple triangle) are overlaid for reference. (H) 2D polynomial fit showing mouse behavior as a function of SNr pathophysiology and dopamine loss (n = 43 mice). Dashed line, physiology PC1 fit to Ctl, Gradual, and Acute mice. Adj. R2 = 0.415.
Figure 4
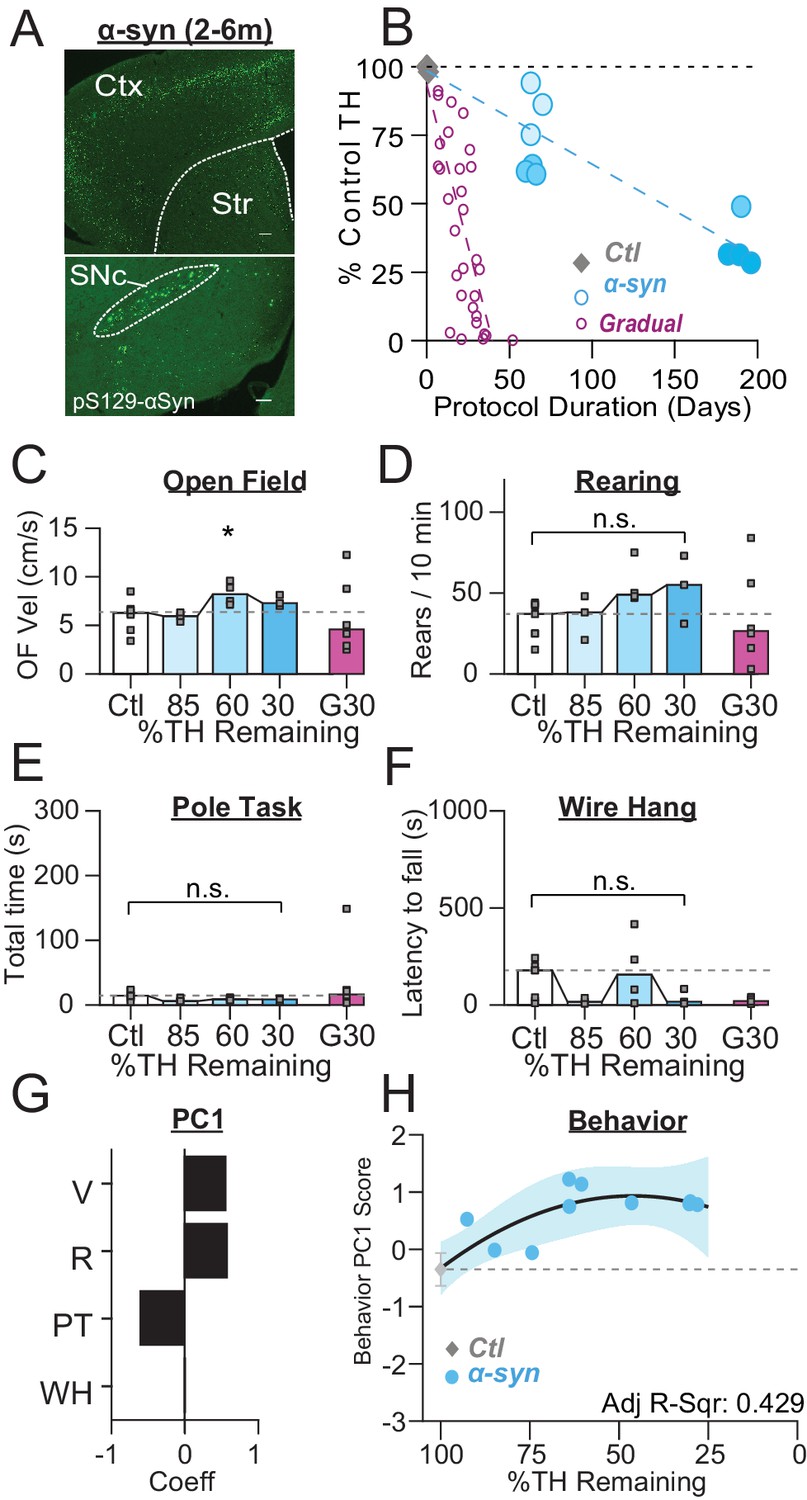
PFF α-Syn induces gradual dopamine depletion but fails to reach end stage.
(A) Representative images of α-Syn inclusions present in the cortex (Ctx), striatum (Str), and substantia nigra pars compacta (SNc). Scale Bars = 100 µm (top), 200 µm (bottom). (B) Graph showing the trajectory of dopamine depletion induced by PFF α-syn (data from 6-OHDA-treated mice is replotted for reference). Percent TH remaining (relative to saline controls) is graphed as a function of protocol duration, measured from PFF α-syn infusion to day of sacrifice following in vivo recordings. (C) Mouse open field velocity across depletion conditions. ANOVA, F(3) = 3.482, p = 0.047, Dunnett, *p < 0.05 from Ctl. (D) Rears per 10 min, across conditions. KW, χ2(3) = 7.540, p = 0.057. (E) Total time completing a pole task. KW, χ2(3) = 5.421, p = 0.143. (F) Wire hang duration across conditions. ANOVA, F(3) = 1.754, p = 0.205. (G) 1stprincipal component coefficients for behavioral metrics. V, velocity; R, rearing; PT, pole task; WH, wire hang. (H) Mean animal behavior PC1 scores as a function of dopamine loss with model fit to Ctl and α-Syn animals. Shaded region indicates CI95 of fit.
Figure 5

Onset and progression of SNr pathophysiology during gradual dopamine depletion in PFF α-Syn Mice.
(A) Box plot of firing rates of all single units recorded at each stage of depletion. Grey squares indicate animal medians. KW, χ2(4) = 53.274, p < 0.0001, pairwise, **p < 0.005 from Ctl. Throughout the figure, data from G30% condition are re-plotted for reference. (B) Box plot of CVISI of all single units recorded at each stage of depletion. Grey squares indicate animal medians. KW, χ2(4) = 83.119, p < 0.0001, pairwise, **p < 0.005 from Ctl and 85%. (C) Proportion of ‘not bursty,’ ‘bursty,’ and ‘highly bursty’ units at each stage of depletion. Pearson, χ2(8) = 77.286, p < 0.0001, z-test, *p < 0.05 and **p < 0.005 from Ctl. (D) Proportion of synchronous pairs at each stage of depletion (calculated as a percentage of total pairs sampled at that stage); grey squares indicate proportion of synchronous pairs for each mouse. ANOVA, F(4) = 0.491, p = 0.742. (E) Mean fractional β power (power in β relative to power 1–100 Hz) at each stage of depletion. Grey squares indicate animal means. ANOVA, p = 0.8564. (F) 1stprincipal component coefficients from PCA performed on Ctl and α-Syn single unit physiology: FR, firing rate; IR, irregularity; B, bursting; SYN, synchrony (see Materials and methods). (G) Mean animal physiology PC1 scores as a function of dopamine loss with model fit to Ctl and α-Syn animals. Shaded region indicates CI95 of fit (see Materials and methods); Avg ± SEM for Ctl also shown.
Figure 6
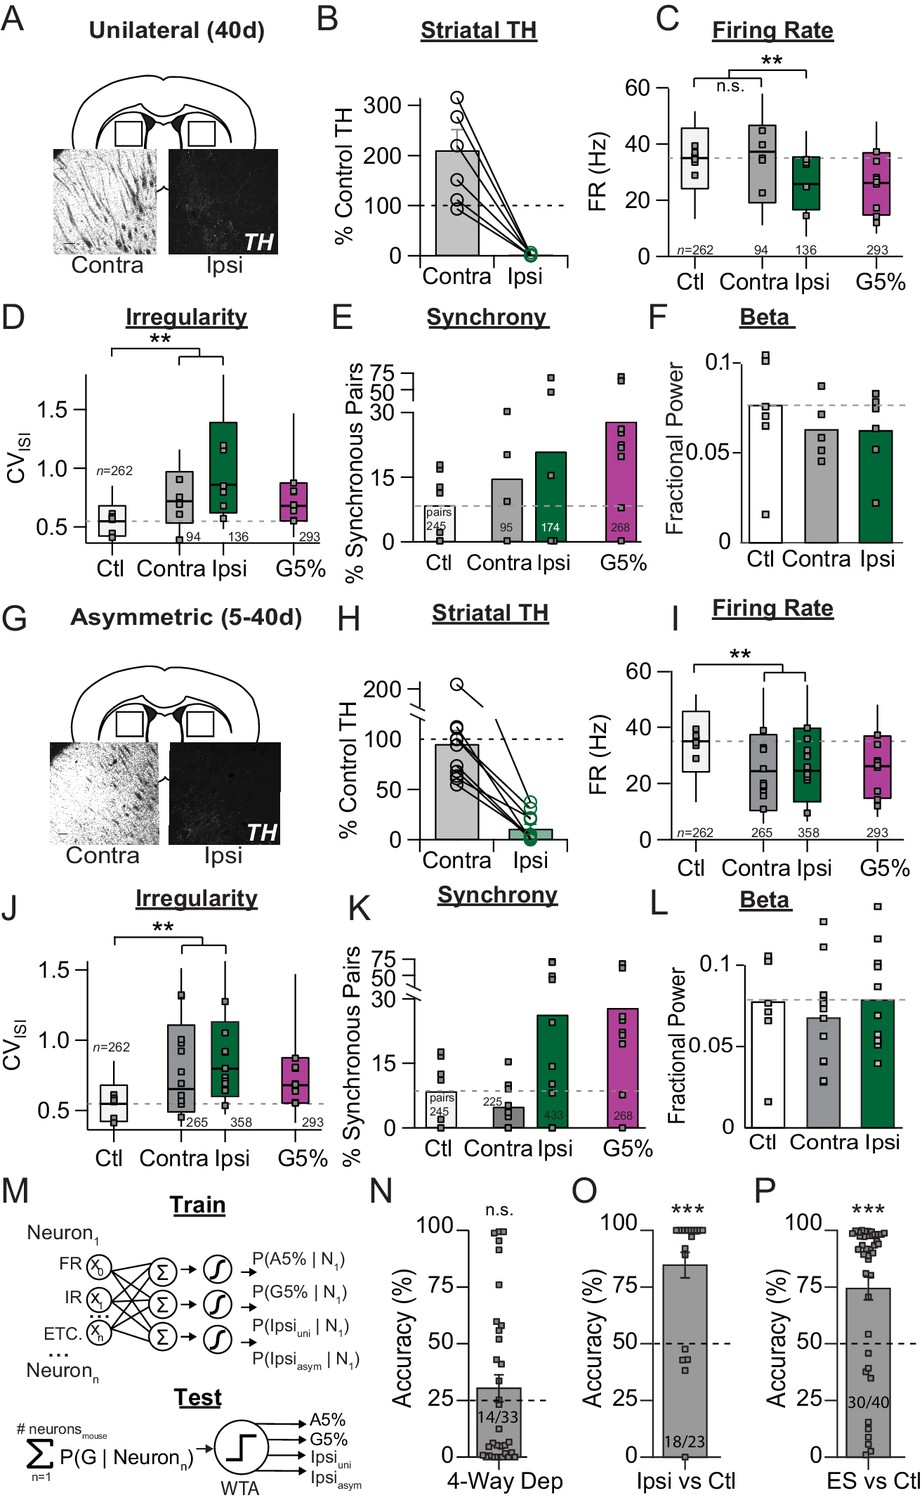
Unilateral 6-OHDA model pathophysiology aligns to prodromal and end-stage bilateral pathophysiology.
(A) Example coronal sections showing TH-IR in the dorsal striatum of unilaterally depleted mice. Scale bar, 100 µm. (B) Quantification of the percent TH remaining (relative to control) in the ipsilateral (‘Ipsi’) and contralateral (‘Contra’) hemispheres of unilaterally depleted mice. (C) Box plots of firing rates from all neurons recorded in the ipsi and contra hemispheres. Grey squares indicate animal medians. KW, χ2(3) = 5.488, p < 0.0001, pairwise, **p < from Ctl. (D) Box plots of CVISI from all neurons recorded in the ipsi or contra hemispheres. Grey squares indicate animal medians. KW, χ2(3) = 110.685, p < 0.0001, pairwise, **p < 0.005 from Ctl. (E) Proportion of synchronous pairs in ipsi or contra hemispheres (calculated as a percentage of total pairs sampled in each hemisphere); grey squares indicate proportion of synchronous pairs for each mouse. ANOVA, F(3) = 1.297, p = 0.300. (F) Mean fractional β power (power in β relative to power 1–100 Hz) at each stage of depletion. Grey squares indicate animal means. ANOVA, p = 0.4997. (G-L). Same as A-F but for asymmetrically depleted mice. I: KW, χ2(3) = 55.317, p < 0.0001, pairwise, **p < 0.005 from Ctl. J: KW, χ2(3) = 119.892, p < 0.0001, pairwise, **p < 0.005 from Ctl. K. KW, χ2(3) = 8.782, p = 0.032, *p < 0.05 from Ctl. L. ANOVA, p = 0.6660. (M) Top: Classifier trained to predict the probability that a neuron belongs to G5%, A5%, Ipsiuni, Ipsiasym groups using: FR, firing rate; IR, irregularity; bursting, synchrony, and all pair-wise multiplicative interactions (‘ETC.’). Bottom: predicted probabilities of group membership were summed across neurons from each held-out mouse (jack-knife), and thresholded using Winner-Take-All criterion (WTA). See: Materials and methods. (N) Average held-out mouse classification performance for G5%, A5%, Ipsiuni and Ipsiasym mice (‘4-way class’) using single unit physiology. Right-tail t-test vs. chance (25%), p = 0.1986, n = 33 mice. Grey squares indicate classification accuracy of individual held out mice. Inset text indicates mice predicted >chance/ total mice. (O) Same as M but for classifying Ctl from combined Ipsiuni and Ipsiasym mice (‘Ipsi’). Right-tail t-test vs. chance (50%), p = 3.59 × 10⁻⁶, n = 23 mice, ***p < 0.001. (P) Same as M but for classifying Ctl from all end-stage mice combined (‘ES’ = Ipsiuni, Ipsiasym, G5%, A5%). Right-tail t-test vs. chance (50%), p = 2.44 × 10⁻⁵, n = 40 mice, ***p < 0.001.
Figure 7 with 1 supplement
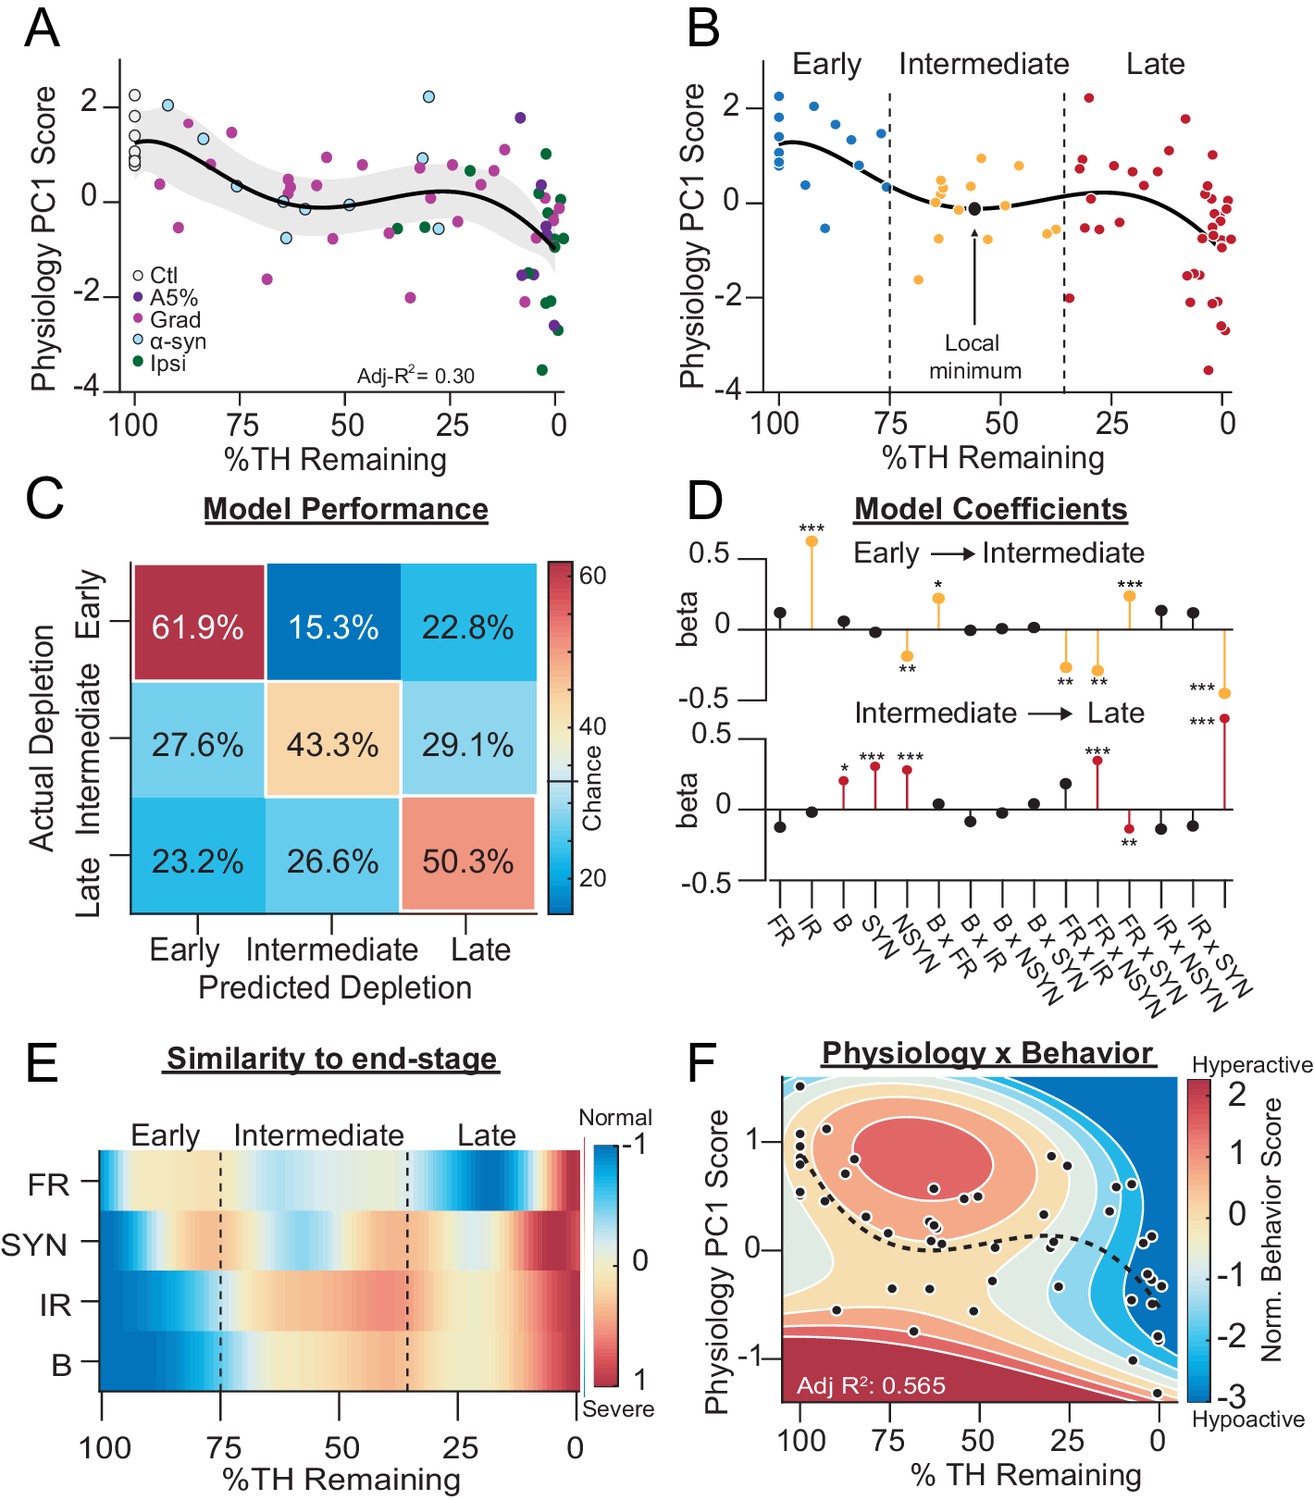
SNr exhibits distinct physiological states during progressive dopamine loss that are stereotyped across models.
(A) Mean animal physiology PC1 scores as a function of dopamine loss with model fit to Ctl, Grad, PFF α-Syn, bilateral acute, Ipsiasym, and Ipsiuni mice. Shaded region indicates CI95 of fit (see Materials and methods; n = 68 mice). (B) Data from A with Early, Intermediate and Late dopamine groups defined around the local minimum at 55 %TH Remaining (±20%). (C) Confusion matrix of total cross-validated accuracy classifying mice into Early, Intermediate and Late dopamine groups using a multinomial regression (500 permutations, see: Materials and methods). Frequency of correct depletion severity predictions is highlighted along diagonal (chance = 33%). (D) Top: Average model coefficients for classifying Intermediate dopamine depletion relative to Early. Bottom: Average model coefficients for classifying Late dopamine depletion relative to Intermediate. (E) Instantaneous similarity of physiological parameters to end-stage via cross-correlation (n = 70 mice). FR, firing rate; SYN, percentage synchronous pairs per mouse; IR, irregularity (CVISI); B, percent spikes in bursts. (F) 2D polynomial fit showing mouse behavior as a function of SNr pathophysiology and dopamine loss in all bilateral conditions (n = 53 mice, Adj. R2 = 0.565). Dashed line, physiology PC1 fit to all bilateral mice. Adj. R2 = 0.27. See also: Figure 7—figure supplement 1.
Figure 7—figure supplement 1
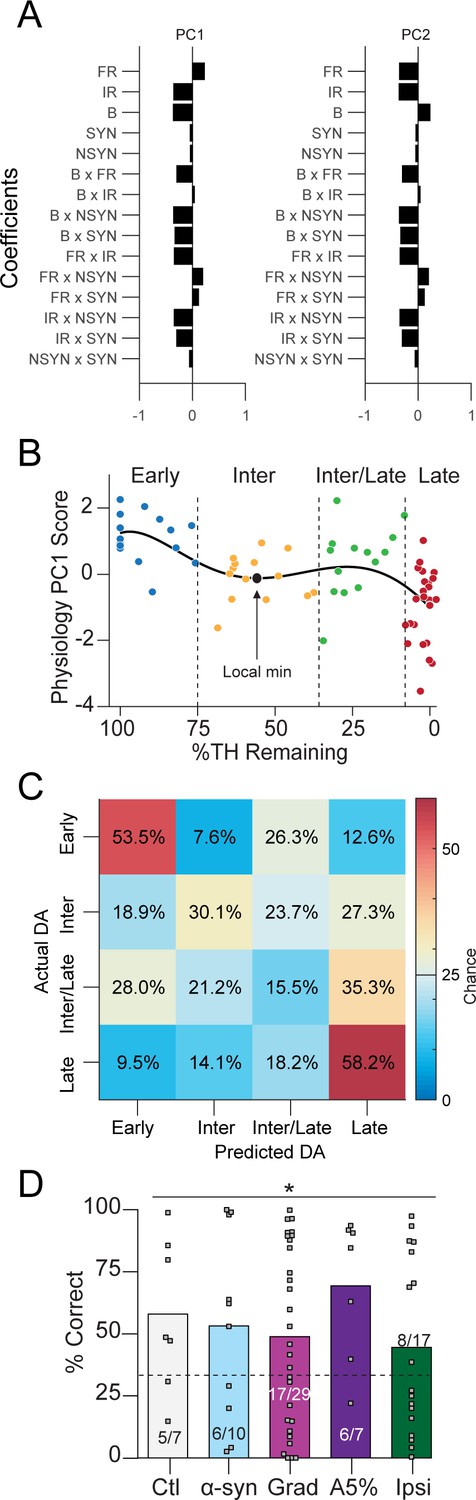
Additional material corresponding to Figure 7.
(A) PCA coefficients for analysis run on all depletion models: Ctl, Grad, PFF α-Syn, bilateral acute, Ipsiasym, and Ipsiuni mice. PC1 explained 42% of variability; PC2 explained 21.6%. (B) Data from Figure 7A broken into four dopamine groups: Early (100–75%), Intermediate (‘Inter,’ 75–35%), Intermediate/Late (‘Inter/Late,’ 35–10%) and Late (10–0%). (C) Confusion matrix of total cross-validated accuracy classifying mice into Early, Intermediate, Intermediate/Late and Late dopamine depletion groups using a multinomial model (500 permutations, see: Materials and methods). Early, Intermediate, and Late mice were correctly classified above chance while Intermediate/Late mice were often confused as belonging to the ‘Late’ dopamine group (35.3% of the time, chance = 25%). (D) 3-group classification accuracy from Figure 7C separated instead by depletion model (chance = 33.3%, Pearson χ2 = 11.3, p = 0.0237). Grey squares indicate classification accuracy of each held out mouse. Inset text indicates mice predicted >chance/ total mice.
Tables
Key resources table
| Reagent type (species) or resource | Designation | Source or reference | Identifiers | Additional information |
|---|---|---|---|---|
| Strain, strain background (Mus musculus)(M and F) | C57BL/6J mouse | Jackson Laboratory | stock_number:000664; RRID:IMSR_JAX:000664 | Note: now bred in-house |
| Chemical compound, drug | 6-hydroxydopamine hydrobromide, 6-OHDA | Sigma Aldrich | stock_number:H116-5MG | (0.75 μg/ hemisphere gradual; 5 μg/hemisphere - acute, unilateral) |
| Chemical compound, drug | 6-hydroxydopamine hydrobromide, 6-OHDA | Tocris | stock_number:2547 CAS 636-00-0 | (5 μg/hemisphere - acute, unilateral) |
| Antibody | Anti-Tyrosine Hydroxylase, anti-TH rabbit | Pel-Freez Biologicals | RRID:AB_2617184; catalog_number:P40101-150; | (1:1000 diluted with glycerol) |
| Antibody | Alexa Fluor 647–conjugated donkey anti-rabbit | Life Technologies | RRID:AB_2536183; catalog_number:A-31573; | (1:500) |
| Antibody | anti-Iba-1 rabbit | Wako | RRID: AB_839504; catalog_number:019–19741; lot_number: WDJ3047 | (1:1000) |
| Antibody | Rabbit Anti-Human alpha Synuclein, phospho (Ser129) Monoclonal; Unconjugated, Clone EP1536Y | AbCam | RRID:AB_869973; stock_number:ab51253 | (1:100) |
| Antibody | Alexa Fluor 488 donkey anti-rabbit | Life technologies | RRID:AB_2535792; catalog_number:A-21206; | (1:500) |
| Software, algorithm | SPSS Statistics | IBM | version:24 | |
| Software, algorithm | MATLAB | Mathworks | version:2018a | |
| Recombinant DNA reagent | recombinant a-syn | DOI:10.1126/science. aah3374 | (6 μg/hemisphere) | |
| Software, algorithm | EthoVision XT 9.0 software | Noldus | RRID:SCR_000441 |
Additional files
-
Transparent reporting form
- https://doi.org/10.7554/eLife.42746.010
Download links
A two-part list of links to download the article, or parts of the article, in various formats.
Downloads (link to download the article as PDF)
Open citations (links to open the citations from this article in various online reference manager services)
Cite this article (links to download the citations from this article in formats compatible with various reference manager tools)
State transitions in the substantia nigra reticulata predict the onset of motor deficits in models of progressive dopamine depletion in mice
eLife 8:e42746.
https://doi.org/10.7554/eLife.42746


