A multiplexed DNA FISH strategy for assessing genome architecture in Caenorhabditis elegans
- University of Wisconsin-Madison, United States
- Harvard Medical School, United States
Figures
Figure 1 with 1 supplement
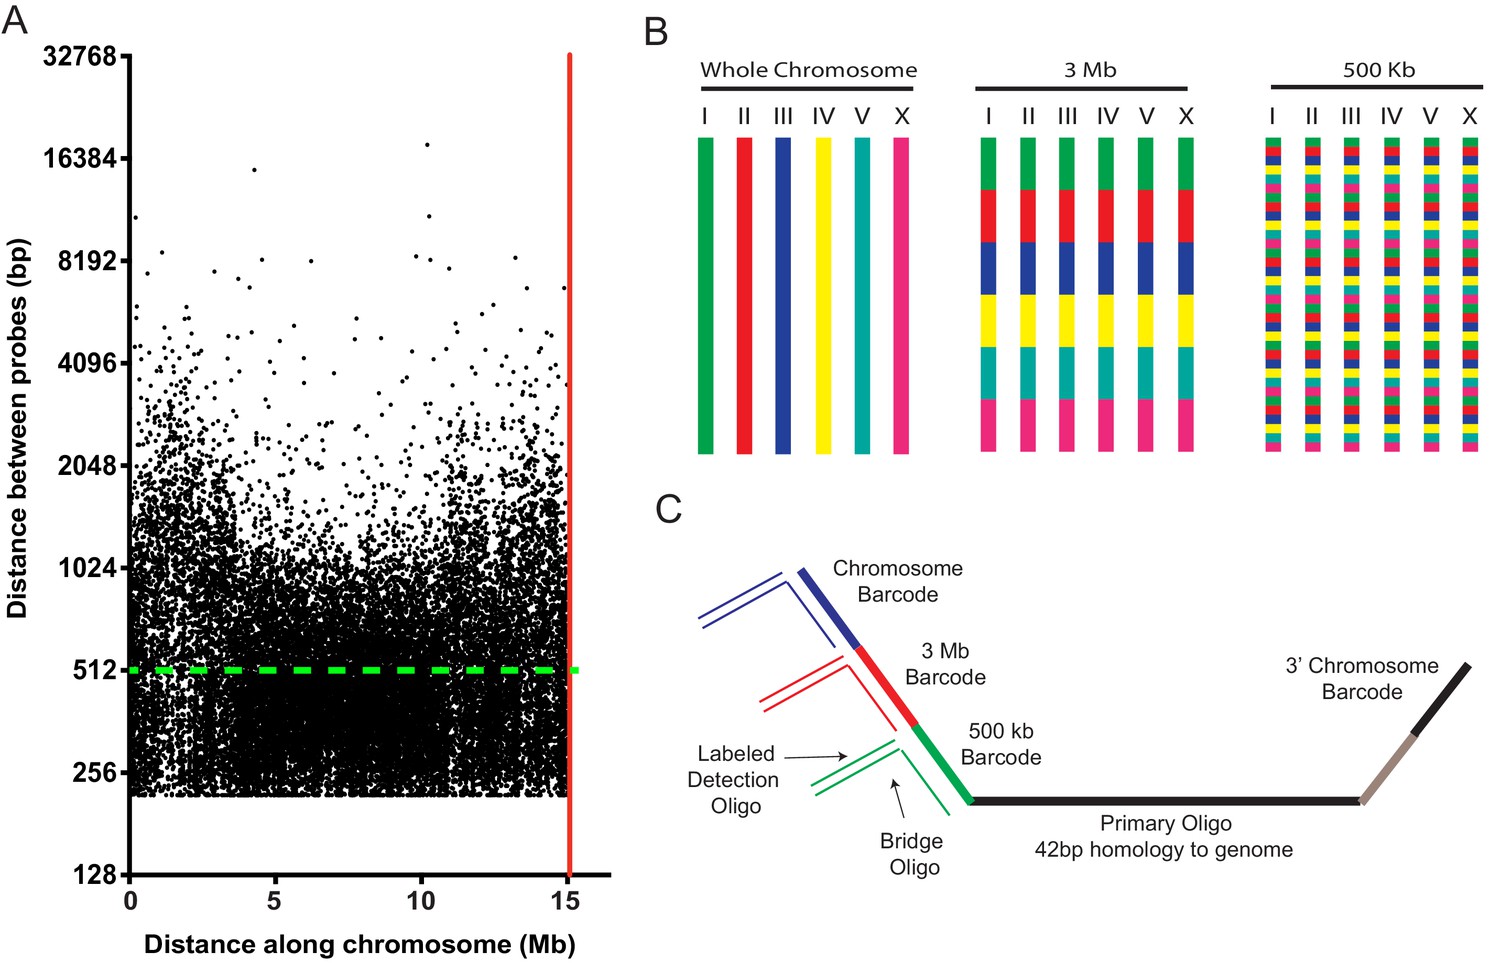
A highly multiplexed oligo library for C. elegans Oligopaint.
(A) The distribution of Oligopaint probes across chromosome I is shown. Green dashed line indicates the two probe/kb average. Red line indicates the end of the chromosome. Probe distribution is similar for other chromosomes (see Table 1 and Figure 1—figure supplement 1). (B) Oligopaint library allows primary oligos, which are specific to any chromosome, 3 Mb, or 500 Kb region within any chromosome, to be specifically amplified. Primary probes are PCR amplified from Oligopaint library and produced as described in Materials and methods. Bridge and detection probes allow the indicated chromosomal regions to be visualized. (C) Primary probes consist of barcode sequences appended to 42 bp sequences that hybridize uniquely to the C. elegans genome. Total length of each oligo is 150 bp. Barcode sequences allow each primary probe to be amplified as part of a pool of primary probes that target a chromosome (chromosome barcode), 3 Mb subsection of chromosome (3 Mb barcode), or 500 kb subsection of chromosome (500 kb barcode). Bridge oligos and Detection oligos (arrows) are used to recognize and illuminate primary probes. Note: primary oligos contain an additional barcode not used in this work (brown). The barcode is specific to each 500 kb segment and could be used to increase detection efficiencies of 500 kb DNA FISH by allowing an addition detection oligo to be incorporated during the detection phase of DNA FISH.
Figure 1—figure supplement 1
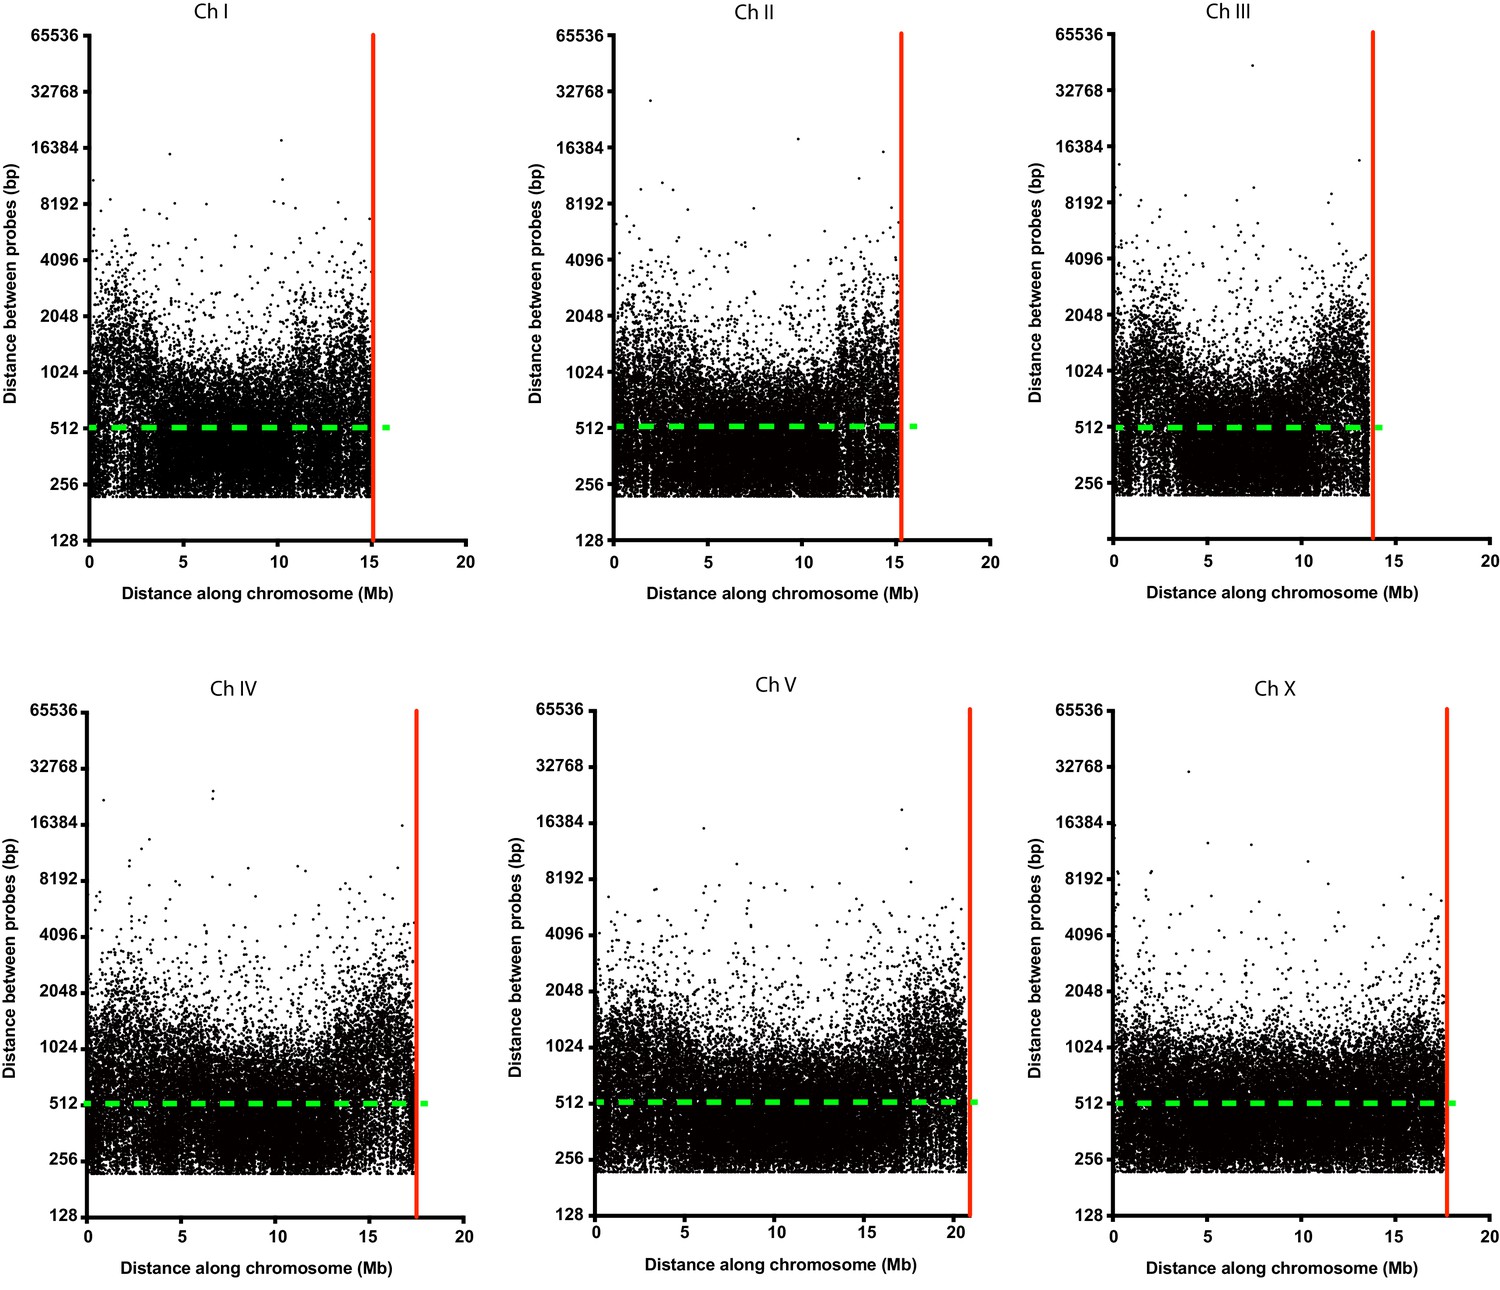
Oligopaint probe distribution along all six C. elegans chromosomes.
Distance between each individual probe (black dots) along the entire length of each chromosome. Green dashed line indicates the two probe/kb average mark. The red line indicates the end of each chromosome.
Figure 2 with 2 supplements
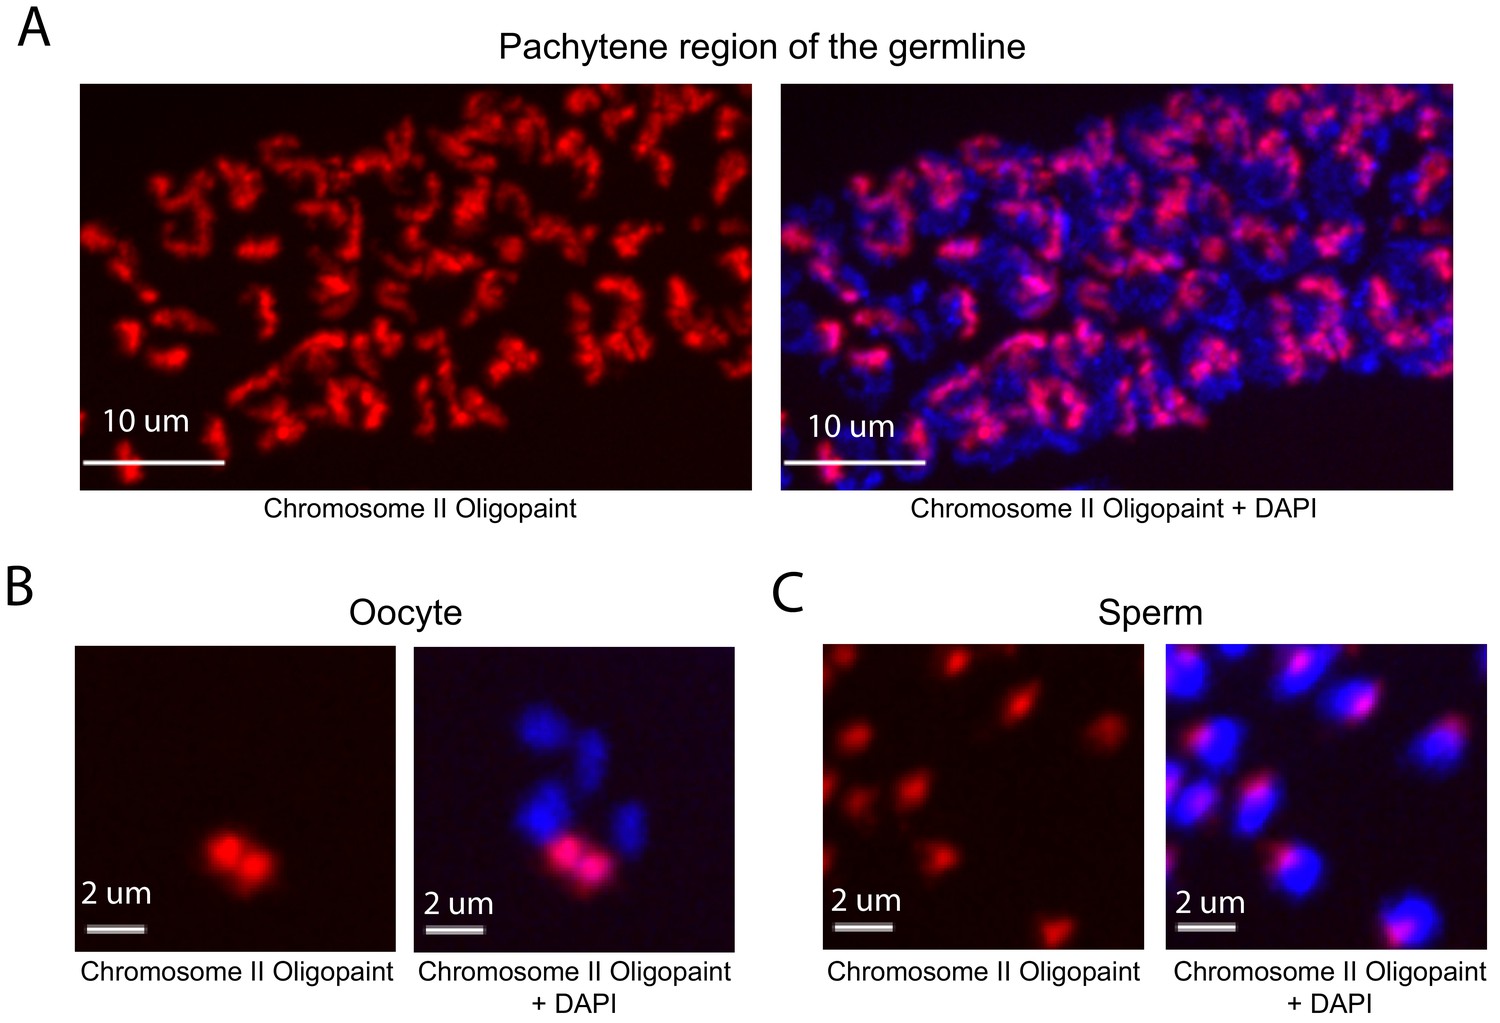
Whole chromosome Oligopaint in C. elegans is specific.
(A–C) Adult C. elegans were fixed as described in Materials and methods. Fixed animals were subjected to three step hybridization to detect Chromosome 2 (red). Animals were co-stained with DAPI (blue). (A) 3D maximum projection of the pachytene region of an adult C. elegans germline is shown. (B) 3D maximum projection of an oocyte. A single bivalent is stained with chromosome II Oligopaints. (C) 3D maximum projection of sperm. Scale bars for images are indicated. All images are representative of at least three independent animals.
Figure 2—figure supplement 1
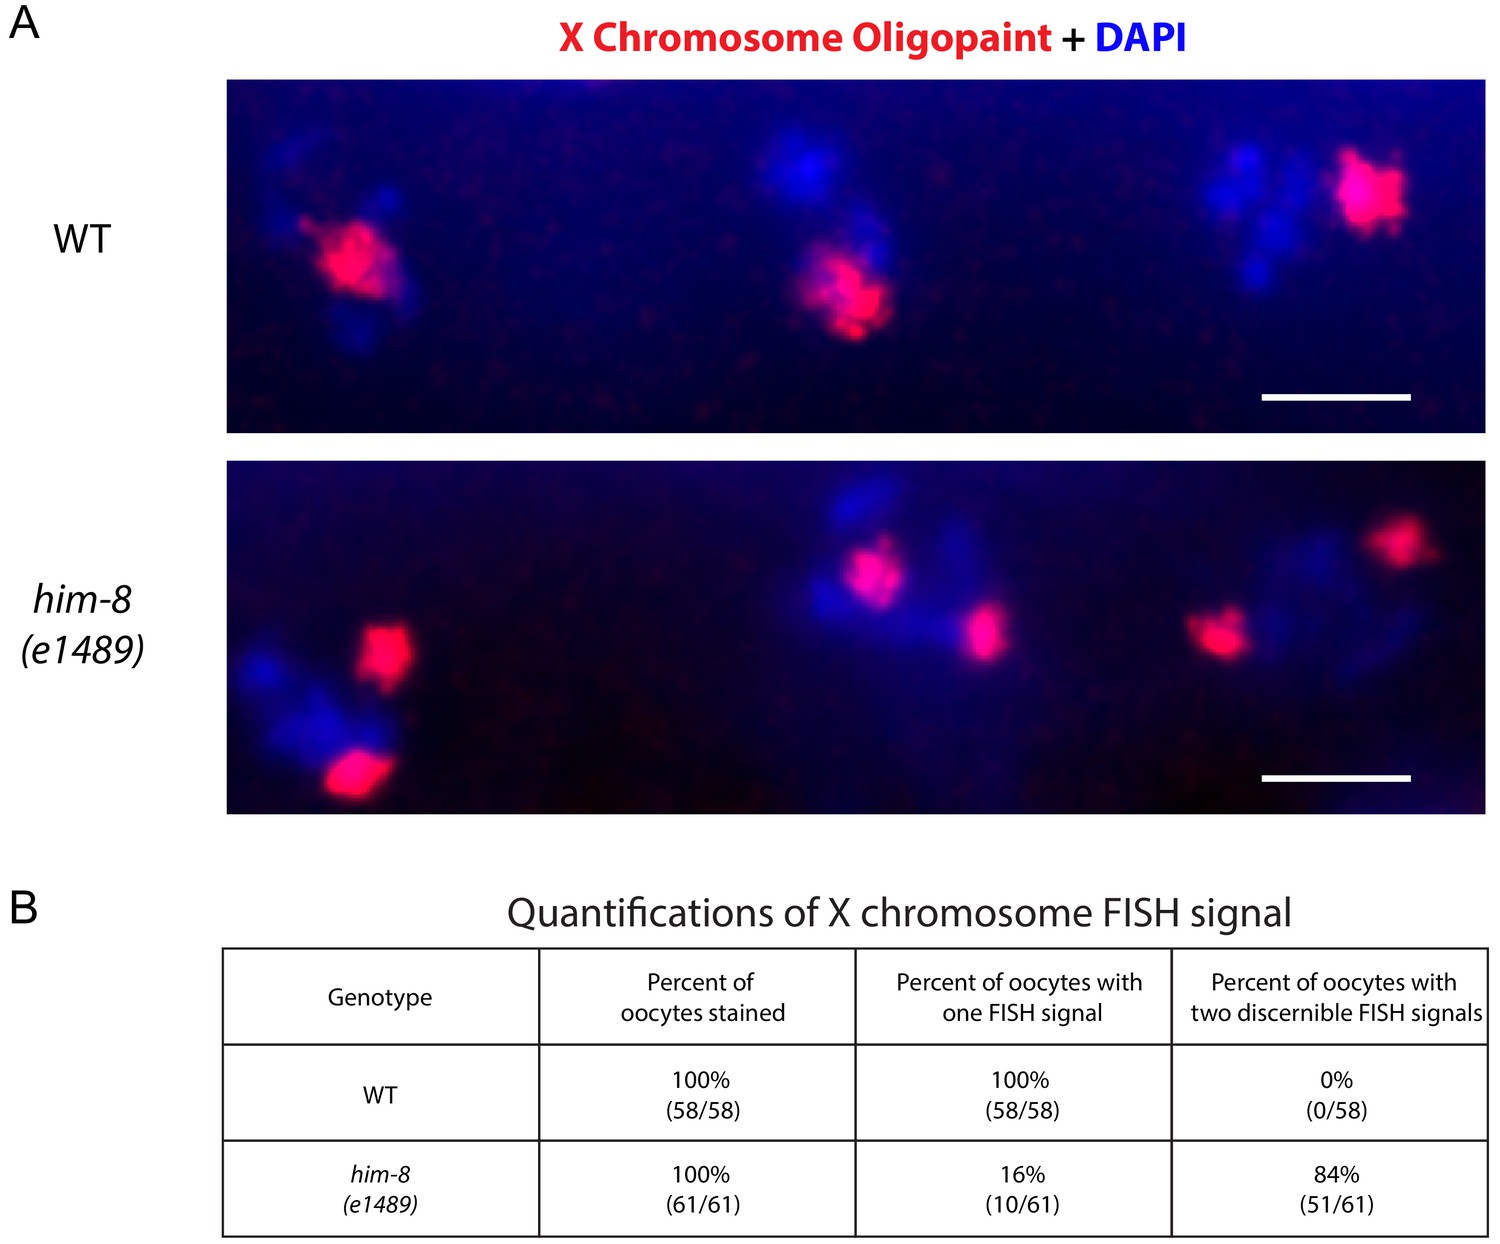
X chromosome Oligopaint on him-8 (e1489) mutant animals.
(A) X chromosome Oligopaint (red) and DAPI (blue) visualized in three C. elegans oocytes from wild type (top) and him-8 (e1489) bottom. Note the presence of two DNA FISH signals in the him-8 (e1489) mutant animals compared to a signal DNA FISH signal observed in wild-type animals. (B) Quantifications of X chromosome Oligopaint signals in wild type and him-8 (e1489) mutant animals. All images are representative of at least three independent animals.
Figure 2—figure supplement 2

Oligopaints stain chromosomes in all/most somatic cells and in all/most developmental stages of C. elegans.
Mixed stage samples of C. elegans were subjected to three-step hybridization to detect Chromosome II as described in Materials and methods. Chromosome II staining is shown in red. Animals were co-stained with DAPI (blue). Scale bars are indicated. (A) Intestinal nuclei, (B) hypodermal nuclei, (C) ventral cord neurons, (D) ~ 100 cell embryo, and (E) larval stage one animal. All images are representative of at least three independent animals.
Figure 3 with 2 supplements
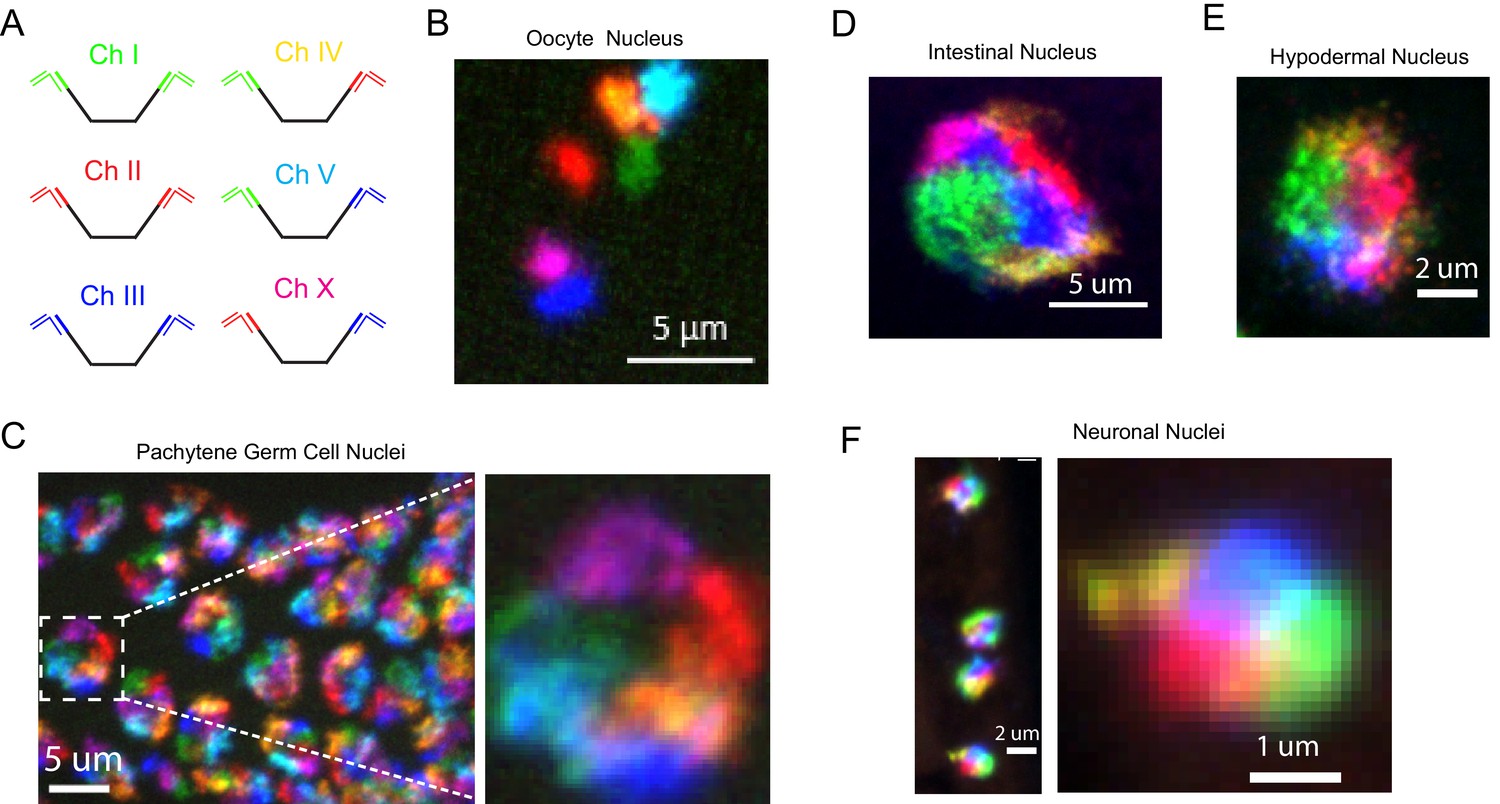
Simultaneous visualization of all six C. elegans chromosomes.
(A) Strategy to detect six chromosomes is shown. Detection probes labeled with Alexa488 (Green), Cy3 (Red), and Alexa647 (Blue), or combinations of these three fluorophores were used to label each of the six C. elegans chromosomes a different color. (B–F) Adult C. elegans were fixed and subjected to three step hybridization to detect Chromosomes 1, 2, 3, 4, 5, and X. (B) 3D maximum projection of an oocyte. Each bivalent is labeled a different color. (C) 3D maximum projection of the pachytene region of an adult germline. A magnification of one of these nuclei is shown to the right. (D) 3D maximum projections of an intestinal nucleus, (E) hypodermal nucleus, and (F) nuclei whose size and position within the animal suggest the cell is a ventral cord neuron. All images are representative of at least three independent animals.
Figure 3—figure supplement 1
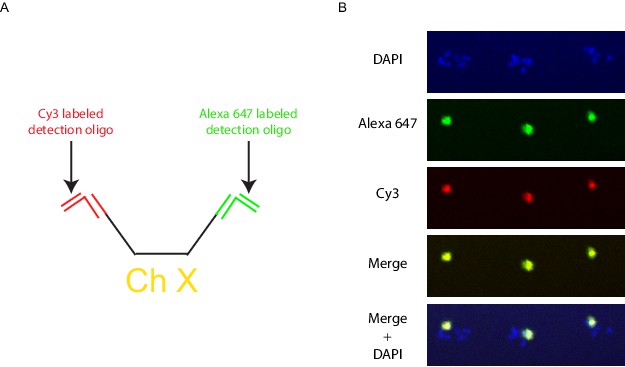
Multicolor labeling of the X chromosome to expand the number of detectable objects.
(A) Schematic diagram of a multicolor labeling strategy. Different bridge and detection oligos are targeted to the 5’ and 3’ chromosome barcodes so that each X chromosome Oligopaint probe is targeted by both Cy3 and Alexa 647 generating an intermediate third color when the two channels are overlaid. (B) Wild-type animals were hybridized with primary probes targeting the X chromosome, and subjected to the bridge and detection oligos described in A. Signals were detected for both the Alexa 647 (green) and Cy3 (red), with the overlap generating yellow. All images are representative of at least three independent animals.
Figure 3—video 1
Six Chromosome FISH of a C. elegans intestinal nucleus.
3D render of a single C. elegans intestinal nucleus from a worm hybridized with the six chromosome Oligopaint strategy. Individual chromosome territories can be clearly distinguished.
Figure 4
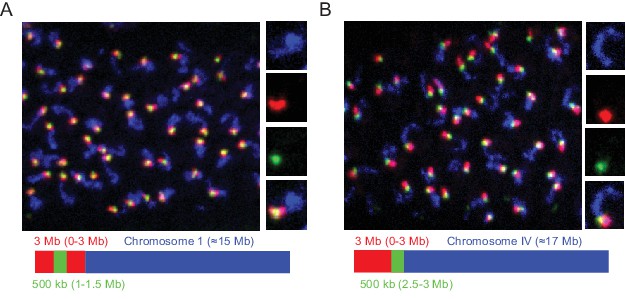
Detection of 3 Mb and 500 kb chromosomal subregions.
Adult C. elegans were fixed and subjected to three step hybridization to detect Chromosome I (A) or IV (B). (A–B) Top, 3D maximum project of pachytene region of adult germline. (A) Chromosome I or (B) chromosome IV, a 3 MB (0–3 Mb) region of these chromosomes, and a 500 kb (1–1.5 Mb for Ch I and 2.5–3 Mb for Ch IV) region of these chromosomes were targeted with detection probes shown in blue, red, and green, respectively. Magnifications of representative nuclei are shown to the right. Bottom, graphic representations of regions of chromosome I (A) or chromosome IV (B) that were stained in the experiment are shown. All images are representative of at least three independent animals.
Figure 5 with 2 supplements
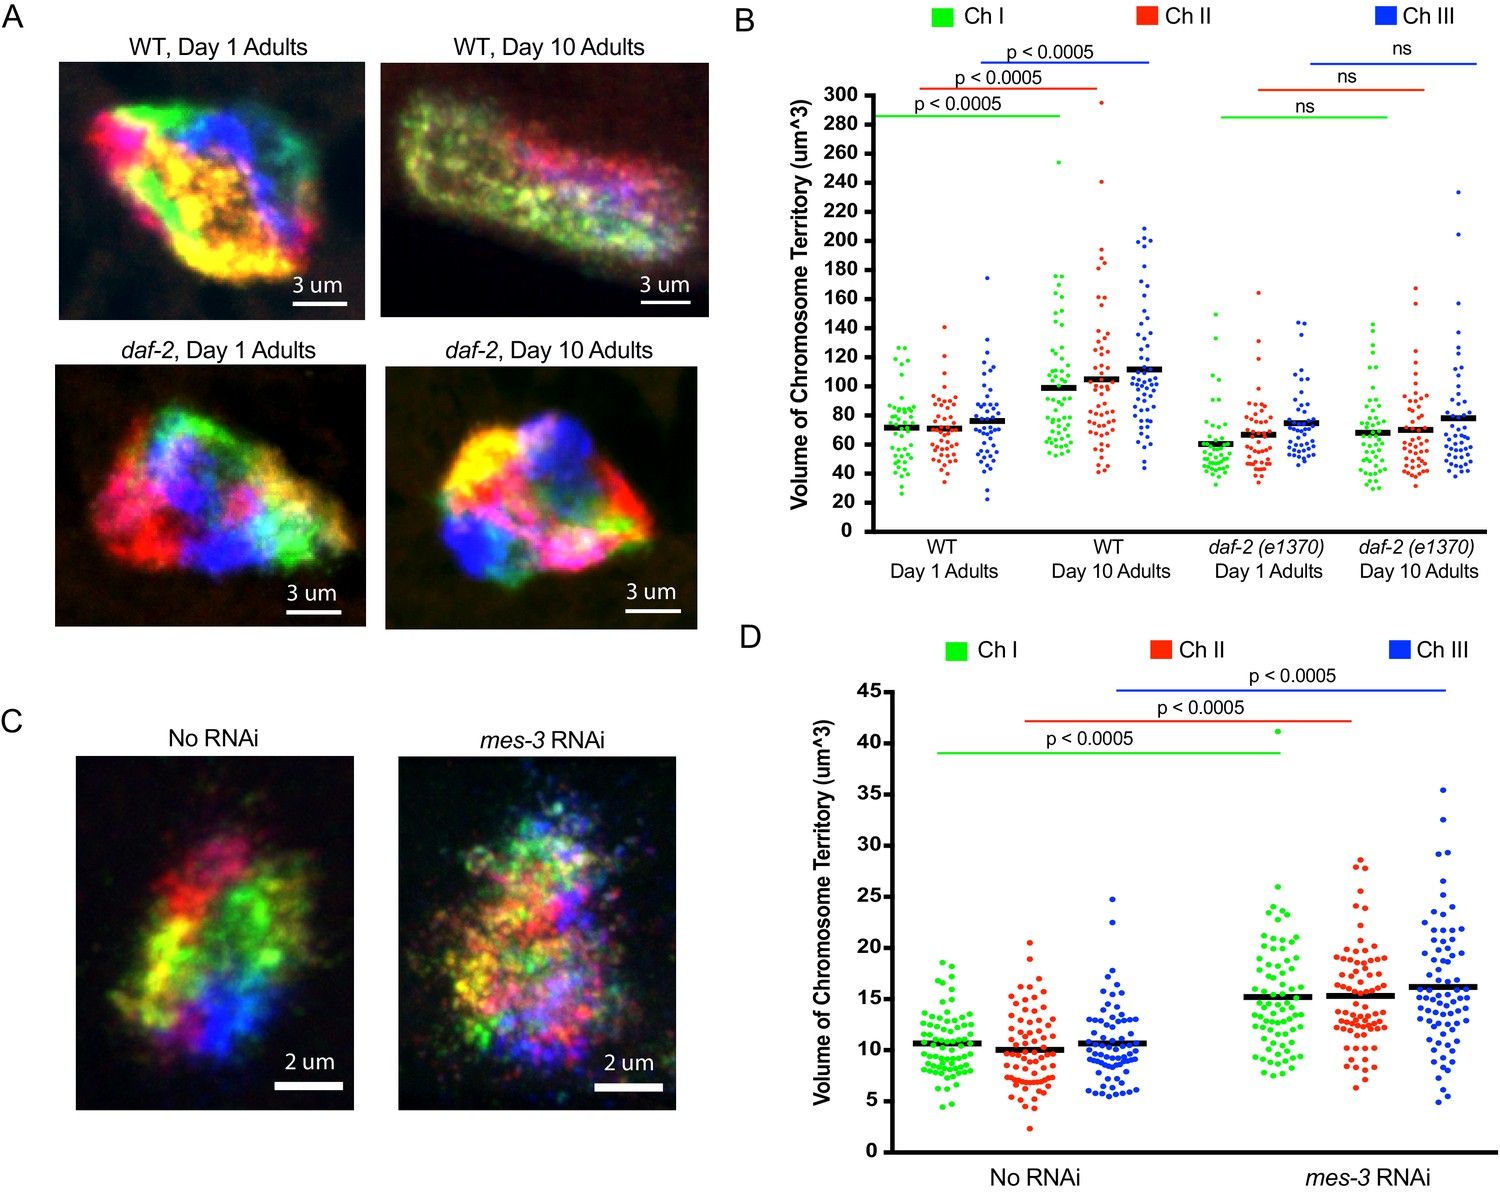
Using C. elegans Oligopaints to explore the biology of genome organization in a whole animal.
(A) Adult C. elegans were fixed and subjected to three step hybridization to detect all six chromosomes at day 1 or day 10 of adulthood. 3D maximum projections of a representative intestinal nucleus is shown. Territories appear disorganized in ten-day-old animals. Chromosome territories in ten-day-old daf-2(e1370) (strain = CB1370) animals are not disorganized. Images shown are representative of at least three independent animals across three biological replicates. (B) Experiment was repeated to detect just chromosomes I, II, and III (this was done to allow unambiguous identification of all three chromosomes as six color DNA FISH introduces overlapping fluorescence signals). ImageJ was used to quantify chromosome territory volume by chromosomes I, II, and III in 1- and 10-day-old animals (see Materials and methods for details of quantification). The volume of chromosomes I, II, and III in 1- or 10-day-old animals of the indicated genotype is indicated on the y-axis. Black bar = mean value of all data points. p-Values were calculated using a two-tailed student t-test. n =>50 nuclei from at least five animals. (C). Adult C. elegans were subjected to mes-3 RNAi by feeding animals bacteria expressing mes-3 dsRNA for two generations. Animals were subjected to three step hybridization to detect all six chromosomes and 3D maximum projections of a hypodermal nucleus is shown. Territories appear disorganized after treatment with mes-3 dsRNA. Images shown are representative of at least three independent animals across two biological replicates. (D) Quantifications of two independent three chromosome DNA FISH experiments reveals an increase in chromosome territory volume after mes-3 dsRNA. Black bar = mean value of all data points. p-Values were calculated using a two-tailed student t-test. n =>50 nuclei from at least five animals.
-
Figure 5—source data 1
RNAi clones tested for effects on chromosome territory architecture.
- https://doi.org/10.7554/eLife.42823.016
-
Figure 5—source data 2
Raw data for Figure 5.
- https://doi.org/10.7554/eLife.42823.017
-
Figure 5—source data 3
Raw data for Figure 5—figure supplement 1.
- https://doi.org/10.7554/eLife.42823.018
Figure 5—figure supplement 1

Aged animals and mes-3 RNAi-treated animals display increased overlap in chromosome territories.
The aging (A) and mes-3 RNAi (B) chromosome quantification data from Figure 5 of main text are displayed here as the degree to which the indicated chromosomal territories overlapped in space. Amount of overlap between chromosomes I-II, I-III, and II-III was calculated for each condition and plotted on the Y axis (log 10 scale) as described in Materials and methods. Numbers in parentheses along the x-axis indicate numbers of data points below 0.01. Black bar = mean value of all data points. p-Values were calculated using a two-tailed student t-test. ns = not significant. n =>50 nuclei from at least five animals. Note, for unknown reasons, daf-2 mutant animals exhibited a subtle increase in chromosome territory overlap in both young and old daf-2 animals.
Figure 5—figure supplement 2
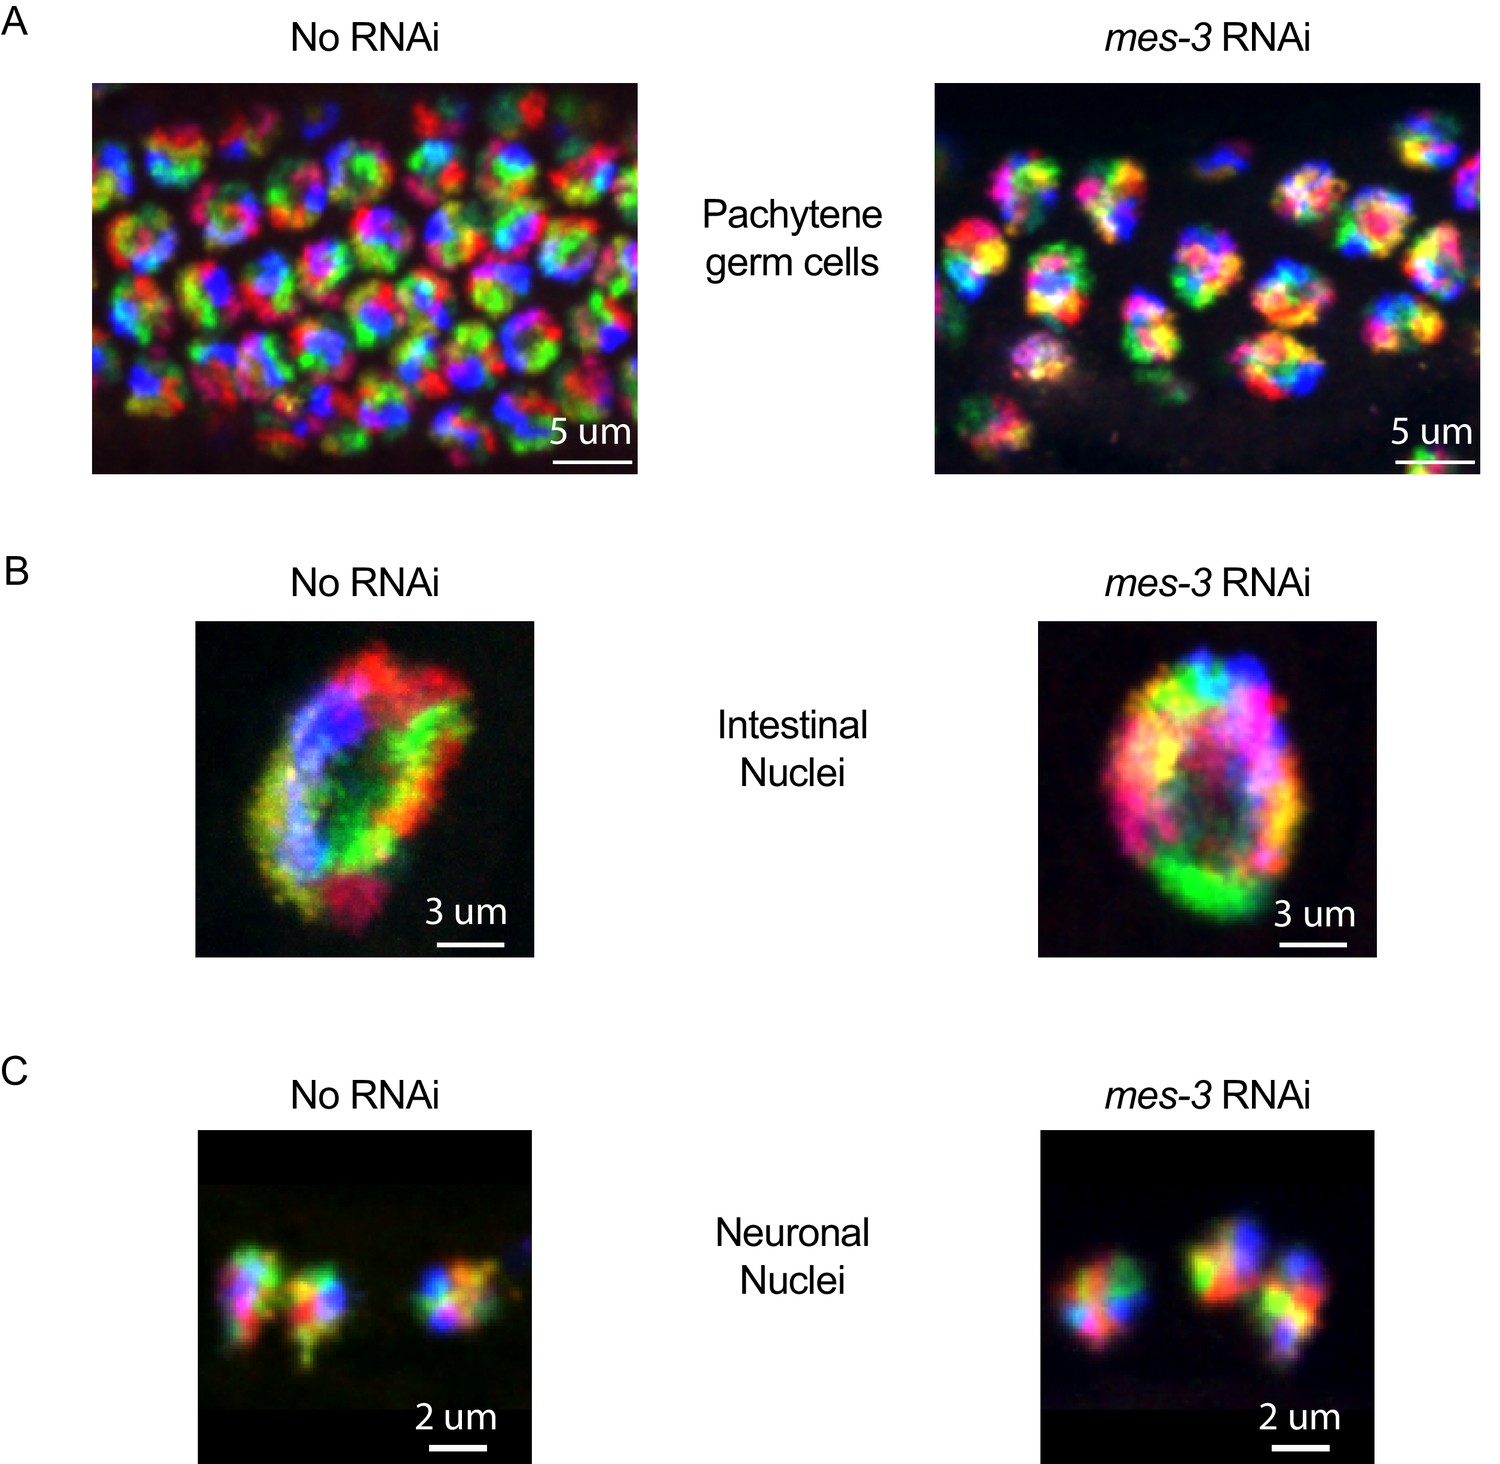
Additional cell types for six chromosome FISH on mes-3 RNAi.
Control (no RNAi) and mes-3 RNAi animals treated animals were subjected to our six chromosome FISH strategy. Germ cells (A), intestinal nuclei (B), and neuronal nuclei (C) were imaged. No dramatic loss of chromosome territories is seen in these cell types after mes-3 RNAi. All images are representative of at least three independent animals.
Tables
Table 1
Distribution of oligonucleotide sequences across the C. elegans genome.
Potential probe sequences were identified as described in Materials and methods. Every fifth oligo sequence was incorporated into the library to ensure even distribution. The average distance between selected probes for each chromosome, and the standard deviations of these distances, are indicated. Kb, kilobase. bp, base pair.
| Chr | First coordinate | Last coordinate | Potential oligo sequences | Potential oligo sequences/kb | Oligo sequences chosen | Oligo sequences chosen/kb | Average distance between oligos (bp) | Standard deviation of distance between oligos (bp) |
|---|---|---|---|---|---|---|---|---|
| I | 512 | 14999984 | 125,863 | 8.39 | 25,174 | 1.68 | 595.8 | 505.9 |
| II | 163 | 15199262 | 136,793 | 9.00 | 27,360 | 1.80 | 555.5 | 484.5 |
| III | 123 | 13599784 | 133,977 | 9.85 | 22,796 | 1.68 | 595.9 | 572.2 |
| IV | 655 | 17399857 | 137,270 | 7.89 | 27,454 | 1.58 | 633.8 | 585.4 |
| V | 414 | 20699907 | 177,948 | 8.60 | 35,590 | 1.72 | 581.6 | 460.4 |
| X | 595 | 17599761 | 161,095 | 9.15 | 32,220 | 1.83 | 546.2 | 436.8 |
| 872,946 | 8.81 | 170,594 | 1.71 | 584.8 | 507.5 |
Key resources table
| Reagent type (species) or resource | Designation | Source or reference | Identifiers | Additional information |
|---|---|---|---|---|
| sStrain, strain background (C. elegans) | N2 (wild type) | CAENORHABDITIS GENETICS CENTER (CGC) | N/A | https://cgc.umn.edu/strain/N2 |
| sStrain, strain background (C. elegans) | CB1489 (him-8 (e1489)) | CAENORHABDITIS GENETICS CENTER (CGC) | WB Cat# CB1489,RRID:WB-STRAIN:CB1489 | https://cgc.umn.edu/strain/CB1489 |
| Strain, strain background (C. elegans) | CB1370 (daf-2 (e1370)) | CAENORHABDITIS GENETICS CENTER (CGC) | WB Cat# CB1370, RRID:WB-STRAIN:CB1370 | https://cgc.umn.edu/strain/CB1370 |
| Strain, strain background (E. coli) | OP50 | CAENORHABDITIS GENETICS CENTER (CGC) | WB Cat# OP50, RRID:WB-STRAIN:OP50 | https://cgc.umn.edu/strain/OP50 |
| Genetic reagent (E. coli) | HT115 (DE3), control bacteria for RNAi | CAENORHABDITIS GENETICS CENTER (CGC) | WB Cat# HT115(DE3), RRID:WB-STRAIN:HT115(DE3) | https://cgc.umn. edu/strain/HT115(DE3) |
| Genetic reagent (E. coli) | mes-3 RNAi clone | PMID: 12828945 | N/A | Ahringer RNAi library |
| Software, algorithm | ImageJ | https://imagej.nih.gov/ij/download.html | ImageJ, RRID:SCR_003070 | SeeSupplementary file 8 |
| Software, algorithm | 3D Objects Counter Plugin Imagej | https://imagej.net/3D_Objects_Counter | 3D Objects Counter, RRID:SCR_017066 | SeeSupplementary file 8 |
| Software, algorithm | 3D ROI Manager | http://imagejdocu.tudor.lu/doku.php? id=plugin:stacks:3d _roi_manager:start | N/A | See Supplementary file 8 |
Additional files
-
Supplementary file 1
All available 42mer oligos mined with the Oligopaint pipeline.
Using the Oligopaint pipeline described in Beliveau et al. (2012), suitable 42mer oligos for FISH were designed and screened against the ce10 genome. The chromosome, start coordinate, end coordinate, sequence, and melting temperature are provided.
- https://doi.org/10.7554/eLife.42823.019
-
Supplementary file 2
Selected oligos used for C. elegans Oligopaint.
A subset of oligos were selected to create the Oligopaint library. The chromosome, start coordinate, end coordinate, sequence, and melting temperature are provided.
- https://doi.org/10.7554/eLife.42823.020
-
Supplementary file 3
Order file for first set of oligos synthesized by CustomArray.
The appropriate primer sequences were concatenated to the original 42mer sequences and sent for ordering. The chromosome, start coordinate, and full probe sequence is provided.
- https://doi.org/10.7554/eLife.42823.021
-
Supplementary file 4
Order file for second set of oligos synthesized by CustomArray.
The appropriate primer sequences were concatenated to the original 42mer sequences and sent for ordering. The chromosome, start coordinate, and full probe sequence is provided.
- https://doi.org/10.7554/eLife.42823.022
-
Supplementary file 5
Primer, barcode, bridge, and detection oligo sequences used in this study.
This file contains the barcodes, bridge, and detection oligos used in this study, as well as the fluorophores used to label each detection oligo. Similar bridge and detection oligos could in theory be used for any primary probe targeting any genome.
- https://doi.org/10.7554/eLife.42823.023
-
Supplementary file 6
Step-by-step Oligopaint probe synthesis protocol.
- https://doi.org/10.7554/eLife.42823.024
-
Supplementary file 7
Step-by-step sample collection and C. elegans Oligopaint protocol.
- https://doi.org/10.7554/eLife.42823.025
-
Supplementary file 8
Step-by-step image analysis workflow for chromosome territory volume and overlap.
- https://doi.org/10.7554/eLife.42823.026
-
Transparent reporting form
- https://doi.org/10.7554/eLife.42823.027
Download links
A two-part list of links to download the article, or parts of the article, in various formats.
Downloads (link to download the article as PDF)
Open citations (links to open the citations from this article in various online reference manager services)
Cite this article (links to download the citations from this article in formats compatible with various reference manager tools)
A multiplexed DNA FISH strategy for assessing genome architecture in Caenorhabditis elegans
eLife 8:e42823.
https://doi.org/10.7554/eLife.42823


