Neural dynamics at successive stages of the ventral visual stream are consistent with hierarchical error signals
- Massachusetts Institute of Technology, United States
Figures
Figure 1

Neural recordings and experimental design in face-selective subregions of the ventral visual stream.
(A) Neurons were recorded along the lateral convexity of the inferior temporal lobe spanning the posterior to anterior extent of IT (+0 to+20 mm AP, Horsely-Clarke coordinates) in two monkeys (data from monkey one are shown). Based on prior work, face-selective sites (red) were operationally defined as those with a response preference for images of frontal faces versus images of non-face objects (see Materials and methods). While these neurons were found throughout IT, they tended to be found in clusters that mapped to previously identified subdivisions of IT (posterior, central, and anterior IT) and corresponded to face-selective areas identified under fMRI in the same subjects (Issa and DiCarlo, 2012; Issa et al., 2013) (STS = superior temporal sulcus, IOS = inferior occipital sulcus, OTS = occipitotemporal sulcus). (B) (top diagram) The three visual processing stages in IT lie downstream of early visual areas V1, V2, and V4 in the ventral visual stream. (left) We designed our stimuli to focus on the intermediate stage pIT by seeking images of faces and images of non-faces that would, on average, drive equally strong initial responses in pIT. Novel images were generated from an exemplar monkey face by positioning the face parts in different positions within the face outline. This procedure generated both frontal face and non-face arrangements of the face parts, and we identified 21 images (red and black boxes) that drove the mean, early (60–100 ms) pIT population response to > 90% of its response to the intact face (first image in red box is synthesized whole face; compare to the second image which is the original whole face), and of these 21 images, 13 images contained atypical, non-face arrangements of the face parts. For example, images with an eye centered in the outline (black box, 3rd and 4th rows) as opposed to the lateralized position of the eye in a frontal face (red box) have a global interpretation (‘cyclops’) that is not consistent with a frontal face but still evoked strong pIT responses. Selectivity of neural sites (see Figure 3 and 4) for typical versus atypical face-part configuration images was quantified using a d’ measure. (middle) Computational hypotheses of cortical dynamics make differing predictions about how neural selectivity in pIT may evolve following images with similar local face features matched in their ability to evoke initial response but with different spatial context (typical vs atypical part configuration of the face). (right) Predictions of how aIT would behave as an output stage building selectivity for images of with face parts configured in the typical frontal face configuration through multiple stages of processing. (C) A population decoder, trained on average firing rates (60–200 ms post image onset, linear SVM classifier) for typical frontal face versus atypical part configurations of the face parts in this image subset, performed poorly in pIT on held-out trials of the same images (trial splits used so that the same images were shown in classifier training (90% of trials) and testing (10% of trials)). However, the particular configuration (typical vs atypical) could be determined at above chance levels when reading the cIT and aIT population responses.
Figure 2

Responses in example sites to face-like images with typical and atypical face-part configurations.
The three sites with the highest selectivity in the late response phase in each region are shown (pIT, cIT, and aIT; left, middle, and right columns, respectively) (d’ selectivity measured in a 100–130 ms window, gray shaded region shown in bottom, left panel). While the three aIT sites (right column) demonstrated a late phase signal for the matched typical face context, the three pIT sites demonstrated the opposite preference in their late phase (100–130 ms) responses (red line = mean response of 8 images shown in Figure 1B red box, and black line = mean response of 13 images shown in Figure 1B black box).
Figure 3

Time course of neural response preferences in pIT, cIT, and aIT for images with typical versus atypical face-part configurations.
(A) Preferences for typical vs atypical part arrangements for each site are plotted in both early (60–90 ms post image onset) and late (100–130 ms) time windows. Sites are grouped based on region (pIT, cIT, aIT) and whether they showed a significant change in selectivity from early to late time windows (light gray = increased preference, black = decreased preference, and dark gray = no change in preference for typical versus atypical face-part configurations, significance tested at p < 0.01 level; example sites from Figure 2 are plotted using thicker, darker lines). Many sites in pIT and cIT showed a decreasing signal for the typical face-part configuration context versus atypical configuration contexts over time (black lines, middle row, left and center panels). In contrast, no sites in aIT had this dynamic (middle row, right panel). (B) The fraction of sites whose responses showed a preference for images of typical, face-like arrangements of the face parts in pIT (blue), cIT (green) and aIT (red) in the early (60–90 ms) and late (100–130 ms) phase of the response. Note that, in the late phase of the response, most pIT neurons responded more strongly to atypical arrangements of face parts. (C) Selectivity measured for images driving similar responses within a site. This procedure ensured matched initial responses on a site-by-site basis rather than using a fixed set of images based on the overall population response (i.e. the fixed image set of Figure 1B; here, the initial d’ for 60–90 ms is close to zero when images are selected site by site). Although initial response differences were near zero when using site based image selection, a late phase signal that was stronger for atypical face-part configurations still emerged in pIT and cIT but not in aIT similar to the decreasing selectivity profile observed when using a fixed image set for all sites.
Figure 4
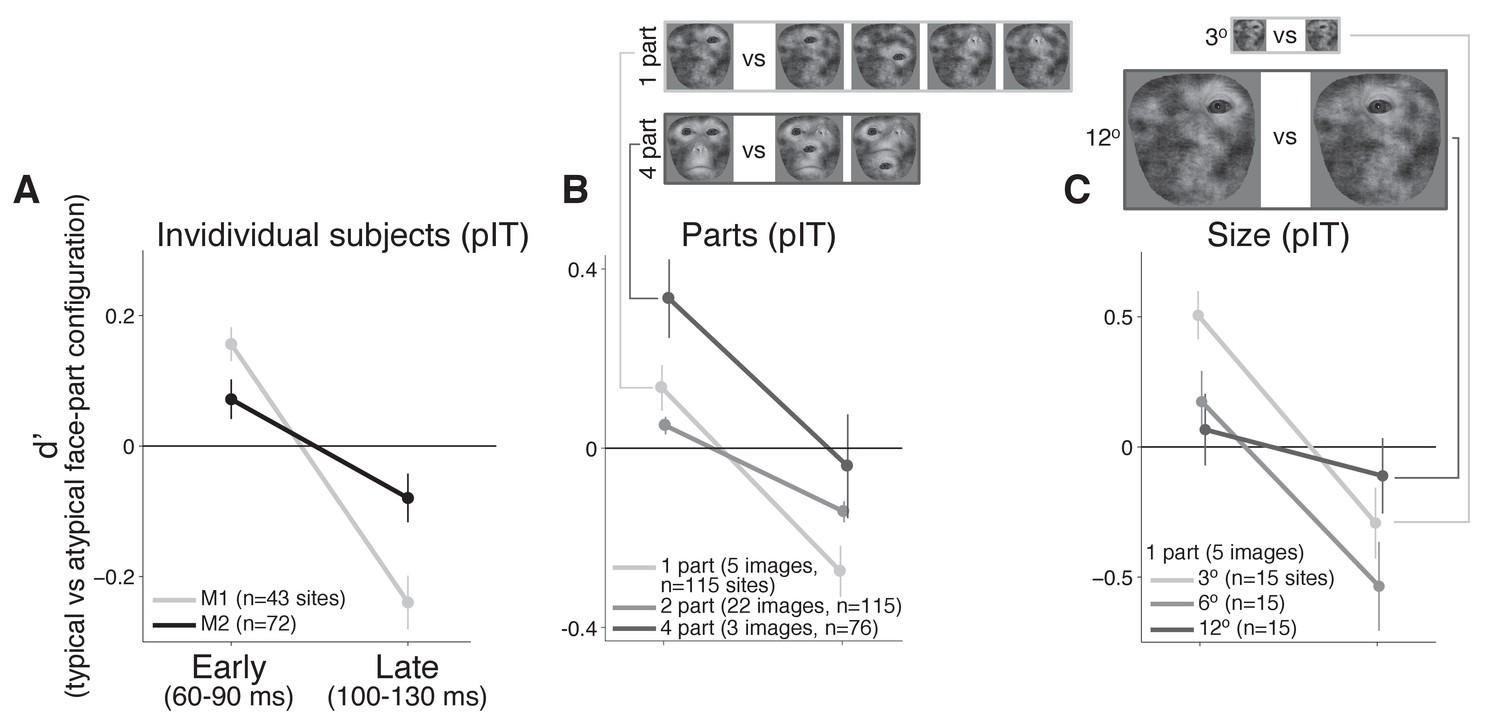
Individual monkey comparison and image controls for the decreasing selectivity profile in pIT.
(A) Preference for images with the typical face-part configuration analyzed separately for each monkey. Median d’ of pIT sites in both early and late time windows is shown. (B) Preference for images with typical versus atypical arrangements of the parts was re-computed using image subsets containing the same number of parts in the outline (the five 1-part and the three 4-part image subsets shown at top; the larger 2-part subset contained 30 images and is not shown). (C) The 1-part image subset was further tested at three different sizes (3o, 6o, and 12o). In all cases, pIT responses showed a decreasing preference over time for typically-arranged face parts leading to a preference for atypically arranged face parts in the later time window (100–130 ms).
Figure 5

Computational modeling of neural dynamics in IT.
(A) Three stage neural networks with recurrent dynamics were constructed to model neural signals measured in pIT, cIT, and aIT corresponding to the first (blue), second (green), and third (red) model processing stages (top row; see Materials and methods). Models received four inputs (gray) into four hidden stage units (blue) which sent feedforward projections that converged onto two units in the next layer (green) (self-connections reflecting leak currents are not shown here for clarity). State (feature) coding models generally showed increasing selectivity over time from hidden to output layers as exemplified by the feedforward model (left) and did not demonstrate the strong decrease of stimulus preference in their hidden processing stage as observed in the pIT and cIT neural population (blue and green lines, feedforward model shown). However, the neurons coding errors in a feedback-based hierarchical model did show a strong decrease of stimulus preference in the hidden processing stage (second column; reconstruction errors instead of the states were fit directly to the data). This model which codes the error signals (filled circles) also codes the states (open circles). Far right, population averaged neural selectivity profile for difference between typical, frontal versus atypical face-part arrangements (normalized by the mean population response to the whole face) used in model fitting (best fitting feedforward and error coding models are shown at left). (B) Goodness of fit of all three stage models tested to population averaged selectivity profiles (dashed lines represent mean and standard error of reliability of neural data as estimated by bootstrap resampling). Besides the base feedforward architecture, additional excitatory feedback (Bayesian inference) or lateral inhibitory (lateral inhibition or normalization) connections between units were implemented to produce recurrent dynamics. The goodness of fit to the population averaged neural data (far right in (A)) of the state coding models (first five bars) and of the reconstruction error coding model (last bar) are shown.
Figure 6
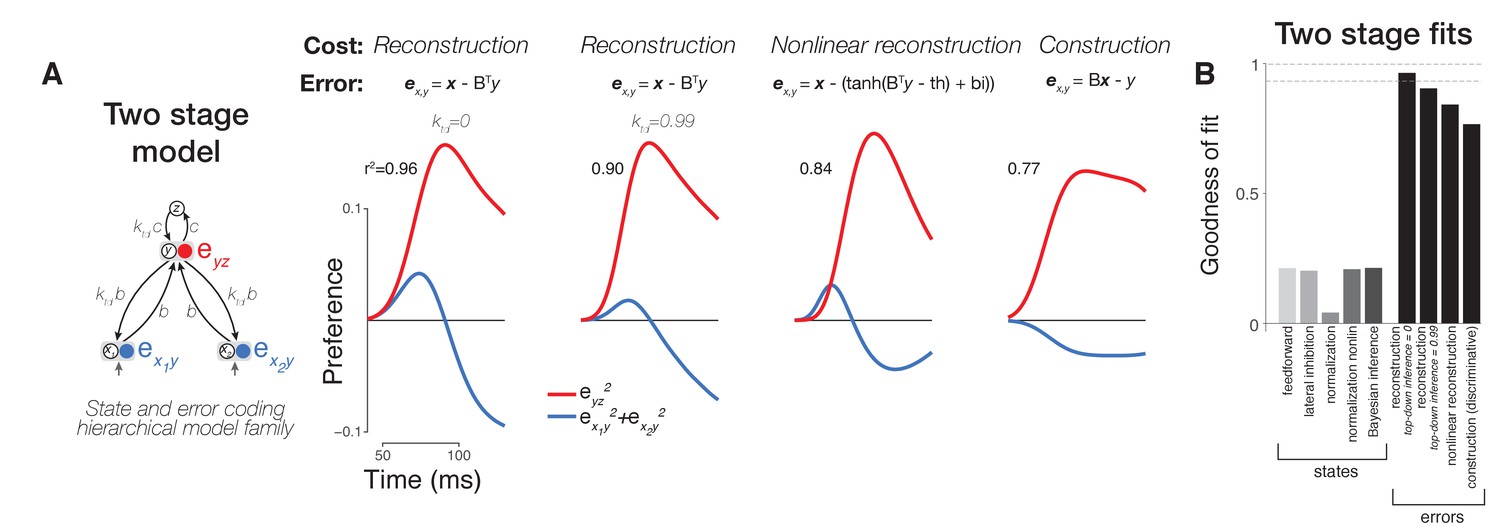
Comparison of variants of error coding hierarchical models that use different algorithms for online inference.
(A) Additional varieties of error computing networks can be generated by varying the online inference algorithm that they use. In one case, inference does not utilize top-down information between stages (classic error backpropagation; between-stage feedback connections shown are not used in these networks during runtime). On the other hand, between-stage feedback can be used to optimize online estimates such as in more general forms of error backpropagation and predictive coding. We approximated these two extremes by including a parameter (ktd, see Materials and methods) controlling the relative weighting of bottom-up (feedforward) and top-down (feedback) evidence during online inference (first and second panels). We found that top-down inference between stages was not necessary to produce the appropriate error signal dynamics, and ktd was equal to zero (similar to the lack of inference in classic error backpropagation) in our best fitting two-layer (first column) and three-layer (Figure 5A, second column) models although models with ktd ~ 1 also performed well (second column). Models can also differ in their goal (cost function) which directly impacts the error signals computed (equations in top row). Under a nonlinear reconstruction goal (emulating the nonlinear nature of spiking output), the resulting error signals were still consistent with our data (third column). A simple sigmoidal nonlinearity, however, did lead to additional details present in our neural data such as a rapid return of stimulus preference to zero in the hidden layer. When we tested a discriminative, construction goal more consistent with a supervised learning setting where high-dimensional bottom-up responses simply have to match a low-dimensional downstream target signal as in classification tasks, we found that the errors of construction did not match the data as well as reconstruction errors (compare fourth column to first three columns). (B) Goodness of fit to population neural data for all two stage models including two layer versions of state (feature) coding controls (same format as Figure 5B).
Additional files
-
Source data 1
Source neural data for figures 1-5 and model code for figures 5-6.
- https://doi.org/10.7554/eLife.42870.008
-
Transparent reporting form
- https://doi.org/10.7554/eLife.42870.009
Download links
A two-part list of links to download the article, or parts of the article, in various formats.
Downloads (link to download the article as PDF)
Open citations (links to open the citations from this article in various online reference manager services)
Cite this article (links to download the citations from this article in formats compatible with various reference manager tools)
Neural dynamics at successive stages of the ventral visual stream are consistent with hierarchical error signals
eLife 7:e42870.
https://doi.org/10.7554/eLife.42870


