Rapid learning and unlearning of predicted sensory delays in self-generated touch
- Karolinska Institutet, Sweden
Figures
Figure 1
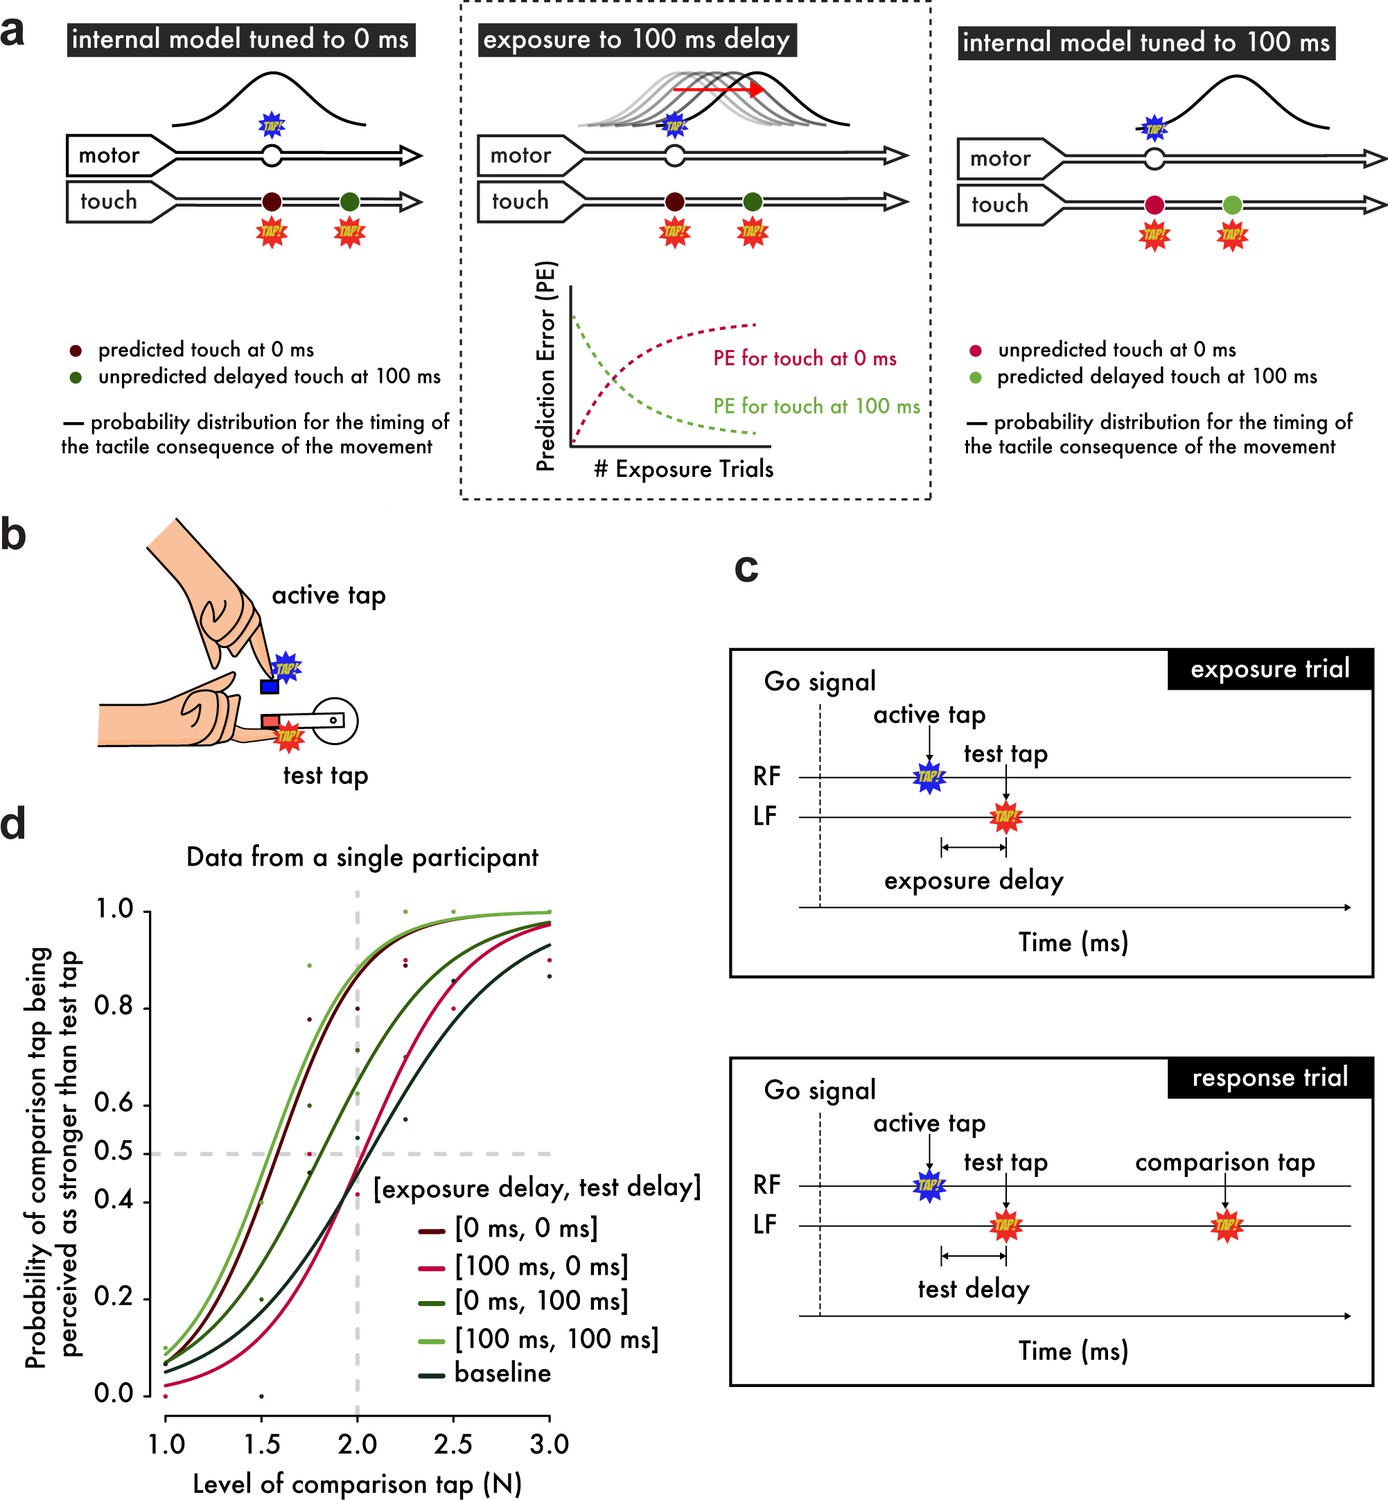
Experimental Hypotheses, Procedures and Psychophysical Analysis.
(a) (Left) When the internal model is tuned to 0 ms as in natural situations, the probability distribution for the occurrence of touch on the left index finger (approximated as a normal distribution (Bays et al., 2005) based on the uncertainty in the predicted time of the touch arising from noise in motor and sensory systems) peaks at 0 ms after the movement of the right index finger. Touch presented at 0 ms shows the strongest attenuation, while touch at 100 ms is less attenuated because it is less likely to have been self-generated. (Middle) When exposed to systematic delays of 100 ms between the finger movement and the touch, the model parameter is gradually updated to 100 ms, which can be viewed as a simple incremental shift in the probability distribution by 100 ms. Before the exposure, there is an error associated with the touch predicted at 0 ms and presented at 100 ms but no error related to the naturally presented touch at 0 ms. During the learning period, this pattern gradually reverses: a prediction error for the touch presented at 0 ms appears and grows over exposure time, while the prediction error for the touch at 100 ms decays and reaches a minimum. (Right) After prolonged exposure, the touch at 0 ms has low probability, produces a large prediction error and will not be attenuated, whereas the touch at 100 ms has high probability, produces no prediction error and will be attenuated. (b) Participants were instructed to use their right index finger to tap a sensor (active tap) that delivered a tap on their left index finger (test tap). (c) In the exposure trials, participants simply tapped the sensor with their right index finger (RF) and received the tap on the left index finger (LF) with a 0 ms or a 100 ms exposure delay (intrinsic delay of the force setup ≅ 36 ms). In the response trials, participants received a second tap on their left index finger (comparison tap) and were required to indicate which tap was stronger: the test or the comparison tap. The test tap could be presented with a test delay of either 0 ms or 100 ms. (d) Psychophysical data from a representative participant demonstrate how the somatosensory attenuation phenomenon is quantified. The horizontal gray dashed line indicates the 50% point of psychometric functions, and the vertical gray dashed line indicates the true intensity of the test tap (2 N).
Figure 2 with 1 supplement
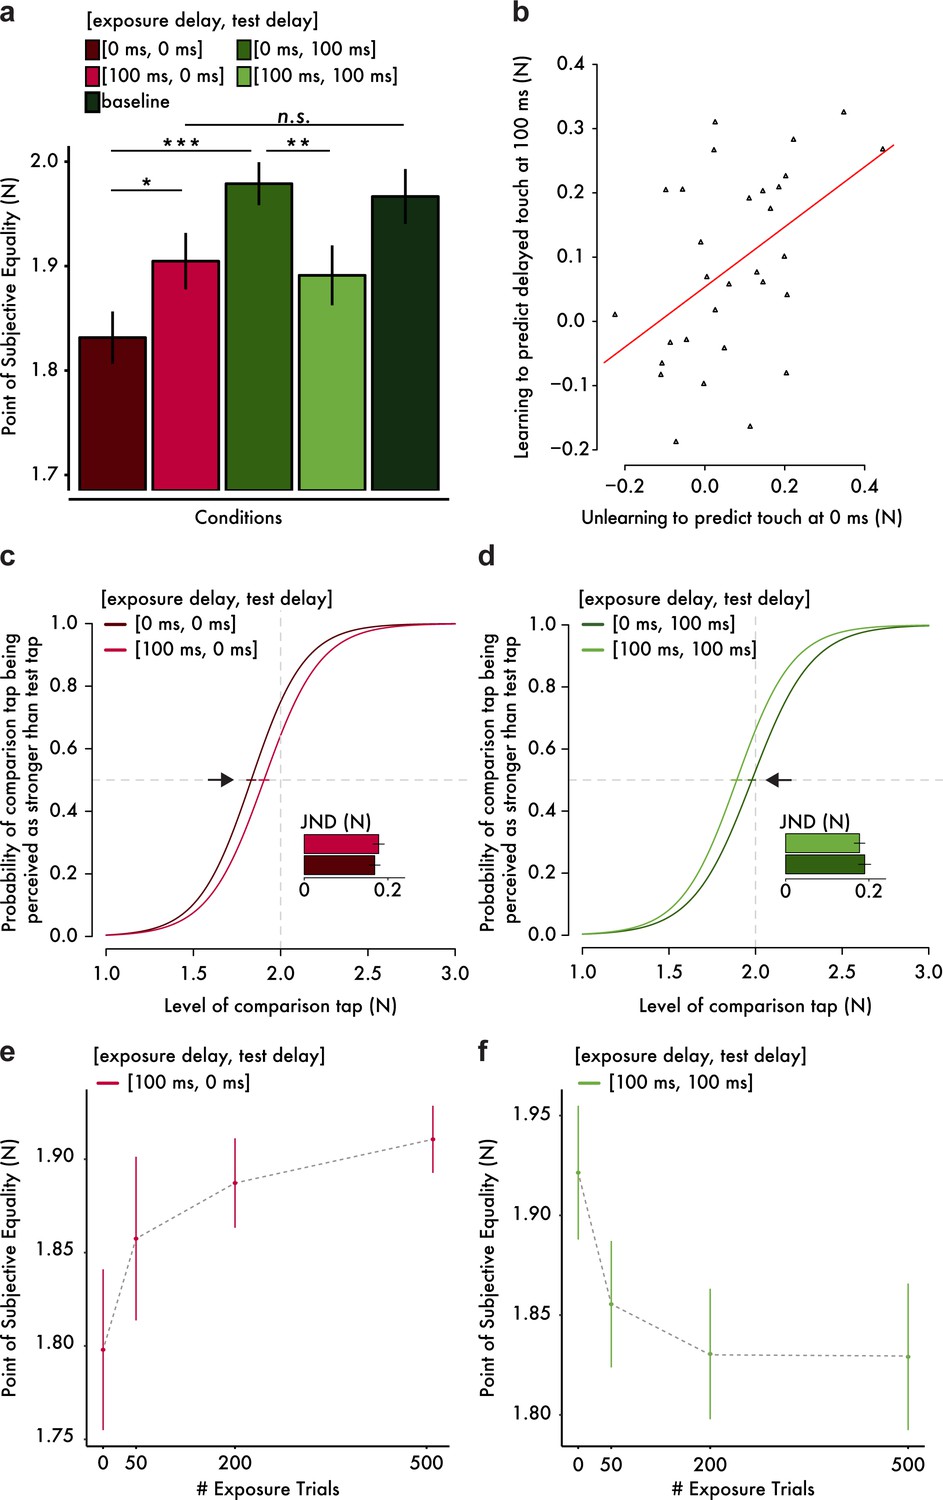
Results from the somatosensory attenuation experiments.
(a) Mean PSE (± s.e.m.) for each condition. Only the important planned comparisons are displayed (*p<0.05, **p<0.01, ***p<0.001, n.s. not significant). (b) Scatterplot of the attenuation shifts in immediate touch (unlearning) and delayed touch (learning). The more participants unlearned to predict the immediate touch, the more they learned to predict the delayed one. The orange line indicates the fitted regression line. (c, d) Group psychometric functions indicating significant attenuation shifts for immediate (c) and delayed touch (d). Error bars indicate the standard error of the mean (s.e.m.) of the PSEs. Subplots indicate the mean JND (± s.e.m.) for each condition. The horizontal gray dashed lines indicate the 50% point of psychometric functions, and the vertical gray dashed lines indicate the true intensity of the test tap (2 N). (e, f) Mean PSE (± s.e.m.) as a function of the number of exposure trials.
-
Figure 2—source data 1
Mean PSE (± s.e.m.) for each condition.
- https://doi.org/10.7554/eLife.42888.005
-
Figure 2—source data 2
Attenuation shifts in immediate touch (unlearning) and delayed touch (learning).
- https://doi.org/10.7554/eLife.42888.006
-
Figure 2—source data 3
Model parameters for the group fits.
- https://doi.org/10.7554/eLife.42888.007
-
Figure 2—source data 4
Mean PSE (± s.e.m.) as a function of exposure trials.
- https://doi.org/10.7554/eLife.42888.008
Figure 2—figure supplement 1
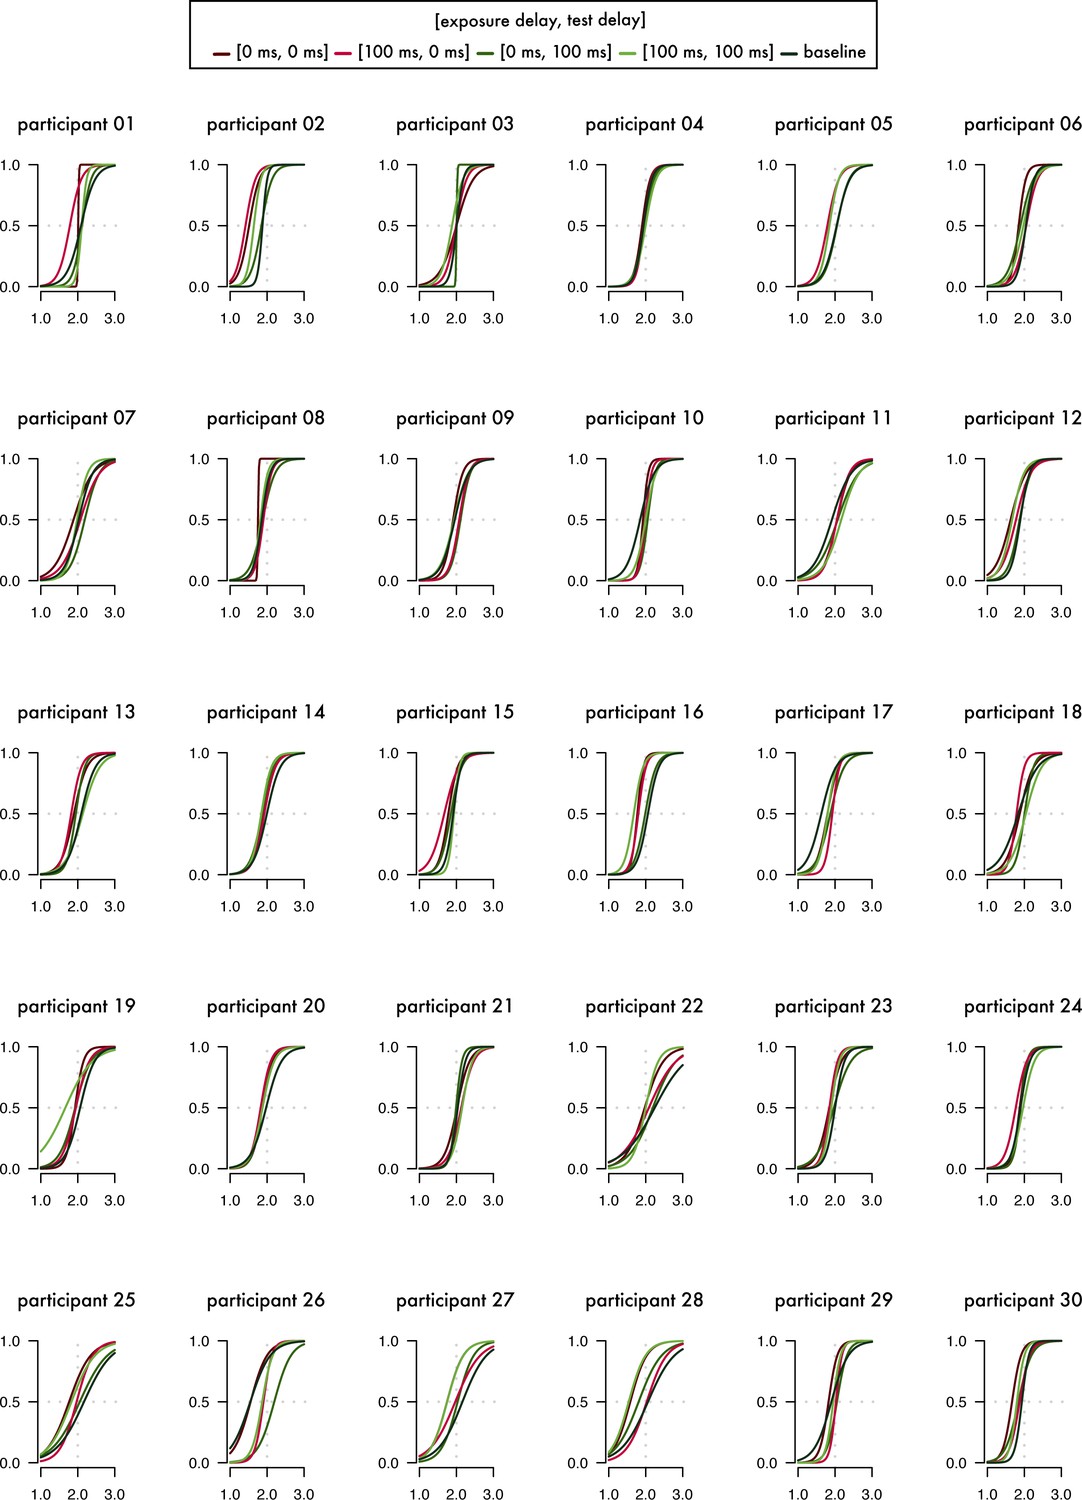
Individual Fits of all participants in Experiment 1.
The figure shows the fits of the 30 participants per condition. The horizontal gray dashed line indicates the 50% point of psychometric functions, and the vertical gray dashed line indicates the true intensity of the test tap (2 N).
Figure 3
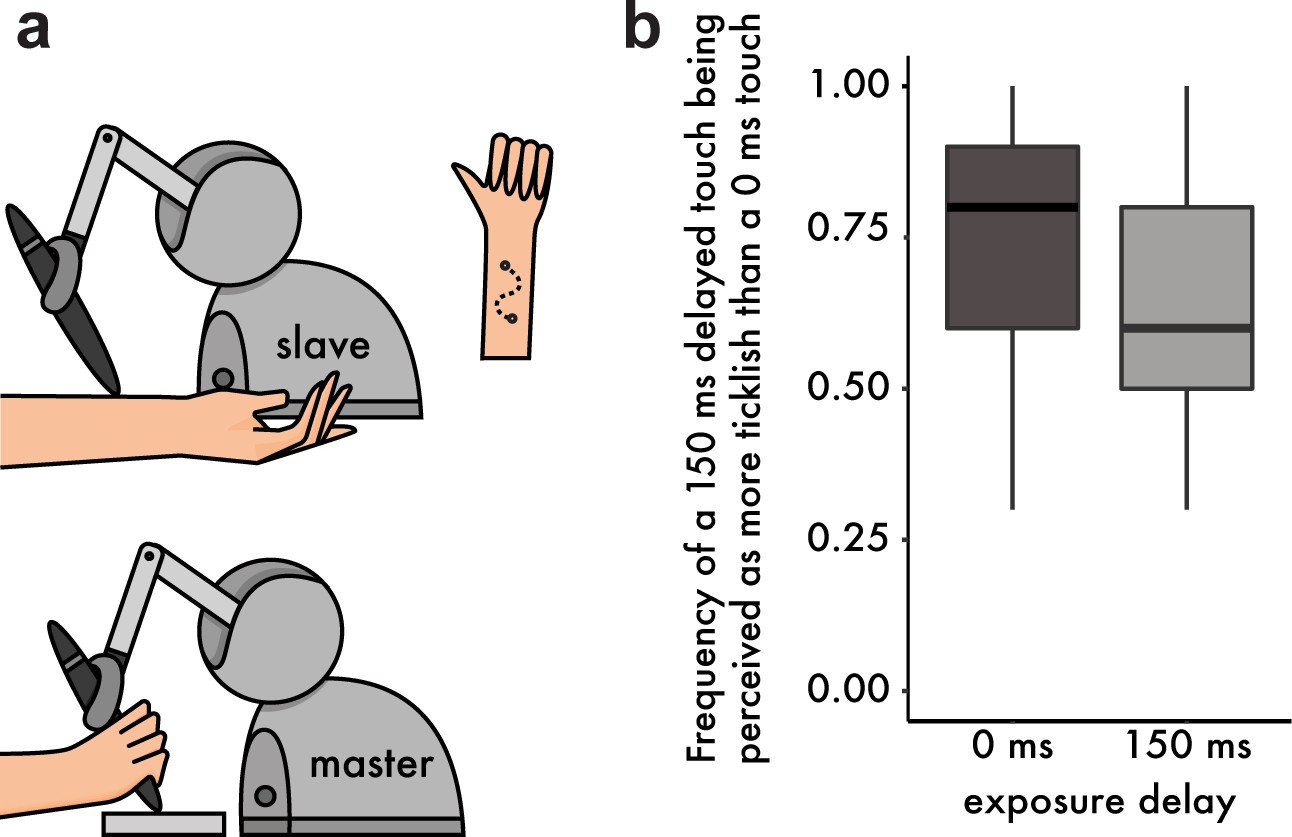
Methods and Results from the tickling experiment.
(a) Participants were instructed to move the stylus of a robot with their right hand (master robot). The stylus was free to move along a sinusoidal path within a 3D-printed mold, thus constraining the movement trajectory. A second robot (slave) copied the master robot and delivered the touch on the volar (anterior) part of their left forearm. Participants were asked to perform two sinusoidal movements (twice back and forth) with their right hand and received two stimulations on the left forearm (one with a 0 ms and one with a 150 ms delay). Afterwards they had to indicate which touch felt more ticklish. (b) Boxplot of the frequencies at which participants rated the delayed touch (150 ms) as more ticklish than the immediate touch. After exposure to the 150 ms delay, participants chose the delayed touch less frequently (or reversely, they chose the immediate touch with higher frequency). The horizontal black bars represent the medians, and the boxes denote the interquartile ranges.
-
Figure 3—source data 1
Median and interquartile range (IQR) for the frequency of a 150 ms delayed touch being perceived as more ticklish than a 0 ms touch, per condition.
- https://doi.org/10.7554/eLife.42888.010
Tables
Author response table 1
Experiment 1:
https://doi.org/10.7554/eLife.42888.012| PSE comparisons | Original p – value | Corrected p-value |
|---|---|---|
| [0, 0] vs. baseline | p < 0.001 (0.0000676947) | p < 0.001 (0.0002369315) |
| [0, 100] vs. baseline | p = 0.9032264724 | p = 0.9032264724 |
| [0, 0] vs. [0, 100] | p < 0.001 (0.0000004712) | p < 0.001 (0.0000032987) |
| [0, 0] vs. [100, 0] | p = 0.0107374617 | p = 0.0187905579 |
| [100, 0] vs. baseline | p = 0.0701934955 | p = 0.0818924114 |
| [0, 100] vs. [100, 100] | p = 0.0026044238 | p = 0.0060769889 |
| [100, 100] vs. baseline | p = 0.0570803400 | p = 0.0799124760 |
Author response table 2
Experiment 2:
https://doi.org/10.7554/eLife.42888.013| PSE comparisons for [100 ms, 0 ms] | Original p – value | Corrected p-value |
|---|---|---|
| 0 vs. 50 trials | p = 0.1815470400 | p = 0.1815470400 |
| 0 vs. 200 trials | p = 0.0282742723 | p = 0.0424114084 |
| 0 vs. 500 trials | p = 0.0135470857 | p = 0.0406412571 |
| PSE comparisons for [100 ms, 100 ms] | Original p – value | Corrected p-value |
| 0 vs. 50 trials | p = 0.0098760710 | p = 0.0136271106 |
| 0 vs. 200 trials | p = 0.0136271106 | p = 0.0136271106 |
| 0 vs. 500 trials | p = 0.0044865222 | p = 0.0134595666 |
Author response table 3
| Comparisons | Estimate | Inferior CI | Superior CI |
|---|---|---|---|
| [0 ms, 0 ms] versus baseline | -0.124 | -0.158 | -0.093 |
| [0 ms, 100 ms] versus baseline | 0.020 | -0.008 | 0.057 |
| [0 ms, 0 ms] versus [0 ms, 100 ms] | -0.144 | -0.185 | -0.110 |
| [0 ms, 0 ms] versus [100 ms, 0 ms] | -0.066 | -0.104 | -0.027 |
| [0 ms, 100 ms] versus [100 ms, 100 ms] | 0.087 | 0.051 | 0.125 |
| [100 ms, 0 ms] versus baseline | -0.058 | -0.093 | -0.025 |
| [100 ms, 100 ms] versus baseline | -0.067 | -0.098 | -0.032 |
Additional files
-
Transparent reporting form
- https://doi.org/10.7554/eLife.42888.011
Download links
A two-part list of links to download the article, or parts of the article, in various formats.
Downloads (link to download the article as PDF)
Open citations (links to open the citations from this article in various online reference manager services)
Cite this article (links to download the citations from this article in formats compatible with various reference manager tools)
Rapid learning and unlearning of predicted sensory delays in self-generated touch
eLife 8:e42888.
https://doi.org/10.7554/eLife.42888


