Epigenetic regulation of mammalian Hedgehog signaling to the stroma determines the molecular subtype of bladder cancer
- Pohang University of Science and Technology, Republic of Korea
- Seoul National University Hospital, Republic of Korea
- Yonsei University, Republic of Korea
- Sungkyunkwan University, Republic of Korea
Figures
Figure 1 with 1 supplement
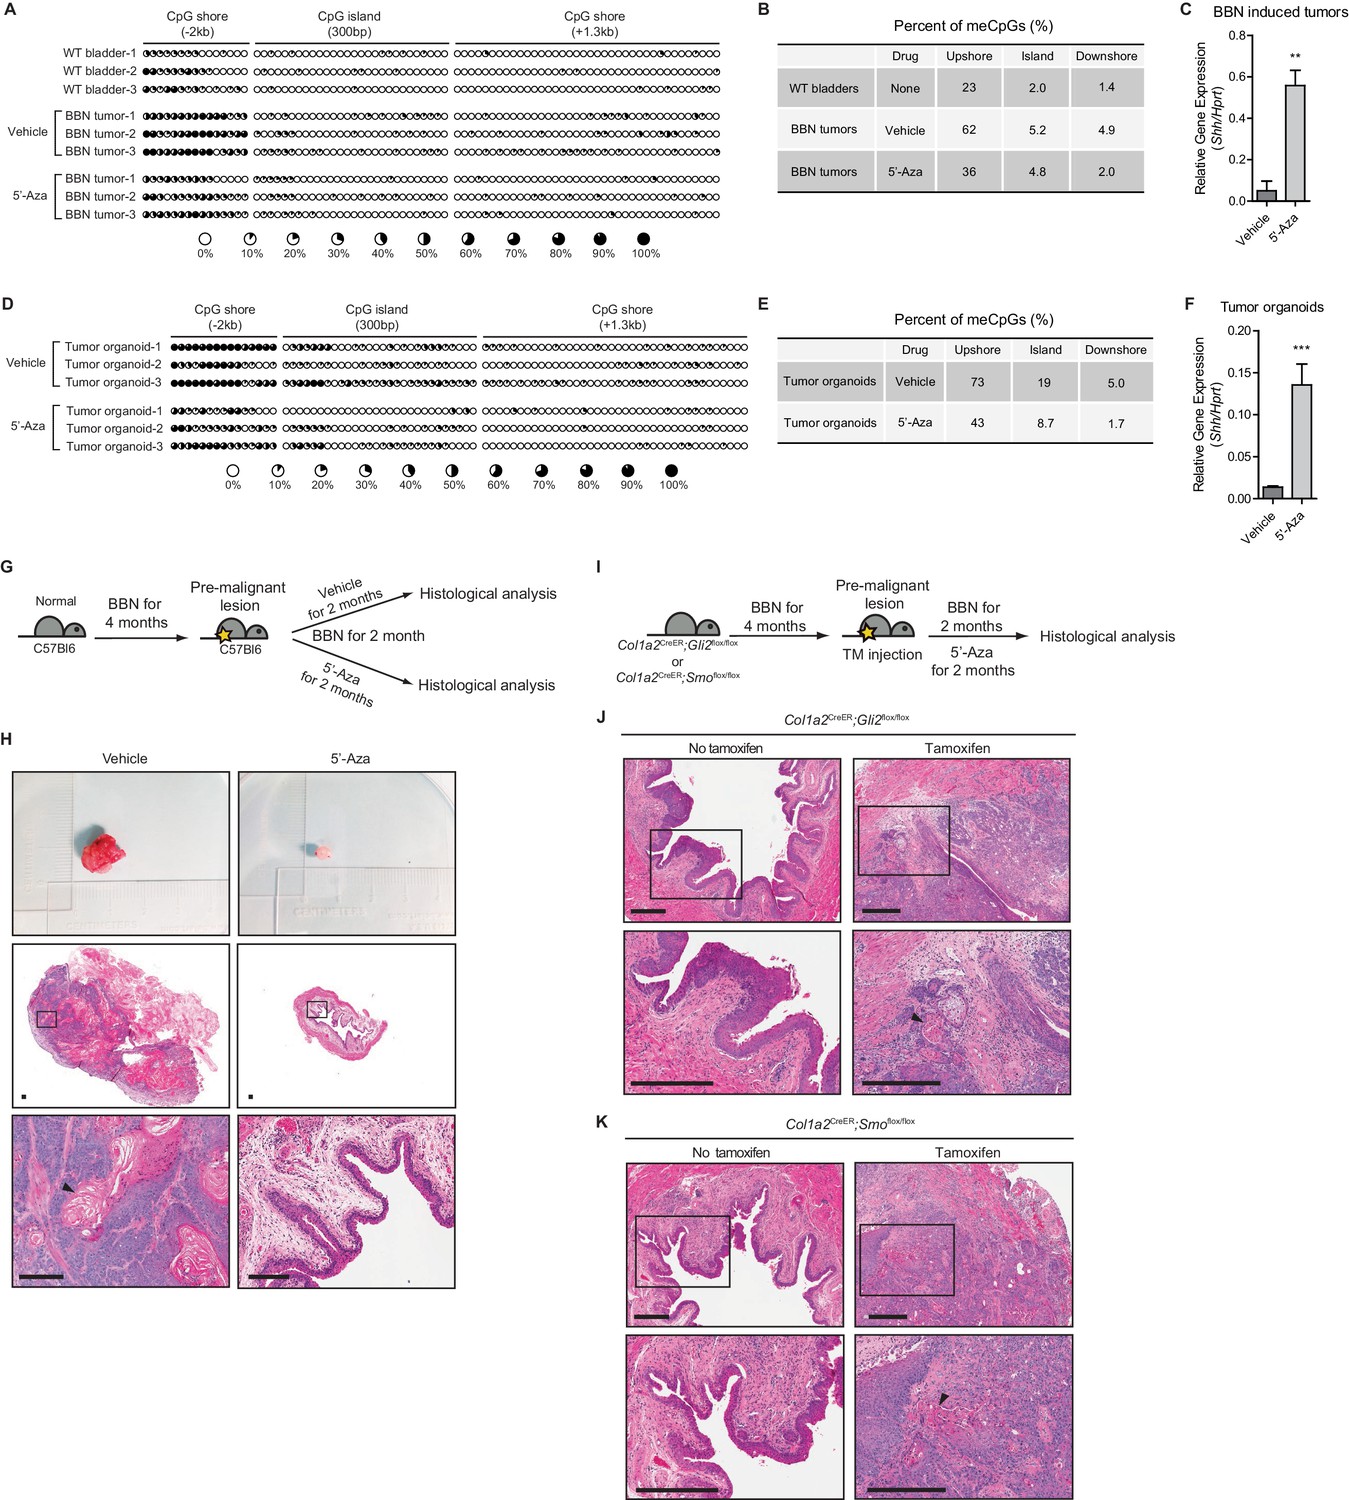
Loss of Shh expression in urothelial carcinoma due to hypermethylation of the CpG shore of the Shh gene.
(A, D) The methylation status of the CpG island and CpG shore regions of the Shh gene were analyzed by bisulfite sequencing in wild-type bladder tissues, BBN-induced bladder tumors with or without 5’-azacitidine treatment (A), and tumor organoids with or without 5’-azacitidine treatment (D). BBN-induced mouse tumors were orthotopically transplanted and, 1 week after transplantation, the resulting animals were treated with 5’-azacitidine (1 mg per kg mouse body weight) every other day for 2 weeks before methylation analysis. Tumor organoids were cultured using Matrigel overlay method. Three days after seeding, tumor organoids were treated with 5’-azacitidine (1 uM) for 4 consecutive days. Each circle represents one of 81 CpG sites, and the average degree of methylation is indicated by the black portion of the white circle. (B, E) Results obtained from bisulfite sequencing analysis of BBN-induced bladder tumors (B) and tumor organoids (E) are summarized. (C, F) Expression of Shh in orthotopically transplanted BBN-induced tumors treated with 5’-azacitidine (C, 11-fold increase) and in cultured tumor organoids treated with 5’-azacitidine (F, 9-fold increase) compared to that of untreated controls. Data are presented as the mean ± SEM, and significance was calculated with an unpaired Student’s t test (**, p<0.001). n = 3 technical replicates, and the entire experiment was repeated three times. (G) Schematic diagrams of experimental strategies for evaluating the effect of DNMT inhibition on the initiation of bladder cancer. Mice (14 animals in total) exposed to BBN for 4 months to induce CIS lesions were treated with the vehicle control (seven animals) or 5’-azacitidine (seven animals) for 2 months, with continued BBN exposure to induce the development of invasive carcinoma before histopathological analysis of the bladders. (H) Bladder tumors are shown in the upper panel. H and E staining of bladder sections (middle panels) from mice treated with the vehicle control (left panels) or 5’-azaciditine (right panels). Magnified views (lower panels) of the boxed regions in the middle panels, confirming the presence (vehicle) or absence (5’-azacitidine) of invasive carcinoma. Scale bars represent 150 µm. (I) Schematic diagrams of experimental strategies for testing the association of the stromal Hh response with the anticancer effect of hypomethylation on the initiation of bladder cancer. Col1a2CreER;Gli2flox/flox (10 animals in total) or Col1a2CreER;Smoflox/flox (10 animals in total) mice exposed to BBN for 4 months were injected with TM (five animals on each strain) or corn oil (five animals on each strain) on 3 consecutive days. The resulting animals were subsequently exposed to BBN for two additional months with 5’-azacitidine treatment. (J, K) Sections from the bladders of vehicle-injected (left panels) or TM-injected (right panels) mice were analyzed by H and E staining (J, Col1a2CreER;Gli2flox/flox; K, Col1a2CreER;Smoflox/flox). Arrowheads in high-magnification images indicate regions of squamous differentiation. Scale bars represent 300 µm. See also Figure 1—figure supplement 1 and Figure 1—source data 1.
-
Figure 1—source data 1
Expression of Shh in BBN-induced tumors and in cultured tumor organoids treated with 5’-azacitidine.
- https://doi.org/10.7554/eLife.43024.005
Figure 1—figure supplement 1
Loss of Shh expression in urothelial carcinoma resulting from hypermethylation of the CpG shore of the Shh gene increases the initiation of invasive urothelial carcinoma at the premalignant stage of progression through the stromal Hh response.
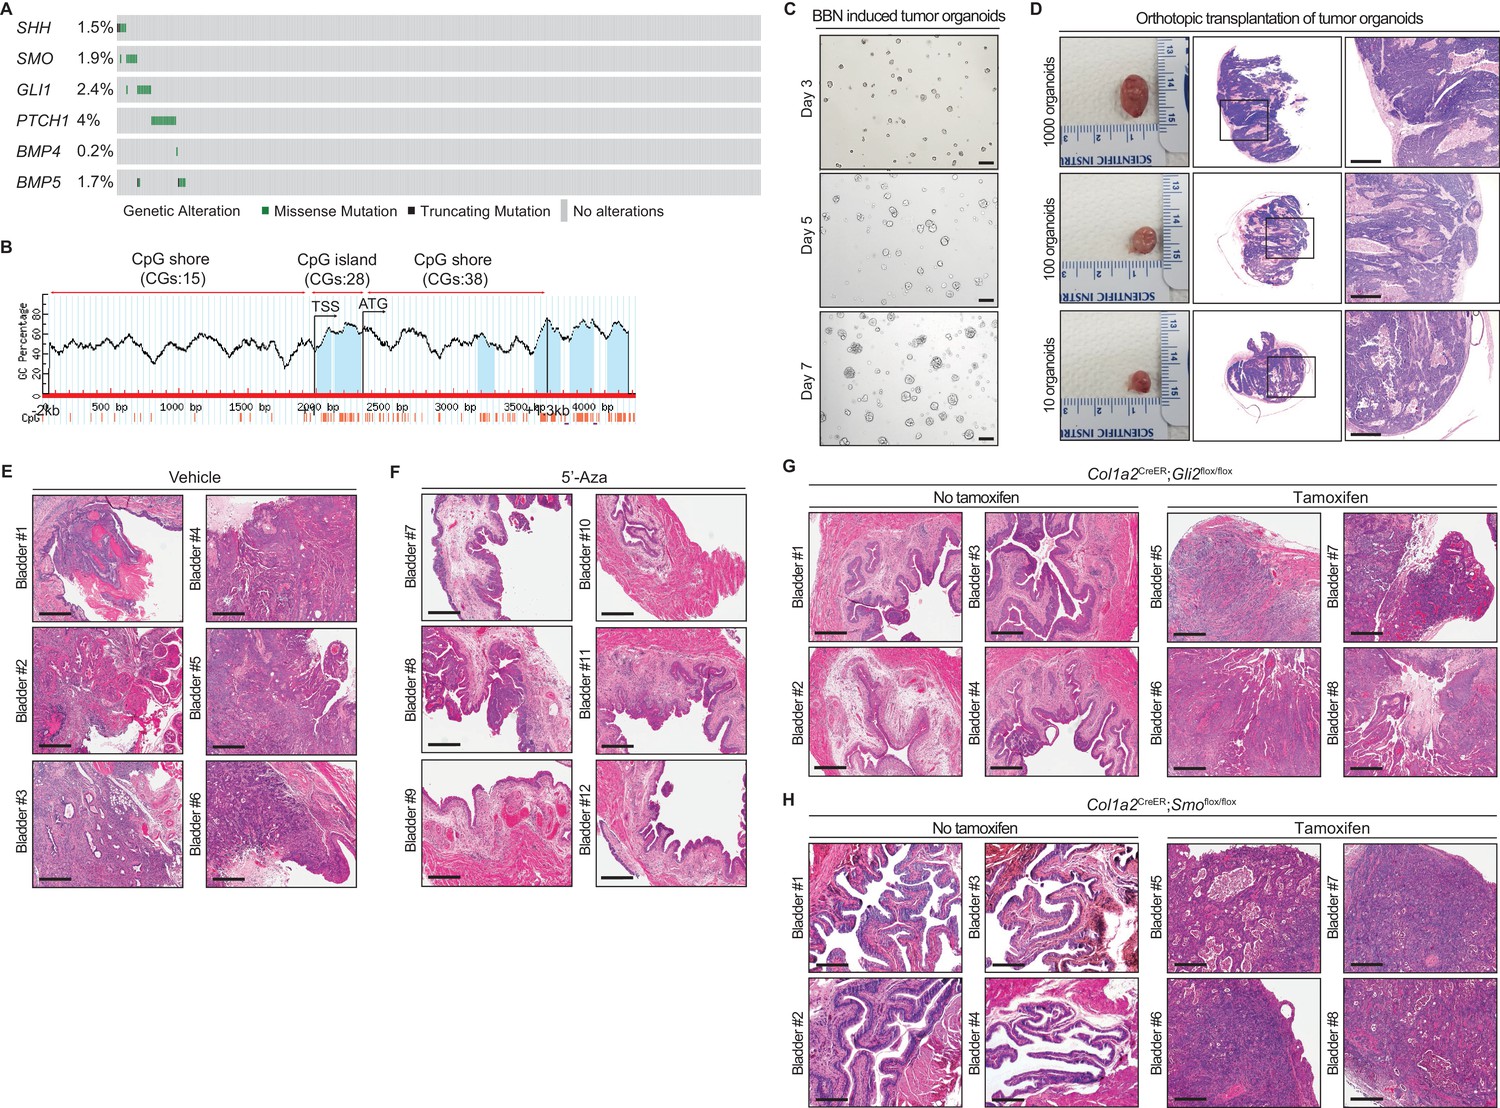
(A) Genetic alterations from the TCGA database of genes involved in the Hh and BMP pathways (SHH, SMO, GLI1, PTCH1, BMP4 and BMP5) in muscle-invasive bladder cancer. Each square represents one patient (n = 349). (B) Schematic diagram of the CpG island and flanking shore regions of murine Shh. Eighty-one CpG sites were analyzed for methylation status. TSS, transcription start site; CGs, CpG sites; blue areas, CpG-rich region. (C) In vitro culture of bladder tumor organoids derived from single cells of BBN-induced urothelial carcinomas. Scale bars represent 100 µm. (D) Orthotopic allografts (left panels) of tumor organoids cultured for 5 days with serial dilution. Sections of allografts were analyzed by H and E staining (middle and right panels). Right panels show magnified views of the regions highlighted by boxes in middle panels. Scale bars represent 500 µm. (E, F) C57Bl6 mice (twelve different animals) exposed to BBN for 4 months to induce CIS lesions were treated with the vehicle control (E, bladder #1–6) or 5’-azacitidine (F, bladder #7–12) for 2 months, with continued BBN exposure to induce the development of invasive carcinoma before histopathological analysis of the bladders. H and E staining of bladder sections from mice treated with the vehicle control (E) or 5’-azaciditine (F). Scale bars represent 300 µm. (G, H) Col1a2CreER;Gli2flox/flox (eight different animals) or Col1a2CreER;Smoflox/flox (eight different animals) mice exposed to BBN for 4 months were injected with TM on three consecutive days. The resulting animals were subsequently exposed to BBN for two additional months with 5’-azacitidine treatment. Sections from the bladders of vehicle-injected (Bladder #1–4) or TM-injected (Bladder #5–8) mice were analyzed by H and E staining (G, Col1a2CreER;Gli2flox/flox; H, Col1a2CreER;Smoflox/flox). Scale bars represent 300 µm.
Figure 2 with 1 supplement
Pharmacological inhibition of DNMT activity impedes the growth of urothelial carcinoma through an increased stromal Hh response.
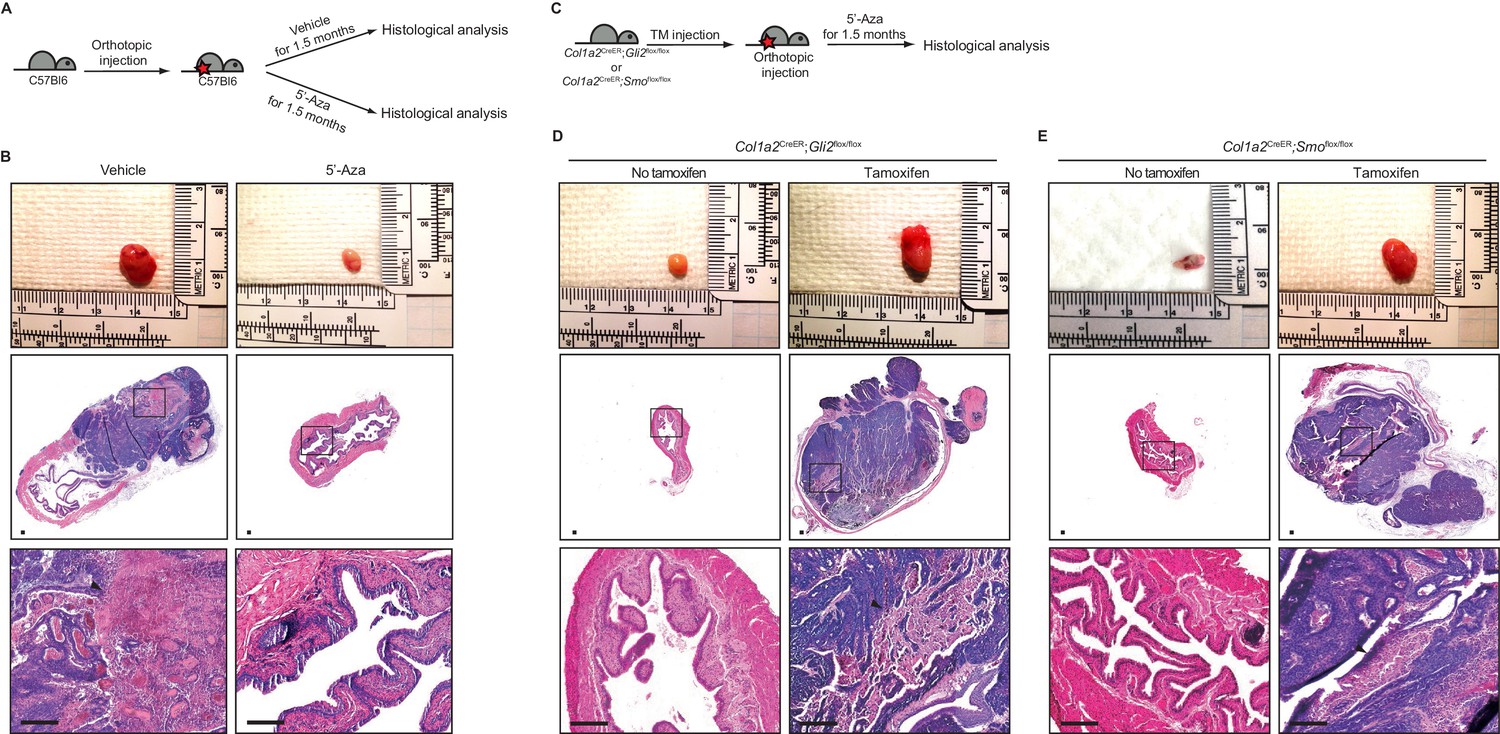
(A) Schematic diagrams of the experimental strategies for evaluating the effect of DNMT inhibition on the growth of bladder cancer. Mice (14 animals in total) orthotopically injected with BBN-induced bladder tumor cells were treated with the vehicle control (seven animals) or 5’-azacitidine (seven animals) for 1.5 months. (B) Orthotopic allografts of BBN-induced tumors are shown in the upper panels. H and E staining of allograft sections from mice treated with the vehicle control or 5’-azaciditine is shown in the middle panels. Magnified views (lower panels) of the boxed regions, confirming the presence (vehicle) or absence (5’-azacitidine) of invasive carcinoma. (C) Schematic diagrams of the experimental strategies for testing the association of the stromal Hh response with the anticancer effect of hypomethylation on the growth of bladder cancer. Col1a2CreER;Gli2flox/flox or Col1a2CreER;Smoflox/flox mice were injected with TM on three consecutive days. BBN-induced tumors from isogenic mice were orthotopically transplanted, and treatment with 5’-azacitidine was initiated for 1.5 months (D, E) Orthotopic allografts of BBN induced tumors are shown in the upper panels. Sections of allografts from vehicle-injected (left panels) or TM-injected (right panels) mice were analyzed by H and E staining (D, Col1a2CreER;Gli2flox/flox; E, Col1a2CreER;Smoflox/flox). H and E staining of tumor sections is shown in the middle panels. The lower panels show magnified views of the boxed regions. Arrowheads in high-magnification images indicate regions of squamous differentiation. Scale bars represent 150 µm. See also Figure 2—figure supplement 1A,B and C.
Figure 2—figure supplement 1
Pharmacological inhibition of DNMT activity impedes the growth of urothelial carcinoma by increasing Hh/BMP signaling activity.
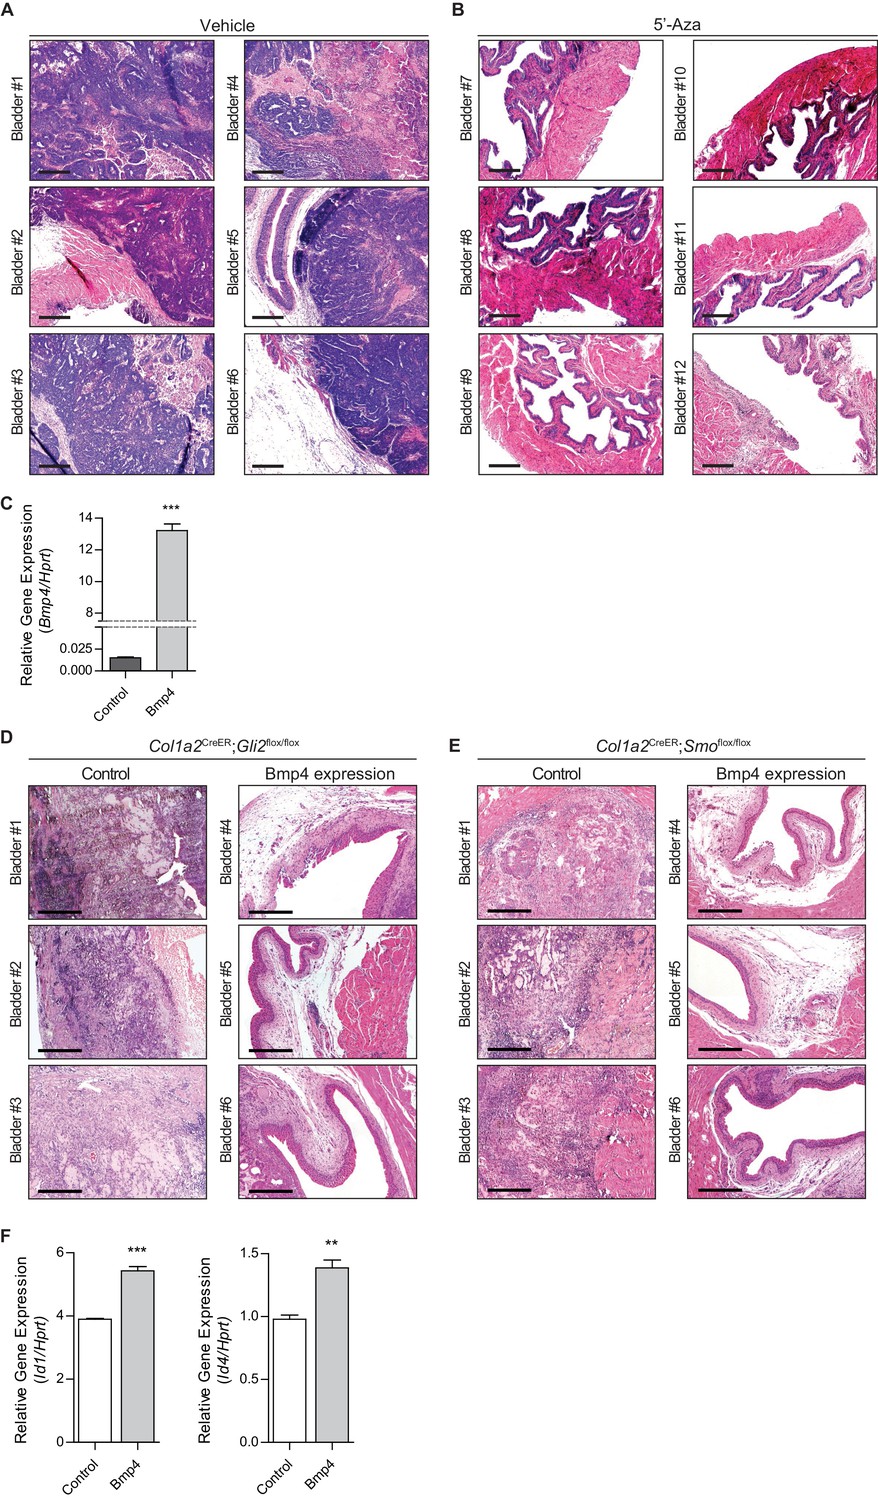
(A, B) C57Bl6 mice (twelve different animals) orthotopically injected with BBN-induced bladder tumor cells were treated with the vehicle control (A, bladder #1–6) or 5’-azacitidine (B, bladder #7–12) for 1.5 months. Tumor allografts were analyzed by H and E staining. (C) Expression analysis of Bmp4 in tumor organoids infected with a lentivirus containing Bmp4. (D, E) TM was injected into Col1a2CreER;Gli2flox/flox (six different animals) or Col1a2CreER;Smoflox/flox (six different animals) mice on three consecutive days. The mice were then orthotopically injected with Bmp4-expressing bladder tumor organoids and subsequently treated with 5’-azacitidine for 2 weeks. Sections of allografts from mice orthotopically injected with control tumor organoids (Bladder #1–3) or Bmp4-expressing tumor organoids (Bladder #4–6) were stained with H and E (D, Col1a2CreER;Gli2flox/flox; E, Col1a2CreER;Smoflox/flox). (F) Expression analysis of the BMP target genes, Id1 and Id4, in cultured tumor organoids treated with Bmp4 proteins. Data are presented as the mean ± SEM, and significance was calculated with an unpaired Student’s t test. (**, p<0.01; ***, p<0.001). n = 3 technical replicates, and the entire experiment was repeated six times. Scale bars represent 300 µm.
Figure 3
Pharmacological inhibition of DNMT activity impedes the growth of urothelial carcinoma by increasing BMP pathway activity.
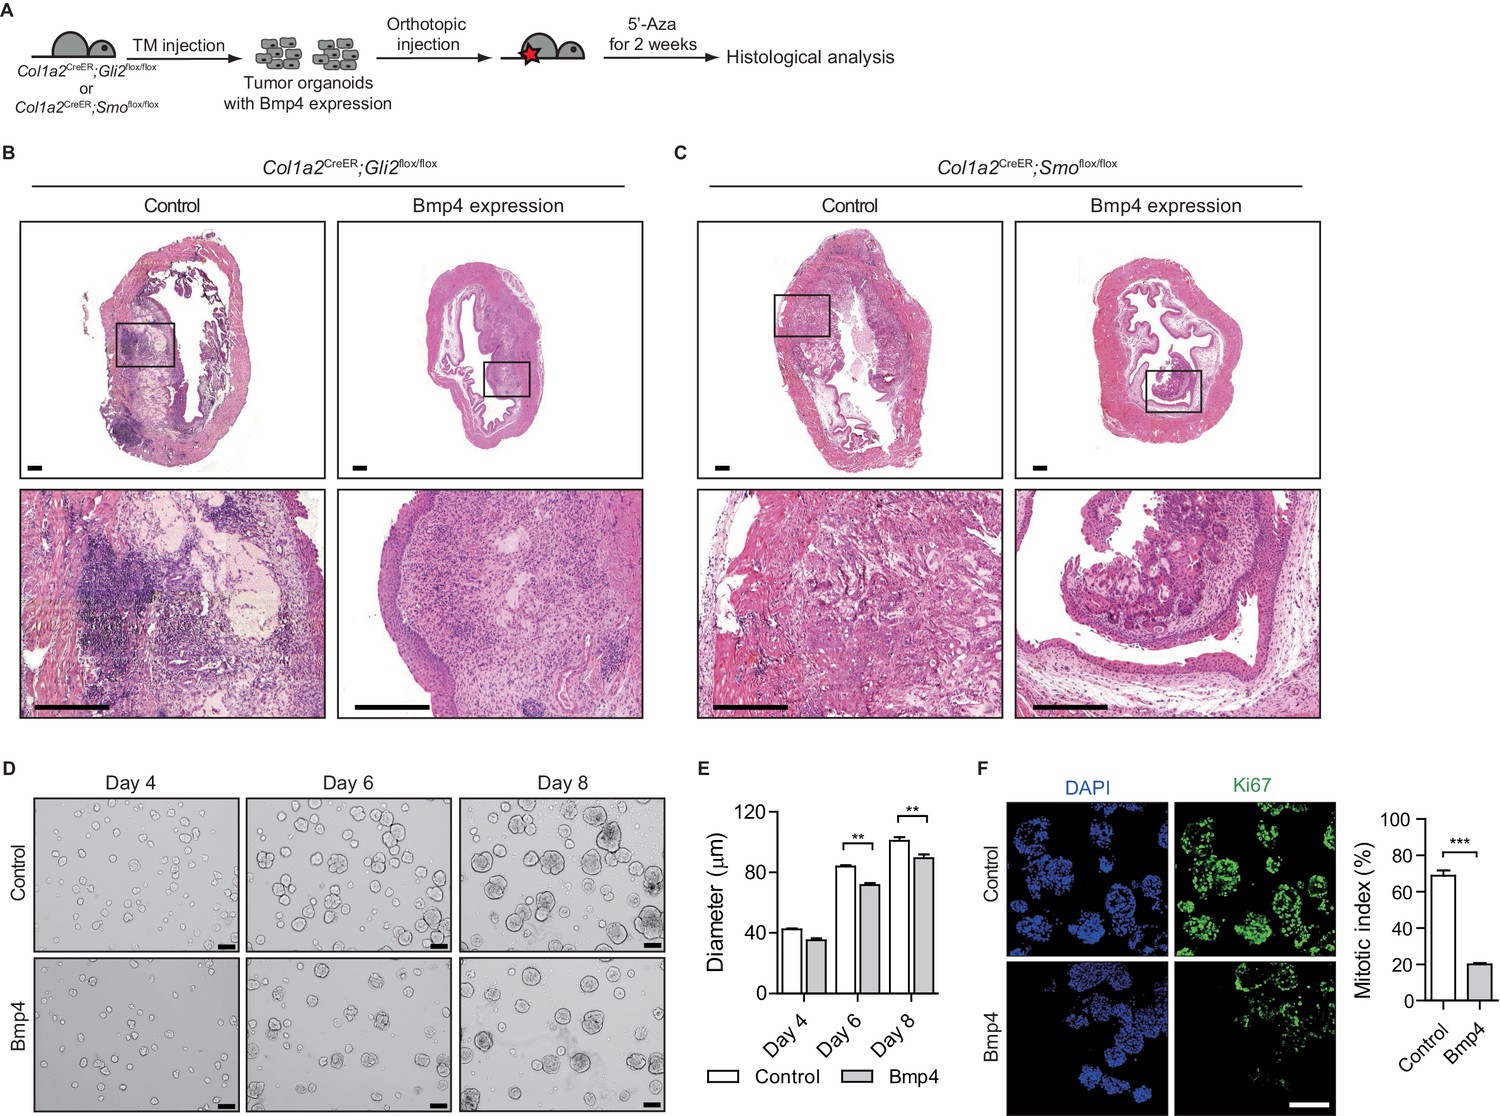
(A) Experimental scheme for evaluating the role of BMP signaling in the growth of urothelial carcinoma. TM was injected into Col1a2CreER;Gli2flox/flox (eight animals in total) or Col1a2CreER;Smoflox/flox (eight animals in total) mice on 3 consecutive days. Mice were then orthotopically injected with Bmp4-expressing bladder tumor organoids and subsequently treated with 5’-azacitidine for 2 weeks. (B, C) Sections of allografts from mice orthotopically injected with control tumor organoids (left panels) or Bmp4-expressing tumor organoids (right panels) were stained with H and E. The lower panels represent magnified views of the boxed region in the middle panels. Scale bars represent 300 µm. (D) Tumor organoids derived from BBN-induced bladder tumors were cultured in the absence (upper panels) or presence (lower panels) of Bmp4 for 8 days. Left, middle and right panels show the bright-field images of tumor organoids cultured for 4, 6 and 8 days, respectively. Scale bars represent 100 µm. (E) Average size of bladder tumor organoids cultured for 4, 6, and 8 days in the absence or presence of Bmp4 protein (n = 90 organoids in each condition). (F) Quantification of cell proliferation in tumor organoids cultured for 6 days in the absence or presence of Bmp4. Left panels show the images immunostained with DAPI and Ki67. Ki67-positive cells are shown as a per cent of total DAPI-staining nuclei. Data are presented as the mean ± SEM, and significance was calculated with an unpaired Student’s t test (**, p<0.01). See also Figure 2—figure supplement 1D,E,F and Figure 3—source data 1.
-
Figure 3—source data 1
Quantification for the growth and cell proliferation of tumor organoids with Bmp4 treatment.
- https://doi.org/10.7554/eLife.43024.009
Figure 4 with 1 supplement
Heightened activity of Hh signaling to the stroma induces a less aggressive luminal-like subtype of urothelial carcinoma.
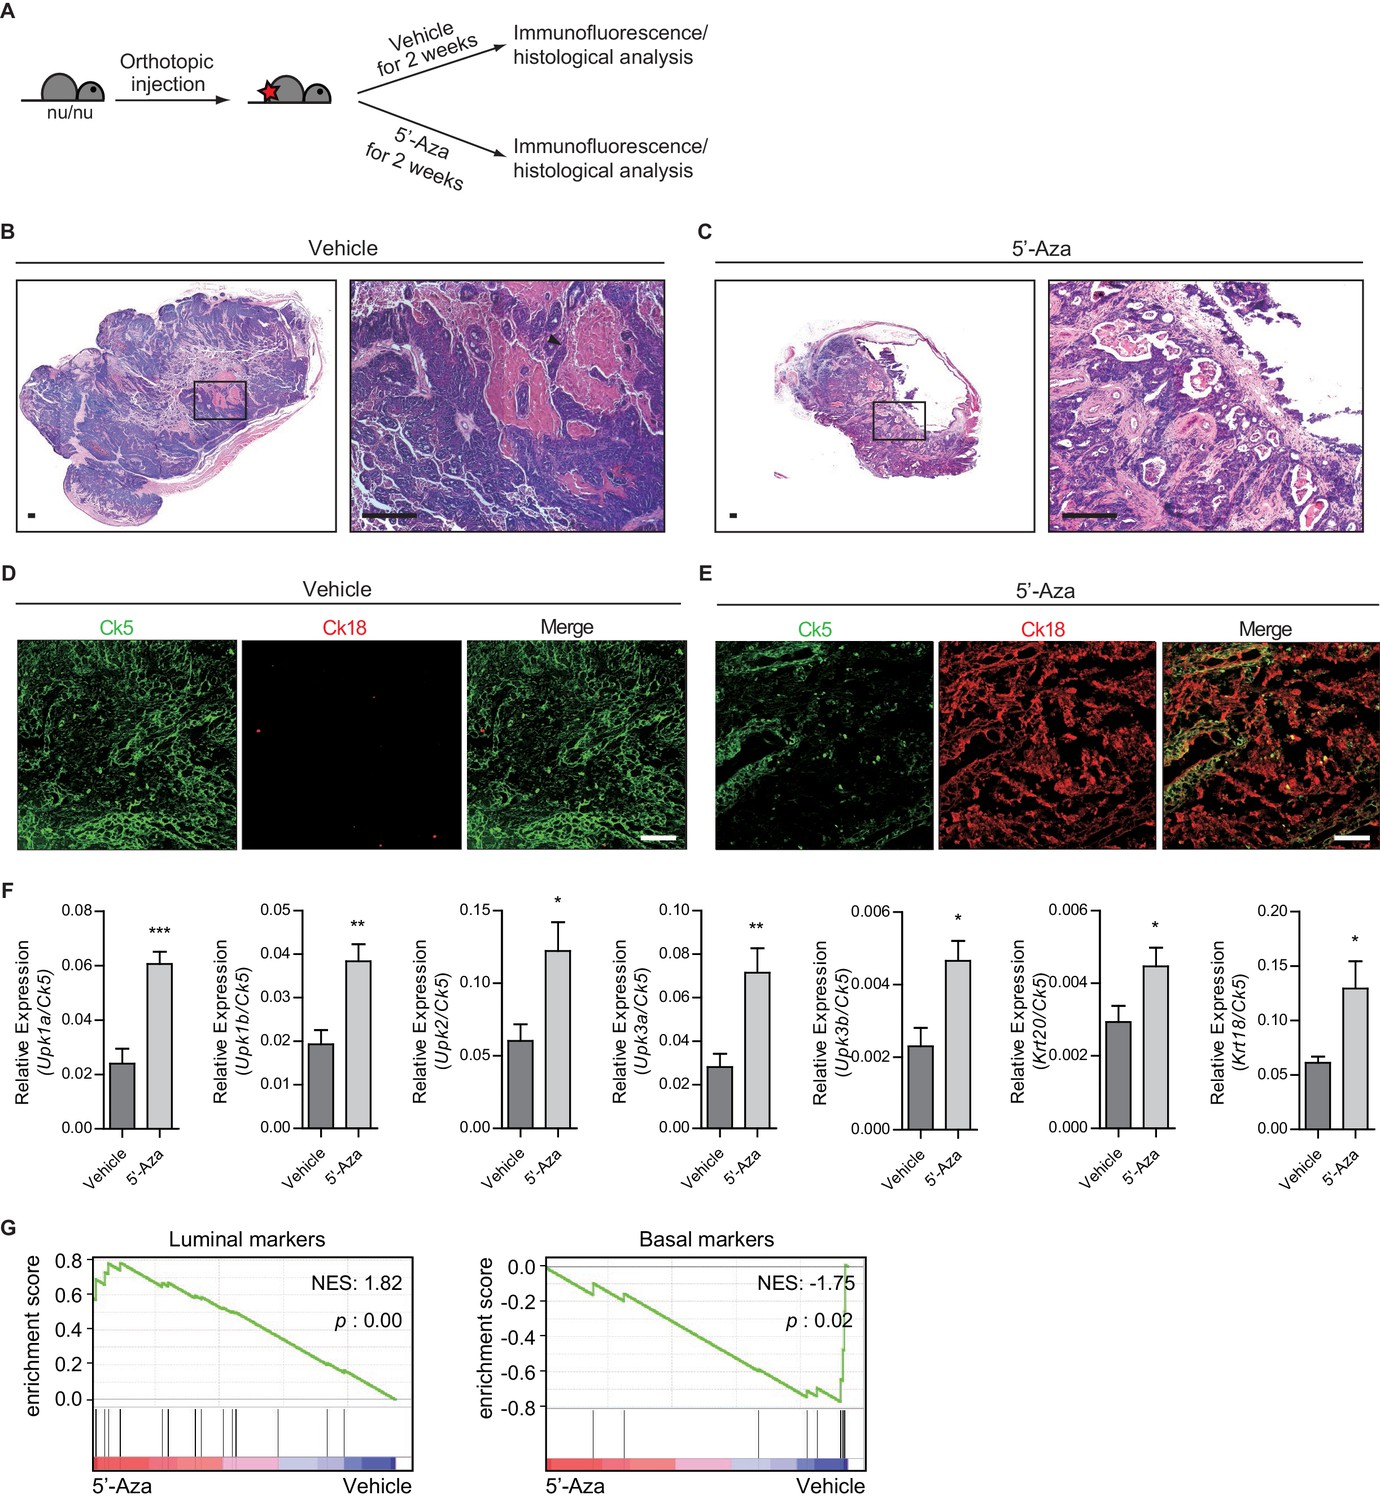
(A) Schematic diagrams of experimental strategies for evaluating the effect of DNMT inhibition on the growth of bladder cancer under immunocompromised conditions. Nude mice (14 animals in total) orthotopically injected with BBN-induced bladder tumor cells were treated with the vehicle control (seven animals) or 5’-azacitidine (seven animals) for 2 weeks. (B, C) H and E staining of allograft sections from mice treated with the vehicle control (B) or 5’-azaciditine (C) is shown in the left panels. Right panels show magnified views of the boxed regions in the left panels. Arrowhead in the high-magnification image indicates the region of squamous differentiation. Scale bars represent 150 µm. (D, E) Sections of tumor allografts from mice injected the vehicle control (D) or 5’-azacitidine (E) were immunostained for the basal and luminal markers, Ck5 (green) and Ck18 (red), respectively. Scale bars represent 100 μm. (F) Expression of the luminal markers, Upk1a (3-fold increase), Upk1b (2-fold increase), Upk2 (2-fold increase), Upk3a (2.5-fold increase), Upk3b (2-fold increase), Krt20 (1.5-fold increase), and Krt18 (2-fold increase) in tumor allografts from mice with the vehicle control or 5’-azaciditine treatment. Gene expression was normalized to a basal marker (Krt5). Data are presented as the mean ± SEM, and significance was calculated with an unpaired Student’s t test (*, p<0.05; **, p<0.01; ***, p<0.001). n = 3 technical replicates, and the entire experiment was repeated six times. (G) Gene set enrichment analysis (GSEA) of tumor allografts treated with the vehicle control (shown in panel B) and 5’-azacitidine (shown in panel C) from RNA-Seq data using standard luminal and basal signatures obtained from previous studies. Normalized enrichment score (NES) and nominal p-value (p) were provided from GSEA accordingly. See also Figure 4—figure supplement 1 and Figure 4—source data 1.
-
Figure 4—source data 1
Relative expression of the luminal markers to a basal marker in tumor allografts from mice with 5’-azaciditine treatment.
- https://doi.org/10.7554/eLife.43024.012
Figure 4—figure supplement 1
Hh signaling to the stroma induces a less aggressive luminal-like subtype of urothelial carcinoma.
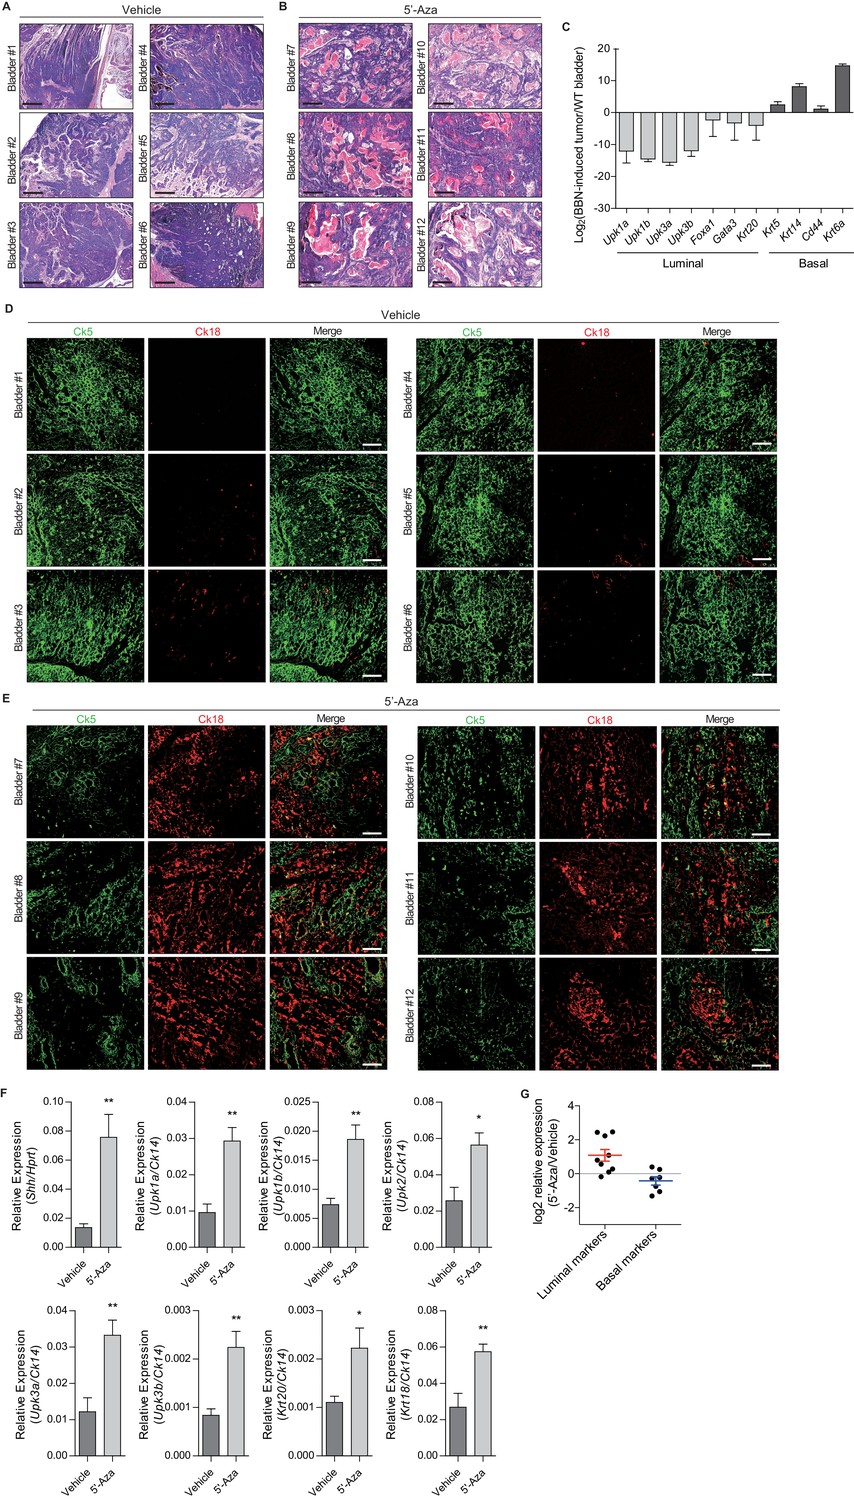
(A, B) Nude mice (twelve different animals) orthotopically injected with BBN-induced bladder tumor cells were treated with the vehicle control (A, bladder #1–6) or 5’-azacitidine (B, bladder #7–12) for 2 weeks. Tumor allografts were analyzed by H and E staining. Scale bars represent 300 µm. (C) Expression of luminal (Upk1a, Upk1b, Upk3a, Upk3b, Foxa1, Gata3 and Krt20) and basal markers (Krt5, Krt14, Cd44 and Krt6a) in BBN-induced bladder tumors compared with normal bladder tissue, showing upregulation of basal markers and downregulation of luminal markers. (D, E) Nude mice (12 different animals) orthotopically injected with BBN-induced bladder tumor cells were treated with the vehicle control (D, bladder #1–6) or 5’-azacitidine (E, bladder #7–12) for 2 weeks. Sections of the tumor allografts were immunostained for the basal and luminal markers, Ck5 (green) and Ck18 (red), respectively. Scale bars represent 100 µm. (F) Expression of Shh and luminal markers, Upk1a (3-fold increase), Upk1b (2.5-fold increase), Upk2 (2.5-fold increase), Upk3a (2.5-fold increase), Upk3b (3-fold increase), Krt20 (2-fold increase), and Krt18 (2-fold increase) in tumor allografts from mice with the vehicle control or 5’-azaciditine. Gene expression was normalized to a basal marker (Krt14). Significance was calculated with an unpaired Student’s t test (*, p<0.05; **, p<0.01). n = 3 technical replicates, and the entire experiment was repeated six times. (G) Expression changes of representative luminal and basal markers in 5’-azacitidine-treated tumor allografts compared with the vehicle control treated allografts from RNA-Seq data (log2 scale). Data are presented as the mean ± SEM.
Figure 5 with 3 supplements
Subtype conversion of basal to luminal-like urothelial carcinoma requires Hh and BMP signaling feedback between the tumor and stroma.
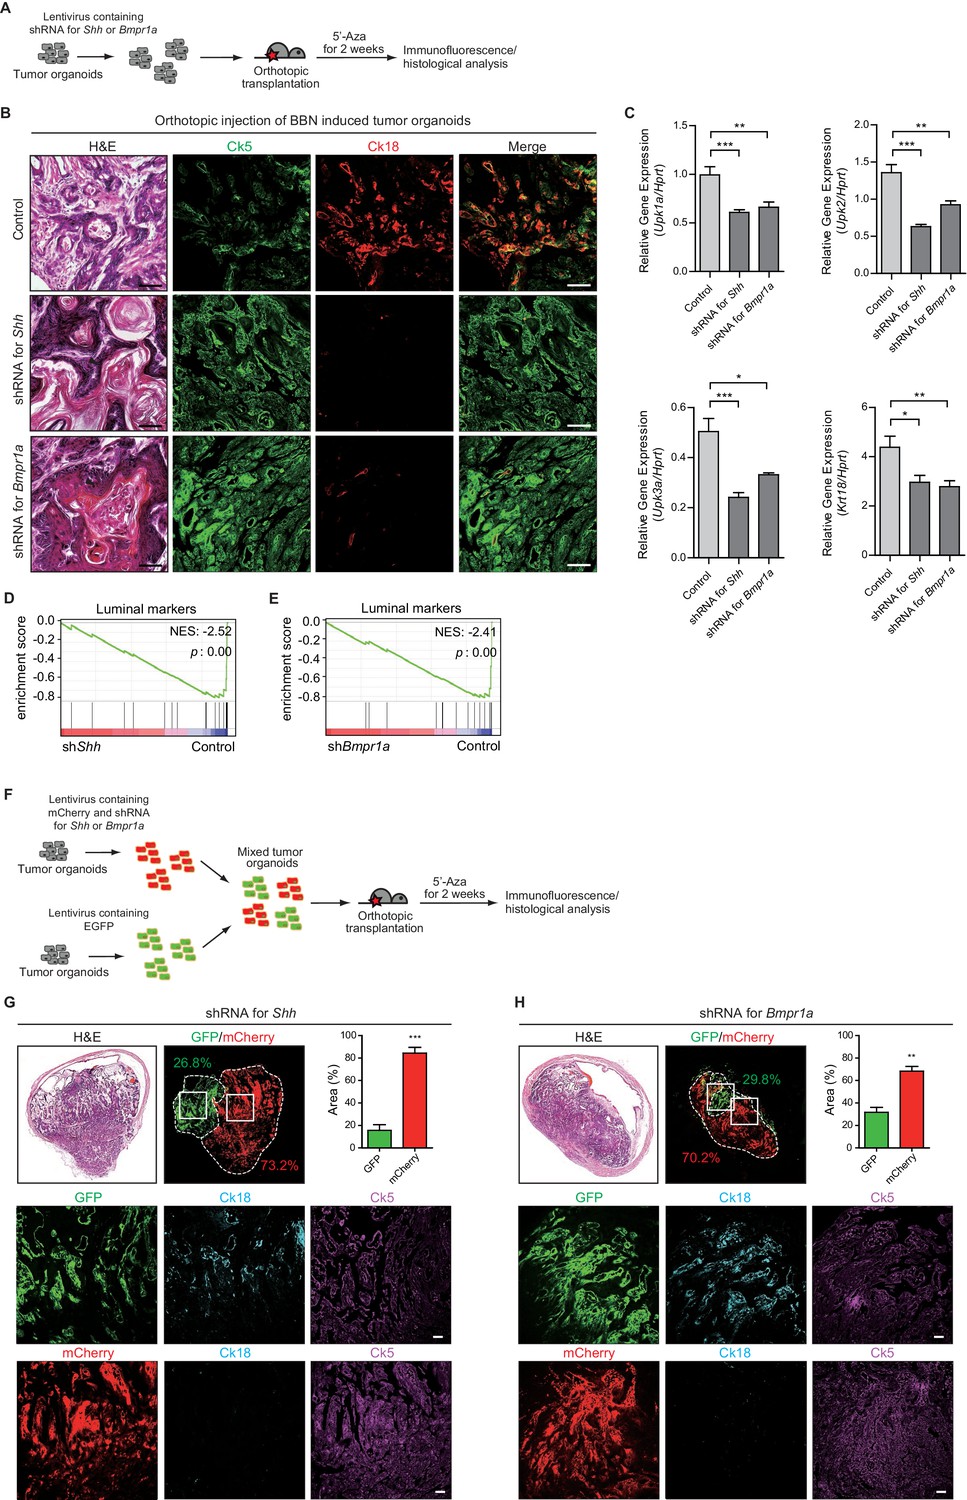
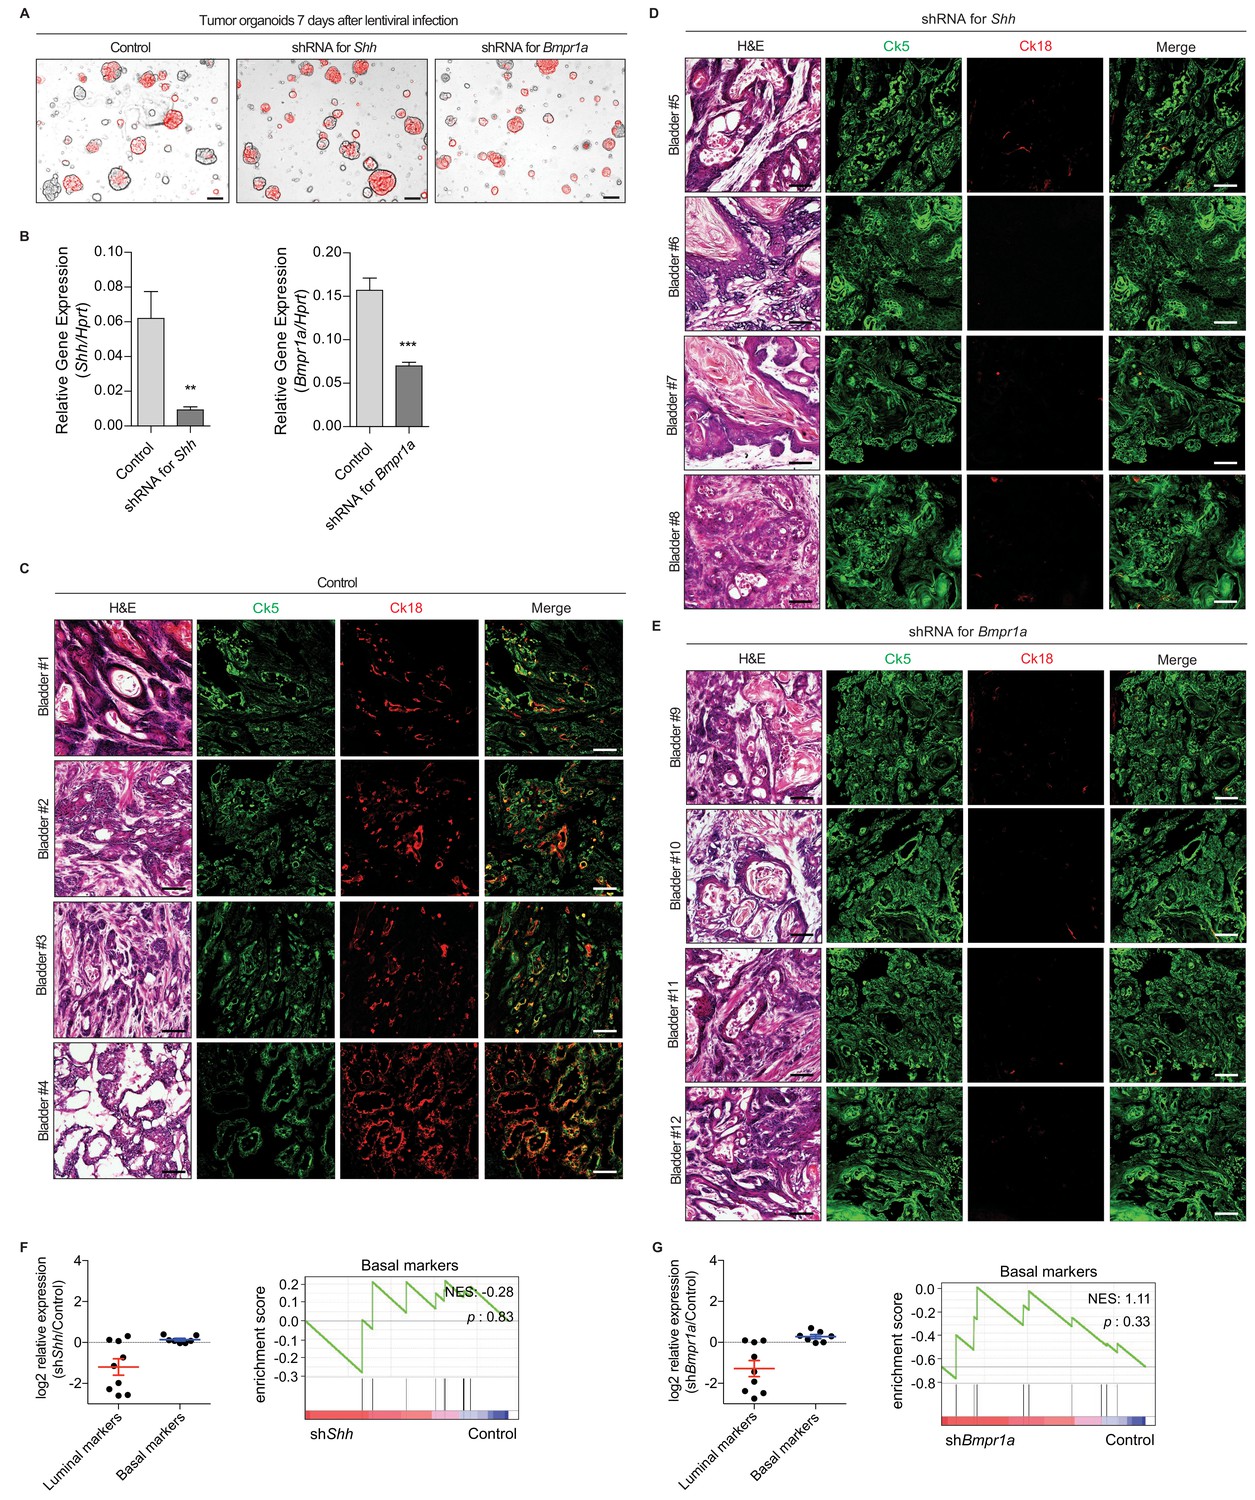
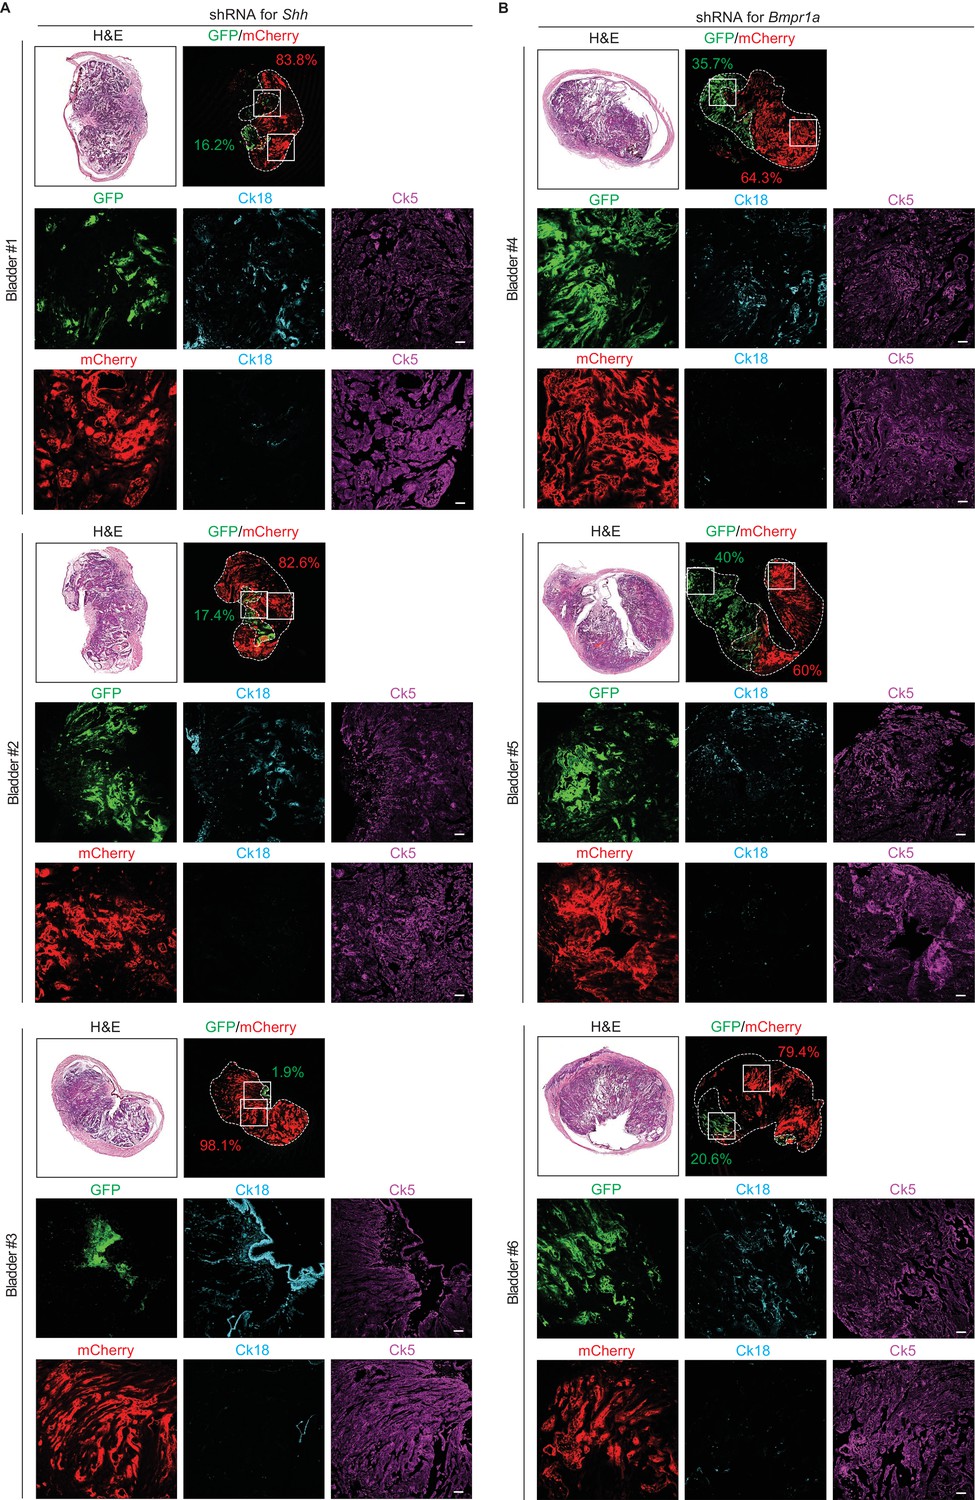
(A) Tumor organoids derived from BBN-induced bladder tumors were infected using a lentivirus containing shRNA targeting Shh or Bmpr1a. The resulting organoids were injected intramurally into the dome of the bladder, and the mice (15 animals in total) were treated with 5’-azacitidine for 2 weeks. (B) Sections of allografts from mice orthotopically injected with control tumor organoids (upper panels, five animals), organoids with shRNA targeting Shh (middle panels, five animals) or organoids with shRNA targeting Bmpr1a (lower panels, five animals) were stained with H and E. Serial sections were immunostained for Ck5 (green) and Ck18 (red). Arrowheads indicate regions of squamous differentiation. Scale bars represent 100 μm. (C) Expression of the luminal markers, Upk1a (shRNA for Shh, 1.6-fold decrease; shRNA for Bmpr1a, 1.5-fold decrease), Upk2 (shRNA for Shh, 2-fold decrease; shRNA for Bmpr1a, 1.5-fold decrease), Upk3a (shRNA for Shh, 2 -fold decrease; shRNA for Bmpr1a, 1.6-fold decrease), and Krt18 (shRNA for Shh, 1.5-fold decrease; shRNA for Bmpr1a, 1.5-fold decrease) in tumor allografts from mice injected with control tumor organoids or tumor organoids carrying shRNA targeting Shh or Bmpr1a. Data are presented as the mean ± SEM, and significance was calculated with an unpaired Student’s t test (*, p<0.05; **, p<0.01; ***, p<0.001). n = 3 technical replicates, and the entire experiment was repeated five times. (D, E) Gene set enrichment analysis (GSEA) of tumor allografts expressing control shRNA and shRNA targeting Shh (D), or shRNA targeting Bmpr1a (E) from RNA-Seq data using standard luminal signatures obtained from previous study. Normalized enrichment score (NES) and nominal p-value (p) were provided from GSEA accordingly. (F) Tumor organoids were infected using a lentivirus containing control shRNA with EGFP or shRNA targeting Shh or Bmpr1a with mCherry. The same number of each resulting organoids were picked manually, mixed and orthotopically transplanted into the nude mice. The mice (eight animals in total) were then treated with 5’-azacitidine for 2 weeks. (G, H) Sections of allografts from mice orthotopically injected with mixed organoids (G, organoid with shRNA targeting Shh, four animals; H, organoids with shRNA targeting Bmpr1a, four animals) were analyzed by H and E staining or by immunostaining for EGFP, mCherry, Ck18 (cyanine, pseudo) and Ck5 (magenta, pseudo). EGFP or mCherry-positive tumor areas are outlined with dotted lines, and each area was measured and quantified using the Image J program. The middle and lower panels represent magnified views of the boxed regions in the upper panels. Scale bars represent 50 μm. Data are presented as the mean ± SEM, and significance was calculated with an unpaired Student’s t test. (**, p<0.01; ***, p<0.001). n = 4 biological replicates. See also Figure 5—figure supplements 1, 2 and 3 and Figure 5—source data 1.
-
Figure 5—source data 1
Expression of the luminal markers in tumor allografts expressing shRNA targeting Shh, or Bmpr1a, and the quantification of EGFP (expressing control shRNA), or mCherry (expressing shRNA for Shh or Bmpr1a)-positive tumor areas.
- https://doi.org/10.7554/eLife.43024.017
Figure 5—figure supplement 1
Subtype conversion of basal to luminal-like urothelial carcinoma requires Hh and BMP signaling feedback.
(A) In vitro culture of bladder tumor organoids infected with a lentivirus carrying shRNA targeting Shh or Bmpr1a with mCherry. (B) Expression of Shh or Bmpr1a in mouse bladders transplanted with tumor organoids expressing shRNA targeting Shh or Bmpr1a in the presence of 5’-azacitidine. Data are presented as the mean ± SEM, and significance was calculated with an unpaired Student’s t test (**, p<0.01; ***, p<0.001). n = 3 technical replicates, and the entire experiment was repeated three times. (C, D, E) Tumor organoids derived from BBN-induced bladder tumor were infected using a lentivirus containing shRNA targeting Shh or Bmpr1a. The resulting organoids were injected intramurally into the dome of the bladder, and the mice were treated with 5’-azacitidine for 2 weeks. Sections of allografts from mice orthotopically injected with control tumor organoids (C, bladder #1–4), organoids carrying shRNA targeting Shh (D, bladder #5–8) or organoids carrying shRNA targeting Bmpr1a (E, bladder #9–12) were stained with H and E. Serial sections were immunostained for Ck5 (green) and Ck18 (red). Scale bars represent 100 µm. (F, G) Expression changes of representative luminal and basal markers in tumor allografts expressing control shRNA compared with tumors expressing shRNA targeting Shh (F), or shRNA targeting Bmpr1a (G) from RNA-Seq data (log2 scale). Data are presented as the mean ± SEM. Gene set enrichment analysis (GSEA) of tumor allografts expressing control shRNA and shRNA targeting Shh (F), or shRNA targeting Bmpr1a (G) from RNA-Seq data using standard basal signatures obtained from previous study. Normalized enrichment score (NES) and nominal p-value (p) were provided from GSEA accordingly.
Figure 5—figure supplement 2
Slow tumor growth and subtype conversion require heightened Hh/BMP signaling feedback between the tumor and stroma.
(A, B) Tumor organoids were infected with a lentivirus containing control shRNA with EGFP or shRNA targeting Shh or Bmpr1a with mCherry. The same number of each resulting organoids were picked manually, mixed and orthotopically transplanted into the nude mice. The mice were then treated with 5’-azacitidine for 2 weeks. Sections of allografts from mice orthotopically injected with mixed organoids (A, bladder #1–3, organoid with shRNA targeting Shh; B, bladder #4–6, organoids with shRNA targeting Bmpr1a) were analyzed by H and E staining or by immunostaining for EGFP, mCherry, Ck18 (cyanine, pseudo) and Ck5 (magenta, pseudo). EGFP- or mCherry-positive tumor areas are outlined with dotted lines and each area was measured and quantified using the Image J program. Scale bars represent 50 µm.
Figure 5—figure supplement 3
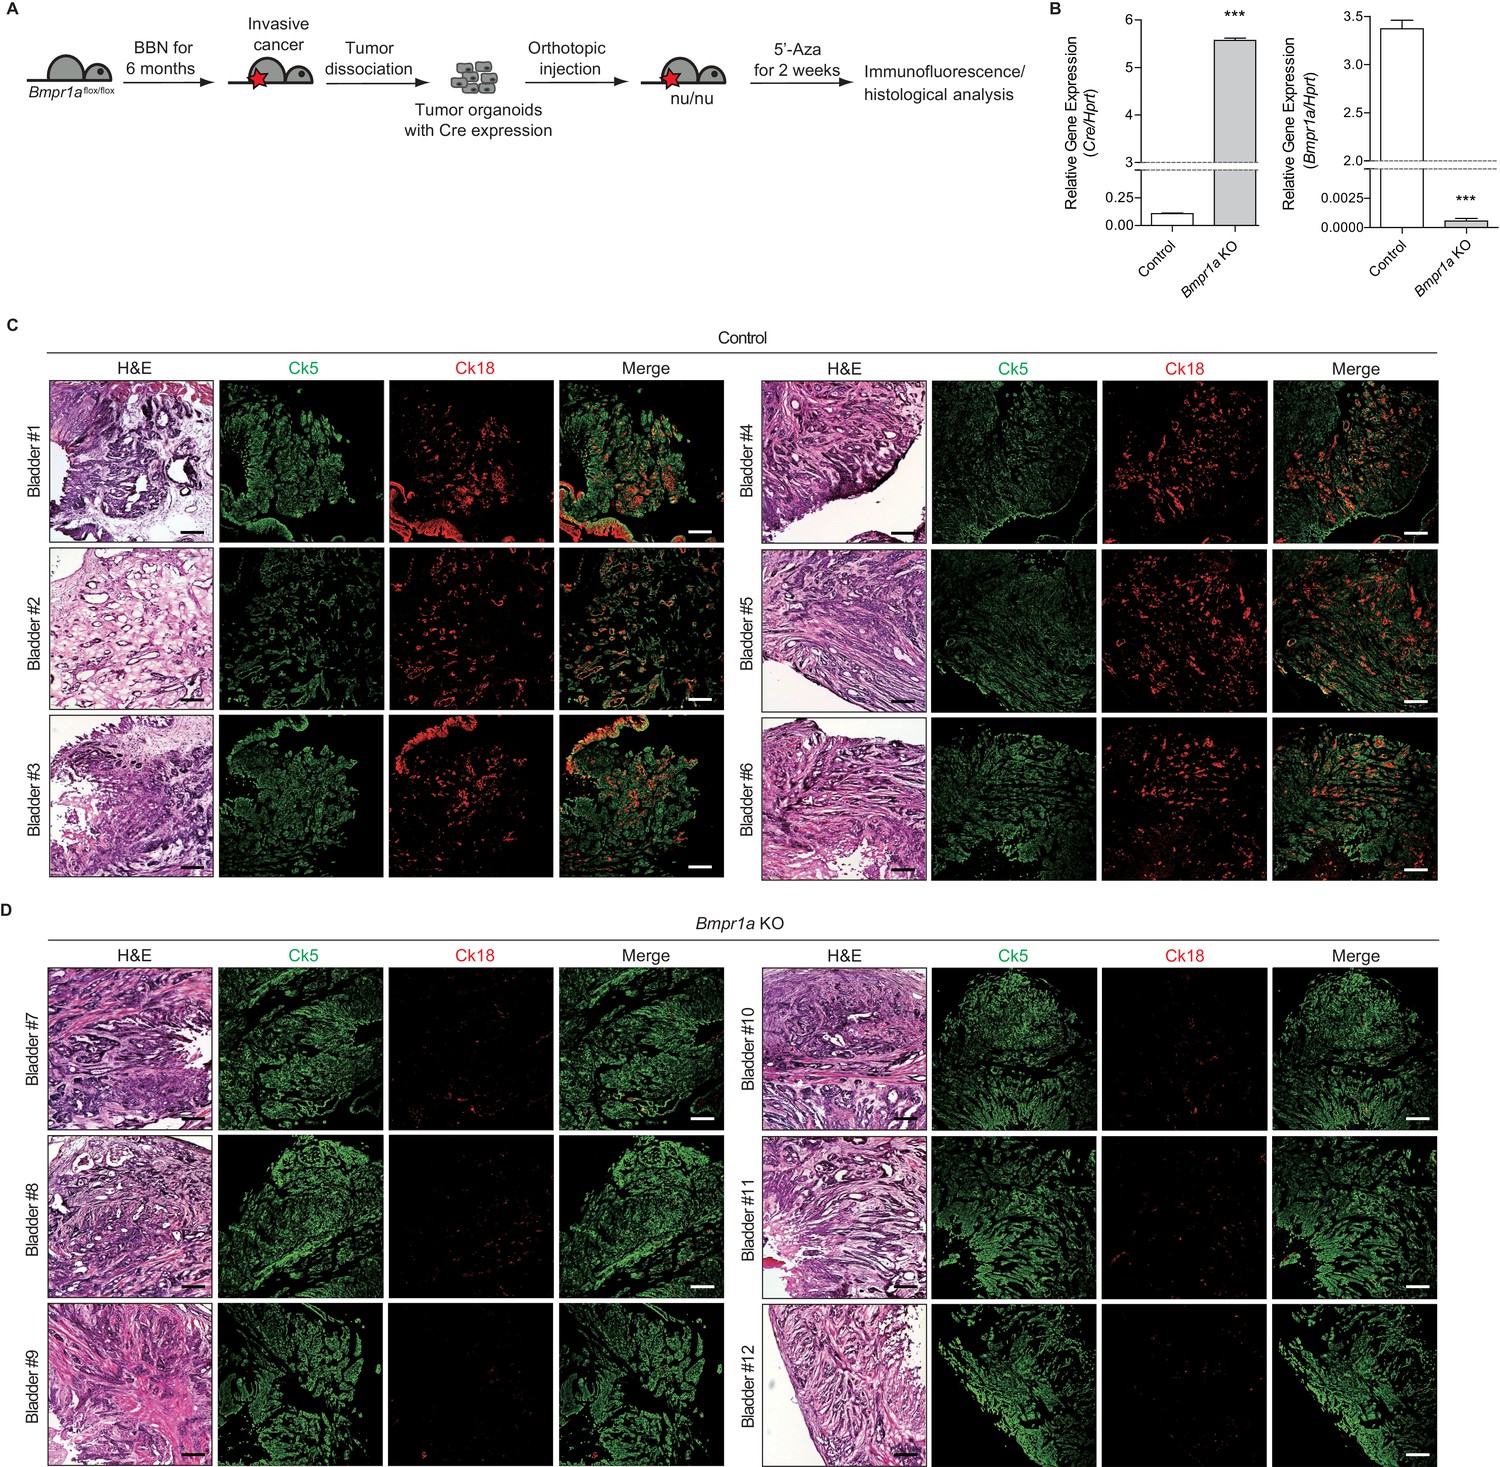
Blockade of BMP signaling impedes subtype conversion of urothelial carcinoma.
(A) Bmpr1aflox/flox organoids infected with lentivirus containing Cre recombinase were orthotopically transplanted into nude mice (twelve different animals). Mice were treated with 5’-azacitidine for 2 weeks. (B) Quantitative RT-PCR data for the expression of Cre and Bmpr1a mRNA in Bmpr1aflox/flox tumor organoids infected with lentiviral Cre. Data are presented as the mean ± SEM, and significance was calculated with an unpaired Student’s t test (***, p<0.001). n = 3 technical replicates, and the entire experiment was repeated three times. (C, D) Sections of allografts from mice orthotopically injected with control tumor organoids (C, bladder #1–6) or organoids with Cre expression (D, bladder #7–12) were stained with H and E. Serial sections were immunostained for Ck5 (green) and Ck18 (red). Scale bars represent 200 µm.
Figure 6 with 1 supplement
Increased methylation of the SHH gene induces the basal subtype of human urothelial carcinoma through decreased activity of Hh/BMP signaling feedback between cancer cells and the tumor stroma.
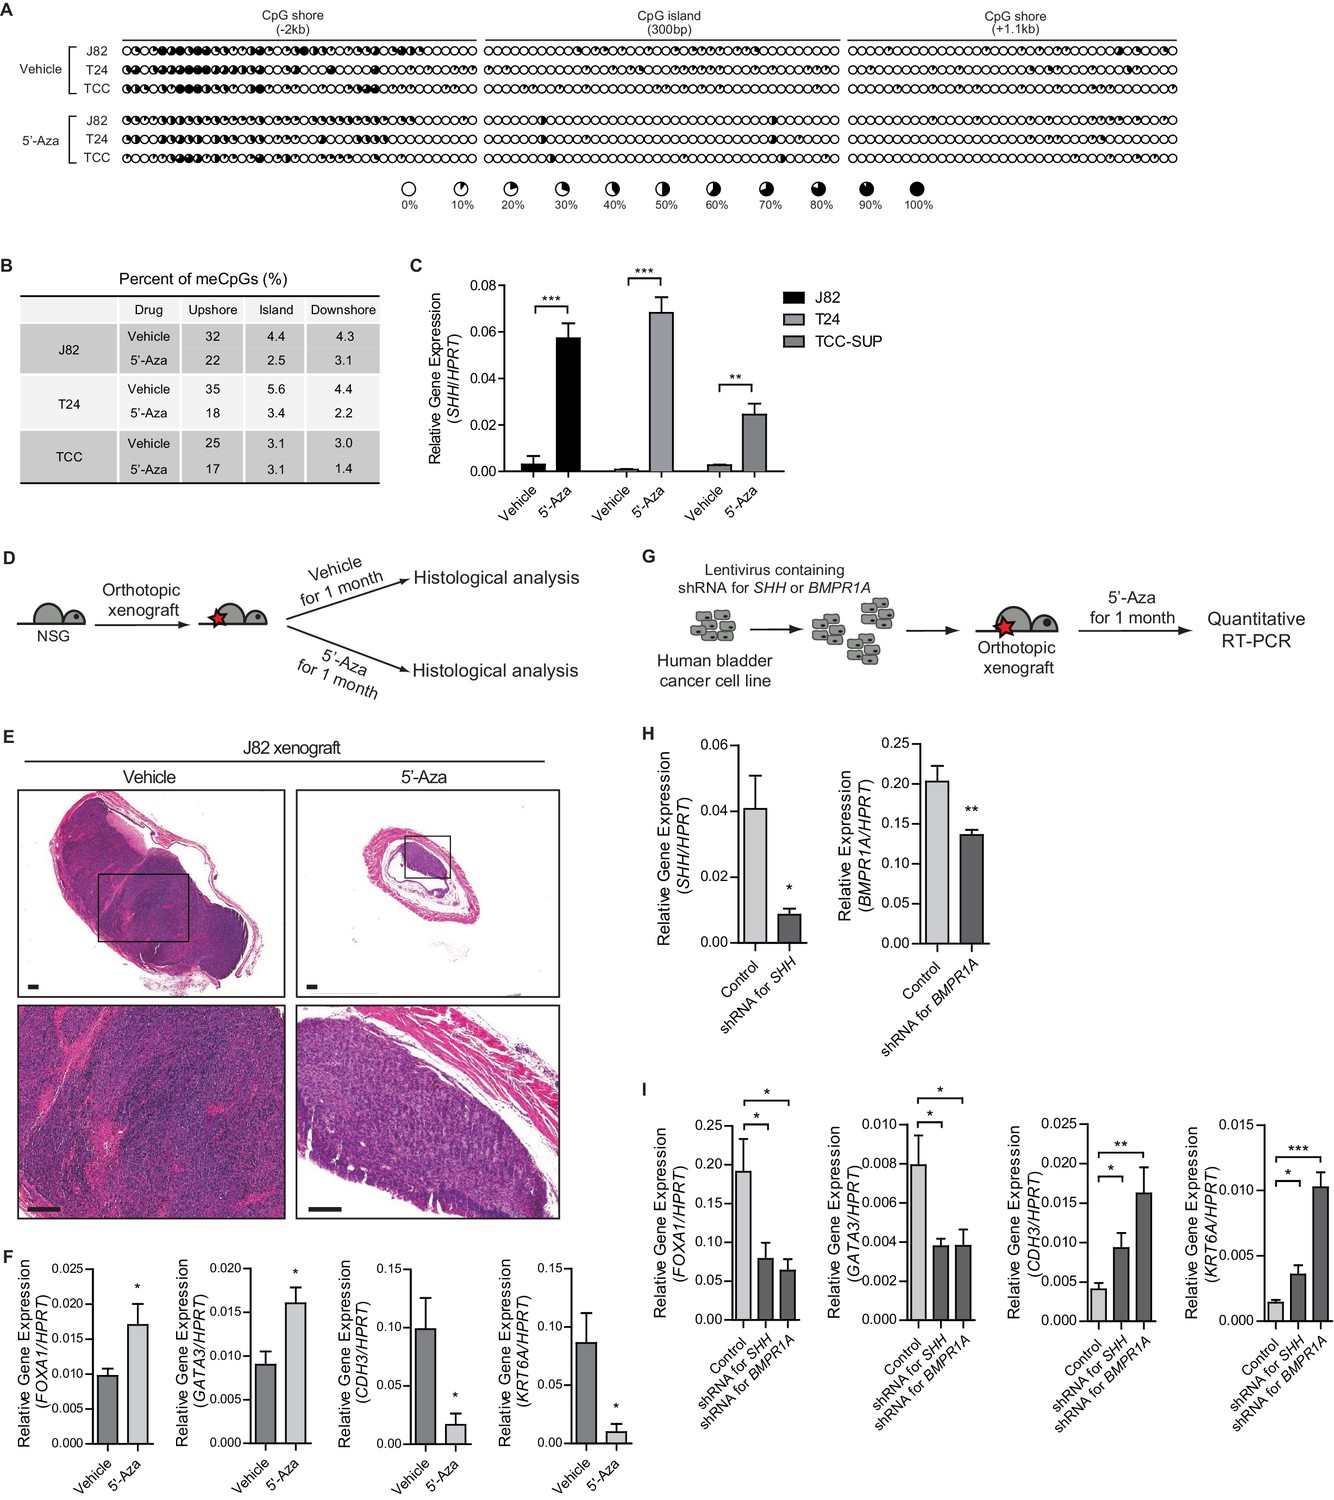
(A) The methylation status of the CpG island and CpG shore regions of the human SHH gene was analyzed by bisulfite sequencing in three human invasive urothelial carcinoma cell lines, J82, T24, and TCC-SUP with or without 5’-azacitidine treatment. Each circle represents one of 117 CpG sites, and the average degree of methylation is indicated by the black portion of the white circle. (B) The results obtained from bisulfite sequencing analysis of (A) are summarized. (C) Expression of SHH in J82, T24, and TCC-SUP treated with 5’-azacitidine (J82, 6-fold increase; T24, 7-fold increase; TCC-SUP, 3-fold increase) compared to that of untreated controls. Data are presented as the mean ± SEM, and significance was calculated with an unpaired Student’s t test (**, p<0.01; ***, p<0.001). n = 3 technical replicates, and the entire experiment was repeated three times. (D) Orthotopic xenograft of J82 cells in immunocompromised (NOD/SCID/IL2Rgnull) mice (14 animals in total), followed by 5’-azacitidine treatment for 1 month. (E) H and E staining of orthotopic xenograft sections from mice treated with the vehicle control (left panels, seven animals) or 5’-azaciditine (right panels, seven animals). The lower panels show magnified views of the boxed regions in the upper panels. Scale bars represent 300 µm. (F) Expression of the luminal markers, FOXA1 (1.8-fold increase) and GATA3 (1.8-fold increase), and the basal markers, CDH3 (6-fold decrease) and KRT6A (9-fold decrease) in tumor xenografts from mice treated with 5’-azacitidine compared to those of the vehicle control. Data are presented as the mean ± SEM, and significance was calculated with an unpaired Student’s t test (*, p<0.05). n = 3 technical replicates, and the entire experiment was repeated six times. (G) The J28 cell line was infected using a lentivirus containing shRNA targeting SHH or BMPR1A. The resulting cell line was orthotopically xenografted into the dome of the bladder, and the mice were treated with 5’-azacitidine for 1 month. (H) Expression of SHH or BMPR1A in tumor xenografts from mice injected with J82 carrying shRNA targeting SHH or BMPR1A, respectively. Data are presented as the mean ± SEM, and significance was calculated with an unpaired Student’s t test (*, p<0.05; **, p<0.01). (I) Expression of the luminal markers, FOXA1 (shRNA for SHH, 2.5-fold decrease; shRNA for BMPR1A, 3-fold decrease) and GATA3 (shRNA for SHH, 2-fold decrease; shRNA for BMPR1A, 2-fold decrease), and the basal markers, CDH3 (shRNA for SHH, 2.3-fold increase; shRNA for BMPR1A, 4-fold increase) and KRT6A (shRNA for SHH, 2.5-fold increase; shRNA for BMPR1A, 7.2-fold increase) in tumor xenografts from mice injected with control J82 or J82 carrying shRNA targeting SHH or BMPR1A. n = 3 technical replicates, and the entire experiment was repeated six times. Data are presented as the mean ± SEM, and significance was calculated with an unpaired Student’s t test (*, p<0.05; **, p<0.01; ***, p<0.001). See also Figure 6—figure supplement 1A,B,C and Figure 6—source data 1.
-
Figure 6—source data 1
Expression of SHH, luminal and basal markers in bladder tumor cell lines and in tumor xenografts from mice treated with 5’-azacitidine, or expressing shRNA for SHH or BMPR1A.
- https://doi.org/10.7554/eLife.43024.020
Figure 6—figure supplement 1
Expression analyses of patient samples and large-scale transcriptional data suggest that the decreased methylation of the CpG shore of the human SHH promoter region impedes the growth of human urothelial carcinoma by inducing a luminal-like subtype through increased Hh/BMP signaling feedback.
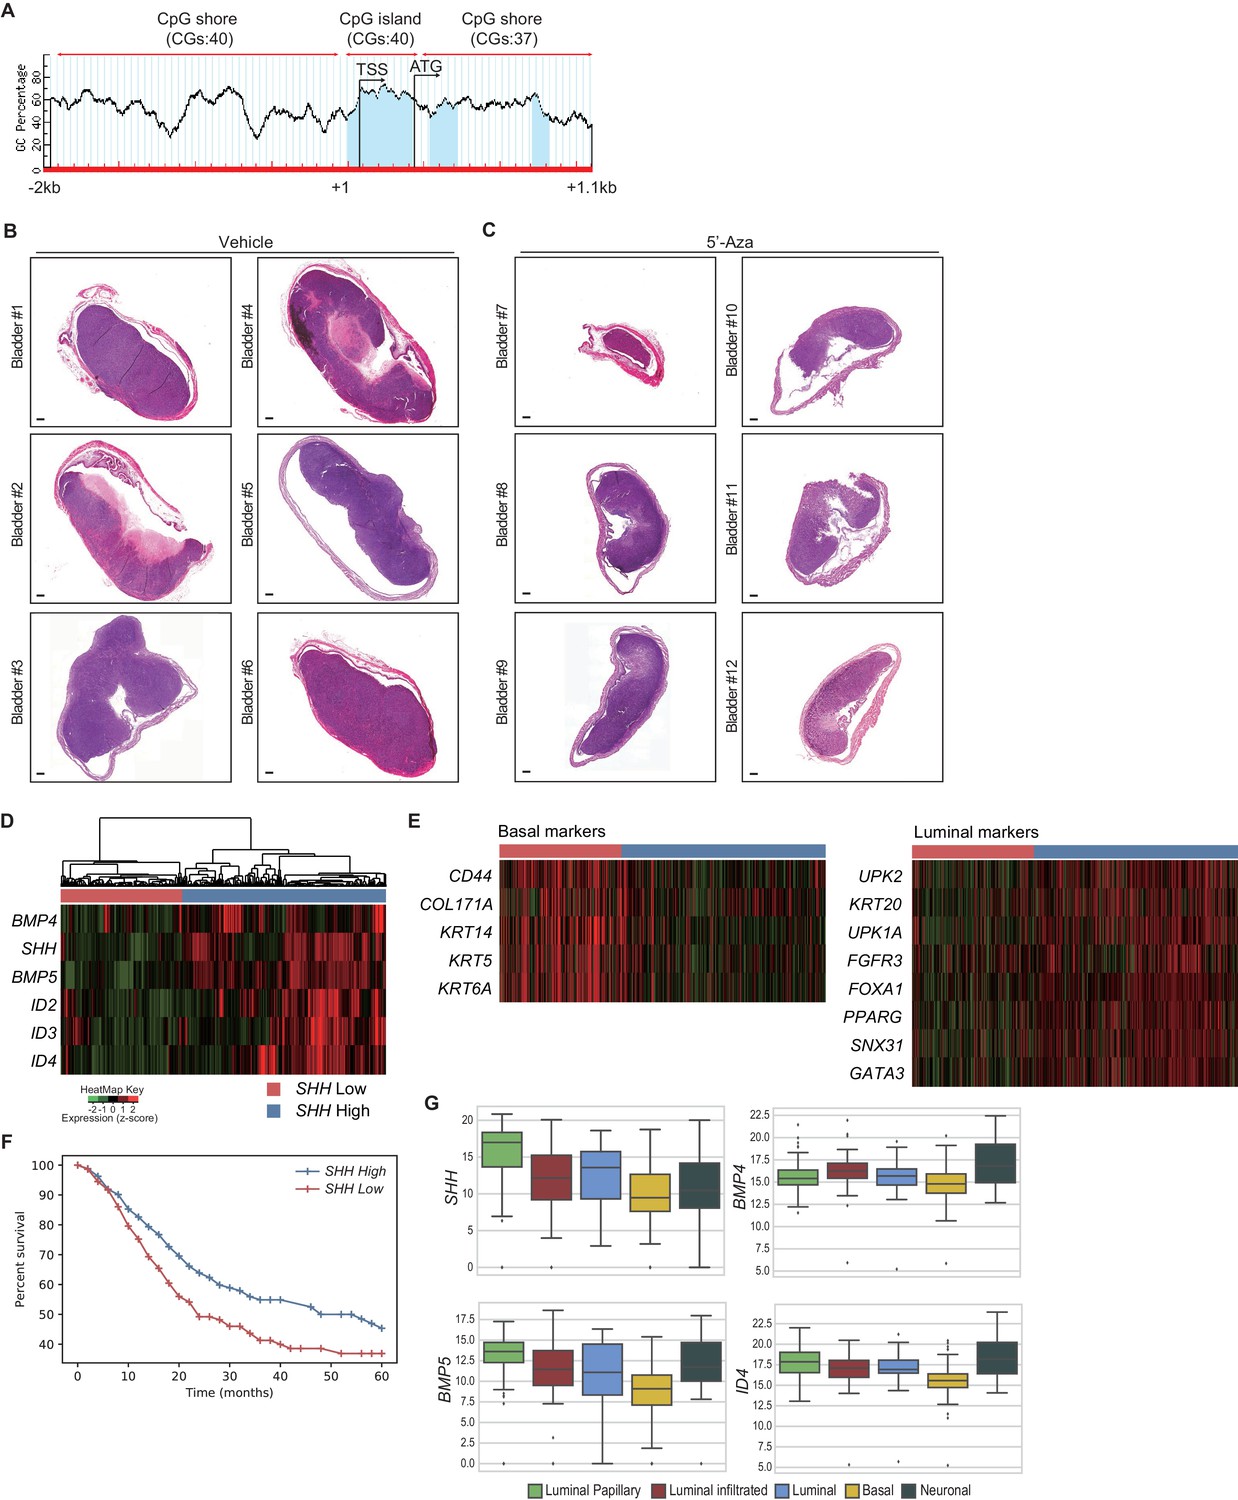
(A) Schematic diagram of the CpG island and flanking shore regions of human SHH. A total of 117 CpG sites were analyzed for methylation status. TSS, transcription start site; CGs, CpG sites; blue areas, CpG-rich region. (B, C) Orthotopic xenograft of J82 cells in immunocompromised (NOD/SCID/IL2Rgnull) mice, followed by 5’-azacitidine treatment for 1 month. H and E staining of orthotopic xenograft sections from mice treated with the vehicle control (B, bladder #1–6) or 5’-azaciditine (C, bladder #7–12). Scale bars represent 300 µm. (D) Stratification of gene expression in RNA-seq data from the TCGA database of muscle-invasive urothelial carcinoma. Heatmap showing the expression levels of SHH, BMP4, BMP5, ID2, ID3 and ID4. Based on unsupervised hierarchical clustering, two subgroups were identified; low SHH (red, n = 147) and high SHH (blue, n = 246). (E) Heatmaps showing the expression of basal and luminal makers in two clusters stratified from (D). (F) Survival analysis of two groups clustered in (D). Low SHH and high SHH are indicated in red and blue, respectively. The low-SHH group exhibited lower median survival (24 months) than the high-SHH group (48 months). Note that the low-SHH group exhibited a significantly shorter life-span than the high SHH group (log rank p<0.0001). (G) Expression of SHH and BMP pathway ligands and targets in five distinct subtypes of muscle-invasive urothelial carcinoma. Data are presented as the median and lower to upper quartile values of the gene expression data: luminal-papillary, n = 142; luminal-infiltrated, n = 78; luminal, n = 26; basal, n = 142; and neuronal, n = 20. Significance was calculated by the Mann-Whitney U test.
Figure 7 with 1 supplement
Expression analysis of patient-derived urothelial carcinomas and large-scale transcriptional analyses.
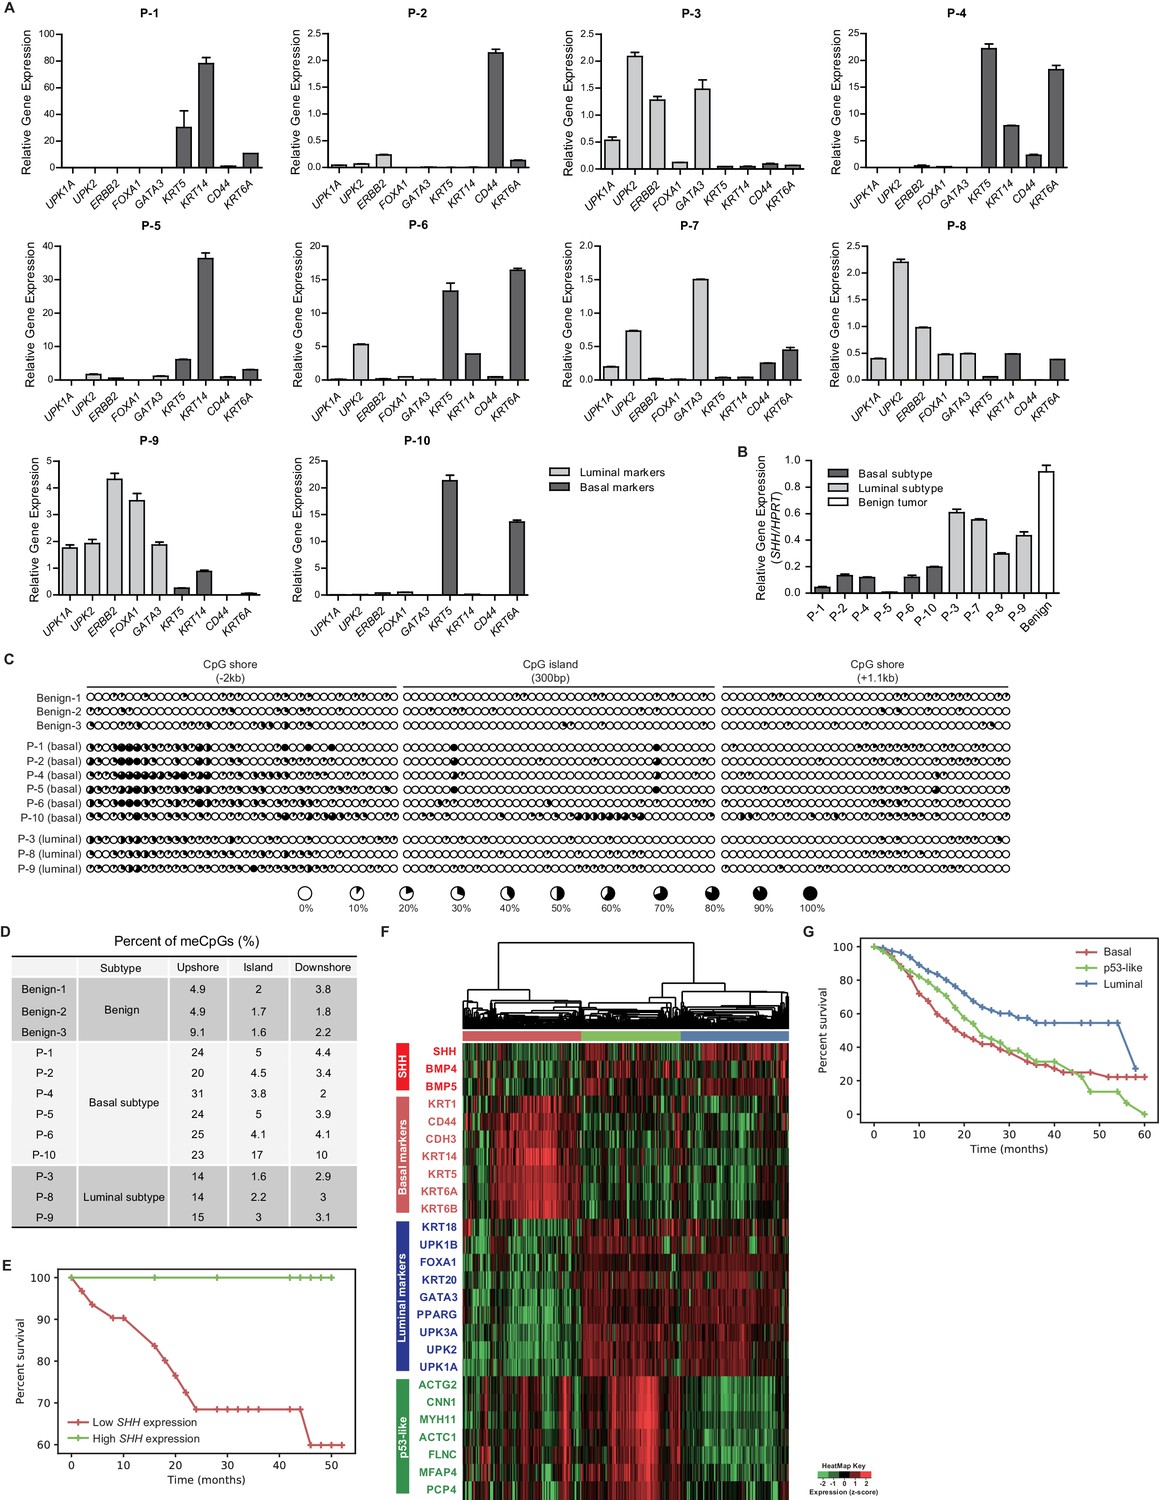
(A) The relative expression of basal (KRT5, KRT14, CD44 and KRT6A) and luminal markers (UPK1A, UPK2, ERBB2, FOXA1 and GATA3) was analyzed in human invasive urothelial carcinomas from 10 patients. Data are presented as the mean ± SEM. n = 3 technical replicates (B) Expression of SHH in benign urothelium (white bar) and two subtypes of invasive urothelial carcinomas (basal, dark grey bars; luminal, light grey bars) from patients. Data are presented as the mean ± SEM. n = 3 technical replicates. (C) The methylation status of the CpG island and CpG shore regions of the human SHH gene was analyzed by bisulfite sequencing in human invasive urothelial carcinoma tissues from patients (three benign tissues, six basal tumors, and three luminal tumors). The average degree of methylation is indicated by the black portion of the white circle. (D) The results obtained from bisulfite sequencing analysis of (C) are summarized. (E) Kaplan-Meier survival curve from a set of 41 patients with muscle-invasive bladder cancer from Seoul National University Hospital. Patients were classified by the expression level of SHH (high in green, n = 10; low in red, n = 31). The high- and low-SHH groups were determined by an SHH/18S value greater or less than 0.288, respectively. (F) Stratification of gene expression in RNA-seq data from the TCGA database of muscle-invasive urothelial carcinoma. Heatmap showing the expression levels (z-score normalized log2 (FPKM +1) values) of SHH, basal markers, luminal markers and p53-like markers. Based on unsupervised hierarchical clustering, three subgroups were identified: basal (red cluster, n = 125), p53-like (green, n = 106) and luminal (blue, n = 118). (G) Survival analysis of patients in the three subgroups. Basal (n = 125), p53-like (n = 106) and luminal (n = 118) subtypes are indicated by red, green and blue, respectively. The basal subtype was associated with lower median survival (27.79 months) than the luminal subtype (40.04 months) and p53-like subtype (28.73 months). Note that the basal subtype exhibited a significantly shorter life-span than the luminal subtype (log rank p<0.0001). See also Figure 6—figure supplement 1D,E,F,G and Tables 1 and 2.
-
Figure 7—source data 1
Expression analysis of patient-derived urothelial carcinomas and large-scale transcriptional analyses.
- https://doi.org/10.7554/eLife.43024.024
Figure 7—figure supplement 1
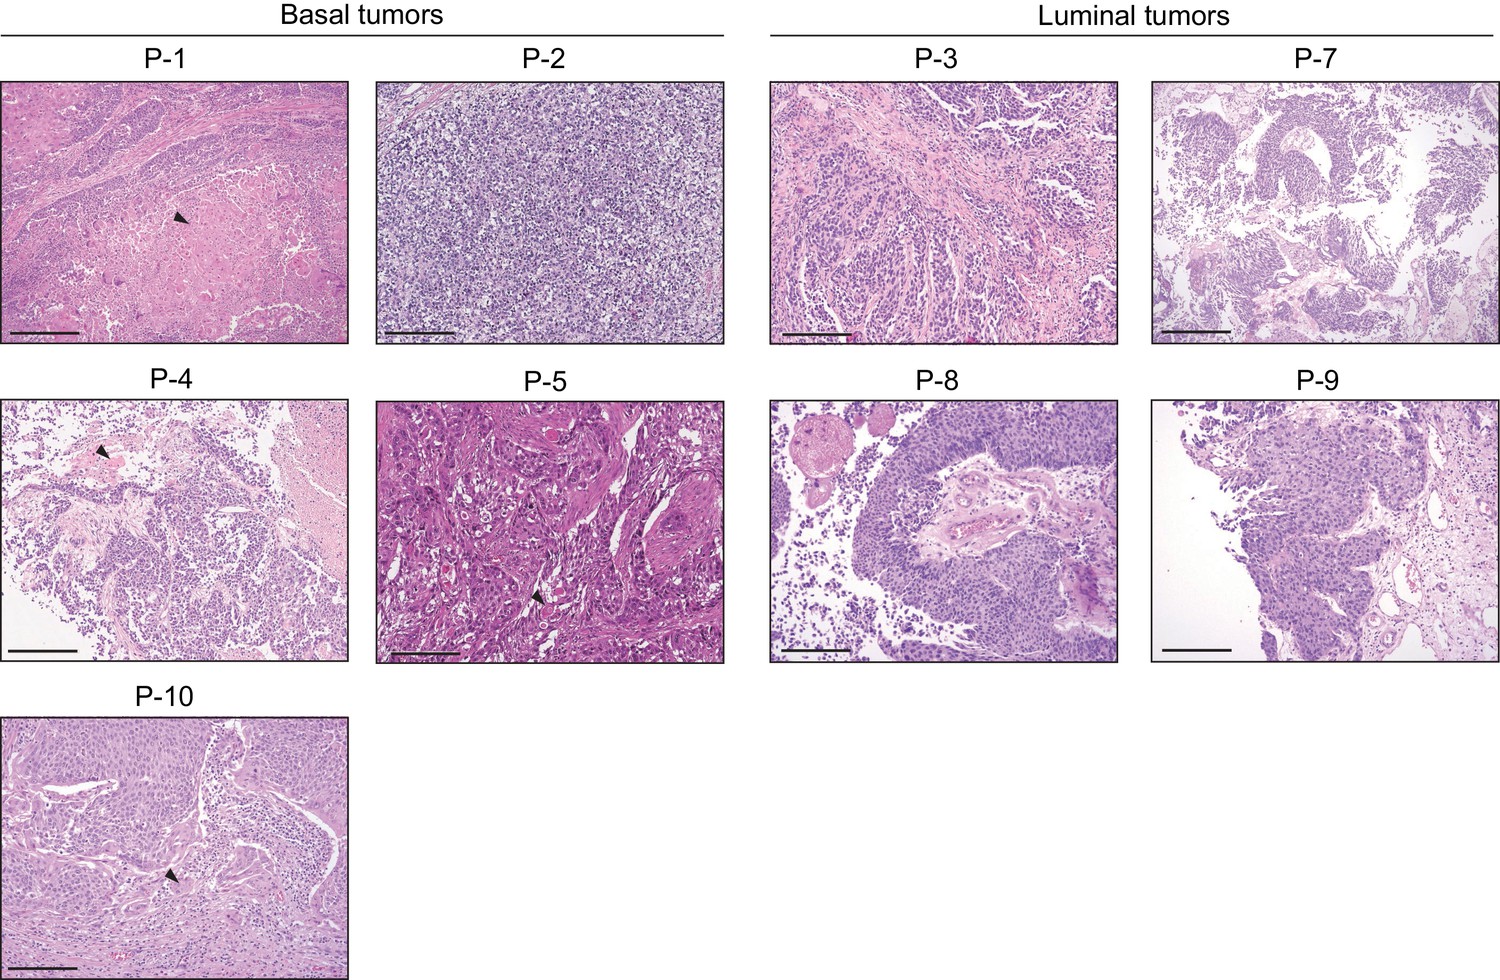
Histopathological analysis of patient-derived urothelial carcinomas.
Human invasive urothelial carcinoma samples used in Figure 7A were stained with H and E (except for P-6). Four of six samples with basal subtype show squamous differentiation as opposed to all of four luminal subtype tumors show no signs of squamous differentiation. Arrowheads indicate regions of squamous differentiation. Scale bars represent 200 µm.
Figure 8
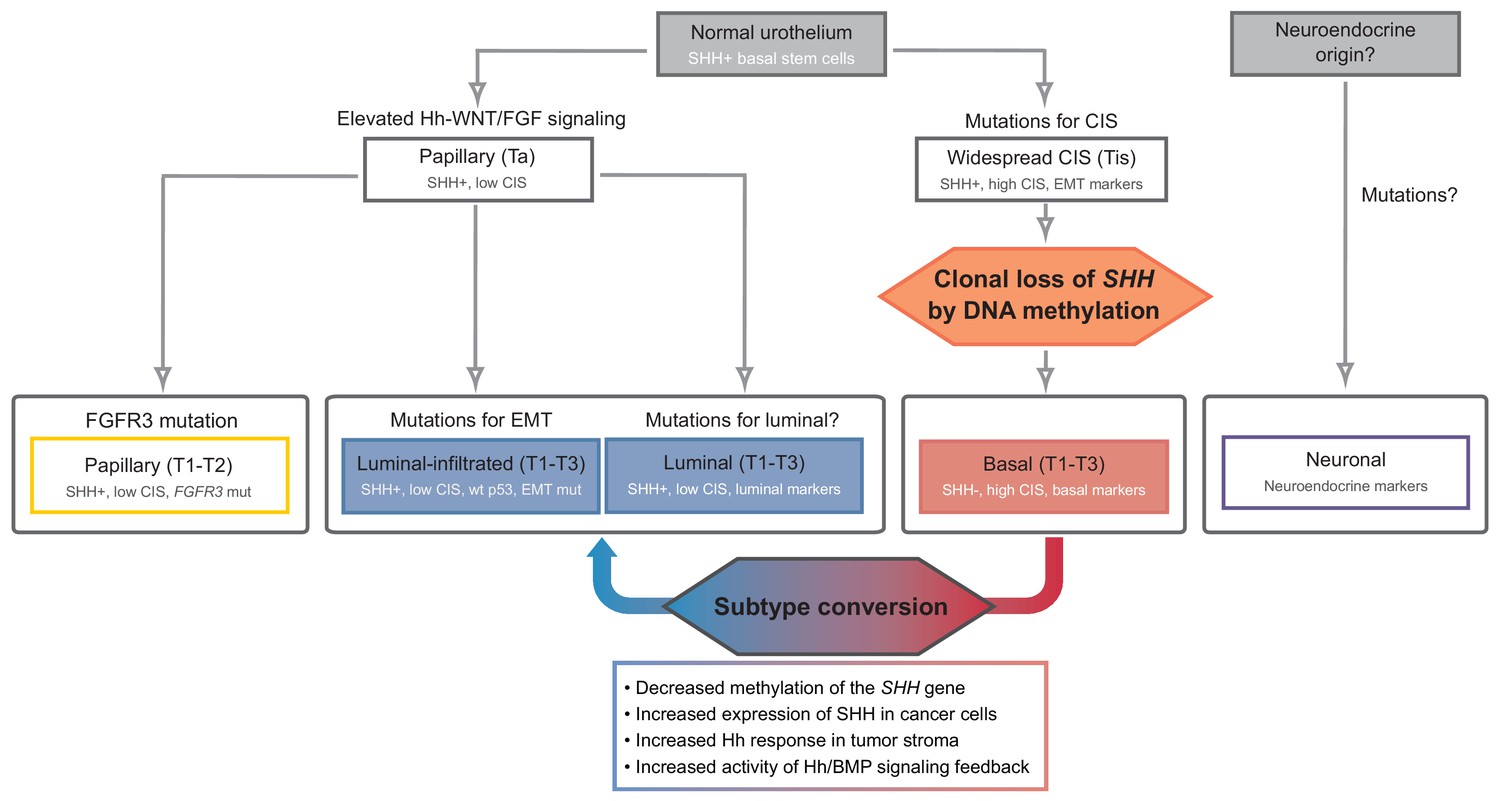
Model of the development of human urothelial carcinoma, progressing from SHH-positive basal stem cells to distinct molecular subtypes.
Clonal loss of SHH expression caused by DNA methylation leads to the suppression of the stromal Hh response, which in turn facilitates the initiation and progression of tumors at early stages, ultimately resulting in the formation of the SHH-negative, basal subtype of invasive carcinoma. Decreased methylation of the SHH gene suppresses tumor growth by inducing subtype conversion from basal to luminal-like urothelial carcinoma through increased activity of Hh/BMP signaling feedback between cancer cells and the tumor stroma. See text.
Author response image 1

Co-culture experiments of tumor organoids with cancer-associated fibroblasts.
(A) Schematic diagram for the experiments designed to demonstrate epithelial-stromal Hh/Bmp feedback loop. (B) Expression of Gli1, Bmp4, and Shh in mouse/human tumor organoids or cancer-associated fibroblasts treated with 5-Aza as described in (A). (C) Schematic diagram for the experiments to test off-target effects of 5-Aza in the stroma. (D) Expression of Shh in mouse/human tumor organoids cultured with or without cancer-associated fibroblasts as described in (C).
Author response image 2
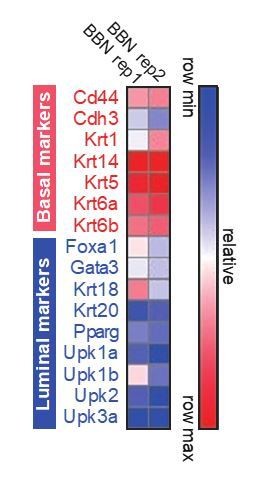
Heat map for the expression of basal and luminal marker genes on BBN-induced bladder tumors.
https://doi.org/10.7554/eLife.43024.032
Author response image 3
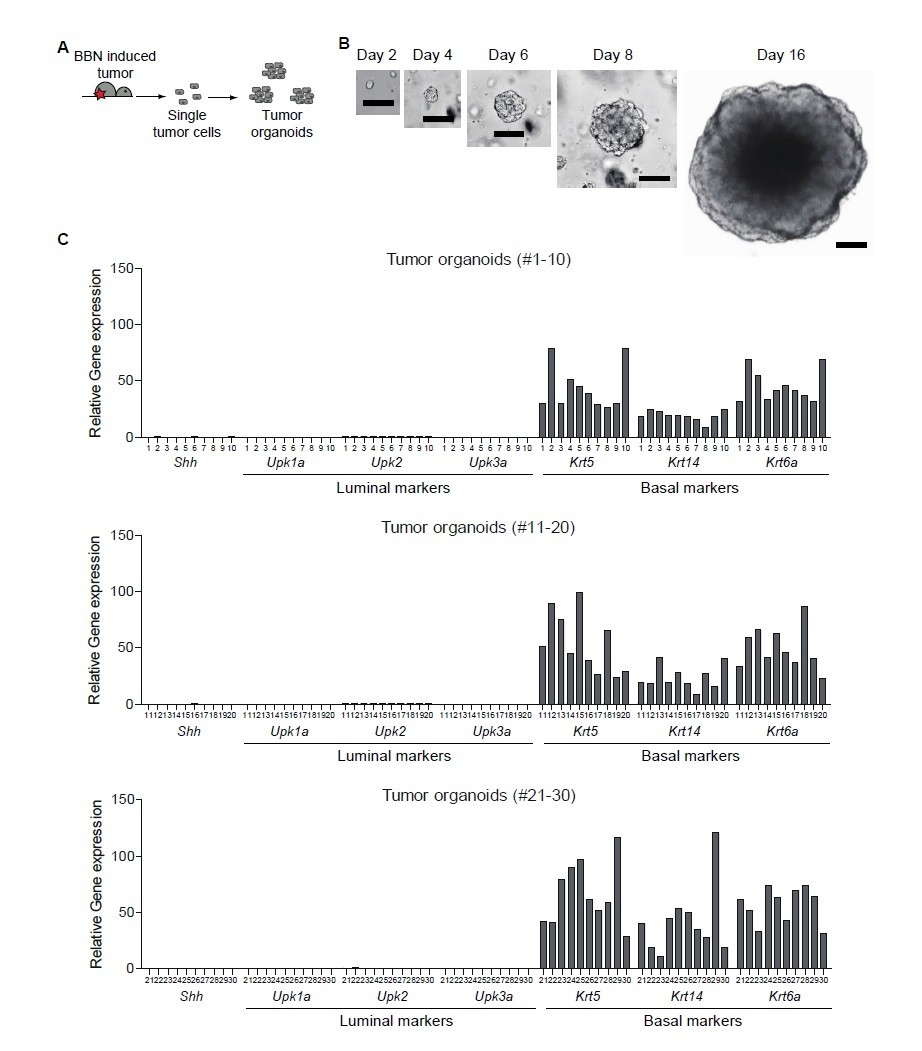
Clonal analysis of BBN-induced bladder tumor.
(A) Schematic diagram of the experiment. (B) Representative images of single cell-derived tumor organoids cultured for 2, 4, 6, 8, and 16 days. (C) Clonal analysis of single cell-derived tumor organoids for luminal and basal subtype.
Tables
Table 1
Patient sources for the subtype analysis of invasive urothelial carcinoma samples.
Muscle-invasive bladder carcinoma samples were obtained from radical cystectomy or transurethral resection patients with available disease and treatment histories, as shown.
| # | Sex | Age | Tumor stage and grade | Tissue source | Intravesical therapy | Neoadjuvant chemotheraphy | Recurrence |
|---|---|---|---|---|---|---|---|
| 1 | M | 65 | T4a (High) N0 | TURB | N | N/A | Y |
| 2 | M | 61 | T4a (High) N2 | Cystectomy | N | N | N |
| 3 | M | 56 | T2 (High) | TURB | N | N/A | N |
| 4 | M | 61 | T2 (High) | TURB | N | N/A | N |
| 5 | F | 74 | T2 (High) | TURB | N | N/A | Y |
| 6 | M | 59 | T1 (High) | TURB | BCG | N/A | Y |
| 7 | M | 74 | T1 (High) | TURB | N | N/A | N |
| 8 | M | 62 | T1 (High) N0 | TURB | N | N/A | N |
| 9 | M | 59 | T3 (High) | TURB | N | N/A | Y |
| 10 | F | 49 | T2 (High) N0 | TURB | N | N/A | N |
Table 2
Patient information for survival analysis.
https://doi.org/10.7554/eLife.43024.025| # | Sex | Age | Tumor stage and grade | Tissue source | Intravesical therapy | Neoadjuvant chemotheraphy | Recurrence | Death |
|---|---|---|---|---|---|---|---|---|
| 1 | M | 54 | T1 | TURB | BCG | N/A | Y | Y |
| 2 | M | 60 | Ta (Low) | TURB | MMC | N/A | Y | N |
| 3 | M | 55 | Ta (High) | TURB | BCG | N/A | Y | N |
| 4 | M | 51 | Ta (Low) | TURB | BCG | N/A | Y | N |
| 5 | M | 76 | Ta (High) | TURB | BCG | N/A | N | N |
| 6 | M | 71 | Ta (High) | TURB | MMC | N/A | N | N |
| 7 | M | 58 | Ta (Low) | TURB | x | N/A | N | N |
| 8 | M | 83 | Ta (High) | TURB | BCG | N/A | N | N |
| 9 | M | 71 | T3a (High) N2 | TURB | BCG | N | Y | Y |
| 10 | M | 76 | T1 (High) | TURB | N | N/A | N | N |
| 11 | M | 80 | T1 (High) | TURB | N | N/A | Y | Y |
| 12 | M | 73 | T1 (High) | TURB | BCG | N/A | Y | N |
| 13 | M | 85 | T1 (High) | TURB | BCG | N/A | Y | N |
| 14 | M | 84 | T1 (High) | TURB | BCG | N/A | N | N |
| 15 | M | 83 | T1 (High) | TURB | BCG | N/A | N | N |
| 16 | M | 79 | T1 (High) | TURB | BCG | N/A | N | N |
| 17 | M | 65 | T4a (High) N0 | TURB | N | N | Y | Y |
| 18 | M | 84 | T1 (High) | TURB | N | N/A | N | Y |
| 19 | M | 79 | Tis N0 | TURB | N | N | N | N |
| 20 | M | 68 | T1 N0 | TURB | N | Y | N | N |
| 21 | M | 69 | T3b (High) N0 | TURB | N | N | N | Y |
| 22 | M | 86 | T2 (High) | TURB | N | N/A | Y | N |
| 23 | M | 80 | T3b (High) N0 | TURB | N | N | N | Y |
| 24 | M | 70 | T3b (High) N0 | TURB | N | Y | N | Y |
| 25 | M | 61 | T0 N0 | Cystectomy | BCG | Y | Y | N |
| 26 | M | 65 | T1 (High) N0 | Cystectomy | N | N | N | N |
| 27 | M | 53 | T2b (High) N0 | TURB | N | N | N | N |
| 28 | M | 62 | T3b (High) N2 | Cystectomy | N | N | N | Y |
| 29 | M | 70 | T1 N1 | TURB | N | N | N | N |
| 30 | M | 43 | T2a (High) N2 | Cystectomy | Gemcitabine/Cisplatin, BCG | N | Y | N |
| 31 | M | 60 | T2a (High) N0 | TURB | N | N | N | N |
| 32 | F | 66 | T1 (High) N2 | Cystectomy | N | N | N | N |
| 33 | M | 66 | Tis N0 | TURB | N | Y | N | N |
| 34 | M | 59 | T3 (High) | Cystectomy | N | N | Y | N |
| 35 | F | 57 | T0 N0 | TURB | N | N | N | N |
| 36 | F | 49 | T2b (High) N0 | TURB | N | N | N | N |
| 37 | M | 77 | Tis N0 | TURB | N | N | N | N |
| 38 | M | 72 | T0 N0 | TURB | N | N | N | Y |
| 39 | F | 76 | T2a (High) N0 | Cystectomy | N | N | N | N |
| 40 | F | 75 | T3a (High) N0 | TURB | N | N | N | N |
| 41 | F | 77 | T3b (High) N0 | Cystectomy | N | N | N | N |
Key resources table
| Reagent type (species) or resource | Designation | Source or reference | Identifiers | Additional information |
|---|---|---|---|---|
| Strain, strain background (M. musculus) | C57BL/6J | The Jackson Laboratory | JAX:000664, RRID:IMSR_JAX:000664 | |
| Genetic reagent (M. musculus) | Col1a2CreER | The Jackson Laboratory | JAX:029235, RRID:IMSR_JAX:029235 | |
| Genetic reagent (M. musculus) | Smoflox/flox | The Jackson Laboratory | JAX:004526, RRID:IMSR_JAX:004526 | |
| Genetic reagent (M. musculus) | Gli2flox/flox | The Jackson Laboratory | JAX:007926, RRID:IMSR_JAX:007926 | |
| Genetic reagent (M. musculus) | Bmpr1aflox/flox | Mishina et al., 2002 | MMRRC:030469-UNC, RRID:MMRRC_030469-UNC | |
| Genetic reagent (M. musculus) | CAnN.Cg-Foxn1nu/Crl | Charles River | CRL:194, RRID:IMSR_CRL:194 | |
| Genetic reagent (M. musculus) | NSG (NOD-scid IL2Rgammanull) | The Jackson Laboratory | JAX:005557, RRID:IMSR_JAX:005557 | |
| Cell line (H. sapiens) | J82 | ATCC | ATCC: HTB-1, RRID:CVCL_0359 | |
| Cell line (H. sapiens) | T24 | ATCC | ATCC: HTB-4, RRID:CVCL_0554 | |
| Cell line (H. sapiens) | TCC-SUP | ATCC | ATCC: HTB-5, RRID:CVCL_1738 | |
| Antibody | Anti-Cytokeratin 5 (rabbit polyclonal) | Abcam | Abcam: ab53121, RRID:AB_869889 | IHC (1:300) |
| Antibody | Anti-Cytokeratin 8/18 (mouse monoclonal) | Developmental Studies Hybridoma Bank | DSHB: TROMA-I, RRID:AB_531826 | IHC (1:300) |
| Antibody | Ki67 antibody - Proliferation Marker | Abcam | Abcam ab15580, RRID:AB_443209 | IHC (1:500) |
| Recombinant DNA reagent | pCMV.dR 8.74 | Packaging plasmid | ||
| Recombinant DNA reagent | pMD2.G | Addgene | RRID:Addgene_12259 | Envelope plasmid |
| Recombinant DNA reagent | pSicoR-mCh-empty | Addgene | RRID:Addgene_21907 | PMID:19587682 |
| Recombinant DNA reagent | pSiCoR | Addgene | RRID:Addgene_11579 | PMID:15240889 |
| Recombinant DNA reagent | pSicoR-mCh-mShh | This paper | Lentiviral vector expressing shRNA targeting the murine Shh gene | |
| Recombinant DNA reagent | pSicoR-mCh-hSHH | This paper | Lentiviral vector expressing shRNA targeting the human SHH gene | |
| Recombinant DNA reagent | pSicoR-mCh-mBmpr1a | This paper | Lentiviral vector expressing shRNA targeting the murineBmpr1a gene | |
| Recombinant DNA reagent | pSicoR-mCh-hBMPR1A | This paper | Lentiviral vector expressing shRNA targeting the murineBMPR1A gene | |
| Recombinant DNA reagent | Puro.Cre empty vector | Addgene | RRID:Addgene_17408 | PMID:18308936 |
| Recombinant DNA reagent | pLenti6.3/V5-Bmp4 | This paper | Lentiviral vector expressing murine Bmp4 | |
| Peptide, recombinant protein | Recombinant Murine BMP-4 | PeproTech | PeproTech: 315–27 | |
| Commercial assay or kit | MethylEdge Bisulfite Conversion System | Promega | Promega: N1301 | |
| Commercial assay or kit | TaKaRa EpiTaq HS (for bisulfite-treated DNA) | TaKaRa | TaKaRa: R110A | |
| Commercial assay or kit | pGEM-T Easy Vector System I | Promega | Promega: A1360 | |
| Commercial assay or kit | RNeasy Mini Kit | Qiagen | Qiagen: 74104 | |
| Commercial assay or kit | DNeasy Blood and Tissue Kit | Qiagen | Qiagen: 69504 | |
| Commercial assay or kit | QIAshredder | Qiagen | Qiagen: 79654 | |
| Commercial assay or kit | High-Capacity cDNA reverse transcription kit | Applied biosystem | Applied biosystem: 4368814 | |
| Commercial assay or kit | Power SYBR Green PCR Master Mix | Applied biosystem | Applied biosystem: 4367706 | |
| Chemical compound, drug | N-Butyl-N-(4-hydroxybutyl)nitrosamine | Tokyo Chemical Industry | TCI: B0938 | |
| Chemical compound, drug | 5-aza-2'-deoxycytidine | Sigma | Sigma: A3656 | |
| Chemical compound, drug | Mirus Bio TransIT-LT1 Transfection Reagent | Mirus Bio | Mirus Bio: MIR 2300 | |
| Chemical compound, drug | Corning Matrigel Growth Factor Reduced (GFR) | Corning Life Science | Corning: 354230 | |
| Chemical compound, drug | Corning Matrigel Basement Membrane Matrix High Concentration (HC) | Corning Life Science | Corning: 354248 | |
| Chemical compound, drug | polybrene(hexadimethrine bromide) | Sigma | Sigma: H9286 | |
| Chemical compound, drug | Blasticidin | Gibco | Gibco: R21001 | |
| Chemical compound, drug | Puromycin dihydrochloride | Sigma | Sigma: P8833 | |
| Software, algorithm | Image J | ImageJ | RRID:SCR_003070 | (http://imagej.nih.gov/ij/) |
| Software, algorithm | GraphPad Prism | GraphPad Prism | RRID:SCR_015807 | Version 6, https://graphpad.com |
| Software, algorithm | SnapGene Viewer | Snap Gene | RRID:SCR_015053 | http://www.snapgene.com/products/snapgene_viewer/ |
| Software, algorithm | MUSCLE | EMBL-EBI | RRID:SCR_011812 | http://www.ebi.ac.uk/Tools/msa/muscle/ |
| Software, algorithm | Methprimer 2.0 | The Li Lab at UCSF, Li and Dahiya, 2002 | RRID:SCR_010269 | http://urogene.org/ |
| Software, algorithm | Oasis2 | Han et al., 2016 | https://sbi.postech.ac.kr/oasis2/ | |
| Software, algorithm | Java Treeview | Saldanha, 2004 | RRID:SCR_016916 | http://jtreeview.sourceforge.net/ |
| Software, algorithm | Cluster 3.0 | de Hoon et al., 2004 | http://bonsai.hgc.jp/~mdehoon/software/cluster/software.htm | |
| Software, algorithm | Oncoprint | Gao et al., 2013 ; Cerami et al., 2012 | RRID:SCR_014555 | http://www.cbioportal.org/ |
| Software, algorithm | Tophat | Trapnell et al., 2009 | ||
| Software, algorithm | Cufflinks | Trapnell et al., 2012 | ||
| Software, algorithm | GSEA | Broad Institute | RRID:SCR_003199 | http://www.broadinstitute.org/gsea/index.jsp |
Table 3
Information for primers used in the bisulfite sequencing of regulatory regions of the murine and human SHH genes.
https://doi.org/10.7554/eLife.43024.027| Target species | Primer name | Forward sequence (5’-3’) | Reverse sequence (5’-3) |
|---|---|---|---|
| Mouse | Shh promoter | TTTTTAGTTTTGTTATTATTTAAAATTAGG | CAAAAATCACCAAAAAACATCTAAC |
| Shh upshore region 1 | TTTGTATATTTATATTTGGGGATGG | AAAAAACTTATAAAACAAACTACCTTTC | |
| Shh upshore region 2 | TTGTATTTTGTTAGGATAGATTGGAAG | ACCCCATCCCCAAATATAAATATAC | |
| Shh upshore region 3 | GGATGGTGAGGTTTTGTTATATTGT | ATATCCAACACTCTTTCAAAAAAAA | |
| Shh upshore region 4 | TTGAAGTAAAATGAGGTTTTAGGATGT | CACCATCCCAAACTTAAAAAAATTA | |
| Shh downshore region 1 | ATGTTGTTGTTGTTGGTTAGATGTT | ATAAAAAACCCCATCTTCTAATACC | |
| Shh downshore region 2 | GGGTATTAGAAGATGGGGTTTTTTA | CCCAAACTTTCTCAATTACAATTCT | |
| Shh downshore region 3 | GAAAGTTTGGGGGTAGTTTTGATA | TATTTACAAAAAAACCCATTTCCAA | |
| Human | SHH promoter | TTTTTTTGTTTTTTGATTGTTGTTT | TCAACTTTTTAAAATACCTCCTCTTC |
| SHH upshore region 1 | TTTTGGGGAAGAAAAATTAAATAAT | CAACAATCAAAAAACAAAAAAAATCTA | |
| SHH upshore region 2 | AGTGAGGTGATTATAGATTTAAAGAT | CAACTATTATTTAATTTTTCTTCCCC | |
| SHH upshore region 3 | ATTTGTAAAGGGAATTTTTGGAAAT | AACCAAAAAAATAAAATTTAAAACTCC | |
| SHH upshore region 4 | TGTTAAGGGTGGAAGGTAGGGTAGTT | CAAAAATTCCCTTTACAAATCAACT | |
| SHH downshore region 1 | GGAAGAGGAGGTATTTTAAAAAGTTG | AACTAAACCCTTAACCTCCATTCTC | |
| SHH downshore region 2 | GAGAATGGAGGTTAAGGGTTTAGTT | CCTCCTAACTTTTCCAATTAAAAAT | |
| SHH downshore region 3 | ATTTTTAATTGGAAAAGTTAGGAGG | CAAAAAAACCCATTTCTAACTTCAA |
Table 4
shRNA sequences targeting the murine and human SHH and BMPR1A genes.
https://doi.org/10.7554/eLife.43024.028| Target species | shRNA | Target sequence | Sense | Antisense |
|---|---|---|---|---|
| Mouse | Bmpr1a | GGGTCGTTACAACCGTGATTT | GGGUCGUUACAACCGUGAUUU | AAAUCACGGUUGUAACGACCC |
| Shh | CTTTAGCCTACAAGCAGTTTA | CUUUAGCCUACAAGCAGUUUA | UAAACUGCUUGUAGGCUAAAG | |
| Human | BMPR1A | GTCCAGATGATGCTATTAATA | GUCCAGAUGAUGCUAUUAAUA | UAUUAAUAGCAUCAUCUGGAC |
| SHH | CTACGAGTCCAAGGCACATAT | CUACGAGUCCAAGGCACAUAU | AUAUGUGCCUUGGACUCGUAG |
Additional files
-
Transparent reporting form
- https://doi.org/10.7554/eLife.43024.029
Download links
A two-part list of links to download the article, or parts of the article, in various formats.
Downloads (link to download the article as PDF)
Open citations (links to open the citations from this article in various online reference manager services)
Cite this article (links to download the citations from this article in formats compatible with various reference manager tools)
Epigenetic regulation of mammalian Hedgehog signaling to the stroma determines the molecular subtype of bladder cancer
eLife 8:e43024.
https://doi.org/10.7554/eLife.43024


