Active information maintenance in working memory by a sensory cortex
- Chinese Academy of Sciences, China
- University of Chinese Academy of Sciences, China
- Zhejiang University School of Medicine, China
- Institut d'Investigacions Biomèdiques August Pi i Sunyer (IDIBAPS), Spain
Figures
Figure 1 with 6 supplements

The APC activity is important for the DNMS performance.
(a) Diagram of the experimental setup. (b) Design of the DNMS task. (c) Averaged licking rate of mice well-trained for the DNMS task in hit (left) and correct rejection (right) trials. Shadow, 95% confidence interval of the mean from bootstrapping of 1000 repeats. (d) The DNMS task correct rate with varying delay durations, fitted by an exponential-decay function. Each color represents the same individual mouse across all delay periods. (e) Expression of ChR2, targeted region and sites of optical fiber insertion. (f) The majority of neurons (single units) were silenced during optogenetic suppression, in awake single unit op-tetrode recording in vivo. Numbers above figure are the numbers of single units. The apparent slower increase in firing for the activated neurons is due to the large variation in firing modulation, also see Figure 1—figure supplements 3 and 4. (g) Diagram of the optogenetic perturbation during the delay period. (h–j) Correct rates in the DNMS task following delay-period optogenetic suppression in APC. Each point in the figure represents the averaged result from one mouse. *, p=0.023, **, p=0.002, ***, p<0.001, mixed-between-within-ANOVA, genotype × laser interaction; error bars show the 95% confidence intervals of the means from bootstrapping of 1000 repeats. Numbers in brackets show the effect size measured by Cohen’s d for control (in black) and ChR2 (in blue) groups. Delay duration, 5 s (h), 8 s (i) and 12 s (j). In the 12s-delay DNMS task, the performance in control mice were also modestly impaired by laser stimulation ((j) in orange, paired permutation test). (k–n) Miss rate, false alarm rate, lick efficiency and sensitivity index (d′) following APC delay-period suppression in the DNMS task with 12 s delay. ***, p<0.001, mixed-between-within-ANOVA, genotype × laser interaction; error bars show the 95% confidence interval of the means from bootstrapping of 1000 repeats. Numbers in brackets show the effect size measured by Cohen’s d for control (in black) and ChR2 (in blue) groups. See Figure 1—figure supplements 1–6, Figure 1—source data 1, 2 for more details of the task and complete statistics.
-
Figure 1—source data 1
Performance in the DNMS task.
- https://doi.org/10.7554/eLife.43191.009
-
Figure 1—source data 2
Effect size and ANOVA statistics for optogenetics.
- https://doi.org/10.7554/eLife.43191.010
Figure 1—figure supplement 1
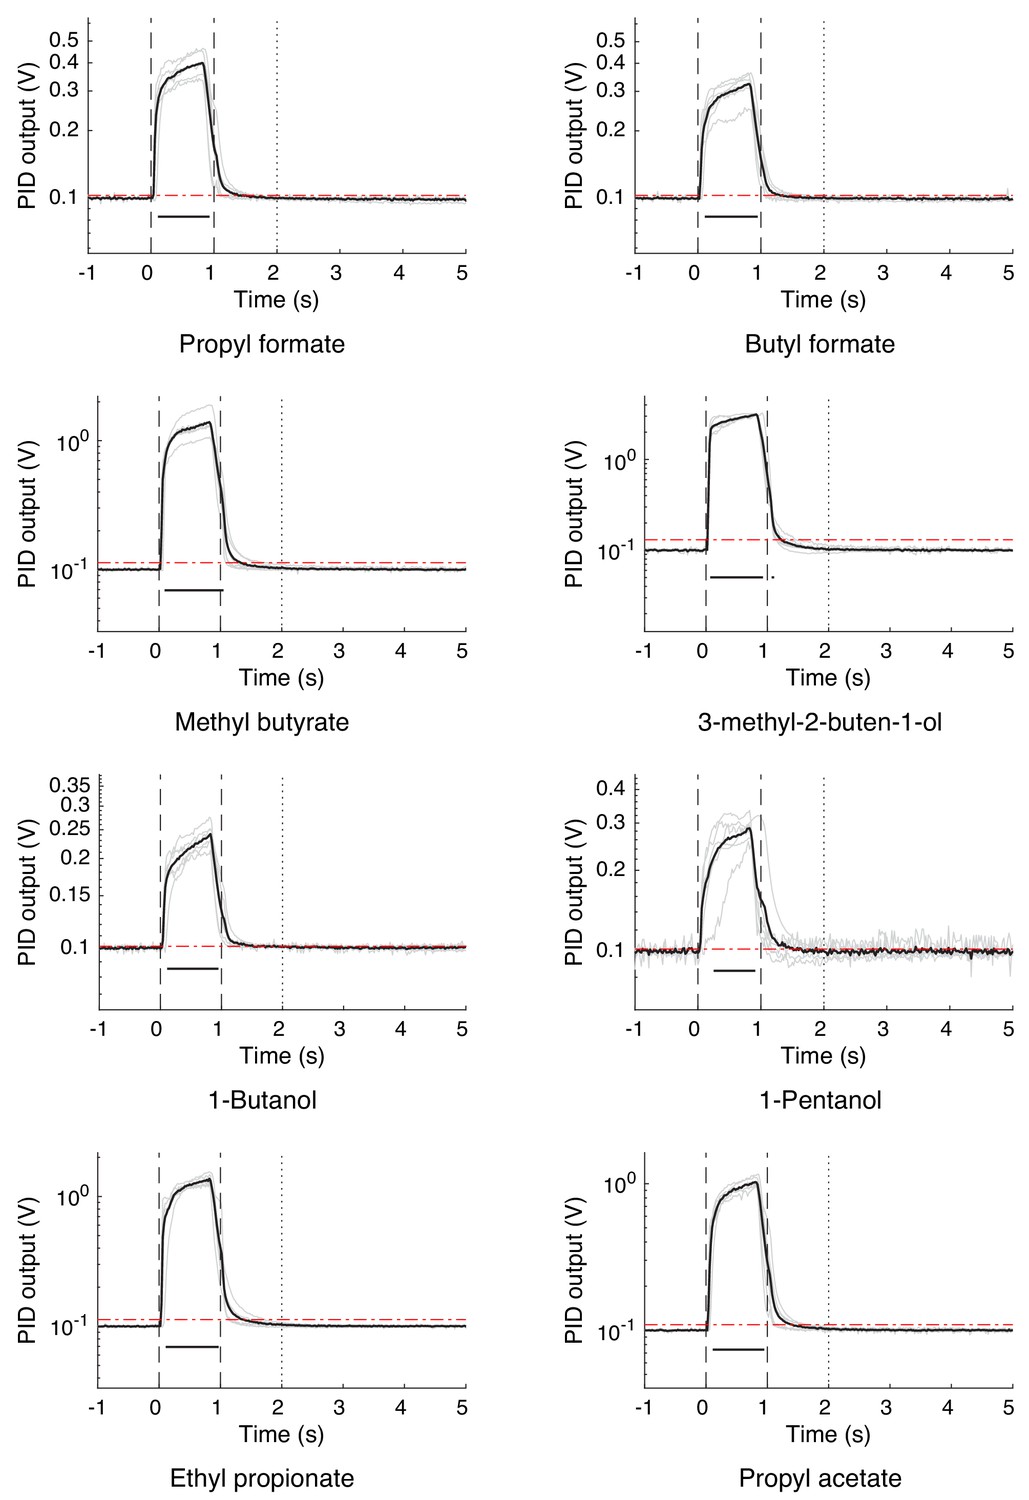
Odor residual of the odor-delivery system.
Odor residual of the odor-delivery system, as measured by a photo-ionization detector (PID). The odor identity is labeled below each plot. Time zero marks odor onset. Odor-delivery duration was 1 s. Noted the log scale is used in the plots. Gray line, six individual apparatus; black line, mean of all apparatuses (top); indication of significance (Z > 1.96) comparing mean amplitude and 1% of peak amplitude (bottom); red dotted line, 1% of peak amplitude of mean.
Figure 1—figure supplement 2

Location for optical fibers and range of optogenetic stimulation.
(a) Location for optical fibers, as shown by the histological images. Arrowheads indicate the tips of optical fibers. The IDs of the mice are displayed on the bottom left of each panel, for the performance associated with each ID, please refer to Figure 1—source data 1. (b) Distribution of the locations of the optical fiber tips (red circles). (c) Effective range of optogenetic stimulation as labeled by c-Fos activity. c-Fos clearly labeled many neurons that are spontaneously active (red cells). We observed reduction in the c-Fos labeled neurons only for the focal area under the optical fibers. This result demonstrated the regional specificity of optogenetic silencing through activating GABAergic neurons.
Figure 1—figure supplement 3
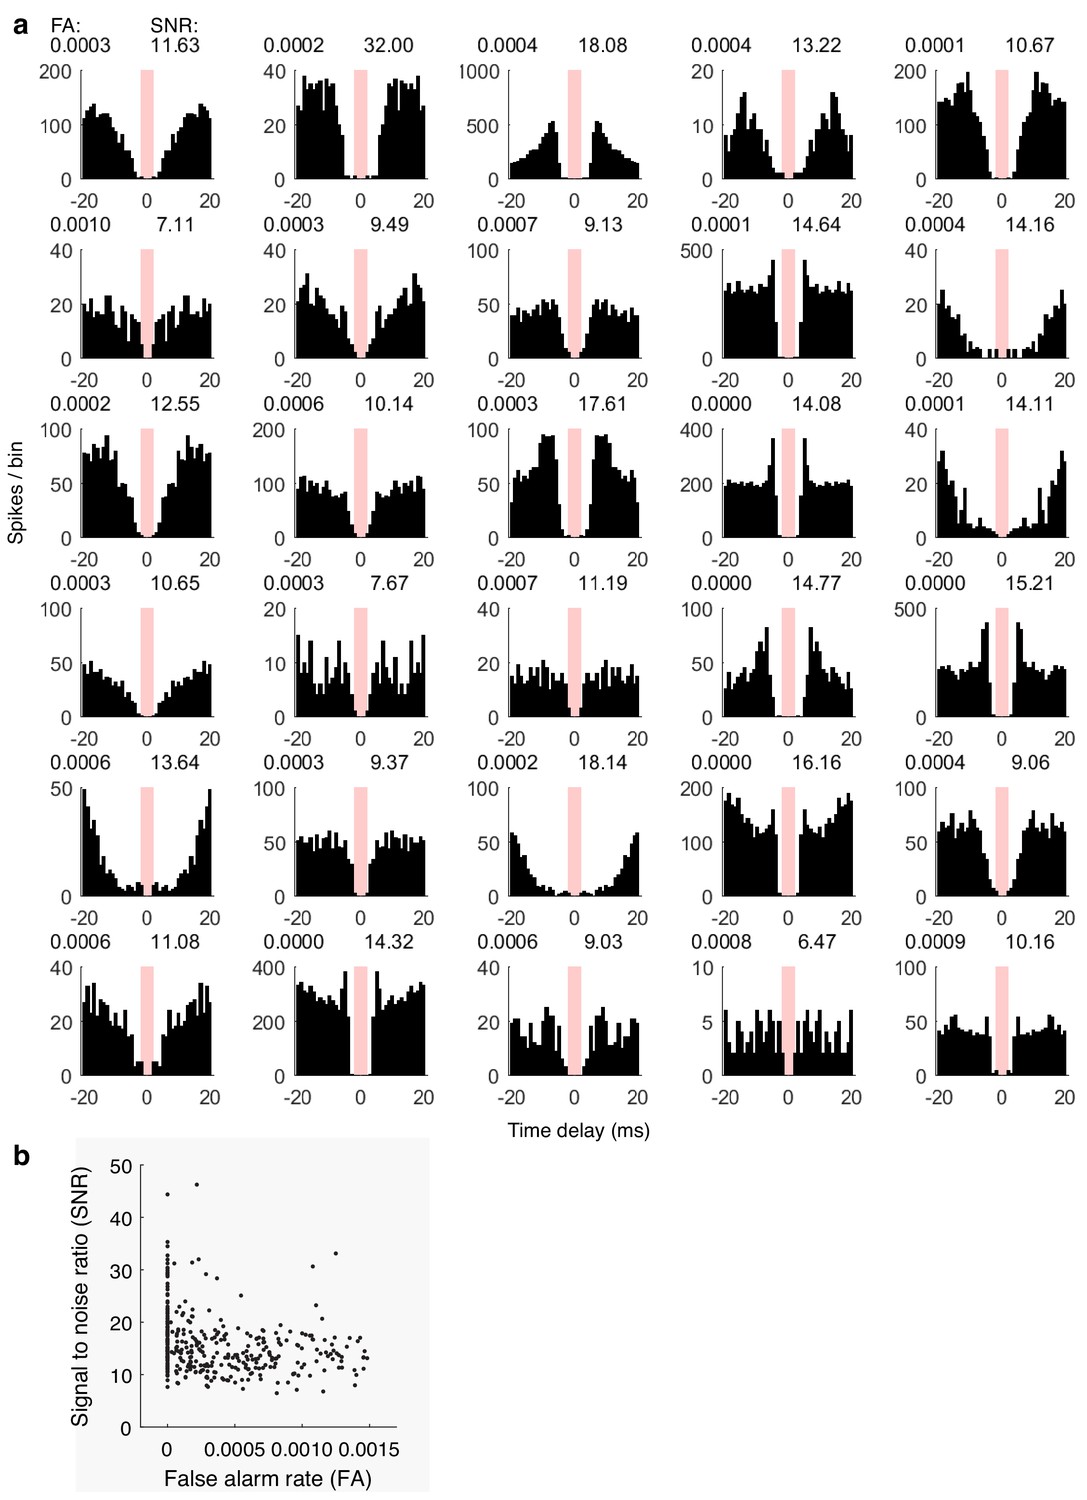
Single-unit spike-sorting quality.
(a) Autocorrelation of spikes from 30 example neurons. Note the clear refractory periods in all neurons. (b) All neurons that we sorted exhibited large signal-noise ratio and small false alarm rate, indicating the high quality of the single-unit sorting.
Figure 1—figure supplement 4

Optogenetic effects on APC neurons.
(a) Four neurons with enhanced activity during laser delivery. Arrowheads in the top two panels indicate the clear peaks. The complex patterns may be due to the recurrent excitatory and inhibitory connection. Latency for all cells is the time between laser-onset and significant modulation of firing rates comparing to baseline (p<0.001, permutation test of 2000 resamples); latency data in parenthesis for cells 3 and 4 are the mean time between laser-onset and the first spike after laser-onset. Some neurons (cell 1 and 2) show very short latency of increase in firing rate. Other neurons show initial suppression and enhancement of firing rate later on (cells 3 and 4). These later neurons may receive stronger initial inhibition (e.g. from the cells, as in Cell 2), before ChR2 excitation causes later excitation. The initial suppression may be mediated by feedback inhibition from other inhibitory neurons, such as VIP neurons (for example, Zhang et al., 2014). (b) Four example neurons with reduced activity during laser delivery. The majority of neurons were inhibited. (c) Excitatory latency and jitter (standard deviation of the first spike) for neurons with enhanced activity during laser delivery.
Figure 1—figure supplement 5
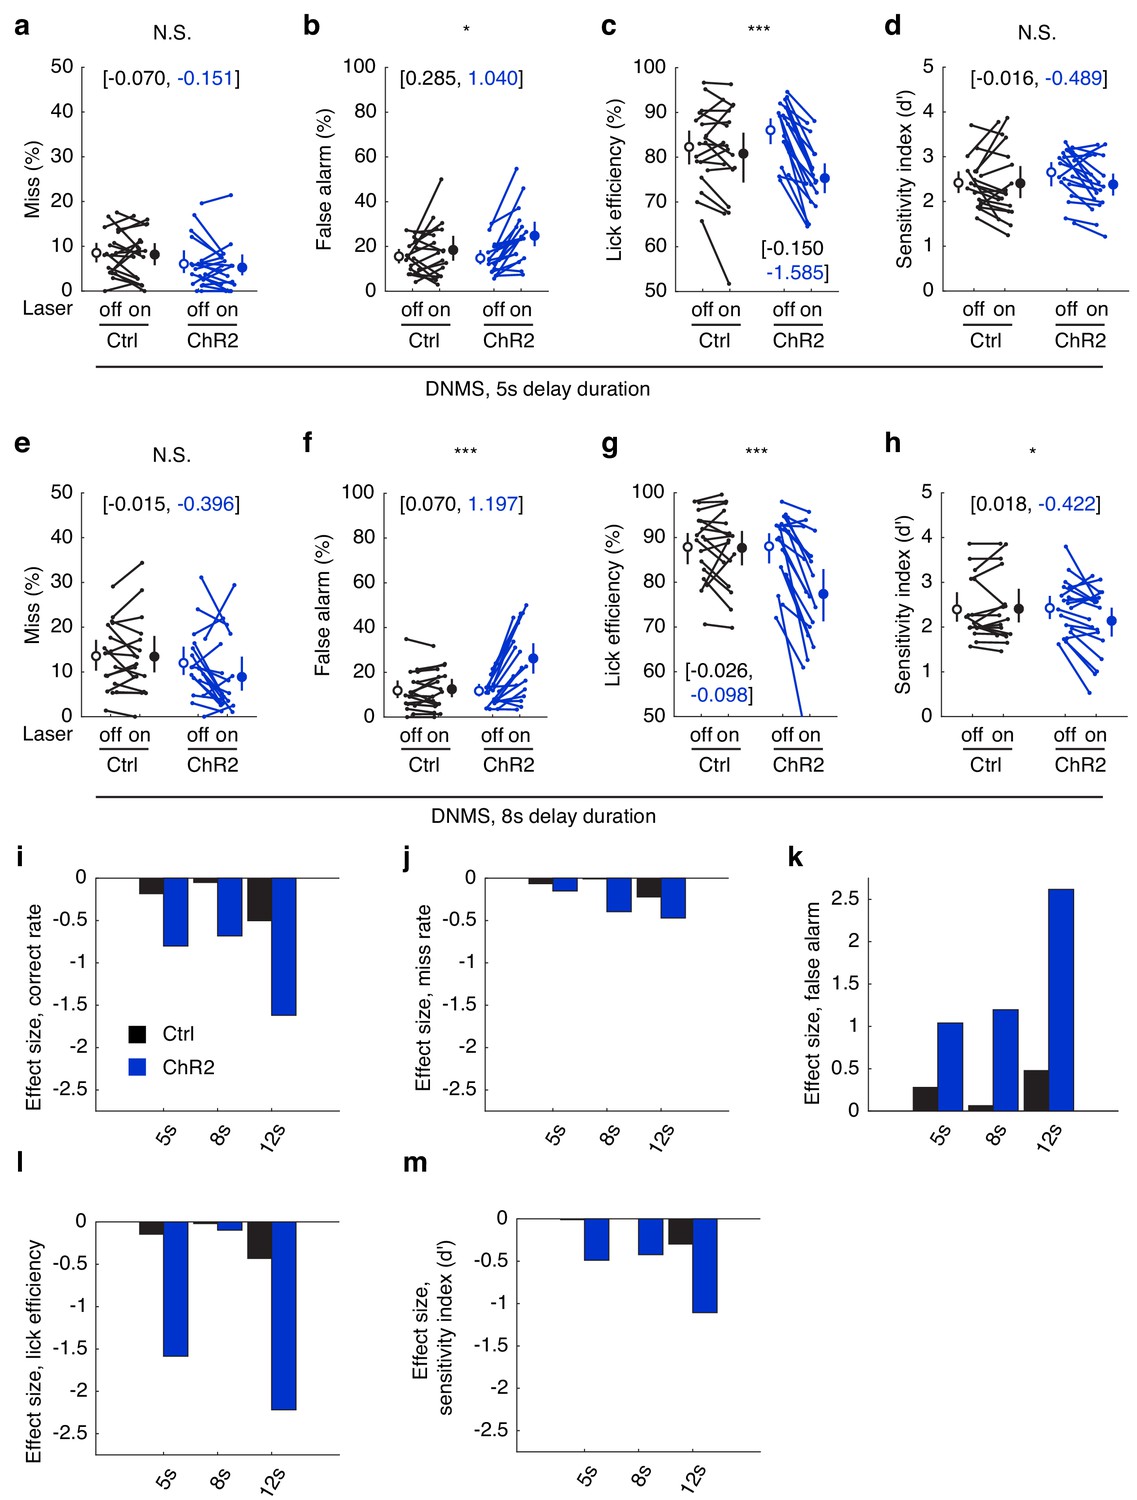
The APC activity is important for the DNMS performance.
(a–d) Miss rate, false-alarm rate, lick efficiency and sensitivity index (d′) following the APC delay-period suppression in DNMS task with 5 s delay. *, p=0.019; ***, p<0.001; mixed-between-within-ANOVA, genotype × laser interaction; error bars show the 95% confidence intervals of the means from bootstrapping of 1000 repeats. Numbers in brackets are the effect size measured by Cohen’s d for control (in black) and ChR2 (in blue) groups. (e–h) As (a–d), but for the DNMS task with a 8 s delay. *, p=0.026. (i–m) Optogenetic effect size, as measured by Cohen’s d, for the correct rate (i), miss rate (j), false alarm rate (k), lick efficiency (l) and sensitivity index (d′ (m)) for DNMS tasks with 5 s, 8 s, and 12 s delay.
Figure 1—figure supplement 6

Lick rate in the DNMS tasks.
(a–e) Lick rates of VGAT-ChR2 mice through the entire trail in laser-on and laser-off trials, for DNMS tasks with delay duration of 20 s (a), 12 s (b, c), 8 s (d) and 5 s (e). A small increase in firing rate was observed immediately before the onset of the test odor delivery in fixed optogenetic stimulation, laser-on trials (c–e); this was probably due to the association between laser-offset and test-onset. The differences are small and transient, and always disappear more than 1 s before the onset of the response window. The optogenetic laser conditions are varied and uncoupled in (a) and (b). Blue: laser-on trials. Black: laser-off trials. Shadow, 95% confidence interval of the mean from bootstrapping of 1000 repeats. Statistics, permutation test with 1000 repeats. Statistics in black text indicate that the laser-off trials licking rate is higher than that of laser-on trials. Statistics in blue text indicate that the laser-on trials licking rate is higher than that for laser-off trials.
Figure 2 with 2 supplements
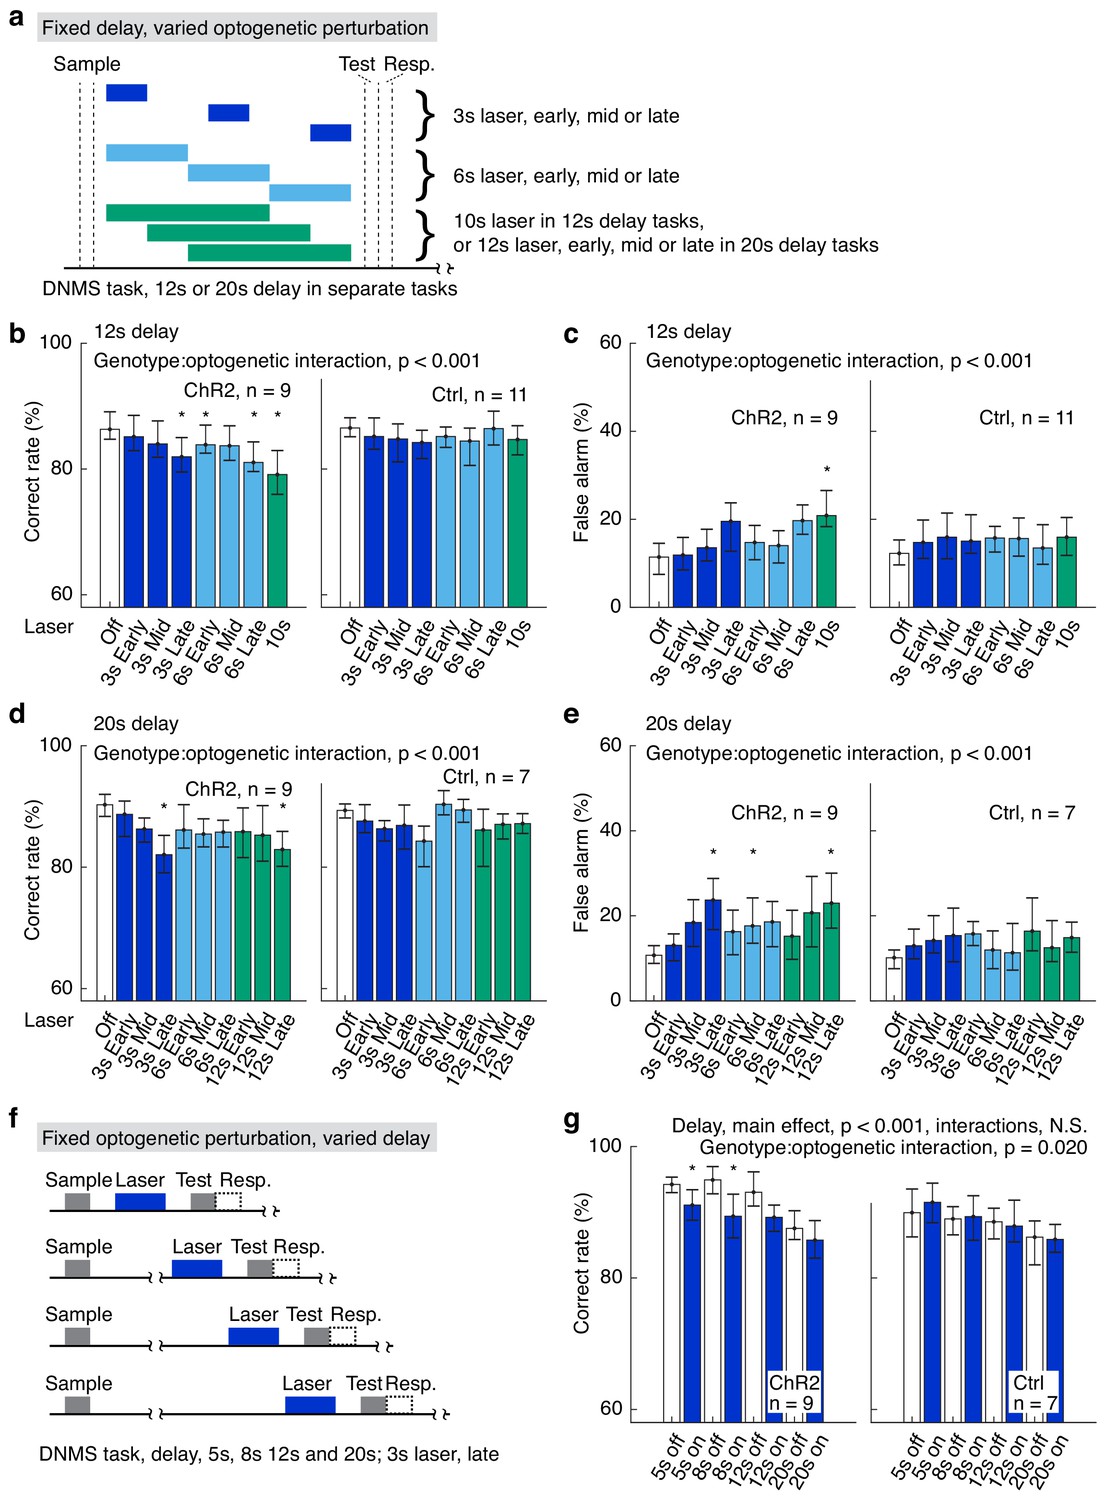
Varied delay and optogenetic suppression effects.
(a) Designs of the fixed delay, varied optogenetic suppression task. (b, c) Correct rates (b) and false alarm rates (c) in the fixed delay, varied optogenetic suppression task with 12 s delay. (d, e) As in (b) and (c), but for tasks with 20 s delay duration. (f) Design of the fixed optogenetic suppression, varied delay task. (g) Correct rates in the fixed optogenetic suppression, varied delay task; interactions for delay include delay:genotype, delay:laser-on/off, and delay:genotype:laser-on/off, all of which are statistically not significant (N.S.). Statistics at the top of each panel were generated by mixed-between-within-ANOVA. *, p<0.05 in a post-hoc paired permutation test of 10,000 repeats comparing to laser-off control, adjusted for multiple comparison with the Bonferroni method. For complete statistics, see Figure 2—source data 1,3. For more details of the optogenetic task performance and effect size, see Figure 2—figure supplements 1–2.
-
Figure 2—source data 1
Fixed delay, varied optogenetic suppression.
- https://doi.org/10.7554/eLife.43191.016
-
Figure 2—source data 2
Fixed optogenetic suppression, varied delay duration.
- https://doi.org/10.7554/eLife.43191.017
-
Figure 2—source data 3
Effect size and ANOVA statistics for optogenetics.
- https://doi.org/10.7554/eLife.43191.018
Figure 2—figure supplement 1

Varied delay and optogenetic suppression effects.
(a, b) Miss rates in the fixed delay, varied optogenetic suppression task with 12 s delay (a) and 20 s delay duration (b). (c, d) False alarm rate (c) and miss rate (d) in the fixed optogenetic suppression, varied delay task. Statistics at the top of each panel were generated by mixed-between-within-ANOVA. *, p<0.05 in a post-hoc paired permutation test of 10,000 repeats comparing to laser-off control, adjusted for multiple comparison with the Bonferroni method. For complete statistics, see Figure 2—source data 1,3.
Figure 2—figure supplement 2
Optogenetic suppression effect size.
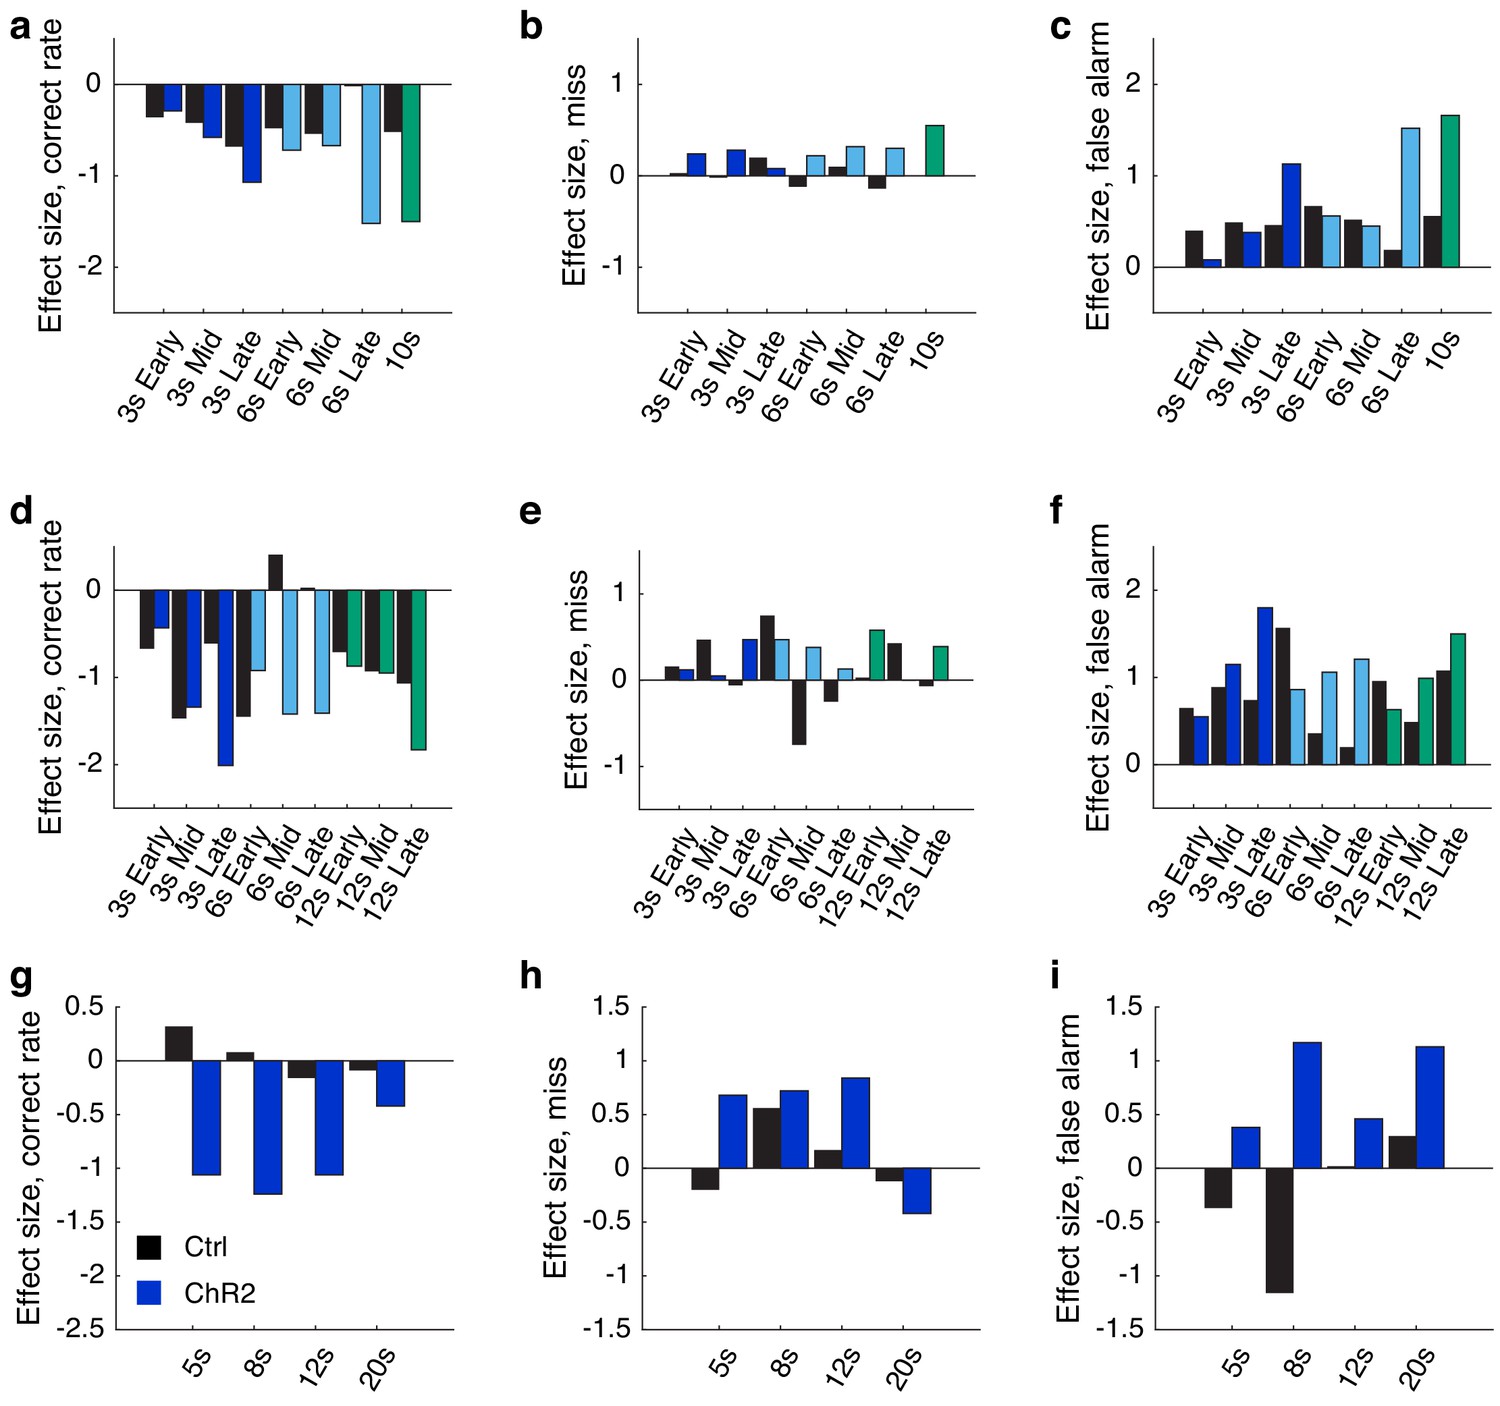
(a–c) Optogenetic effect size, as measured by Cohen’s d, for the correct rate (a), miss rate (b), false alarm rate (c), for the fixed 12s-delay varied optogenetic stimulation task. (d–f) As (a–c), but for the fixed 20s-delay varied optogenetic stimulation task. (g–i) As a–c), but for the fixed 3 s late delay optogenetic stimulation varied delay task.
Figure 3 with 1 supplement
The optogenetic suppression effects were not due to impaired sensory perception.
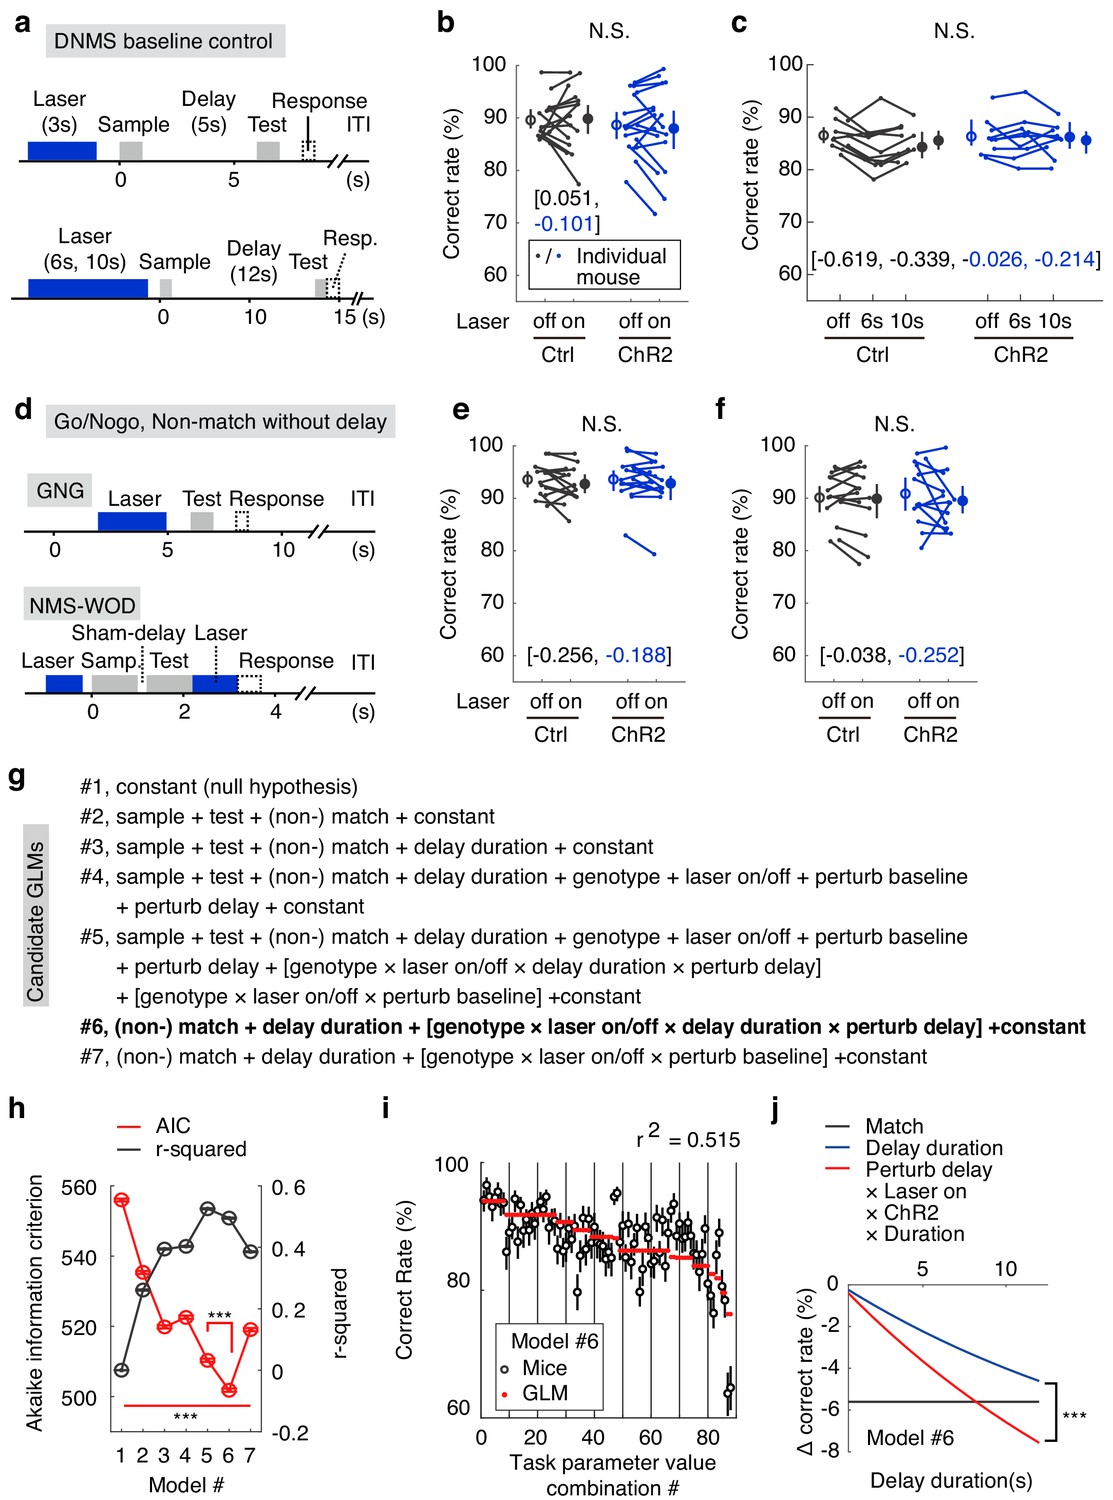
(a) Designs of the DNMS-baseline optogenetic control task. (b, c) Correct rates in the DNMS-baseline perturbation control task with 3 s perturbation and 5 s delay (b) and with 6 s and 10 s perturbation and 12 s delay (c). N.S., statistically not significant, mixed-between-within-ANOVA, genotype × laser interaction; error bars represent the 95% confidence interval of the mean from bootstrapping of 1000 repeats. Numbers in brackets are the effect size measured by Cohen’s d for control (in black) and ChR2 (in blue) groups. (d) Designs of the Go/No-go (GNG) and non-match to sample without delay (NMS-WOD) optogenetic control tasks. (e, f) Correct rates in the GNG and NMS-WOD control tasks. N.S., statistically not significant, mixed-between-within-ANOVA, genotype × laser interaction; error bars represent the 95% confidence interval of the mean from bootstrapping of 1000 repeats. Numbers in brackets are the effect size measured by Cohen’s d for control (in black) and ChR2 (in blue) groups. (g) Design of the candidate generalized linear models (GLMs). The task parameters in each model were then used to fit task performance. Terms in square brackets represent interactions. (h) Comparison of the candidate GLMs in terms of Akaike information criterion (AIC) and r-squaredin explaining performance, between all models, and between model 5 and 6. ***, p<0.001, in a permutation test of 1000 repeats. (i) Performance of mice in the WM tasks versus the optimized model (#6 in (g)) coefficients were calculated from all experimental trials, see Materials and methods). Error bars represent 95% confidence intervals of means from bootstrapping of 1000 repeats. (j) Comparison showing the predicted effect size against delay duration, with coefficients derived from parameters in model #6. Shadow represents the 95% confidence intervals of means from bootstrapping of 1000 repeats (the confidence interval is very narrow and may appear invisible). ***, p<0.001 in comparisons of the coefficients of delay-duration and the effect of delay-period laser perturbation (interaction among perturb-delay, laser-on, ChR2-genotype and delay-duration, see Materials and methods) in the model, permutation test with 1000 repeats. See Figure 3—figure supplement 1, for the comparison of the learning curve in GNG and NMS-WOD tasks and comparison of the effect size of optogenetic suppression. See Figure 3—source data 1–4 for complete statistics.
-
Figure 3—source data 1
The optogenetic suppression effects were not due to impaired sensory perception.
- https://doi.org/10.7554/eLife.43191.021
-
Figure 3—source data 2
Effect size and ANOVA statistics for optogenetics.
- https://doi.org/10.7554/eLife.43191.022
-
Figure 3—source data 3
General linear model coefficients.
- https://doi.org/10.7554/eLife.43191.023
-
Figure 3—source data 4
Task parameter combinations and general linear model fit.
- https://doi.org/10.7554/eLife.43191.024
Figure 3—figure supplement 1
Learning curve for the GNG and NMS-WOD tasks.
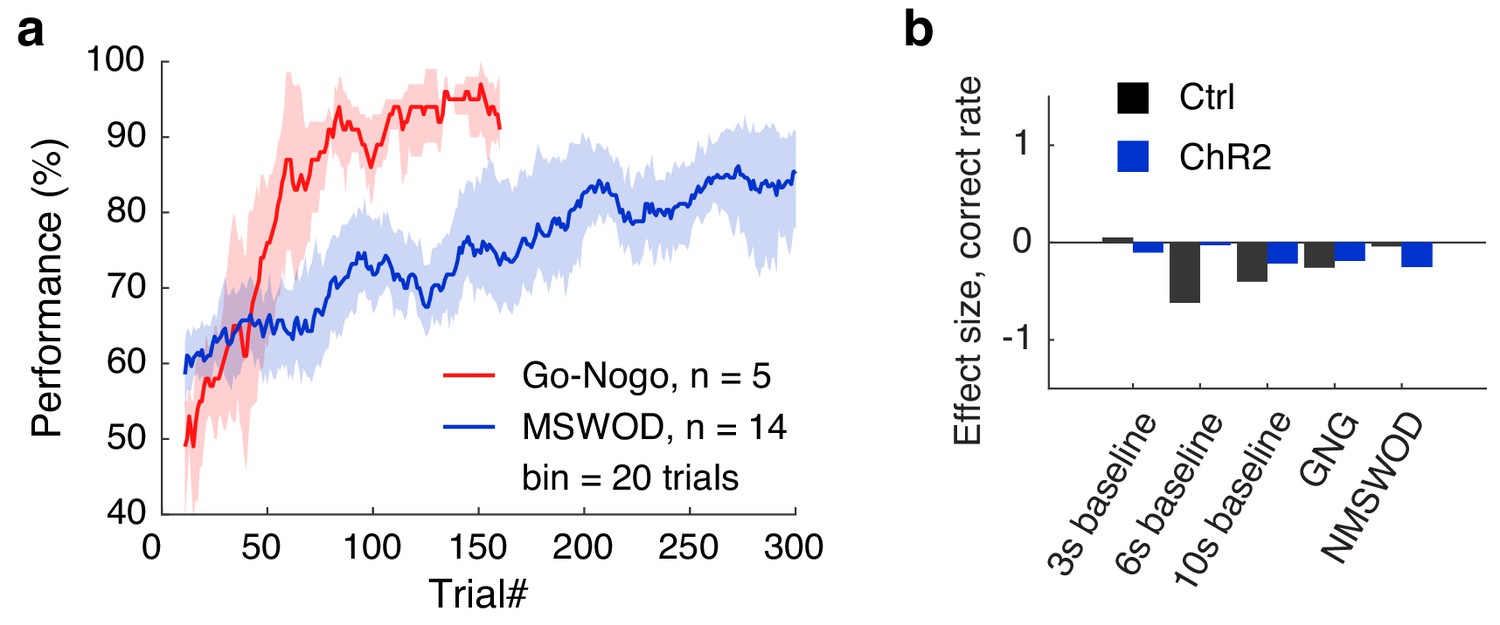
(a) Learning curve for the correct rate in the Go/No-go (GNG) and non-match-to-sample without delay (NMS-WOD) task. (b) Optogenetic effect size, as measured by Cohen’s d, for the correct rate in the 3s- 6s- and 10-s DNMS baseline optogenetic stimulation task, the GNG task and the NMSWOD task.
Figure 4 with 2 supplements
Active memory maintenance by the APC delay activity.
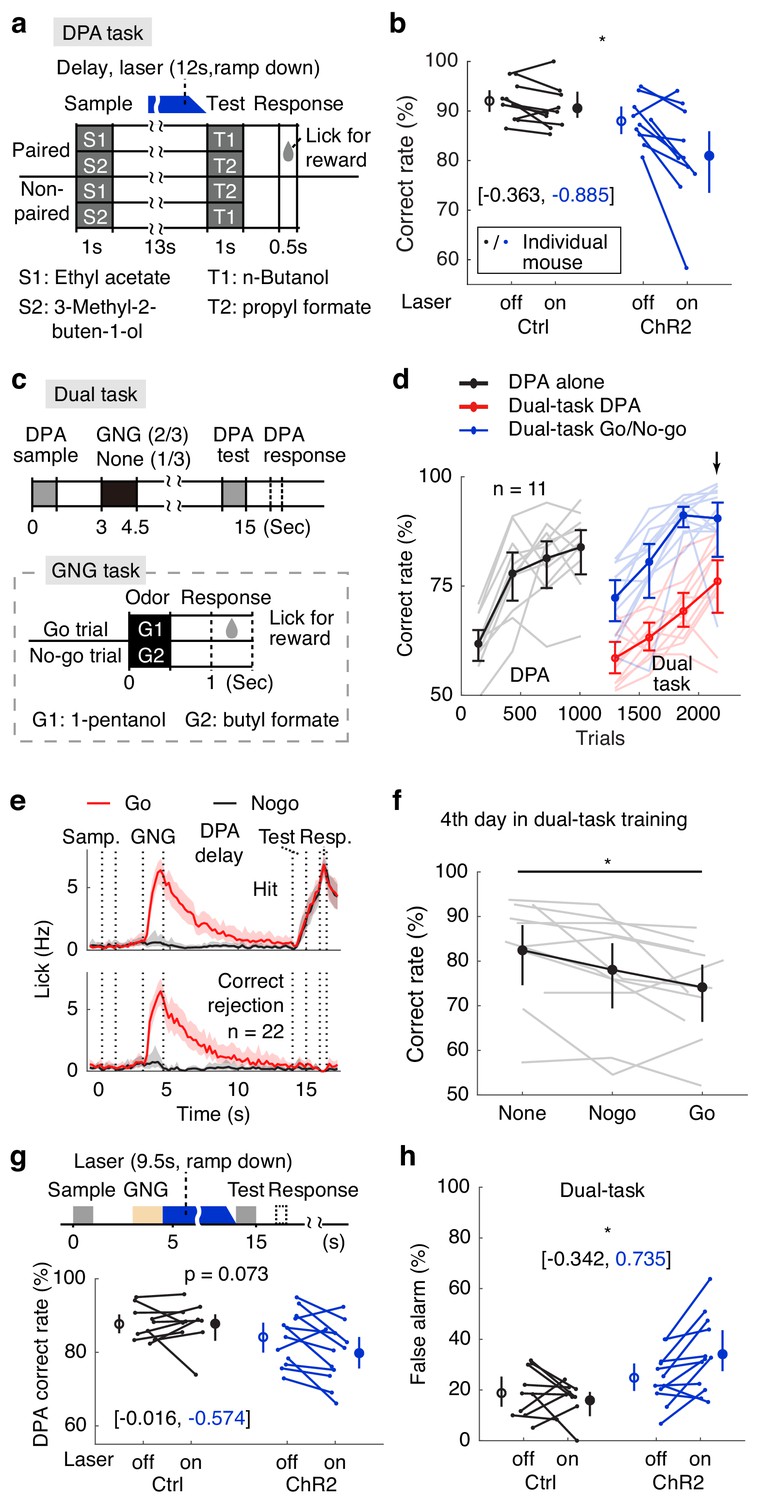
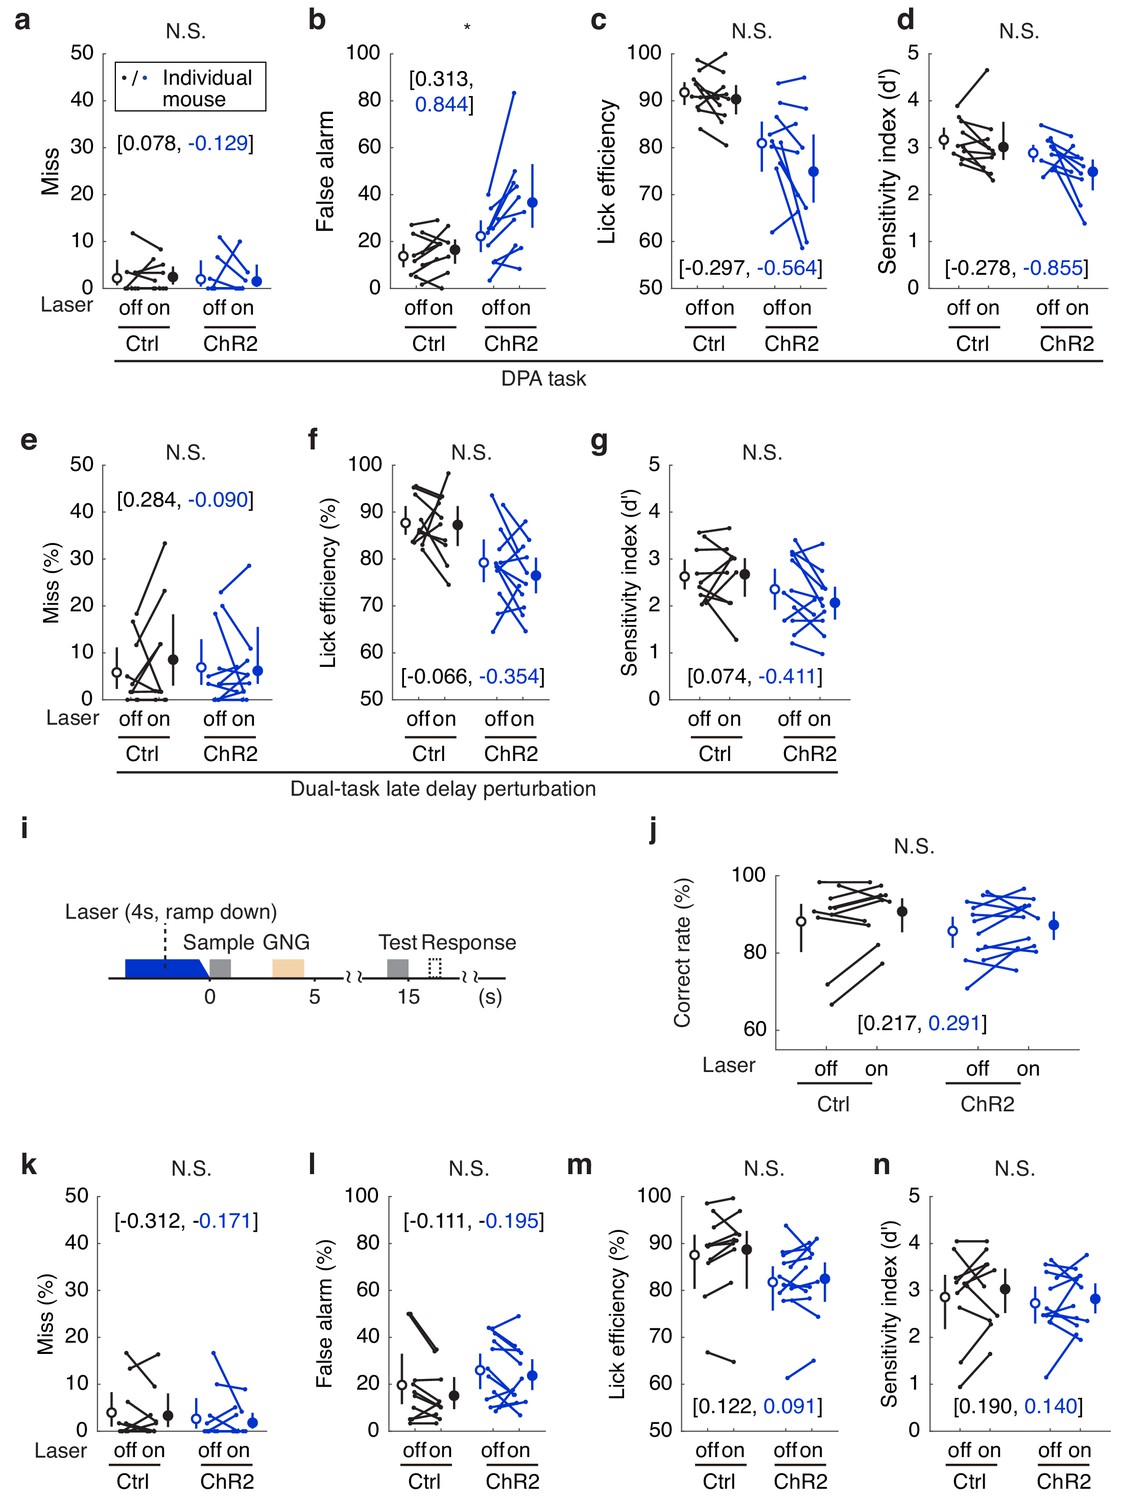
(a) Design of the delayed paired association (DPA) task. (b) Correct rates following APC delay-period optogenetic suppression in the DPA task. *, p=0.038, as determined by a mixed-between-within-ANOVA, genotype × laser interaction; error bars represent the 95% confidence intervals of the means from bootstrapping of 1000 repeats. Numbers in brackets show the effect size measured by Cohen’s d for control (in black) and ChR2 (in blue) groups. We noticed some performance variations resulting from DPA optogenetic impairment, and confirmed that there is no outlier with both the 1.5 interquartile ranges and the Grubb’s methods. (c) Behavioral diagram for the dual-task design. (d) Learning curve for the correct rate in the dual-task. Note the drop of DPA performance after inserting the GNG task in the delay period (in red). Arrow, the 4th day in dual-task training. Light-color traces show the data for individual mice; error bars represent the 95% confidence intervals of the means from bootstrapping of 1000 repeats. (e) Averaged licking rate of mice well-trained for the dual-task in GNG-Go (red), GNG-Nogo (black), DPA-hit (top) and DPA-correct rejection (bottom) trials. Shadows show the 95% confidence interval of the mean from bootstrapping of 1000 repeats. (f) Dual-task interference as illustrated by performance data from the 4th day of dual-task training. *, p=0.041, one-way repeated measure ANOVA. Gray traces show data for individual mice; error bars show the 95% confidence interval of the mean from bootstrapping of 1000 repeats. (g) DPA-Correct rate after suppressing the APC activity during the later-phase delay period after distractors. P values were obtained from mixed-between-within-ANOVA, genotype × laser interaction; error bars show the 95% confidence intervals of the means from bootstrapping of 1000 repeats. Numbers in brackets represent the effect size as measured by Cohen’s d for control (in black) and ChR2 (in blue) groups. (h) As in (g), but for DPA-false alarm rate. *, p=0.014. See Figure 4—figure supplement 1 for more details for the task performance and control tasks. See Figure 4—figure supplement 2 for optogenetic suppression effect size. See Figure 4—source data 1–2 for complete statistics.
-
Figure 4—source data 1
Active memory maintenance by the APC delay activity.
- https://doi.org/10.7554/eLife.43191.028
-
Figure 4—source data 2
Effect size and ANOVA statistics for optogenetics.
- https://doi.org/10.7554/eLife.43191.029
Figure 4—figure supplement 1
Active memory maintenance by the APC delay activity.
(a–d) Miss rate (a), false alarm rate (b), lick efficiency (c) and sensitivity index (d′) (d) following the APC delay-period suppression in the DPA task. *, p=0.018, from the mixed-between-within-ANOVA, genotype × laser interaction; error bars represent the 95% confidence intervals of the means from bootstrapping of 1000 repeats. Numbers in brackets are the effect size measured by Cohen’s d for the control (in black) and ChR2 (in blue) groups. (e–h) Similar to (a–d), but in the dual-task. (i) Design of the dual-task baseline optogenetic control task. (j–n) Correct rate (j), miss rate (k), false alarm rate (l), lick efficiency (m) and d’ (n) in the dual-task DPA task following the APC optogenetic suppression during the baseline period. N.S., statistically not significant result in a mixed-between-within-ANOVA, genotype × laser interaction; error bars represent 95% confidence intervals of the means from bootstrapping of 1000 repeats. Numbers in brackets are the effect size measured by Cohen’s d for the control (in black) and ChR2 (in blue) groups.
Figure 4—figure supplement 2
Optogenetic suppression effect size.
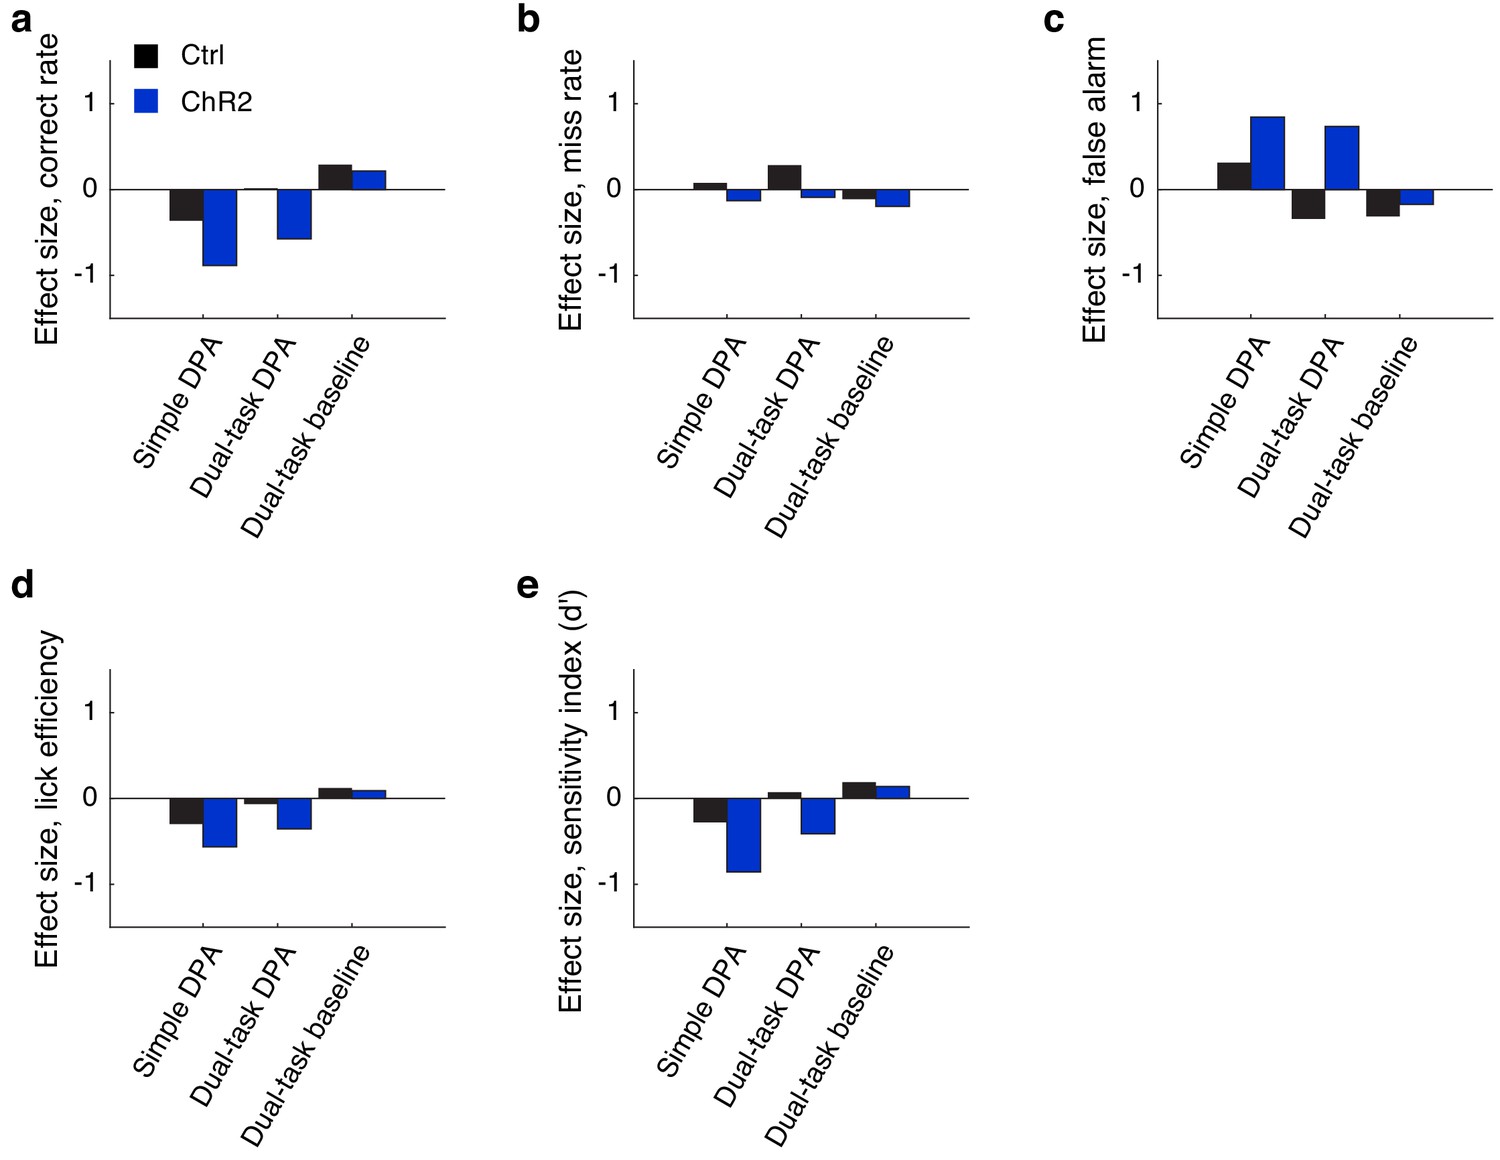
(a–e) Optogenetic effect size, as measured by Cohen’s d, for the correct rate (a), miss rate (b), false alarm rate (c), lick efficiency (d) and sensitivity index (d′) (e) in the single DPA, dual-task DPA and dual-task baseline perturbation control tasks.
Figure 5 with 4 supplements
Neural correlates of the APC activity in the DNMS task.
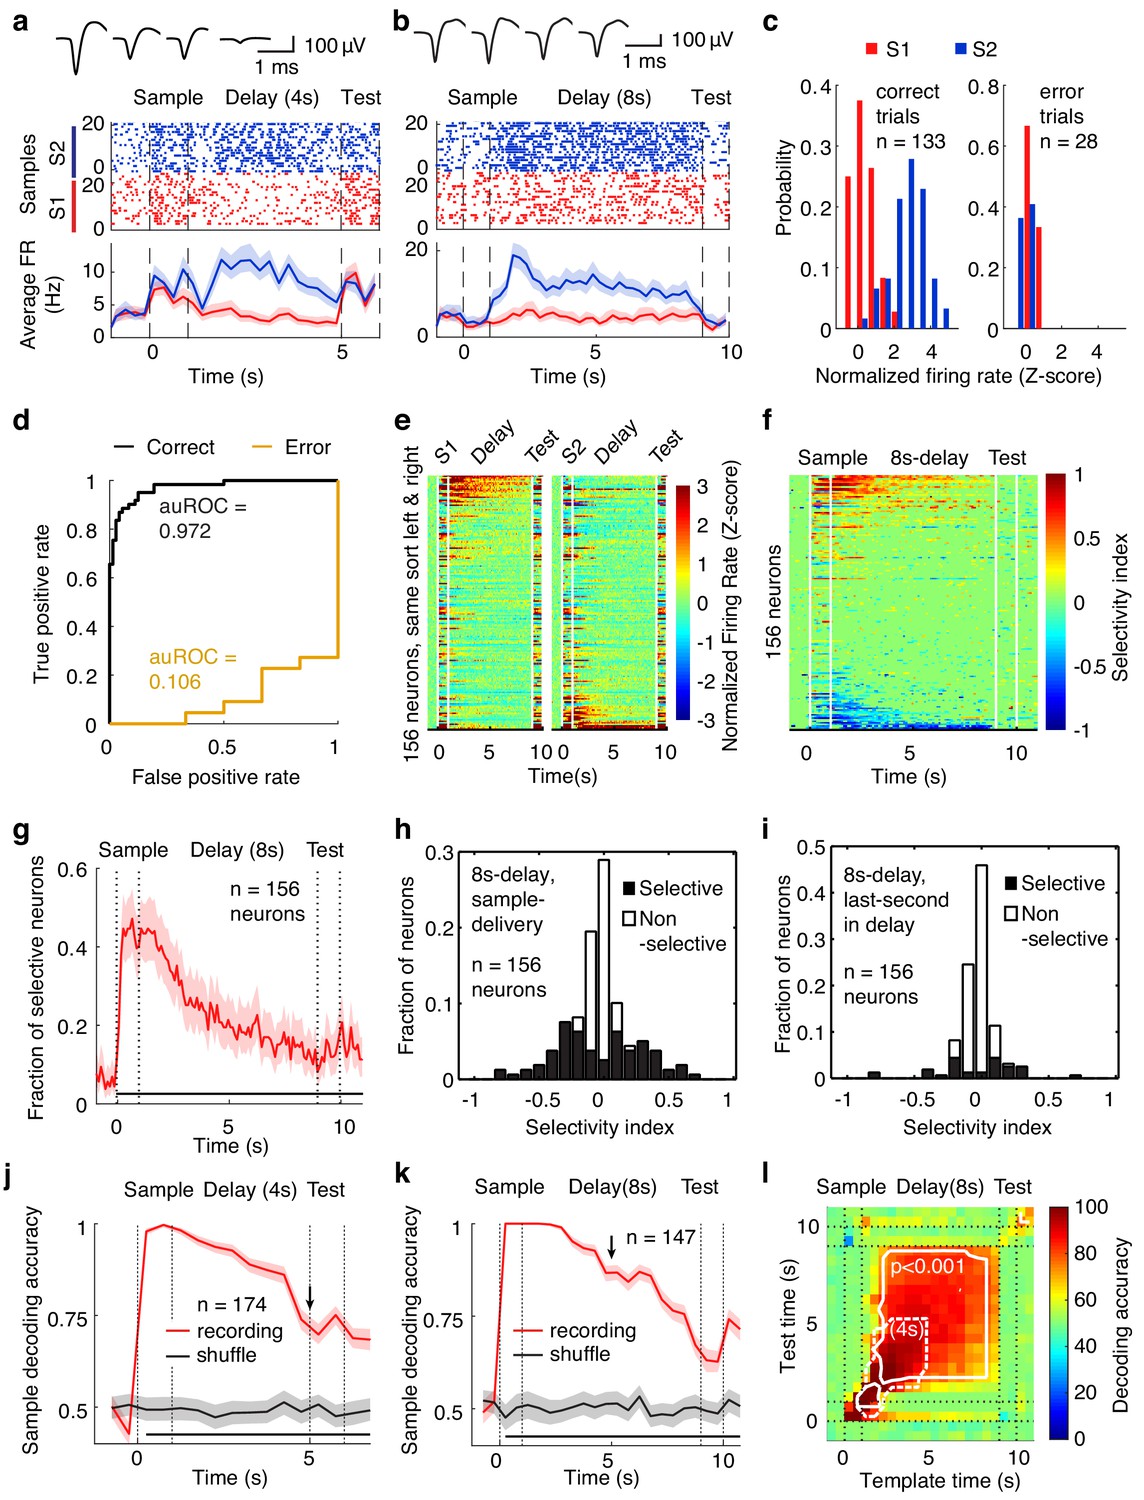
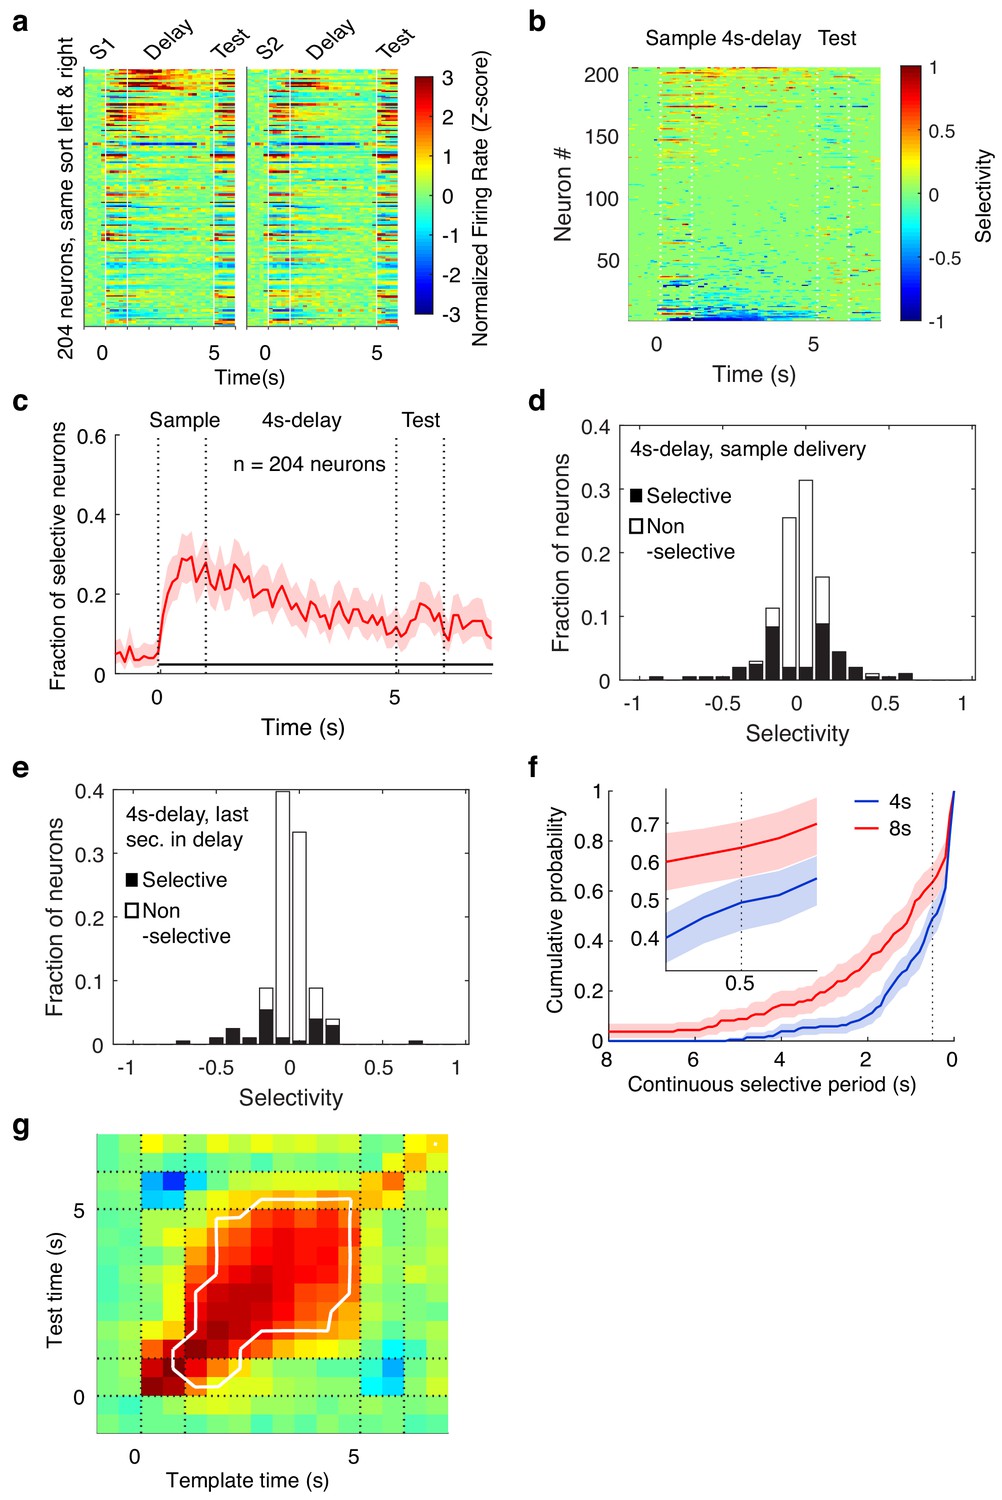
(a, b) Spike raster (top) and peristimulus time histogram (PSTH, bottom) of two example neurons recorded during the DNMS task. Shadow for PSTH shows the 95% confidence intervals. Top inset: spike waveforms from tetrode recording. The data in this and the following panels contained only correct trials, unless stated otherwise. (c) Normalized delay-period firing rate of the neuron in (a) though all the correct (left) and error (right) trials. (d) Area under receiver operating characteristic (auROC) of the neuron in (a) in correct and error trials. (e) Activity of neurons in the DNMS task with odor S1 (left) and S2 (right) as sample. Color: firing rates (FR) in Z-scores. Neurons were ordered according to the FRS1 – FRS2 values during the delay period (same order in both panels). The white lines indicate the onset or offset of odor delivery. (f) Firing rate selectivity, defined as the firing rate following sample 1 minus that following sample 2, divided by the sum, that is (FRS1–FRS2)/(FRS1+FRS2), for all of the recorded neurons in the DNMS task with 8 s delay duration. (g) Fraction of neurons with odor selectivity during the delay period, with a delay duration of 8 s. ***, p<0.001 in a chi-square test with 1 s before sample onset. Shadowing represents the 95% confidence interval of the mean from bootstrapping of 1000 repeats. (h) Distribution of single unit sample-odor selectivity during the sample-delivery period for the tasks of 8 s delay duration. (i) As in (h) but for the last second of the delay. (j) Sample decoding accuracy (resampled leave-one-trial-out cross validation accuracy) of the APC neuronal activity based on support vector machines (SVM), in the DNMS task with 4 s delay. Shadowing represents the 95% confidence interval of the mean from bootstrapping of 1000 repeats. Bottom black bar, p<0.001, two-tailed bootstrapping permutation test of 1000 repeats. (k) As in (j), for the DNMS task with 8 s delay. (l) Cross-temporal decoding matrix in the 8s-delay DNMS task. Dotted line, replication of the p<0.001 contour line in the 4s-delay DNMS cross-temporal decoding matrix, aligned at sample onset. See Figure 5—figure supplements 1–4 for more details of the recording and data analysis.
Figure 5—figure supplement 1

Design and implementation of the op-tetrodes.
(a–c) Microdrive, tetrode and recording sites. Images of the microdrive (a), tetrode (b) (electron microscopy scale bar, 20 μm) and examples of recording sites (c) (indicated by arrows).
Figure 5—figure supplement 2
Neural correlates of the APC activity in the DNMS task.
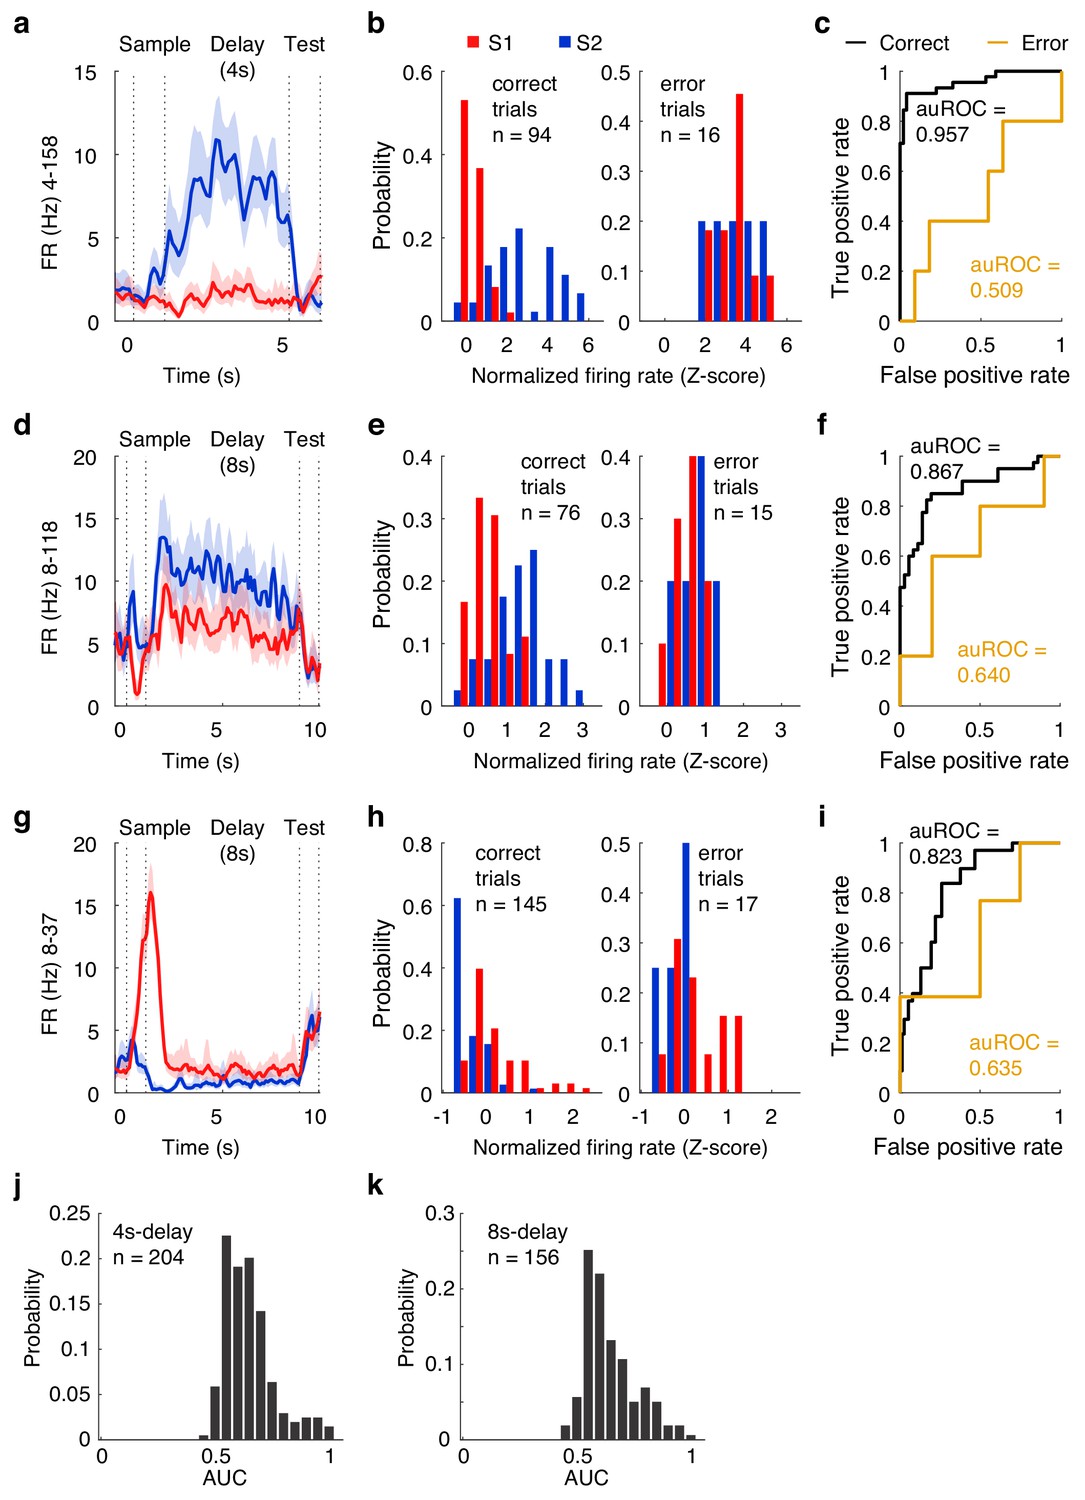
(a–i) As in Figure 5a,c,d), for three more example neurons. (j) Distribution of the auROC for all the recorded neurons during the 4s-delay in DNMS tasks in the correct trials. (k) As in (I), but in 8s-delay DNMS tasks.
Figure 5—figure supplement 3
Neural correlates of the APC activity in the DNMS task.
(a) Activity of neurons in the DNMS task with odor S1 (left) and S2 (right) as sample. Color: firing rates (FR) in Z-scores. Neurons were aligned according to the FRS1–FRS2 values during the delay period. White lines indicate the onset and offset of odor delivery. (b) Firing rate selectivity (firing rate following sample 1 minus that following sample 2, divided by the sum) for all the recorded neurons in the DNMS task of 4 s delay duration. (c) Fraction of neurons with odor selectivity during the delay period, with delay duration of 4 s. ***, p<0.001 as determined in a chi-square test with 1 s before sample onset. Shadowing represents the 95% confidence interval for the mean from bootstrapping of 1000 repeats. (d) Distribution of single unit sample-odor selectivity during the sample-delivery period for the tasks of 4 s delay duration. (e) As in (d) but for the last second of the delay. (f) Sample decoding accuracy of the APC neuronal activity based on the SVM, in the DNMS task with 4 s delay. Shadowing represents the 95% confidence interval for the mean from bootstrapping of 1000 repeats. Bottom black bar, p<0.001, two-tailed bootstrapping permutation test of 1000 repeats. (f) Cumulative density distribution of neurons with different durations of significant persistent selectivity in 4s-delay and 8s-delay DNMS tasks. Inset, magnified display of the curve around 0.5 s persistent selectivity. (g) Cross-temporal decoding matrix in the 4s-delay DNMS task.
Figure 5—figure supplement 4
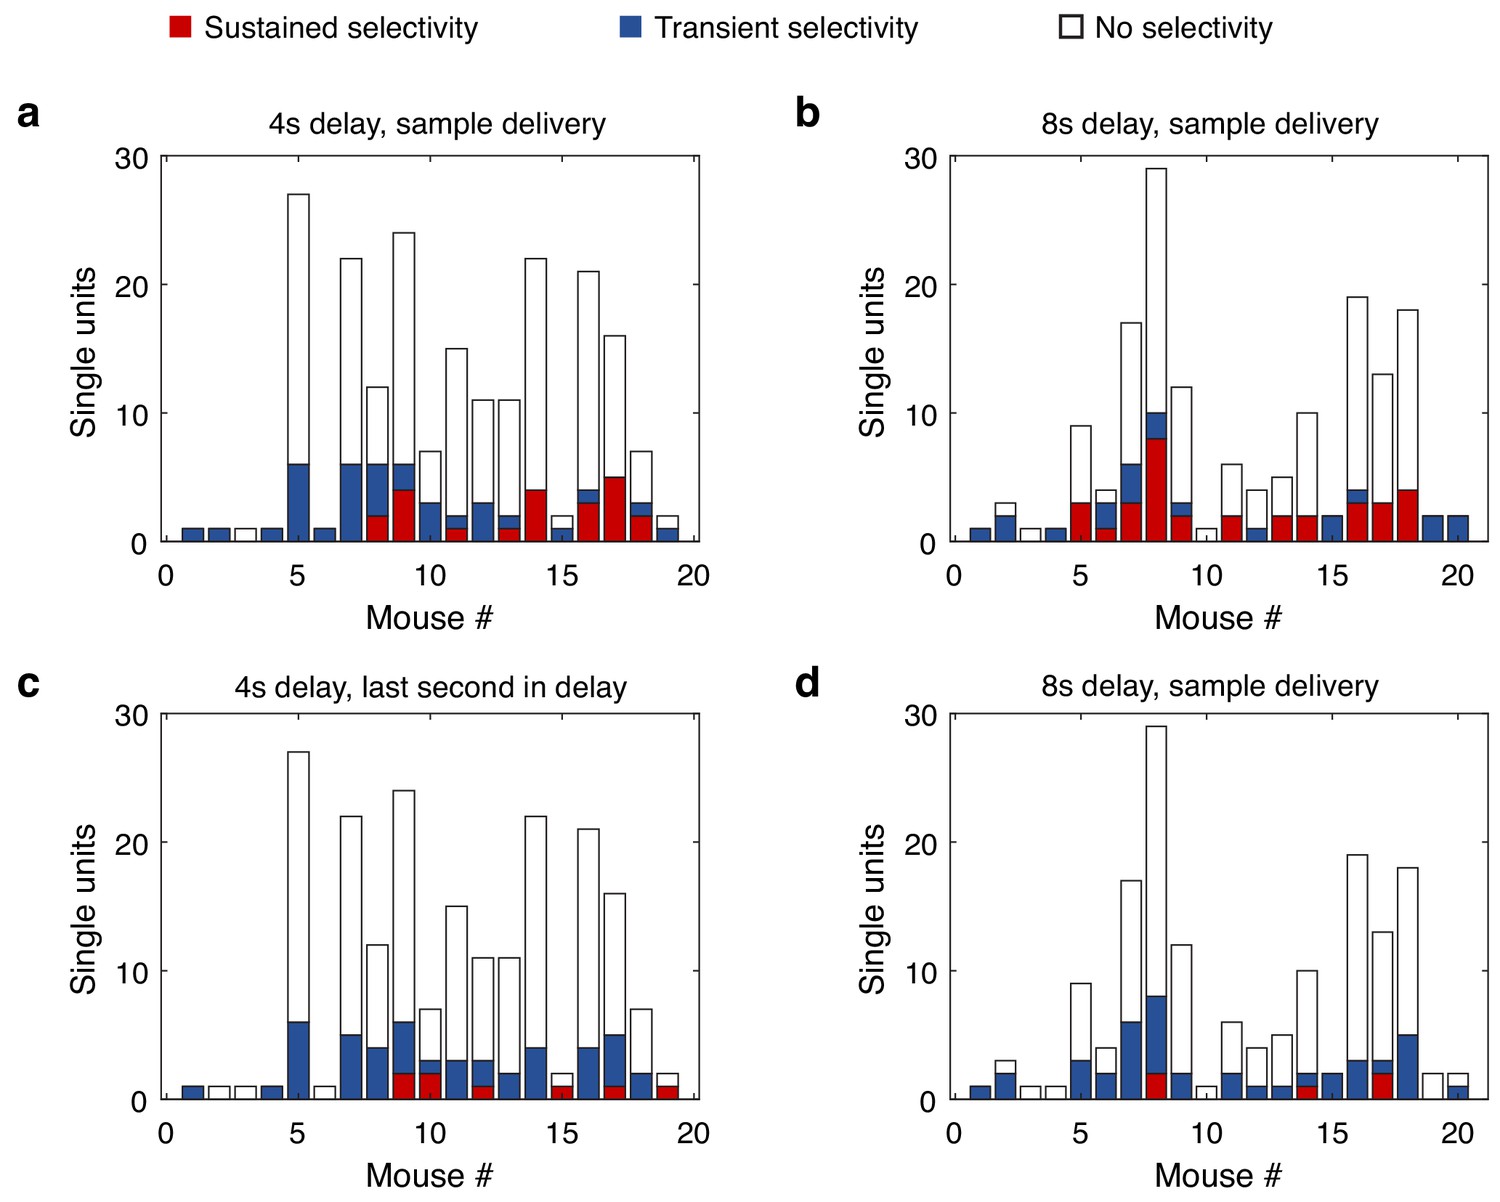
Selective neurons randomly distributed in different mice.
(a–d) Number of single units recorded for different mice, for sample delivery (a–b) or for the last second of the delay period (c–d). Note that selective neurons are randomly distributed in different mice.
Figure 6
Neural correlates of APC activity in the multiple-sample DPA task.
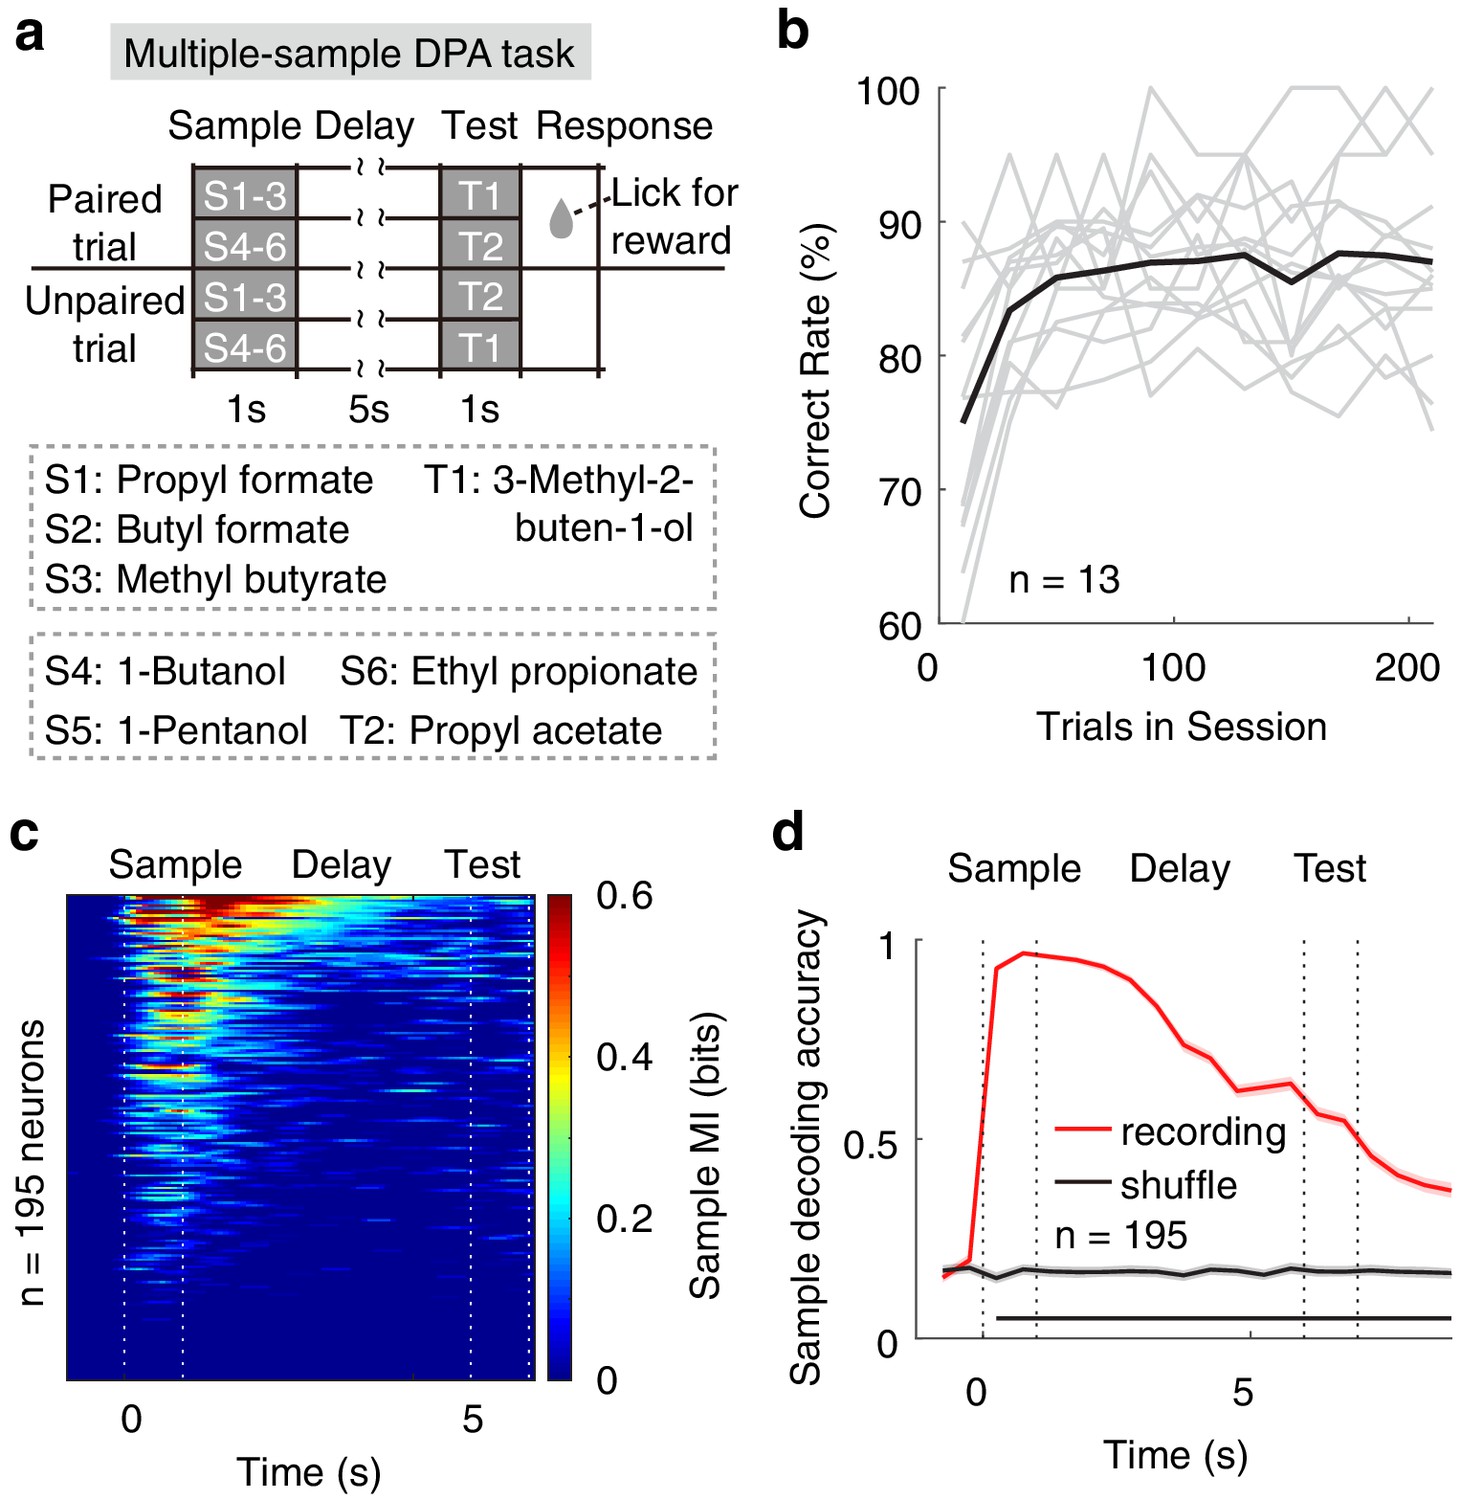
(a) Design of the multiple-sample DPA (MS-DPA) task. (b) Averaged daily performance of well-trained mice in the MS-DPA task. (c) Mutual information of the APC neurons for the sample odors in the MS-DPA task. Pixels were masked with p<0.001 (two-tailed permutation test of 1000 repeats against shuffled control). (d) Sample decoding accuracy (resampled cross validation accuracy) of the APC neurons in the MS-DPA task based on the SVM. Shadowing represent the 95% confidence interval of mean from bootstrapping of 1000 repeats. Bottom black bar, p<0.001, permutation test of 1000 repeats.
Figure 7
Neural correlates of the APC activity in dual-task experiments.
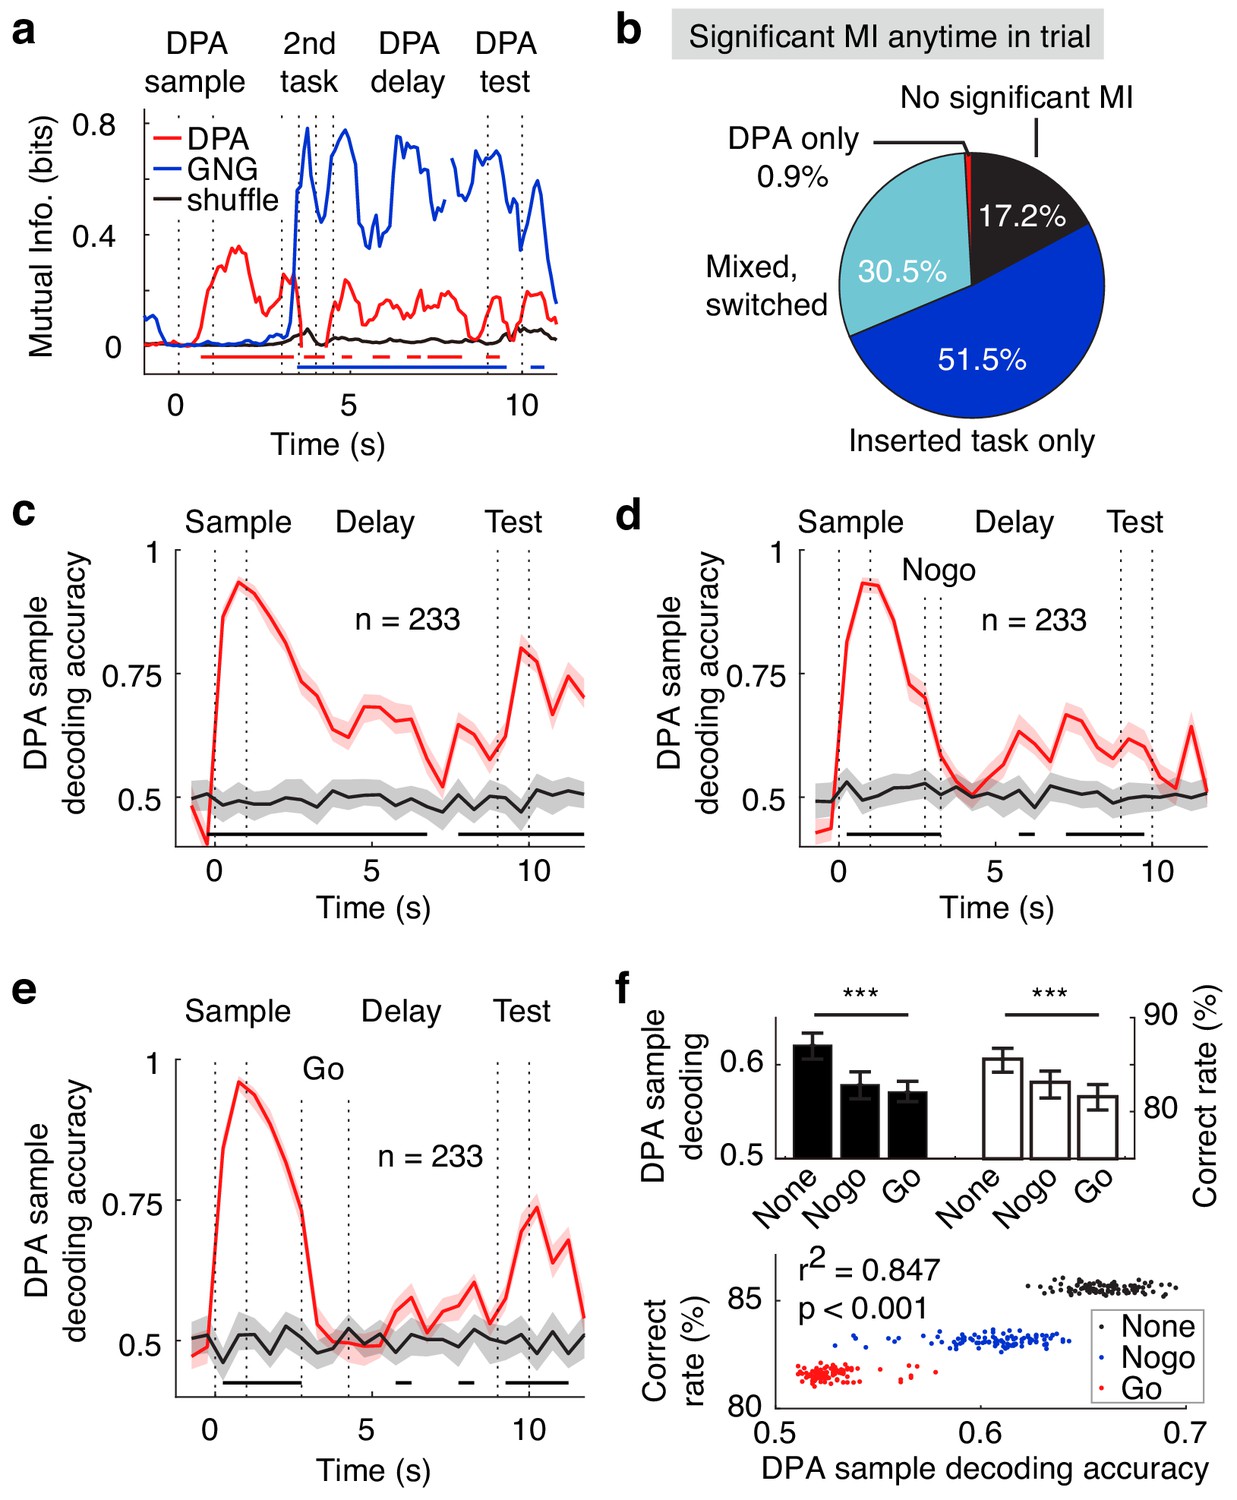
(a) Example neuron with mixed DPA-sample and GNG-task odor-cue information in the dual-task. Bottom bars, p<0.001 for DPA sample (red) and GNG cue (blue), two-tailed permutation test of 1000 repeats, comparing to shuffled control. (b) Fraction of neurons with exclusive or mixed/switched odor-cue information in the dual-task. (c) DPA sample decoding accuracy (resampled cross validation accuracy) of the APC neurons in the dual-task trials without a distractor. Bottom black bar, p<0.001, permutation test of 1000 repeats, unless stated otherwise. Shadowing represents the 95% confidence interval of mean from bootstrapping of 1000 repeats. (d) DPA sample decoding accuracy (resampled cross validation accuracy) of the APC neurons in the dual-task trials with the No-go distractor. (e) Same as (d), but in trials with the Go distractor. (f) Correlations between sample decoding of APC activity and dual-task performance. Top: averaged DPA sample decoding accuracy of the late delay period (left) and correct rate in DPA performance (right) under different distractor conditions. ***, p<0.001 as determined by one-way ANOVA. Bottom: correlations of DPA sample decoding accuracy and correct rate in bootstrap resamples. r2 is the Pearson correlation coefficient.
Videos
Video 1
Performance of a delayed non-match to sample task in mice.
https://doi.org/10.7554/eLife.43191.011
Video 2
Continuous video recording of mice performing a DNMS task with 20s-delay.
https://doi.org/10.7554/eLife.43191.012Tables
Key resources table
| Reagent type (species) or resource | Designation | Source or reference | Identifiers | Additional information |
|---|---|---|---|---|
| Strain, strain background (Mus musculus) | VGAT-CHR2:B6.Cg-Tg(Slc32a1-COP4*H134R/EYFP)8Gfng/J | Dr. Guoping Feng (Zhao et al., 2011) | VGAT-ChR2-EYFP line 8 | |
| Antibody | goat polyclonal anti-GFP (FITC) | Abcam | RRID: AB_305635 | (1:200) |
| Antibody | rabbit polyclonal anti-c-Fos | Synaptic Systems | RRID: AB_2231974 | (1:1000) |
| Antibody | Cy5 goat polyclonal anti-rabbit | Jackson | RRID: AB_2338013 | (1:2000) |
| Chemical compound, drug | DAPI | Beyotime | catalog number: C1002 | |
| Chemical compound, drug | propyl formate | Sigma-Aldrich | catalog number: 245852 | |
| Chemical compound, drug | butyl formate | Sigma-Aldrich | catalog number: 261521 | |
| Chemical compound, drug | methyl butyrate | Sigma-Aldrich | catalog number: 246093 | |
| Chemical compound, drug | 3-methyl-2-buten-1-ol | Sigma-Aldrich | catalog number: W364703 | |
| Chemical compound, drug | 1-butanol | Sigma-Aldrich | catalog number: B7906 | |
| Chemical compound, drug | 1-pentanol | Sigma-Aldrich | catalog number: 398268 | |
| Chemical compound, drug | ethyl propionate | Sigma-Aldrich | catalog number: 112305 | |
| Chemical compound, drug | propyl acetate | Sigma-Aldrich | catalog number: 133108 | |
| Software, algorithm | MATLAB | MathWorks | RRID: SCR_001622 | |
| Software, algorithm | LIBSVM | https://www.csie.ntu.edu.tw/~cjlin/libsvm/ | RRID: SCR_010243 |
Additional files
-
Transparent reporting form
- https://doi.org/10.7554/eLife.43191.037
Download links
A two-part list of links to download the article, or parts of the article, in various formats.
Downloads (link to download the article as PDF)
Open citations (links to open the citations from this article in various online reference manager services)
Cite this article (links to download the citations from this article in formats compatible with various reference manager tools)
Active information maintenance in working memory by a sensory cortex
eLife 8:e43191.
https://doi.org/10.7554/eLife.43191


