The proteasome biogenesis regulator Rpn4 cooperates with the unfolded protein response to promote ER stress resistance
- DKFZ-ZMBH Alliance and CellNetworks Cluster of Excellence, Germany
- Max Planck Institute of Biochemistry, Germany
Figures
Figure 1 with 1 supplement
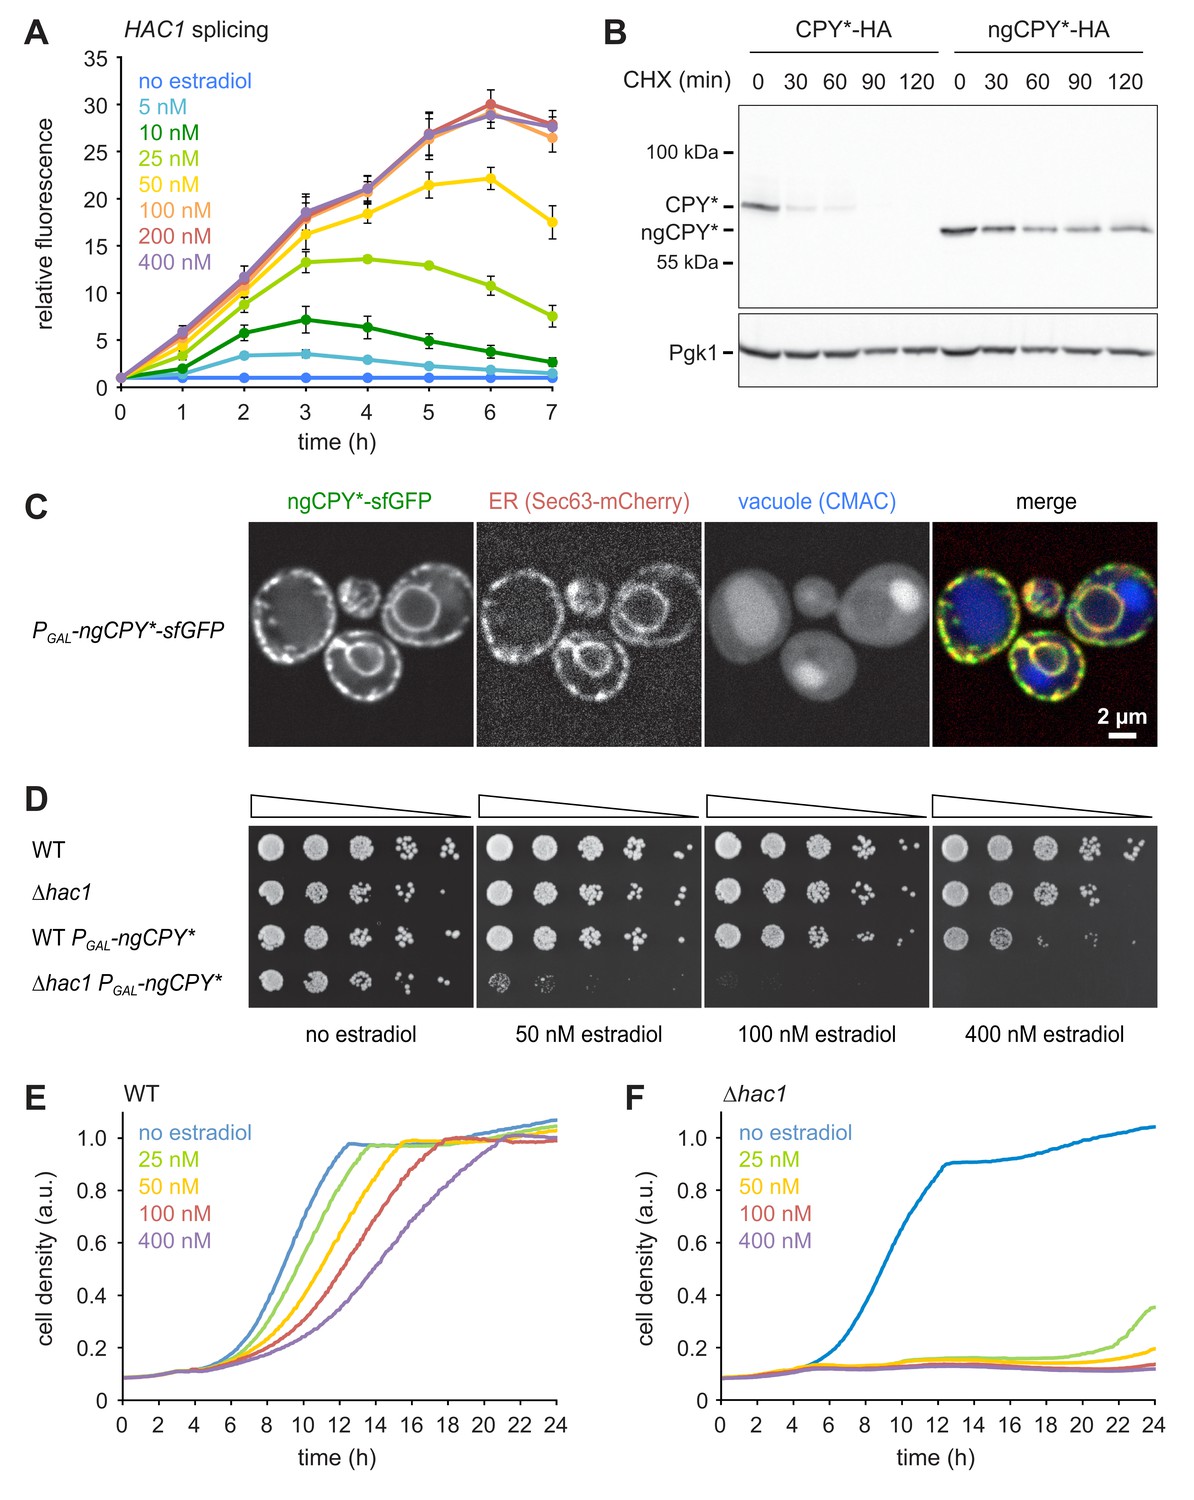
A titratable system for the induction of ER stress.
(A) Flow cytometric measurement of GFP levels in cells harboring the HAC1 splicing reporter and expressing ngCPY* under the control of the estradiol-inducible GAL promoter system. For each time point, data are normalized to untreated cells. Mean ±SEM, n = 3. (B) Western blot of HA and Pgk1 from cells expressing CPY*-HA or ngCPY*-HA. Cells were treated with cycloheximide (CHX) for the times indicated. Pgk1 served as a loading control. (C) Images of cells expressing ngCPY*-sfGFP and the general ER marker Sec63-mCherry. Expression of ngCPY*-sfGFP was induced with 25 nM estradiol for 4 hr and cells were stained with the vacuole dye CMAC. (D) Growth assay on solid media of wild-type (WT) and ∆hac1 cells expressing the estradiol-inducible artificial transcription factor GEM and, where indicated, ngCPY* under the control of the GAL promoter. For each strain, series represent fivefold dilution steps. (E) Growth assay in liquid media of WT cells expressing ngCPY* under the control of the estradiol-inducible GAL promoter system. a.u., arbitrary units. (F) As in panel E, but with ∆hac1 cells.
Figure 1—figure supplement 1
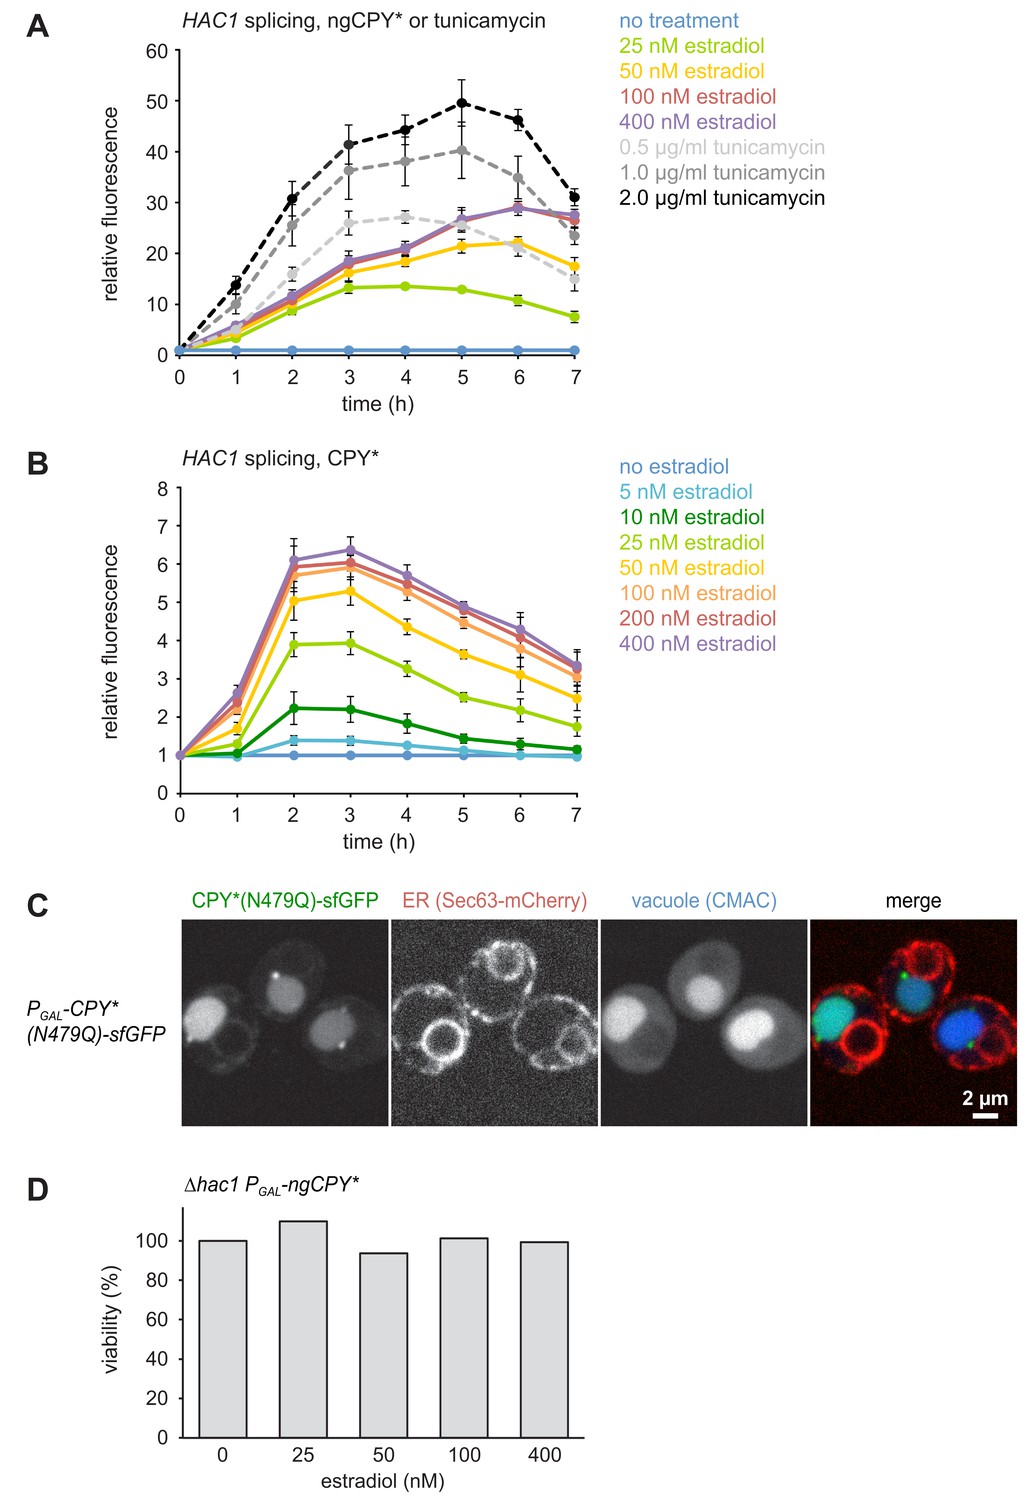
A titratable system for the induction of ER stress.
(A) Flow cytometric measurement of GFP levels in cells harboring the HAC1 splicing reporter and expressing ngCPY* under the control of the estradiol-inducible GAL promoter system. For each time point, data are normalized to untreated cells. Mean ±SEM, n = 3. (B) As in panel A, but with cells expressing glycosylatable CPY*. (C) Images of cells expressing CPY*(N479Q)-sfGFP and the ER marker Sec63-mCherry. Expression of CPY*(N479Q)-sfGFP was induced with 25 nM estradiol for 4 hr and cells were stained with the vacuole dye CMAC. (D) Viability of ∆hac1 cells after induction of ngCPY* expression with the indicated estradiol concentrations for 24 hr. Viability of untreated cells was set to 100%.
Figure 2
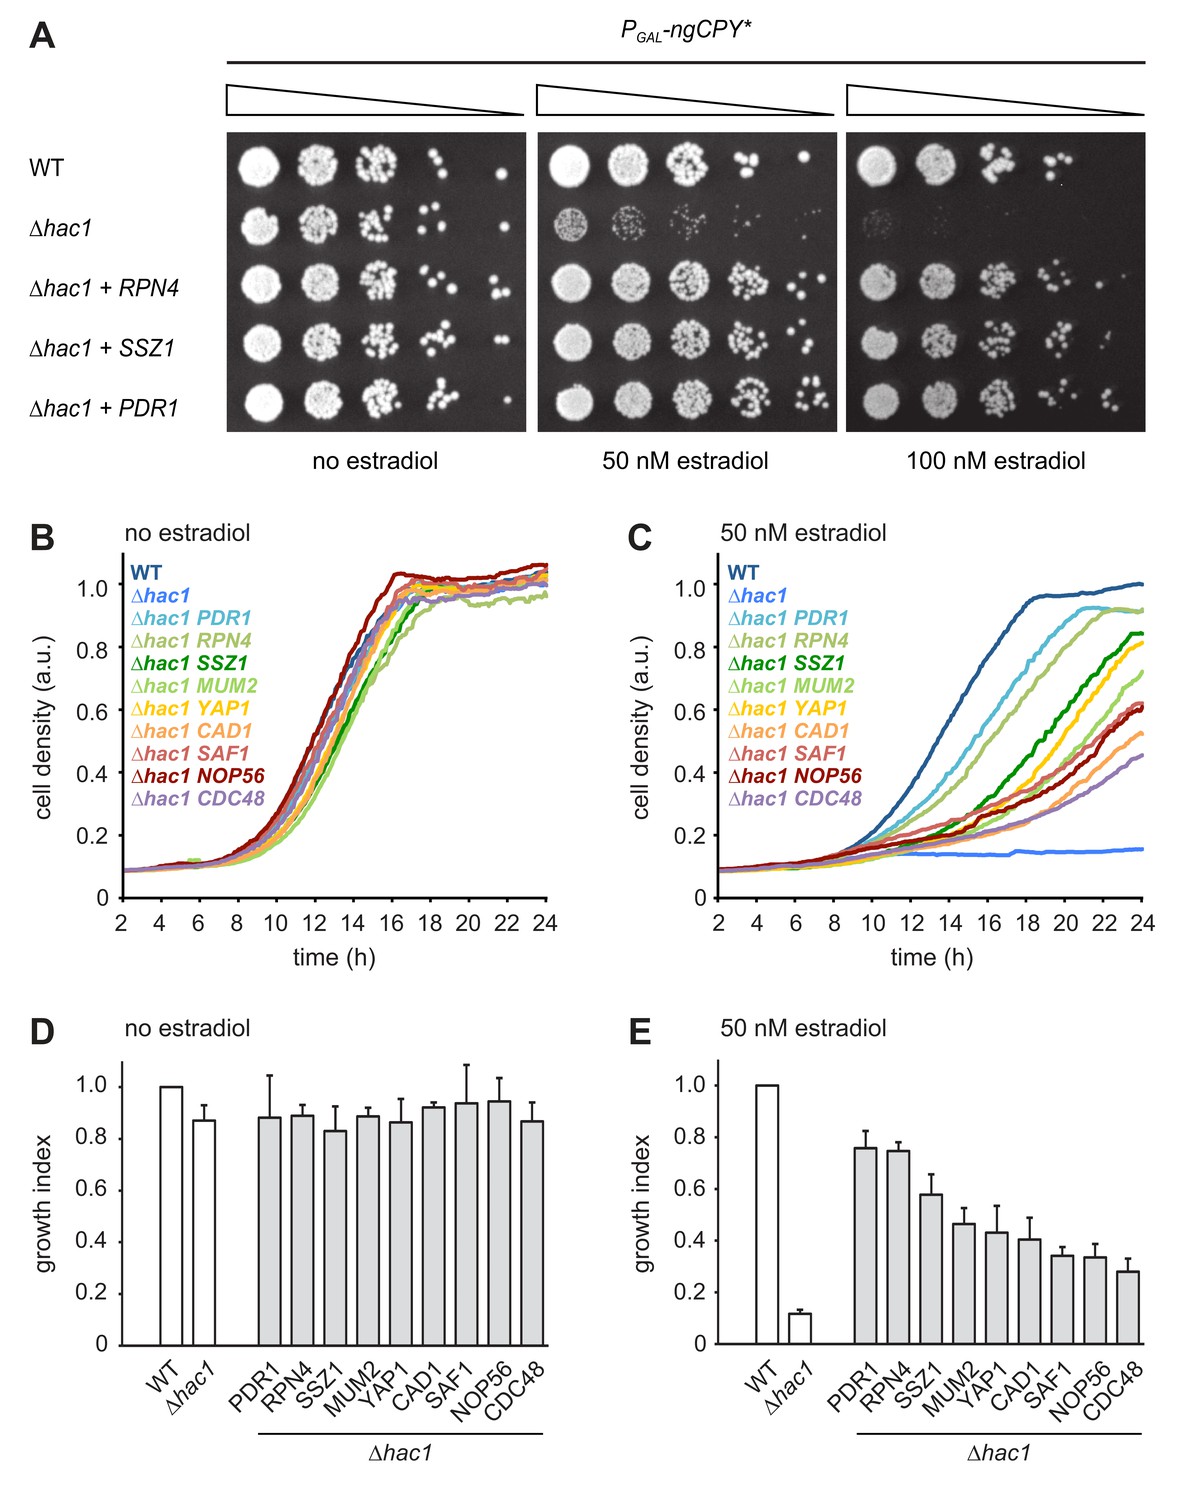
Multicopy suppression of ngCPY* toxicity in ∆hac1 cells.
(A) Growth assay on solid media of wild-type (WT) and ∆hac1 cells expressing ngCPY* under the control of the estradiol-inducible GAL promoter system and overexpressing RPN4, SSZ1 or PDR1 from extrachromosomal plasmids where indicated. (B) Growth assay in liquid medium of WT and ∆hac1 cells expressing ngCPY* under the control of the estradiol-inducible GAL promoter system. ∆hac1 cells additionally overexpressed the indicated genes. Cells were grown without estradiol. a.u., arbitrary units. (C) As in panel B, but in the presence of 50 nM estradiol. (D) Quantification of growth assays as shown in panel B. Data are normalized to WT cells. Mean ±SEM, n = 4. (E) Quantification of growth assays as shown in panel C. Data are normalized to WT cells. Mean ±SEM, n = 4.
Figure 3
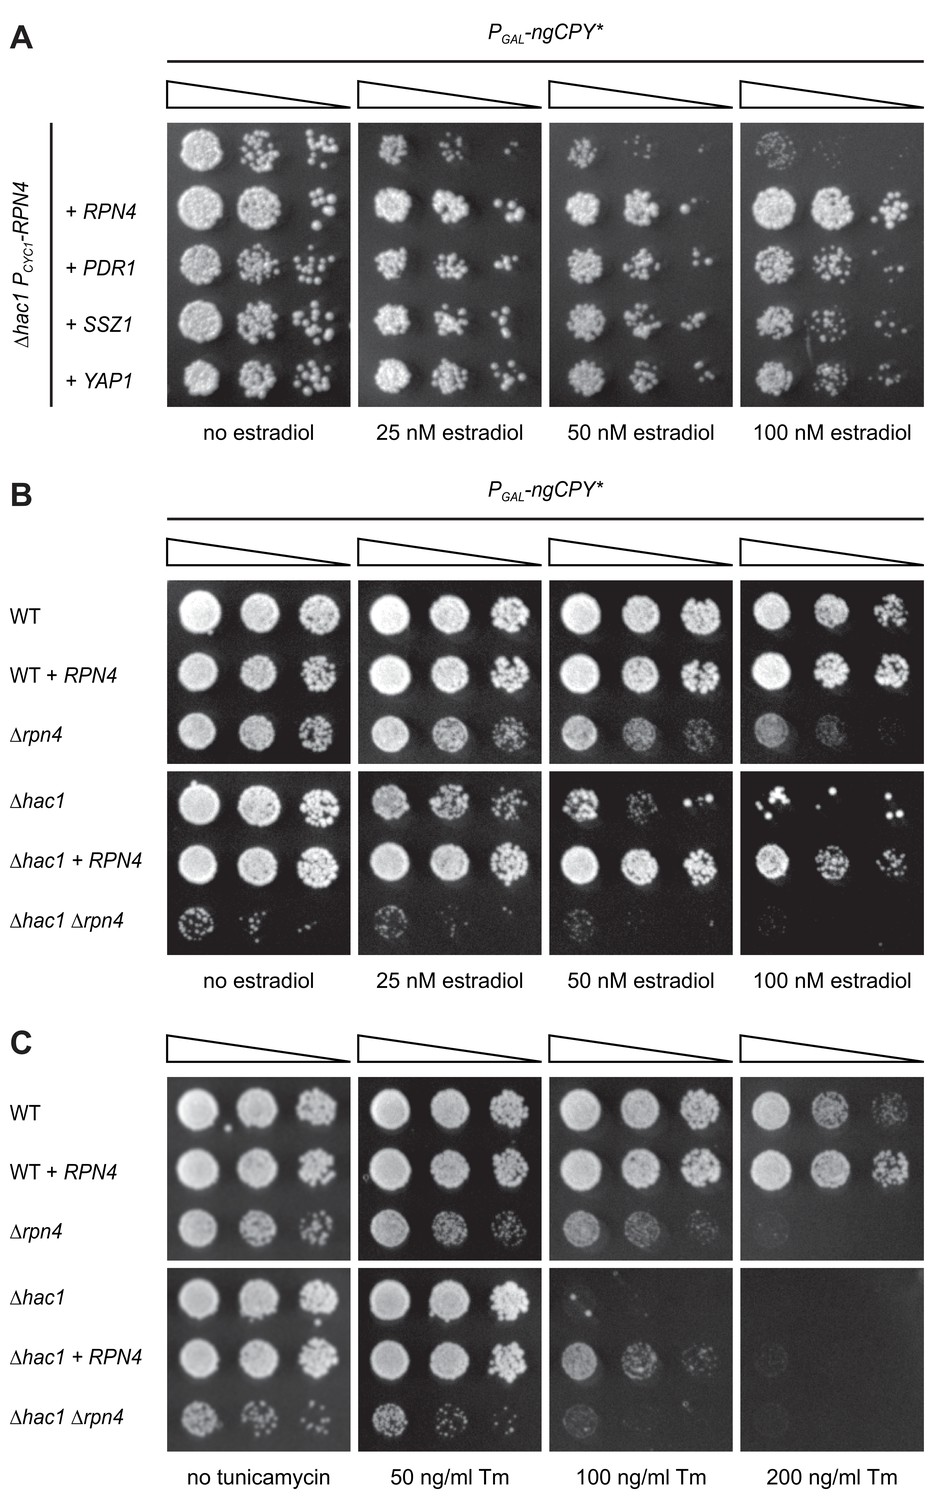
Rpn4 and the UPR are functionally linked.
(A) Growth assay on solid media of ∆hac1 cells containing the constitutive CYC1 promoter in place of the endogenous RPN4 promoter, expressing ngCPY* under the control of the estradiol-inducible GAL promoter system and overexpressing RPN4, SSZ1, PDR1 or YAP1 where indicated. (B) Growth assay on solid media of wild-type (WT), ∆rpn4, ∆hac1 and ∆hac1 ∆rpn4 cells expressing ngCPY* under the control of the estradiol-inducible GAL promoter system and overexpressing RPN4 where indicated. (C) As in panel B, but on media containing different concentrations of tunicamycin (Tm).
Figure 4
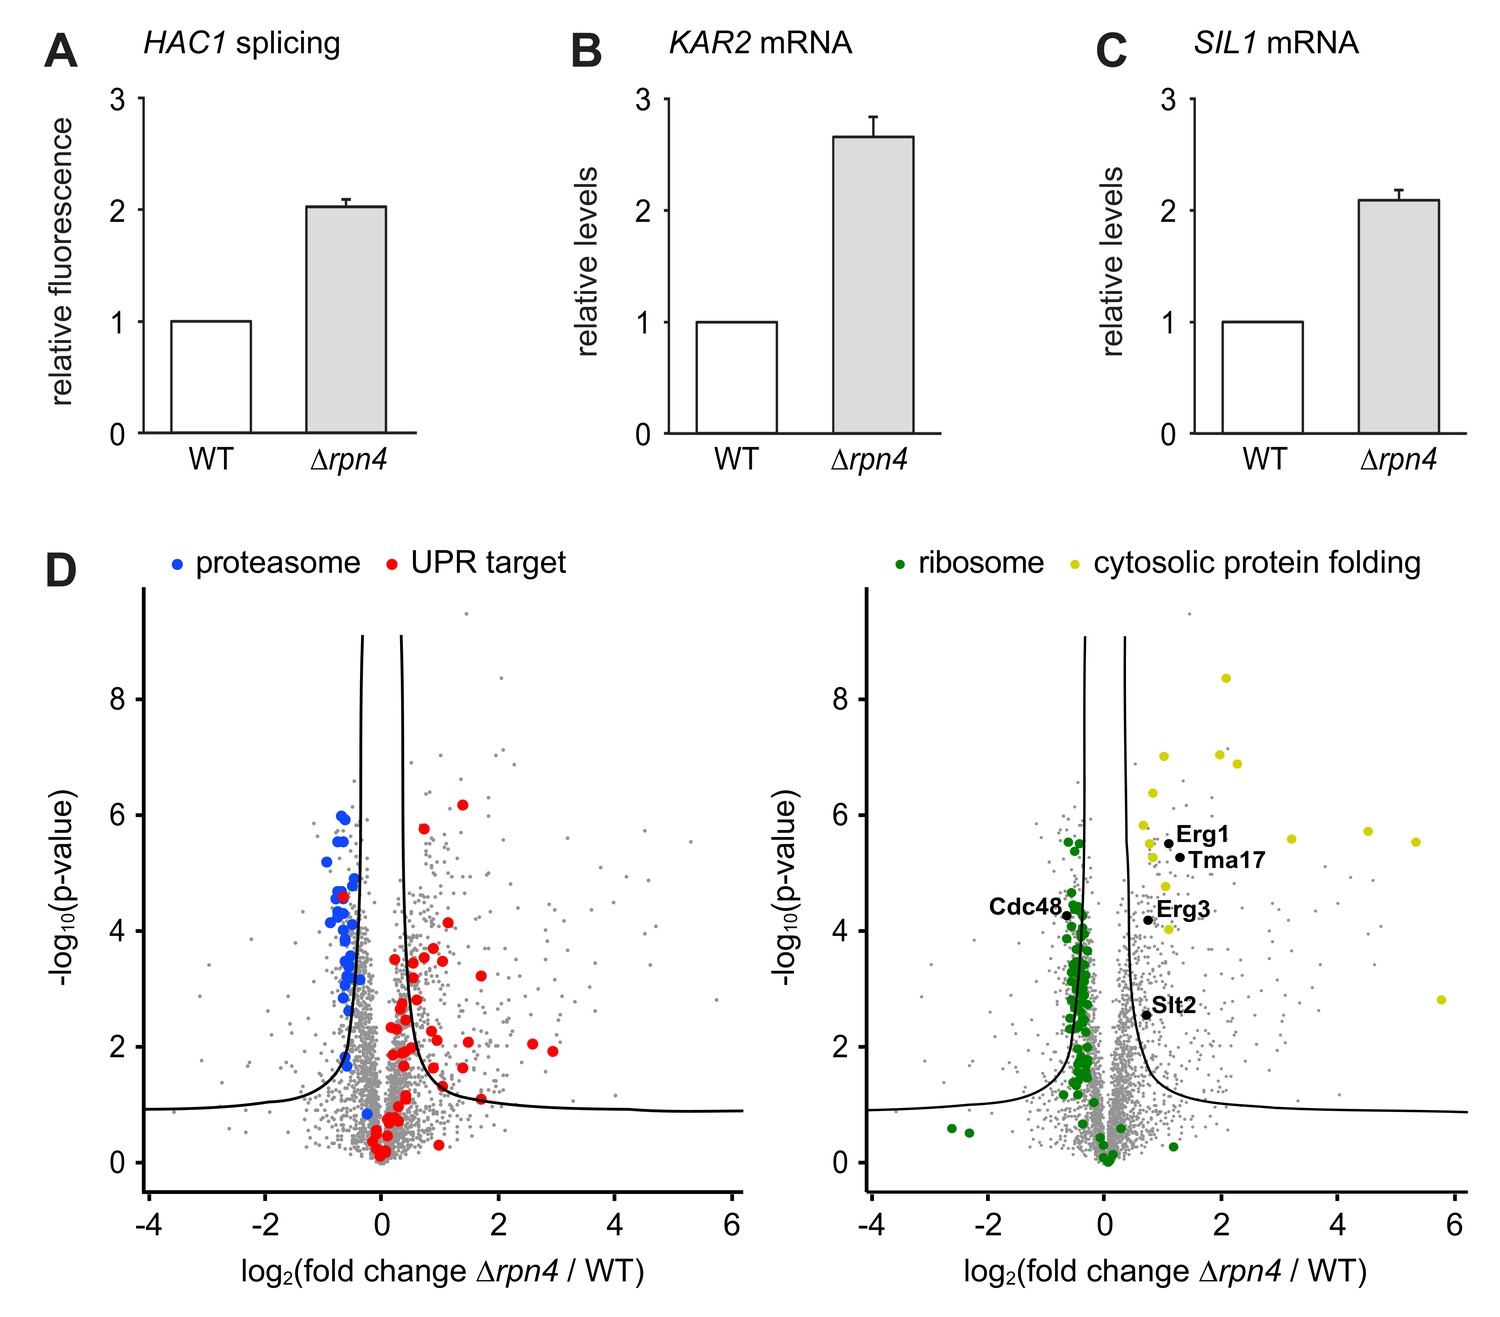
Loss of Rpn4 activates the UPR and triggers a broad adaptive response.
(A) Flow cytometric measurement of GFP levels relative to cytosolic BFP in wild-type (WT) and ∆rpn4 cells harboring the HAC1 splicing reporter. Data are normalized to WT cells. Mean ±SEM, n = 3. (B) KAR2 mRNA levels in WT and ∆rpn4 cells as measured by quantitative real-time PCR. Data are normalized to WT cells. Mean ±SEM, n = 3. (C) As in panel B, but for SIL1. (D) Global effects of RPN4 deletion on protein expression. For each protein, the x axis shows the average log2 fold change between WT and ∆rpn4 cells (proteins increased in the ∆rpn4 strain have positive values); the y axis shows the result of a t test for that difference (two-tailed; n = 4). The ‘‘volcano’’ lines indicate thresholds of significance. Proteins falling above the volcano lines are significantly changed. The left and right panels show the same plot but with different proteins highlighted. See Figure 4—source data 1 for the data used to generate the plot. In ∆rnp4 cells, proteasome subunits are downregulated (blue dots, p=1.1×10⁻¹⁷, n = 32), UPR targets are upregulated (red dots, p=1.8×10⁻⁹, n = 50), ribosomal proteins are downregulated (green dots, p=7.5×10⁻²⁹, n = 89) and proteins involved in cytosolic protein folding are upregulated (yellow dots, p=3.8×10⁻⁹, n = 14).
-
Figure 4—source data 1
Proteomics data.
- https://doi.org/10.7554/eLife.43244.008
Figure 5 with 2 supplements
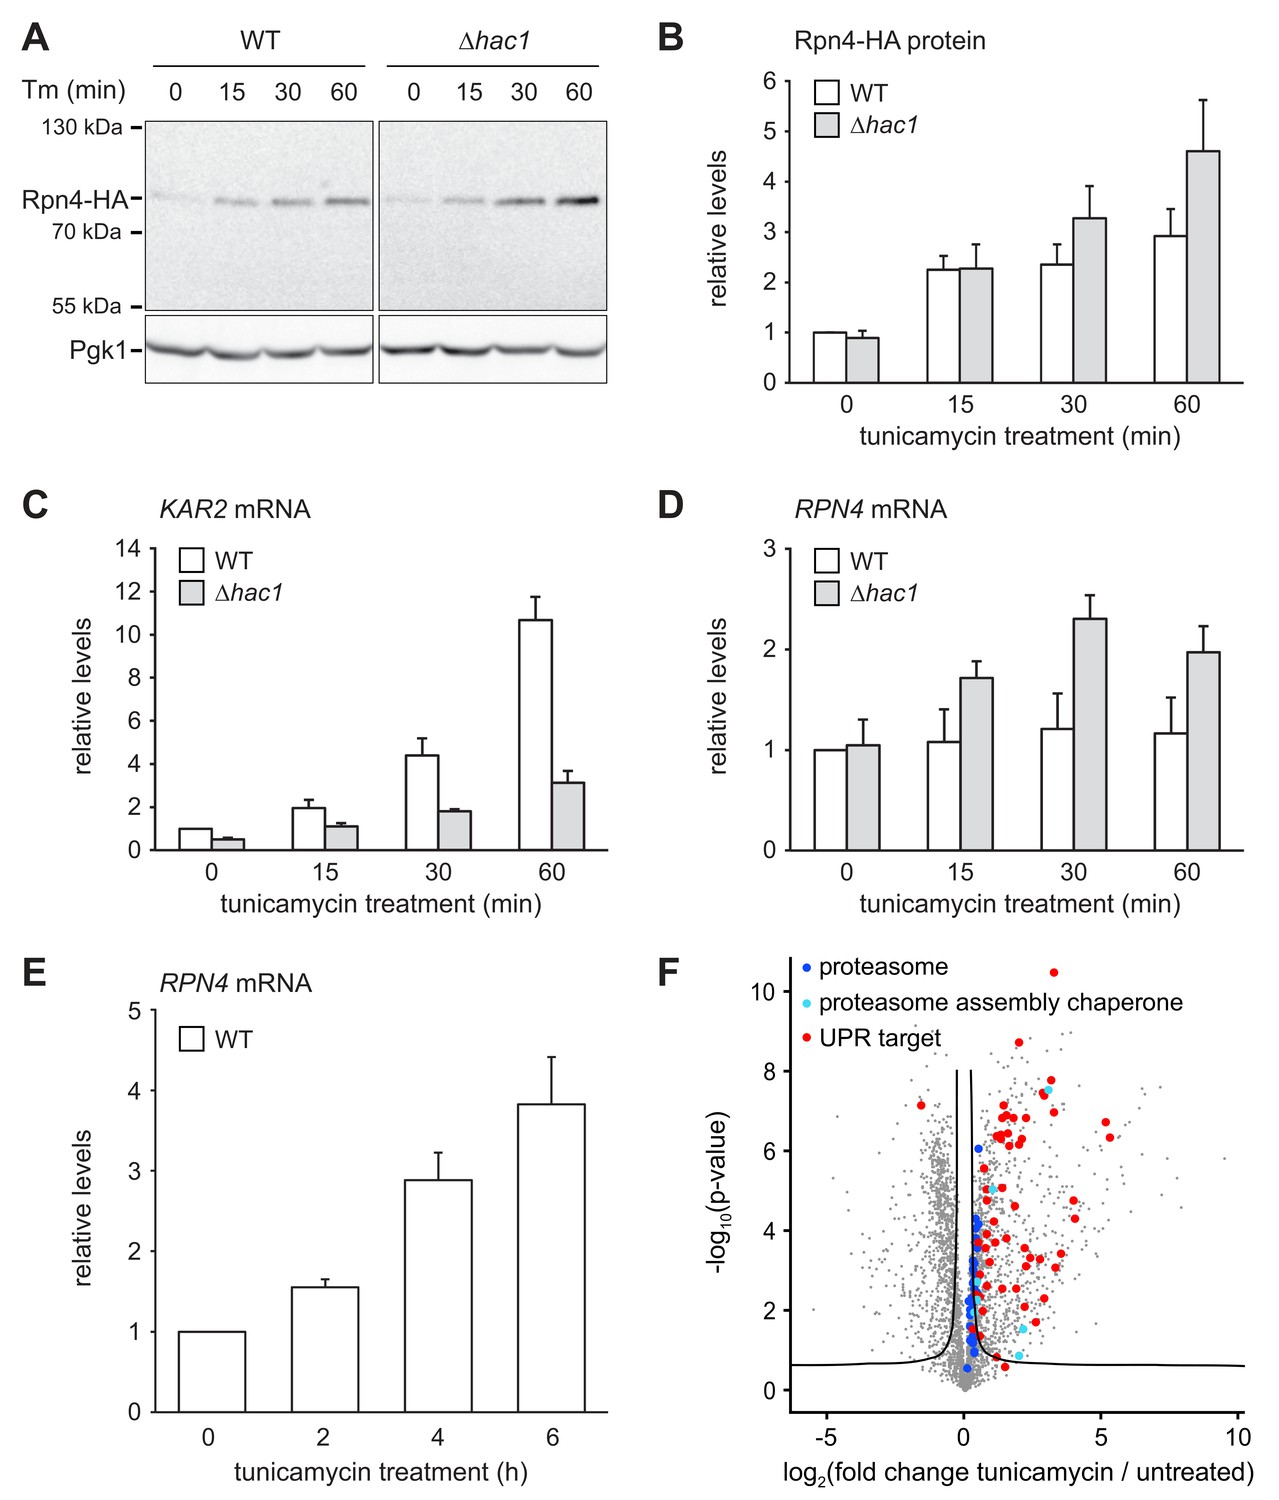
ER stress increases Rpn4 abundance, induces RPN4 transcription and promotes proteasome biogenesis.
(A) Western blot of HA and Pgk1 from wild-type (WT) and ∆hac1 cells expressing Rpn4-HA and treated with 2 µg/ml tunicamycin (Tm) for the times indicated. (B) Quantification of Rpn4-HA protein levels relative to Pgk1 from western blots as shown in panel A. Data are normalized to WT cells at t = 0. Mean ±SEM, n = 5. (C) KAR2 mRNA levels in WT and ∆hac1 cells treated with 2 µg/ml tunicamycin for the times indicated. Data are normalized to WT cells at t = 0. Mean ±SEM, n = 3. (D) As in panel C, but for RPN4. (E) As in panel C, but for RPN4 after treatment with 5 µg/ml tunicamycin for the times indicated. (F) Global effects of tunicamycin treatment on protein expression. For each protein, the x axis shows the average log2 fold change between untreated WT cells and WT cells treated with 5 µg/ml tunicamycin for 4 hr (proteins upregulated by the treatment have positive values); the y axis shows the result of a t test for that difference (two-tailed; n = 4). The ‘‘volcano’’ lines indicate thresholds of significance. Proteins falling above the volcano lines are significantly changed. See Figure 4—source data 1 for the data used to generate the plot. Treatment with tunicamycin causes upregulation of proteasome subunits (dark blue dots, p=7.6×10⁻³, n = 32), proteasome assembly chaperones (light blue dots, p=3.3×10⁻³, n = 8), and UPR targets (red dots, p=3.3×10⁻²², n = 58).
Figure 5—figure supplement 1
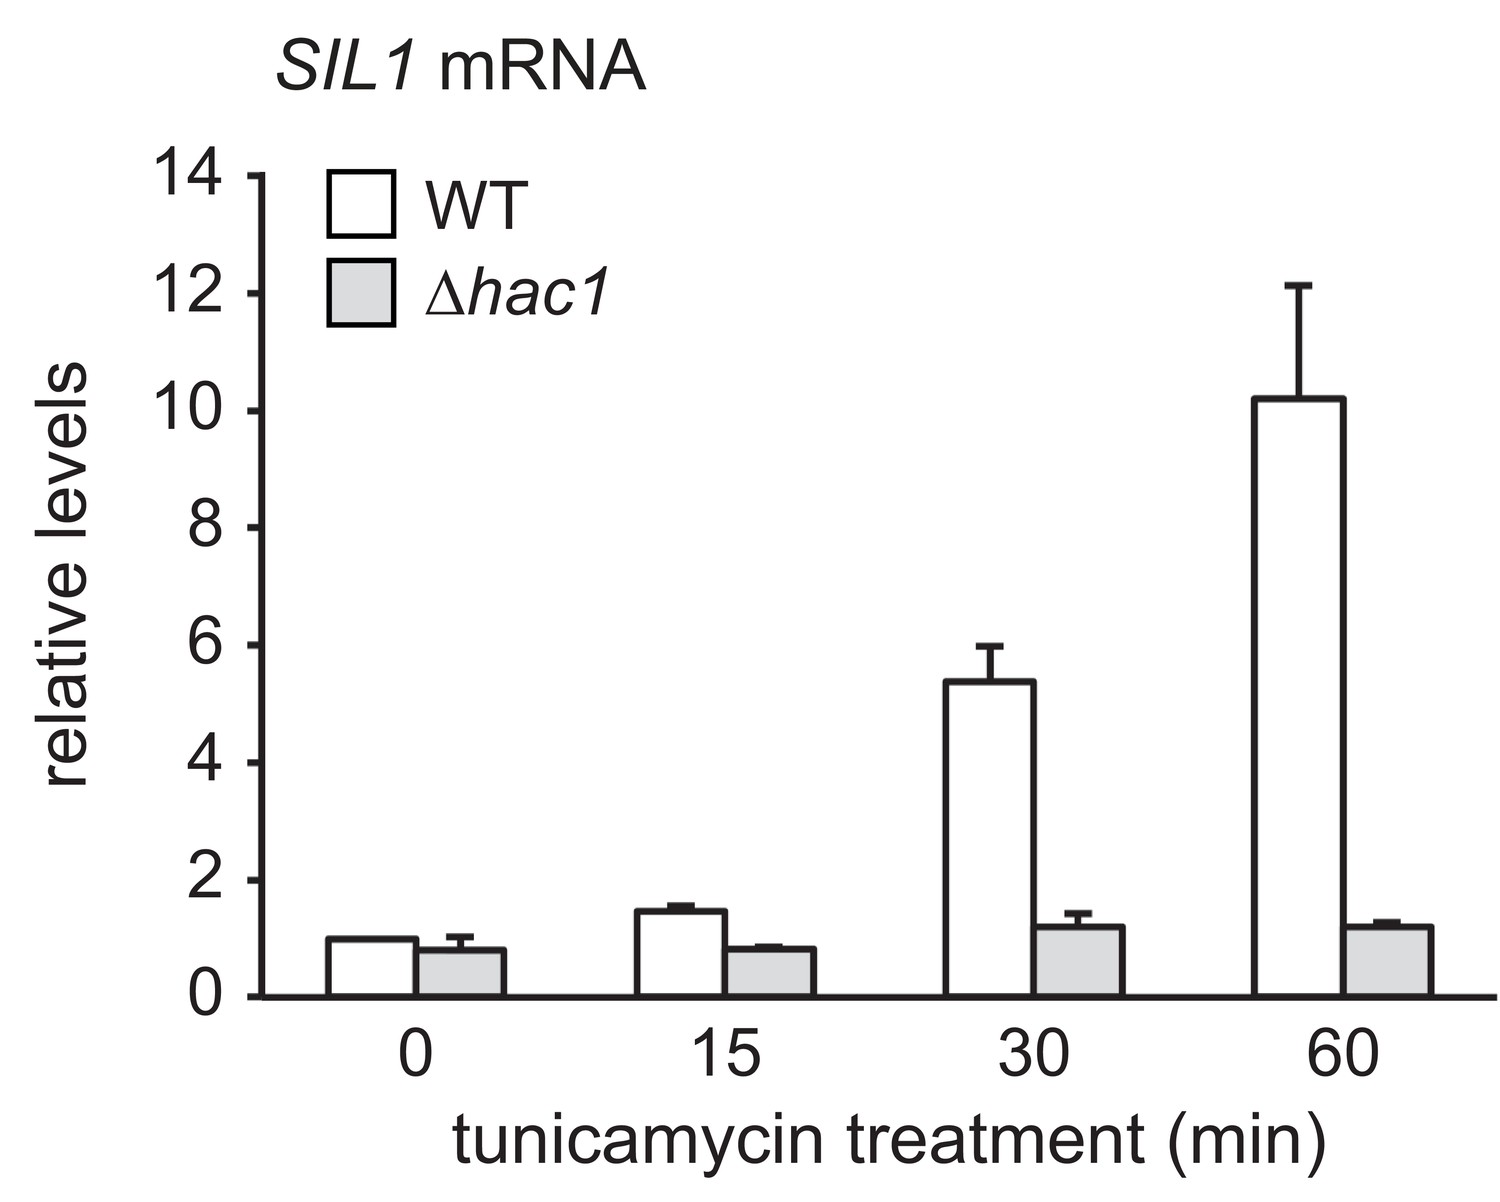
SIL1 mRNA levels in wild-type and ∆hac1 cells treated with tunicamycin.
SIL1 mRNA levels in wild-type (WT) and ∆hac1 cells treated with 2 µg/ml tunicamycin for the times indicated. Data are normalized to WT cells at t = 0. Mean ±SEM, n = 3.
Figure 5—figure supplement 2

Effects of tunicamycin treatment on the levels of proteasome subunits in wild-type and ∆rpn4 cells.
Wild-type (WT) and ∆rpn4 cells were left untreated (0 hr) or treated with 5 µg/ml tunicamycin for 4 hr. Proteasome subunit abundance was normalized to that in untreated WT cells (value = 0 in log2 space). Bars represent the mean log2(fold change)±SEM, n = 32. See Figure 4—source data 1 for the data used to generate the graph.
Figure 6 with 1 supplement
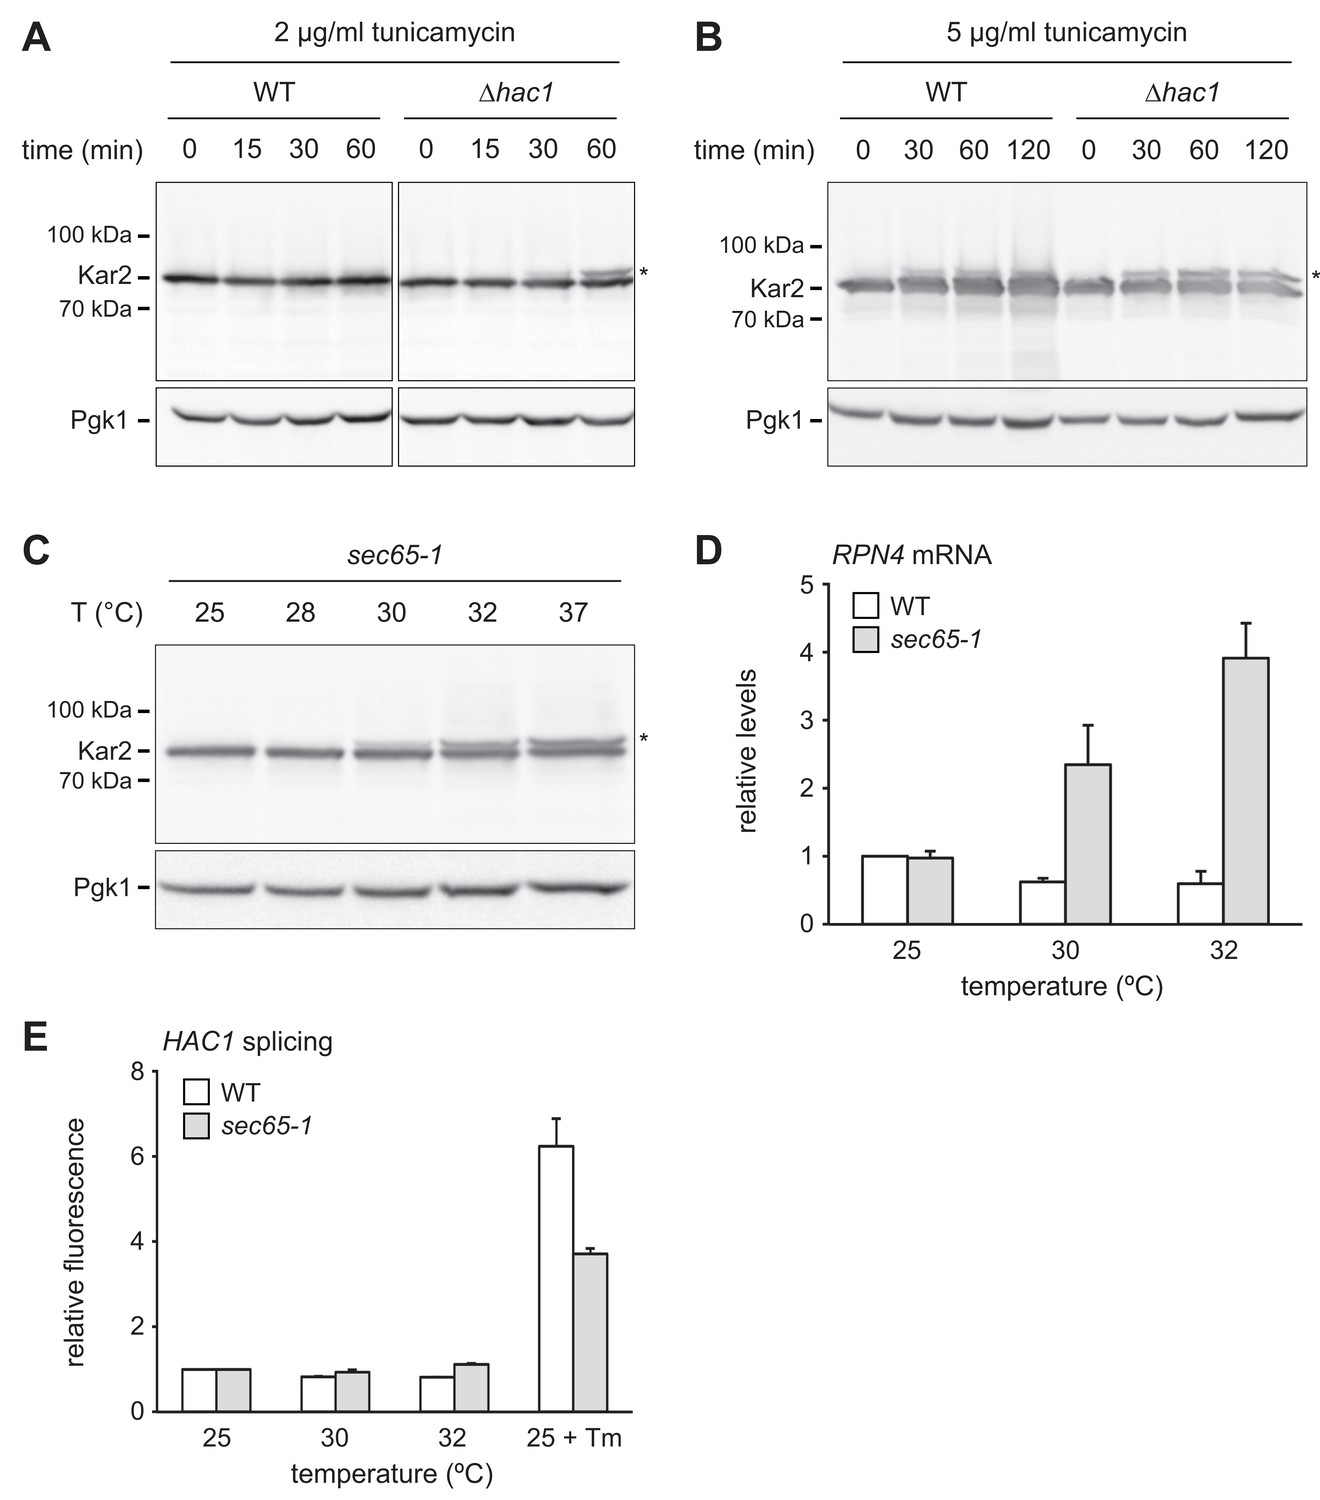
RPN4 is upregulated by cytosolic mislocalization of secretory proteins.
(A) Western blot of Kar2 and Pgk1 from wild-type (WT) and ∆hac1 cells treated with 2 µg/ml tunicamycin for the times indicated. The asterisk indicates untranslocated ss-Kar2. (B) As in panel A, but with 5 µg/ml tunicamycin. (C) Western blot of Kar2 and Pgk1 from sec65-1 cells grown at 25°C and shifted to the indicated temperatures for 90 min. The asterisk indicates untranslocated ss-Kar2. (D) RPN4 mRNA levels in WT and sec65-1 cells grown at 25°C and shifted to the indicated temperatures for 90 min. Data are normalized to WT cells at 25°C. Mean ±SEM, n = 3. (E) Flow cytometric measurement of GFP levels in WT and sec65-1 cells harboring the HAC1 splicing reporter. Cells grown at 25°C were shifted to the indicated temperatures or treated with 2 µg/ml tunicamycin (Tm) for 90 min. For each strain, data are normalized to 25°C. Mean ±SEM, n = 3.
Figure 6—figure supplement 1
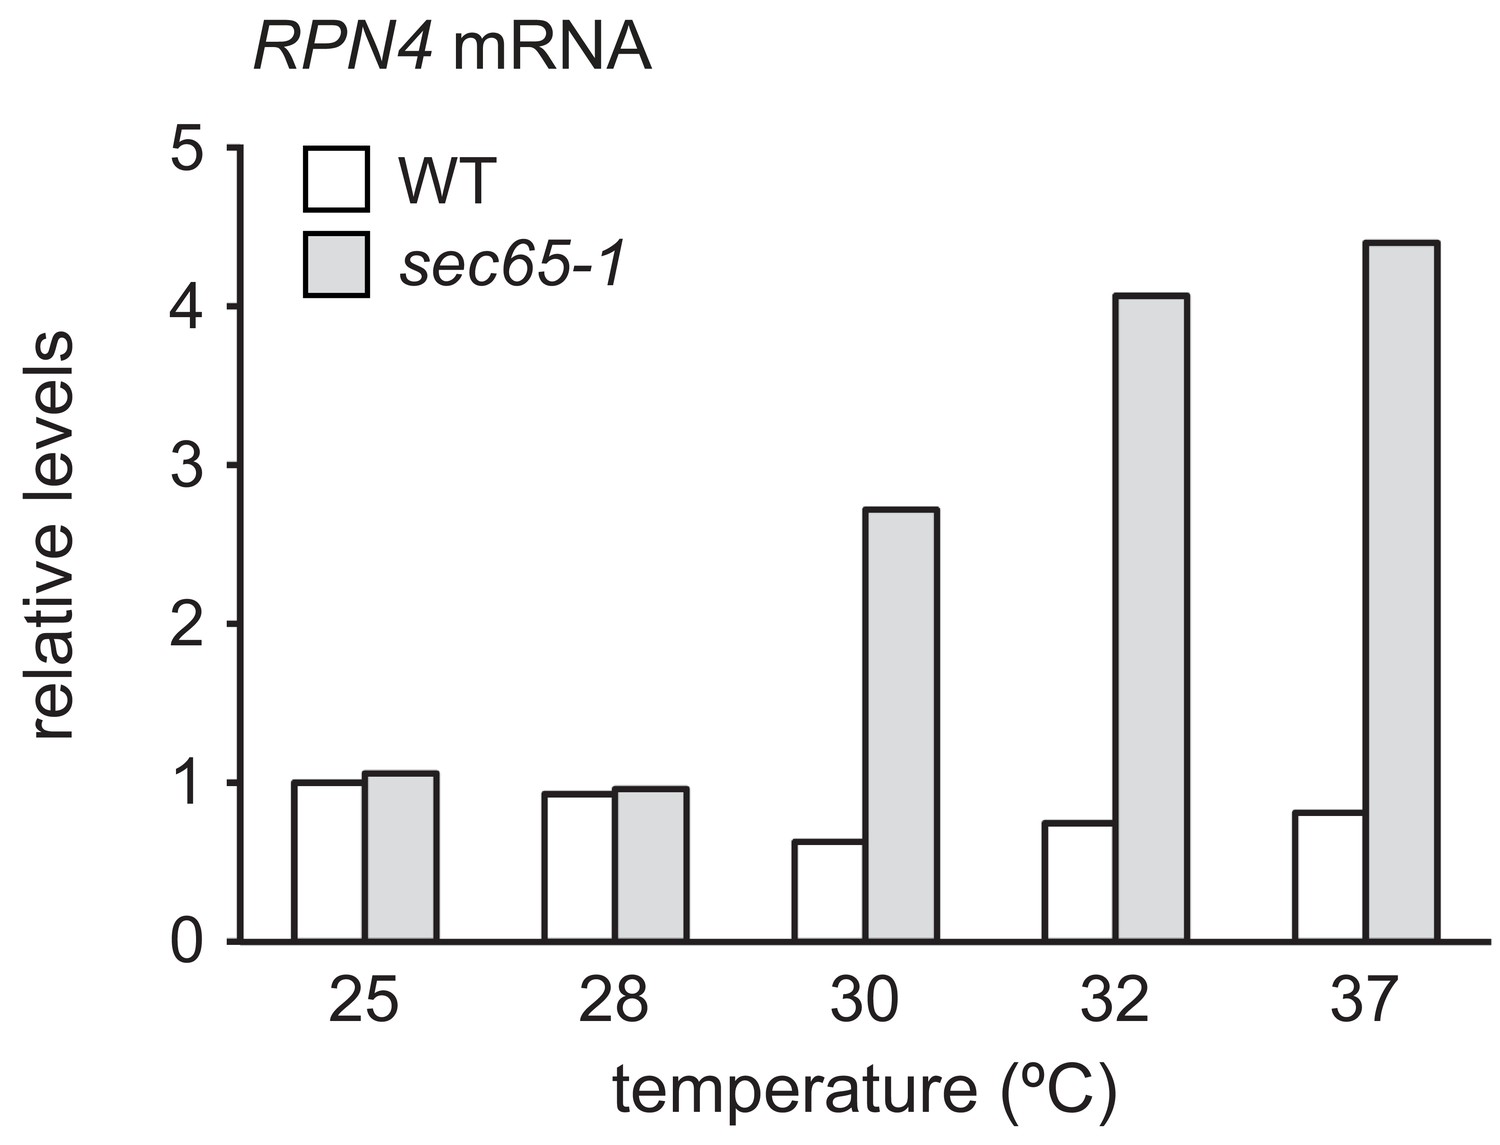
RPN4 mRNA levels in wild-type and sec65-1 cells at different temperatures.
RPN4 mRNA levels in wild-type (WT) and sec65-1 cells grown at 25°C and shifted to the indicated temperatures for 90 min. Data are normalized to WT cells at 25°C.
Figure 7
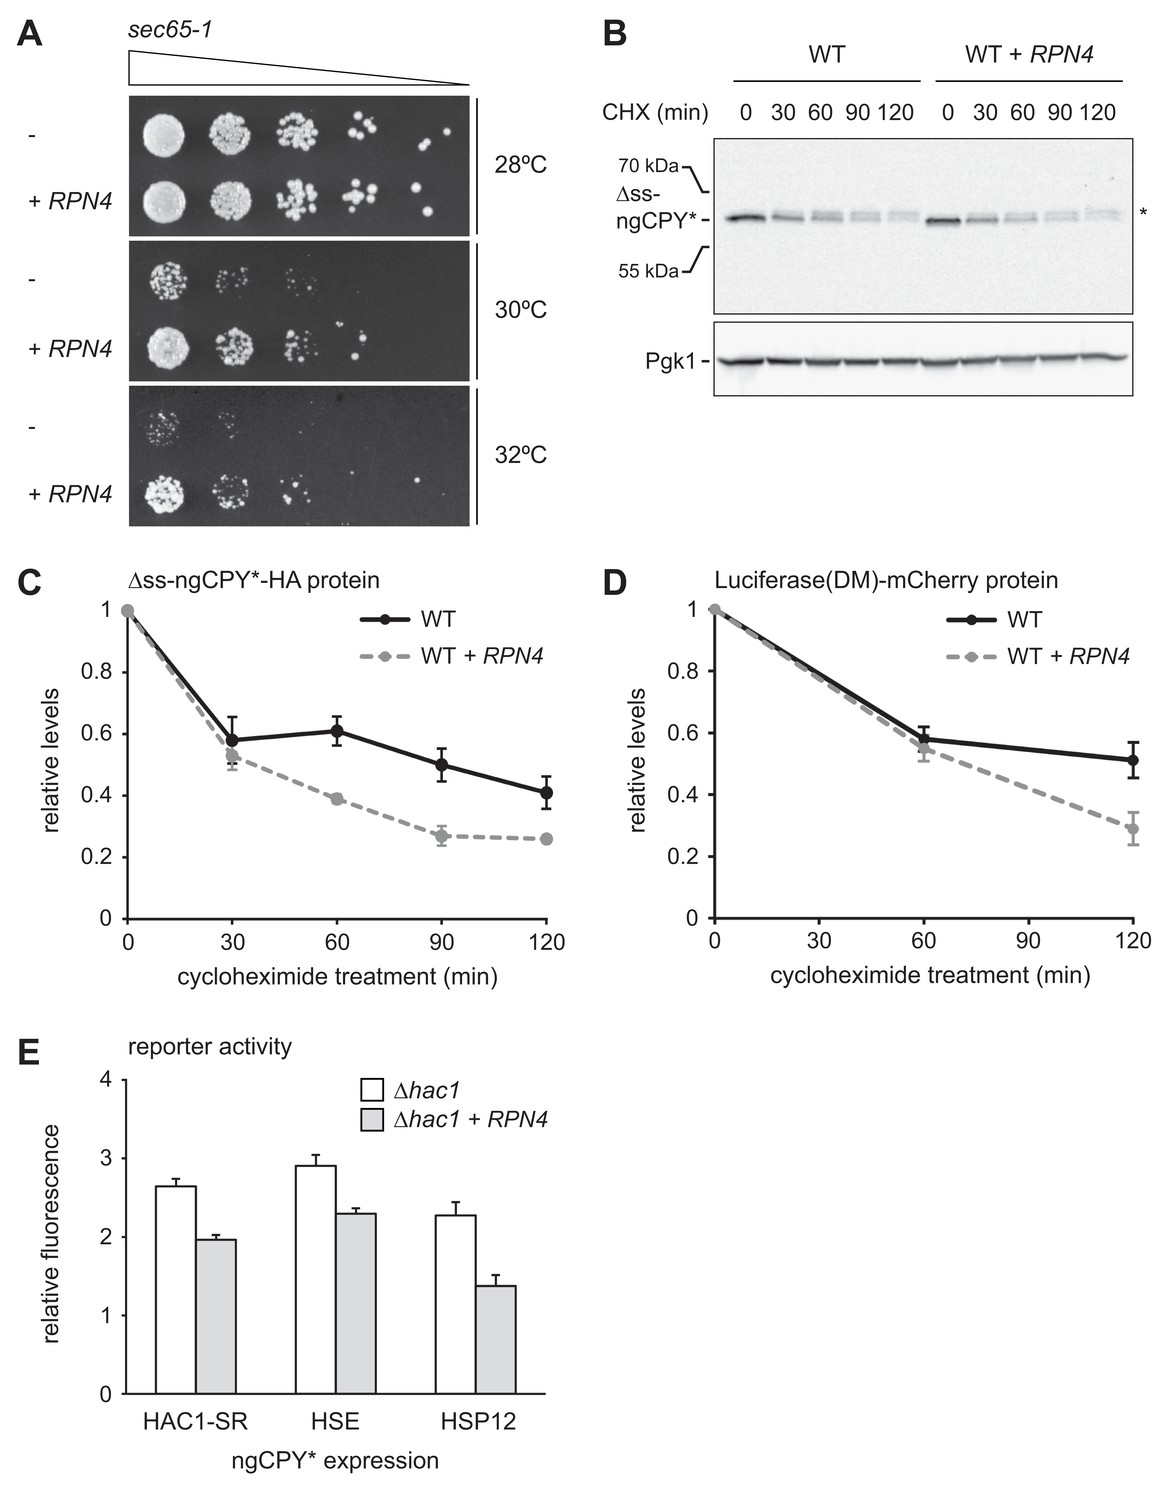
Rpn4 protects against cytosolic protein misfolding.
(A) Growth assay on solid medium of sec65-1 cells grown at different temperatures and overexpressing RPN4 where indicated. (B) Western blot of HA and Pgk1 from cycloheximide-treated wild-type (WT) cells expressing ∆ss-ngCPY*-HA and additionally overexpressing RPN4 where indicated. Expression of ∆ss-ngCPY*-HA was induced with 100 nM estradiol for 4 hr. The asterisk indicates a slower-migrating, post-translationally modified form of ∆ss-ngCPY*-HA. CHX, cycloheximide. (C) Quantification of ∆ss-ngCPY*-HA levels relative to Pgk1 from western blots as shown in panel B. For each strain, data are normalized to t = 0. Mean ±SEM, n = 3. (D) Luciferase(DM)-mCherry levels relative to Pgk1 and normalized to t = 0. Quantification is based on western blots of mCherry and Pgk1 from cycloheximide-treated cells expressing Luciferase(DM)-mCherry and additionally overexpressing RPN4 where indicated. Mean ±SEM, n = 3. (E) Flow cytometric measurement of GFP levels in ∆hac1 cells harboring the HAC1 splicing reporter (HAC1-SR), HSE reporter or HSP12 reporter, expressing ngCPY* under the control of the estradiol-inducible GAL promoter system, and overexpressing RPN4 where indicated. Expression of ngCPY* was induced with 100 nM estradiol for 5 hr. Data are normalized to cells not treated with estradiol. Mean ±SEM, n = 3.
Figure 8
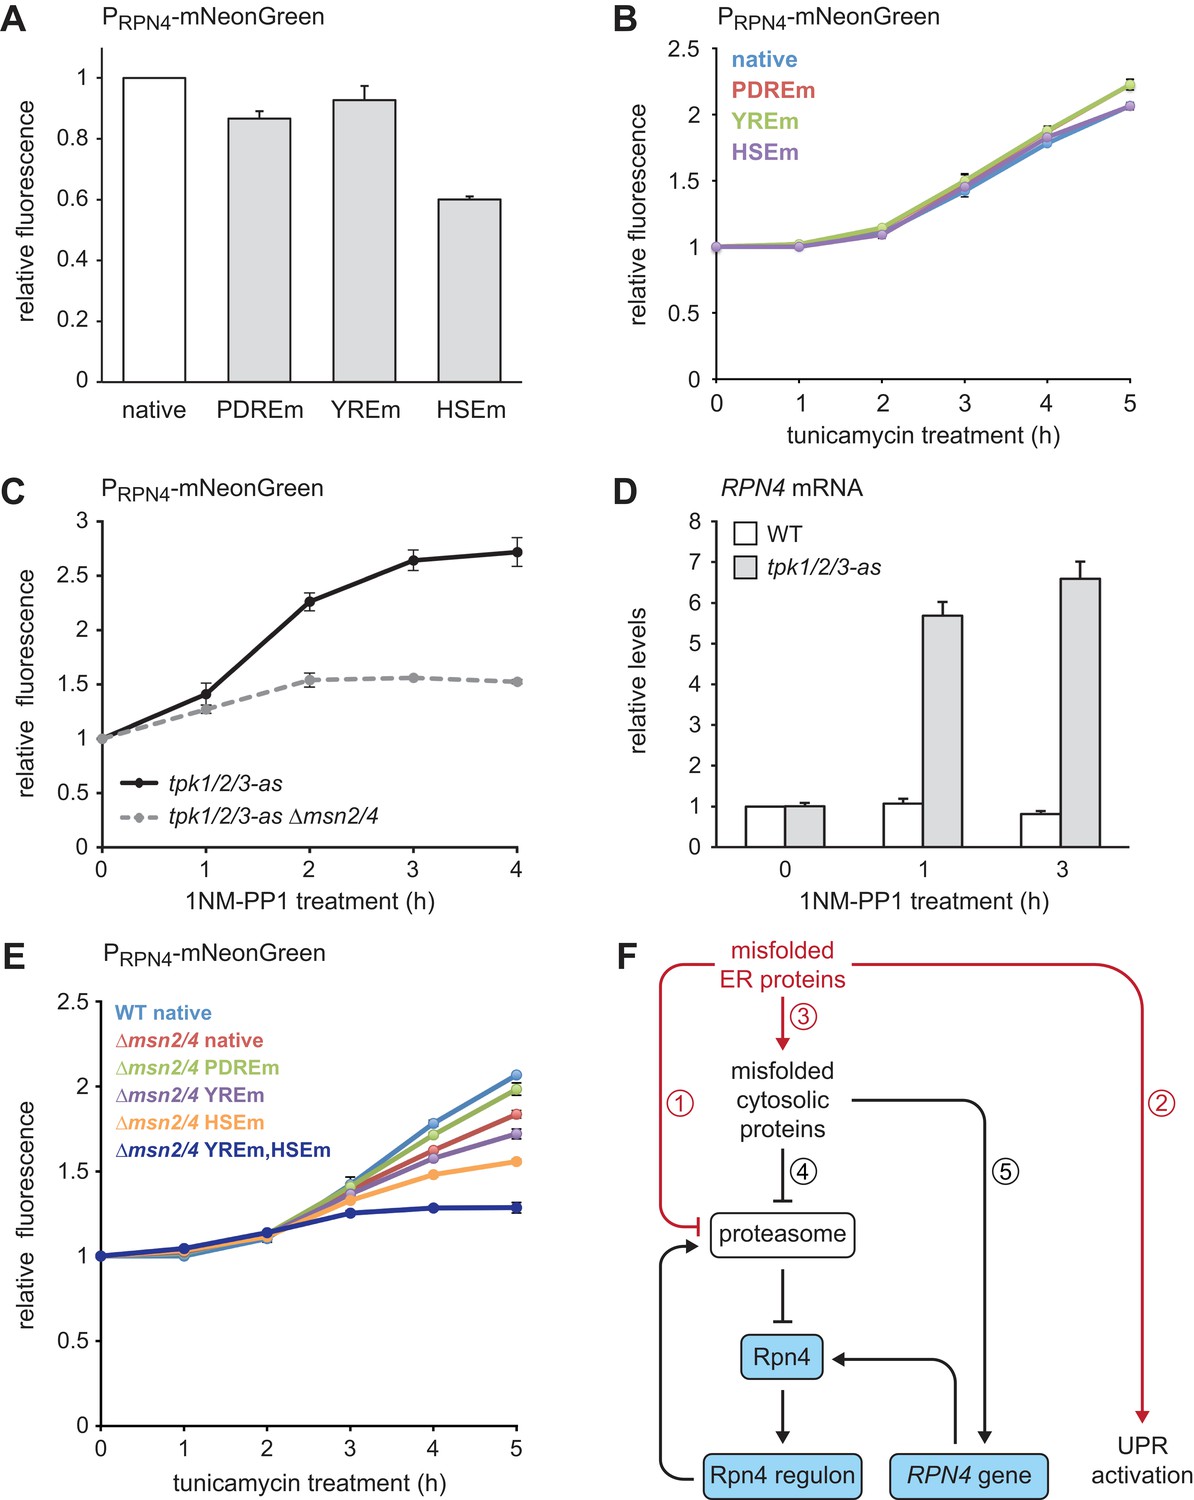
Multiple signaling pathways mediate RPN4 induction by ER stress.
(A) Flow cytometric measurement of the activity of RPN4 reporter variants in untreated cells. Data are normalized to the reporter containing the native RPN4 promoter. The other reporters contain mutations in the two Pdr1/3 response elements (PDREm), the Yap1 response element (YREm) or the heat shock element (HSEm). Mean ±SEM, n = 4. (B) As in panel A, but after treatment with 5 µg/ml tunicamycin for the times indicated. Mean ±SEM, n = 3. (C) Flow cytometric measurement of the activity of the native RPN4 reporter in tpk1/2/3-as and tpk1/2/3 ∆msn2/4 cells treated with the ATP analog 1NM-PP1 for the times indicated. The analog-sensitive tpk1/2/3-as alleles enable specific inhibition of protein kinase A with 1NM-PP1. Mean ±SEM, n = 3. (D) RPN4 mRNA levels in wild-type (WT) and tpk1/2/3-as cells treated with 1NM-PP1 for the times indicated. Data are normalized to WT cells at t = 0. Mean ±SEM, n = 3. (E) Flow cytometric measurement of the activity of RPN4 reporter variants in WT and ∆msn2/4 cells treated with 5 µg/ml tunicamycin. Data are normalized to WT cells containing the reporter with the native RPN4 promoter. Mean ±SEM, n = 3. (F) Model for the cooperation of Rpn4 and the UPR. ER protein misfolding causes increased flux through the ERAD pathway, which strains proteasome capacity and inhibits efficient protein degradation (1). In addition, the UPR is activated (2). Severe ER stress leads to translocation defects, causing mislocalization of secretory proteins to the cytosol, where they cannot fold properly (3). These cytosolic misfolded proteins further burden the proteasome (4). As a result, Rpn4 is stabilized, the Rpn4 regulon is activated and proteasome biogenesis is enhanced. If cytosolic misfolded proteins persist, the RPN4 gene is induced (5), providing a second mechanism to increase Rpn4 abundance and augment proteasome biogenesis.
Tables
Table 1
Genes identified in the screen.
https://doi.org/10.7554/eLife.43244.006| Gene | Description |
|---|---|
| HAC1 | transcription factor, regulates the unfolded protein response |
| RPN4 | transcription factor, stimulates expression of proteasome genes |
| PDR1 | transcription factor, regulates the pleiotropic drug response, induces RPN4 transcription |
| SSZ1 | Hsp70 chaperone, part of ribosome-associated complex, overexpression activates Pdr1 |
| MUM2 | protein essential for meiotic DNA replication and sporulation |
| YAP1 | transcription factor, regulates response to oxidative stress, induces RPN4 transcription |
| CAD1 | transcription factor, involved in stress responses, paralog of YAP1 |
| SAF1 | F-box protein, subunit of SCF ubiquitin ligase complexes |
| NOP56 | essential nucleolar protein |
Key resources table
| Reagent type (species) or resource | Designation | Source or reference | Identifiers | Additional information |
|---|---|---|---|---|
| Strain (S. cerevisiae) | W303 | other | see Supplementary file 3 | |
| Genetic reagent (E. coli) | S. cerevisiae genomic library in YEp13 E. coli | Nasmyth and Tatchell, 1980 | ATCC 37323 | |
| Antibody | rat monoclonal anti-HA (clone 3F10) | Roche | Cat#11867423001; RRID: AB_390918 | (1:5000) |
| Antibody | rabbit polyclonal anti-mCherry | Biovision | Cat#5993; RRID: AB_1975001 | (1:5000) |
| Antibody | rabbit polyclonal anti-Kar2 | Schuck et al., 2009 | (1:50000) | |
| Antibody | mouse monoclonal anti-Pgk1 (clone 22C5) | Abcam | Cat#Ab113687; RRID: AB_10861977 | (1:50000) |
| Antibody | goat anti-mouse HRP | Thermo Fisher Scientific Pierce | Cat#31432; RRID: AB_228302 | (1:10000) |
| Antibody | goat anti-rabbit HRP | Thermo Fisher Scientific Pierce | Cat#31462; RRID: AB_228338 | (1:10000) |
| Antibody | donkey anti-rat HRP | Jackson | Cat#712-035-153; RRID: AB_2340639 | (1:10000) |
| Recombinant DNA reagent | plasmids | other | doi:10.5061/dryad.n20d476 | see Supplementary file 1 |
| Commercial assay or kit | NEBuilder HiFi DNA assembly master mix | New England Biolabs | Cat#E2611L | |
| Commercial assay or kit | BCA assay kit | Thermo Fisher Scientific Pierce | Cat#23225 | |
| Commercial assay or kit | ProtoScript II cDNA Synthesis kit | New England Biolabs | Cat#E6560L | |
| Commercial assay or kit | SensiFAST SYBR No-ROX kit | Bioline | Cat#BIO-98050 | |
| Chemical compound, drug | ß-estradiol | Sigma-Aldrich | Cat#E8875; CAS: 50-28-2 | |
| Chemical compound, drug | 1NM-PP1 | Merck | Cat#529581–1 MG; CAS: 221244-14-0 | |
| Chemical compound, drug | tunicamycin | Merck | Cat#654380–50 MG; CAS: 11089-65-9 | |
| Chemical compound, drug | cycloheximide | Sigma-Aldrich | Cat#C7698; CAS: 66-81-9 | |
| Chemical compound, drug | complete protease inhibitor | Roche | Cat#04693116001 | |
| Software, algorithm | Growthcurver | Sprouffske and Wagner, 2016 | ||
| Software, algorithm | MaxQuant | Cox et al., 2014 | ||
| Software, algorithm | Perseus | Tyanova et al., 2016 | ||
| Other | CMAC stain | Thermo Fisher Scientific | Cat#C2110 | |
| Other | mass spectrometry proteomics data | this study | PRIDE database, PXD012867 |
Additional files
-
Supplementary file 1
Plasmids used in this study.
- https://doi.org/10.7554/eLife.43244.016
-
Supplementary file 2
Oligonucleotides used in this study.
- https://doi.org/10.7554/eLife.43244.017
-
Supplementary file 3
Yeast strains used in this study.
- https://doi.org/10.7554/eLife.43244.018
-
Supplementary file 4
Proteasome subunits.
- https://doi.org/10.7554/eLife.43244.019
-
Supplementary file 5
Core UPR target genes.
- https://doi.org/10.7554/eLife.43244.020
-
Transparent reporting form
- https://doi.org/10.7554/eLife.43244.021
Download links
A two-part list of links to download the article, or parts of the article, in various formats.
Downloads (link to download the article as PDF)
Open citations (links to open the citations from this article in various online reference manager services)
Cite this article (links to download the citations from this article in formats compatible with various reference manager tools)
The proteasome biogenesis regulator Rpn4 cooperates with the unfolded protein response to promote ER stress resistance
eLife 8:e43244.
https://doi.org/10.7554/eLife.43244


