Endocytosis at the Drosophila blood–brain barrier as a function for sleep
- Perelman School of Medicine, University of Pennsylvania, United States
- UMR8251, Université Paris Diderot, France
Figures
Figure 1 with 1 supplement
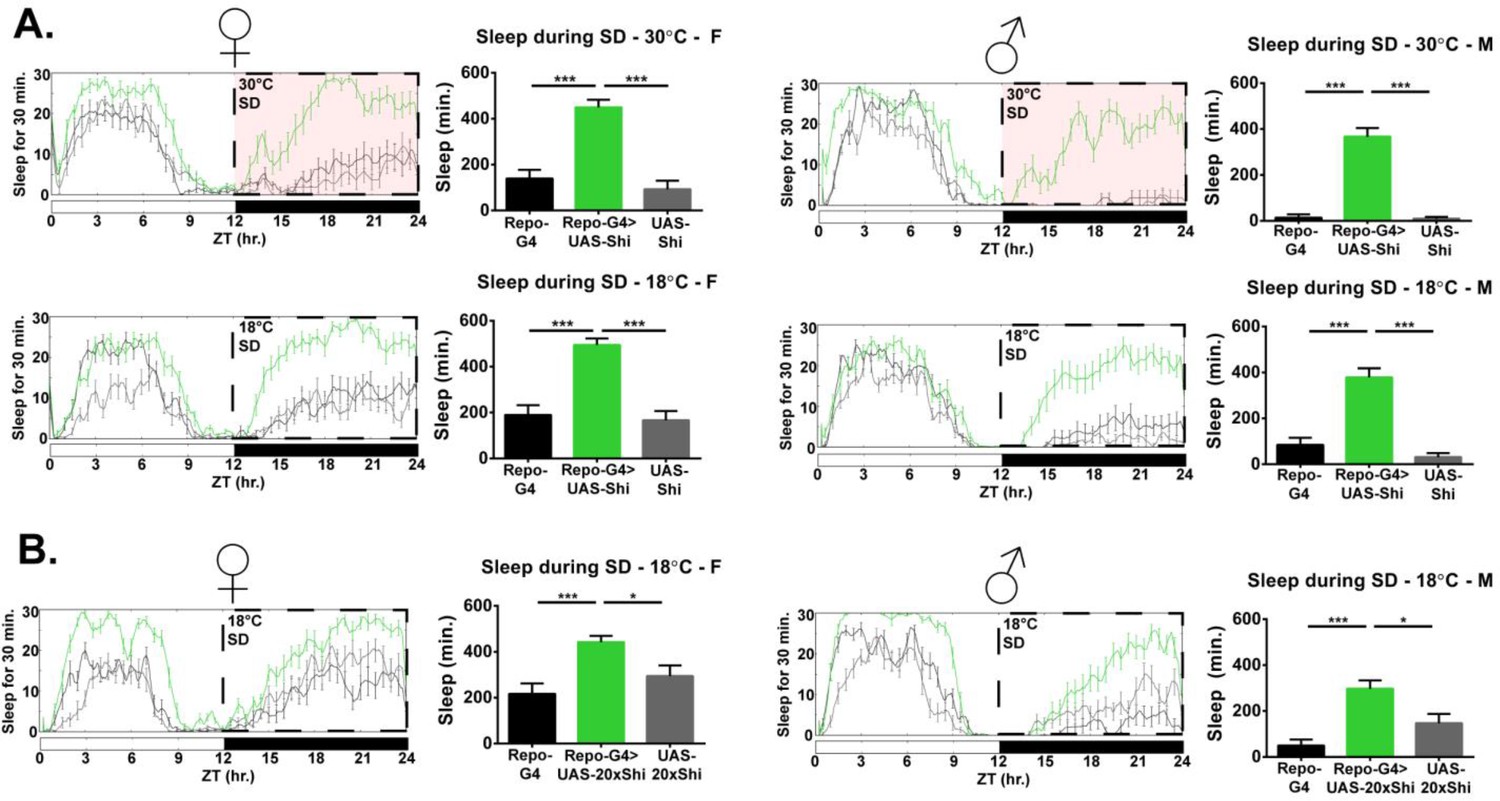
Inhibition of endocytosis in glia produces resistance to mechanical sleep deprivation.
(A) Resistance to mechanical sleep deprivation, manifest as elevated sleep during stimulation, for Repo-GAL4 > UAS Shi.ts1;UAS-Shi.ts1 female flies (n = 14–16, per genotype) and male (n = 16, per genotype) at both 30°C and 18°C. Dashed box indicates the period of mechanical deprivation, ZT12-24. Red shading indicates 30°C, otherwise the temperature is 18°C. (B) Sleep during deprivation at permissive temperature (18°C) was also present using an additional Shi1 line, in Repo-GAL4 > UAS-20xShi.ts1 females (n = 16, per genotype) and males (n = 16, per genotype). One-way ANOVA with Holm-Sidak post-hoc test, *p<0.05, **p<0.01, ***p<0.001. Error bars represent standard error of the mean (SEM).
Figure 1—figure supplement 1
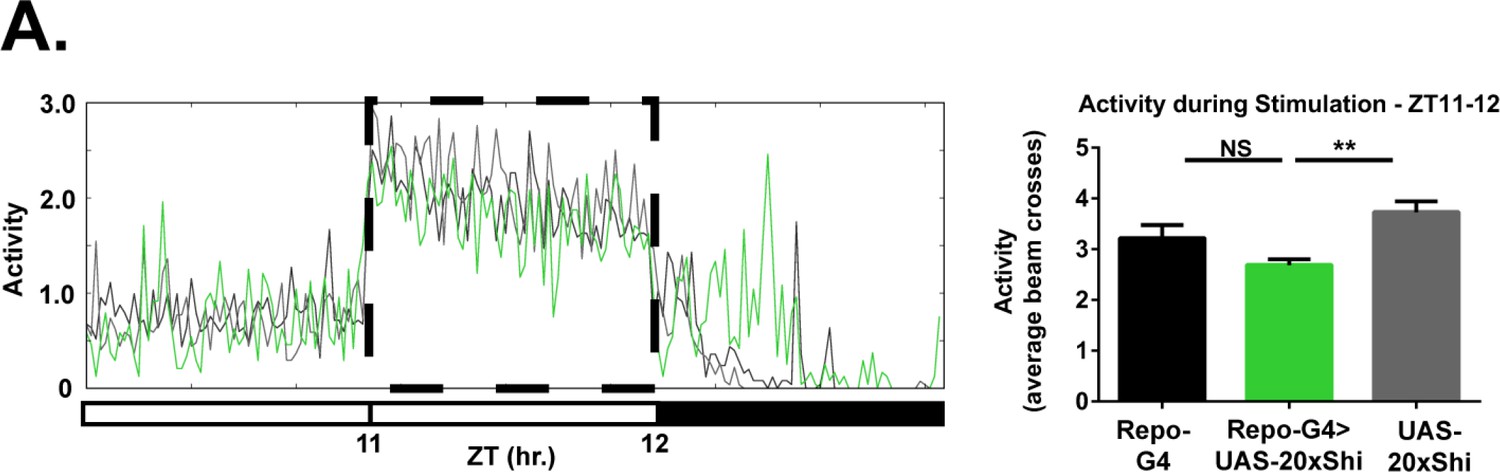
Glial Shi1 expression does not affect responsiveness to mechanical stimulus during wake.
(A) Mean activity (beam breaks) of Repo-GAL4 > UAS-20xShi.ts1 and control female flies at 18°C between ZT11 and 12, during mechanical stimulation (dashed box) as used for sleep deprivation (n = 16, each genotype). One-way ANOVA with Holm-Sidak post-hoc test, *p<0.05, **p<0.01, ***p<0.001. Error bars represent standard error of the mean (SEM).
Figure 2 with 3 supplements
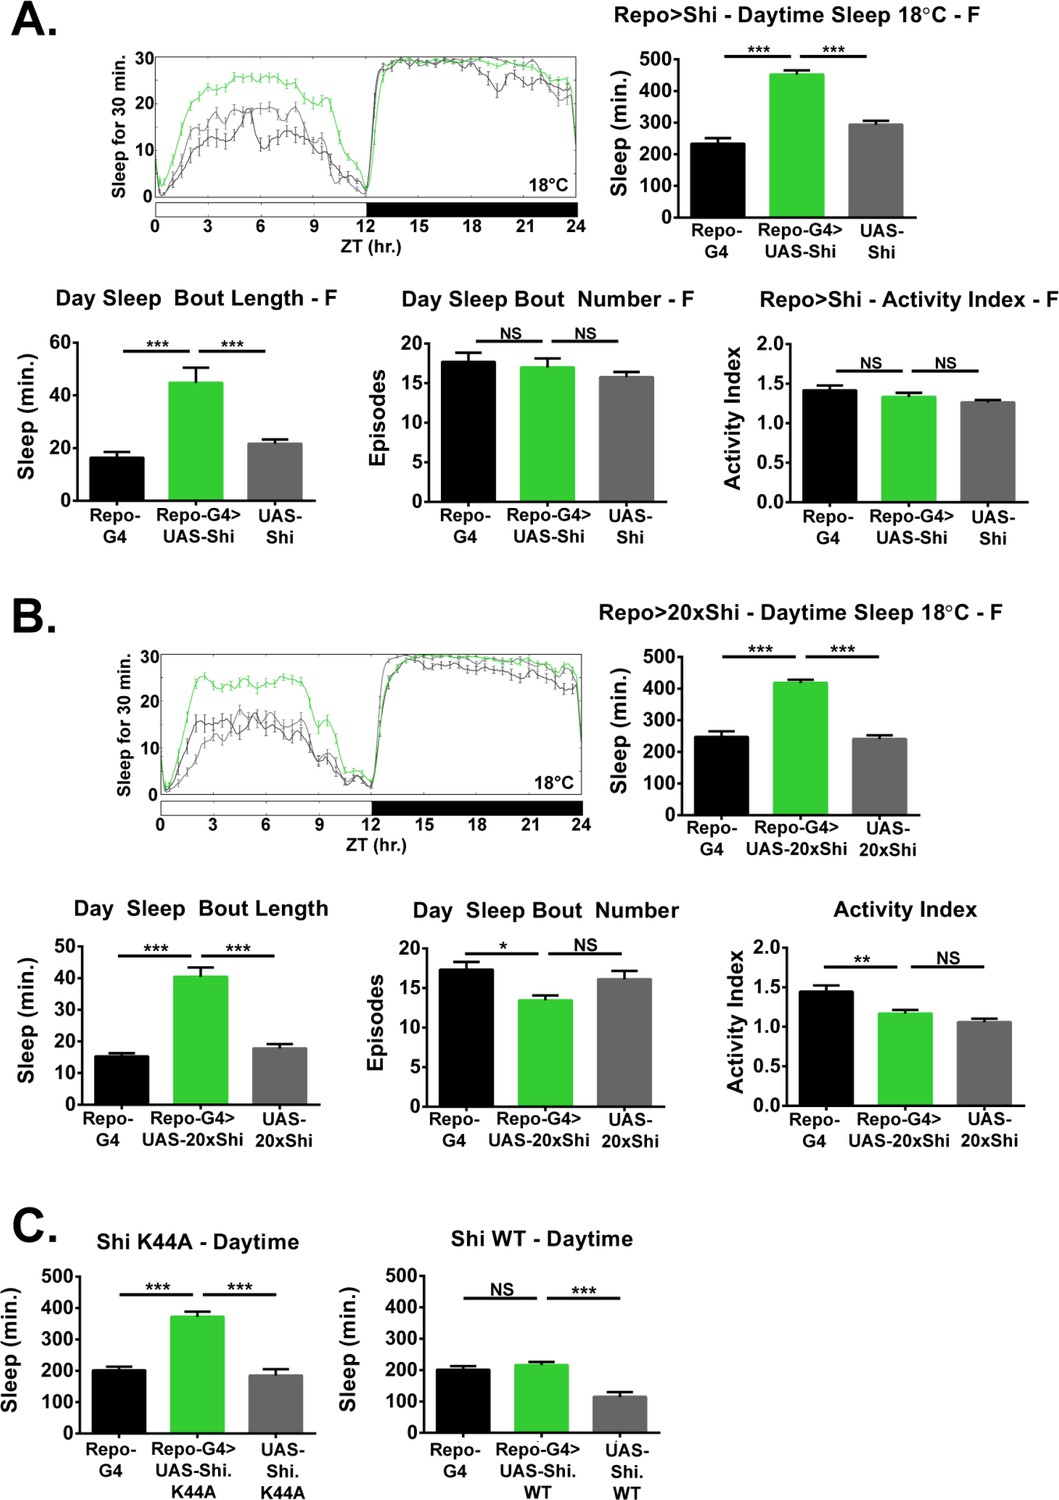
Inhibition of endocytosis in glia increases baseline sleep.
(A) Daily baseline sleep amount (3 day mean) and sleep/activity characteristics including mean daytime sleep bout number, bout length, and activity index for Repo-GAL4 > UAS Shi.ts1;UAS-Shi.ts1 female flies at 18°C (n = 19–26), and (B) Repo-GAL4 > UAS-20xShi.ts1 females (n = 23–31). (C) Daytime sleep for female flies at 18°C expressing either a constitutively dominant negative Shi (UAS-Shi.K44A) (n = 15–16) or a wild-type Shi (UAS-Shi.WT) (n = 15–32) by Repo-GAL4. One-way ANOVA with Holm-Sidak post-hoc test, *p<0.05, **p<0.01, ***p<0.001. Error bars represent standard error of the mean (SEM).
Figure 2—figure supplement 1
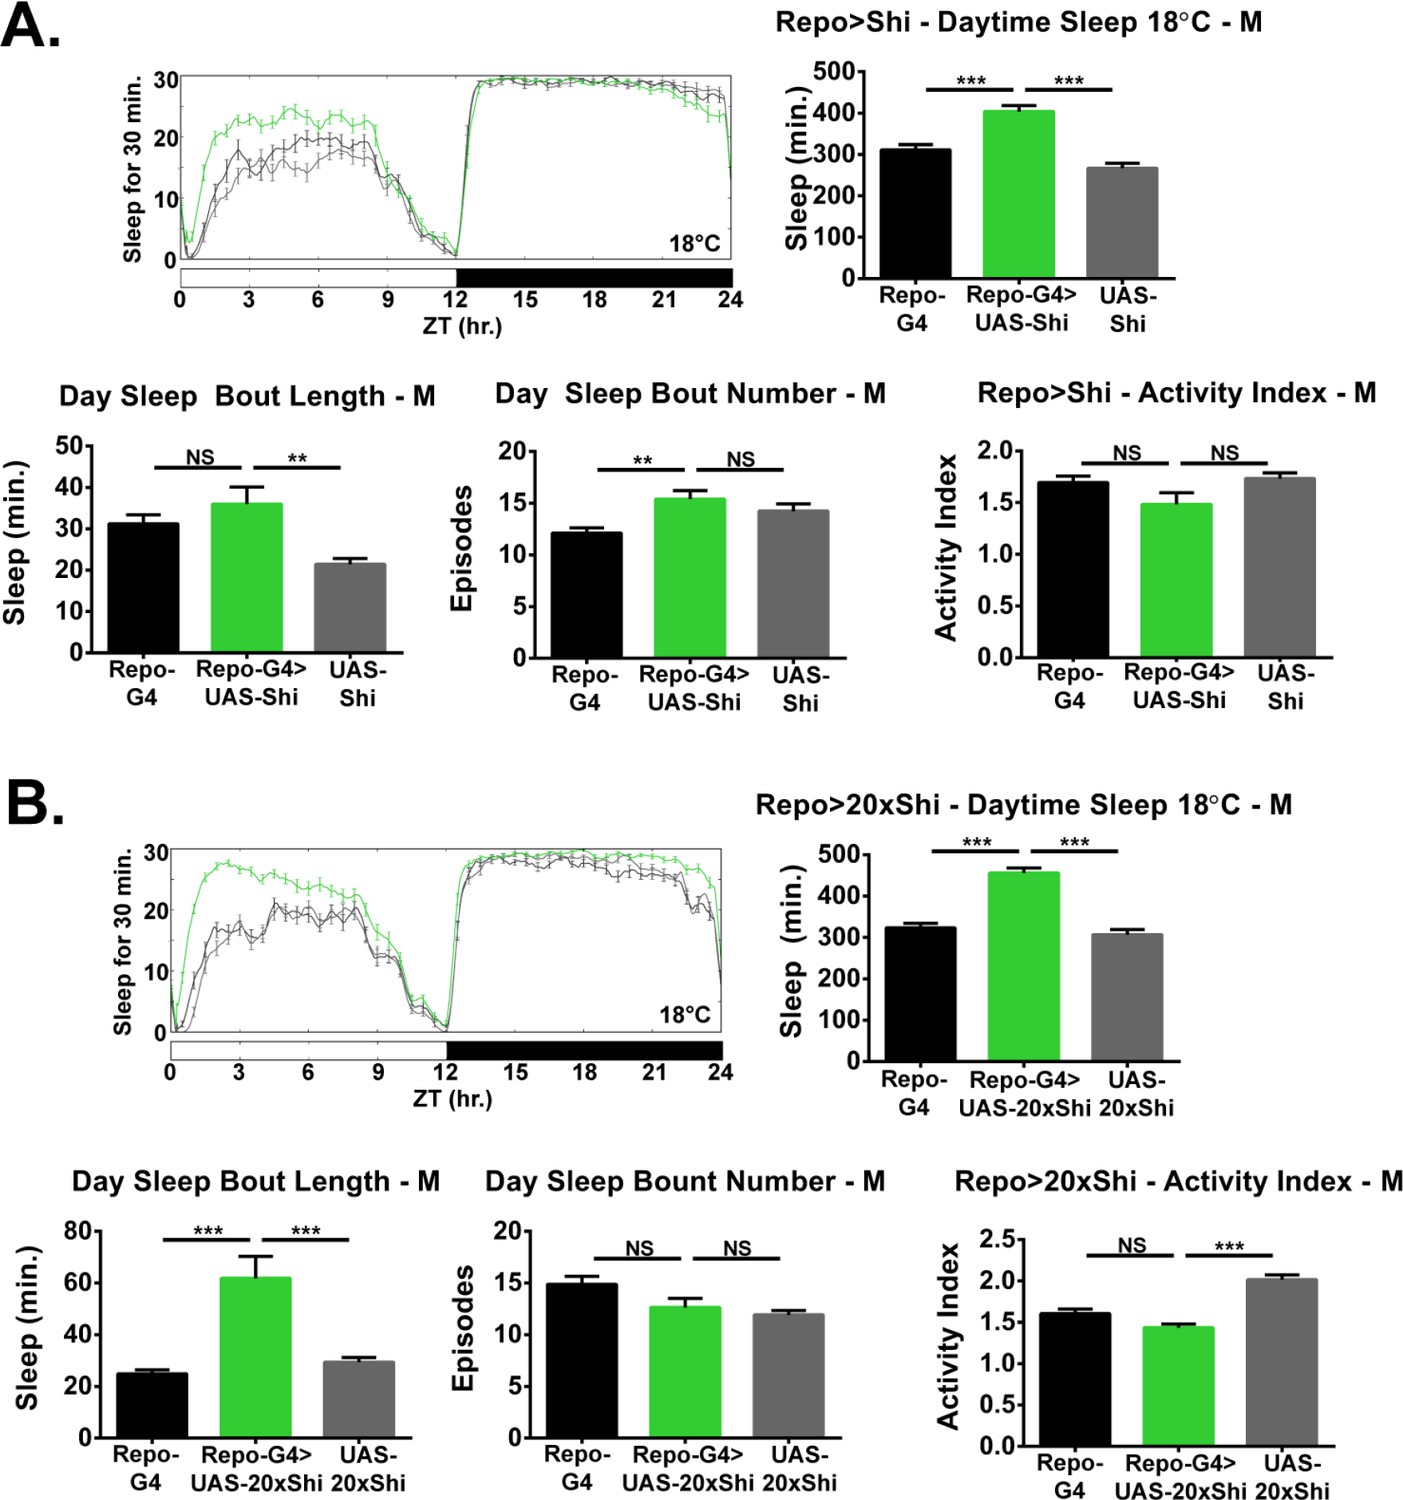
Inhibition of endocytosis in glia increases baseline sleep in males.
(A) Daily baseline sleep amount (3 day mean) and sleep/activity characteristics including mean daytime sleep bout number, bout length, and activity index for Repo-GAL4 > UAS Shi.ts1;UAS-Shi.ts1 male flies at 18°C (n = 24–26), and (B) Repo-GAL4 > UAS-20xShi.ts1 males (n = 28–31).
Figure 2—figure supplement 2
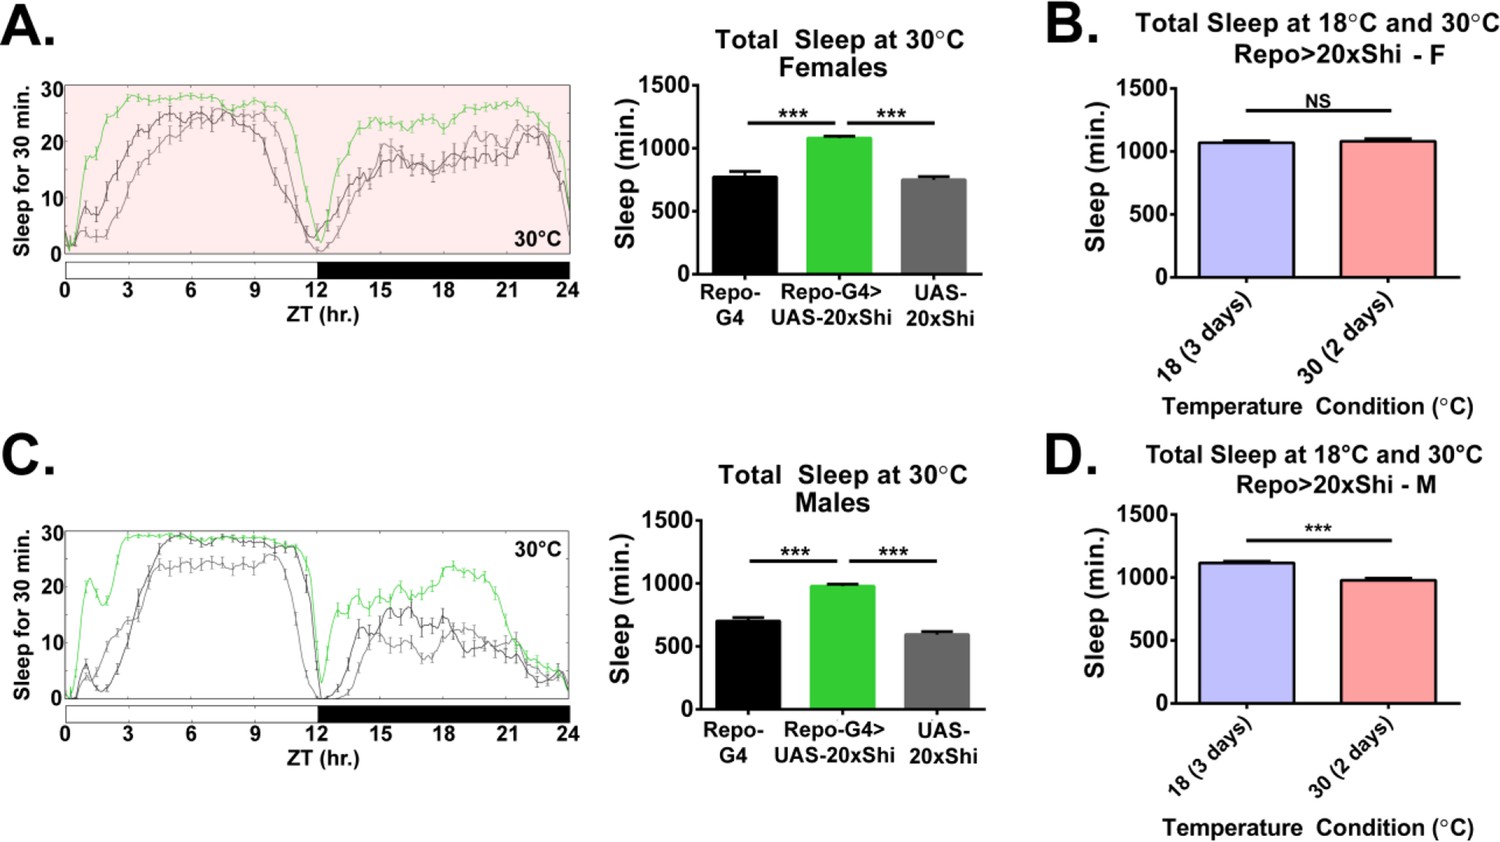
Shi1 expression at 30°C in glia increases baseline sleep similar to expression at 18°C.
(A) Daily baseline sleep amount for Repo-GAL4 > UAS-20xShi.ts1 female flies at 30°C (2 day mean), n = 23–31. One-way ANOVA with Holm-Sidak post-hoc test, *p<0.05, **p<0.01, ***p<0.001. Error bars represent standard error of the mean (SEM). (B) Total sleep of Repo-GAL4 > UAS-20xShi.ts1 females flies at 18°C (mean of 3 days) and 30°C (mean of 2 days) (n = 30). Unpaired t-test. (C) Daily baseline sleep amount for Repo-GAL4 > UAS-20xShi.ts1 male flies at 30°C (2 day mean), n = 28–31. One-way ANOVA with Holm-Sidak post-hoc test, *p<0.05, **p<0.01, ***p<0.001. Error bars represent standard error of the mean (SEM). (D) Total sleep of Repo-GAL4 > UAS-20xShi.ts1 males flies at 18°C (mean of 3 days) and 30°C (mean of 2 days) (n = 30). Unpaired t-test.
Figure 2—figure supplement 3
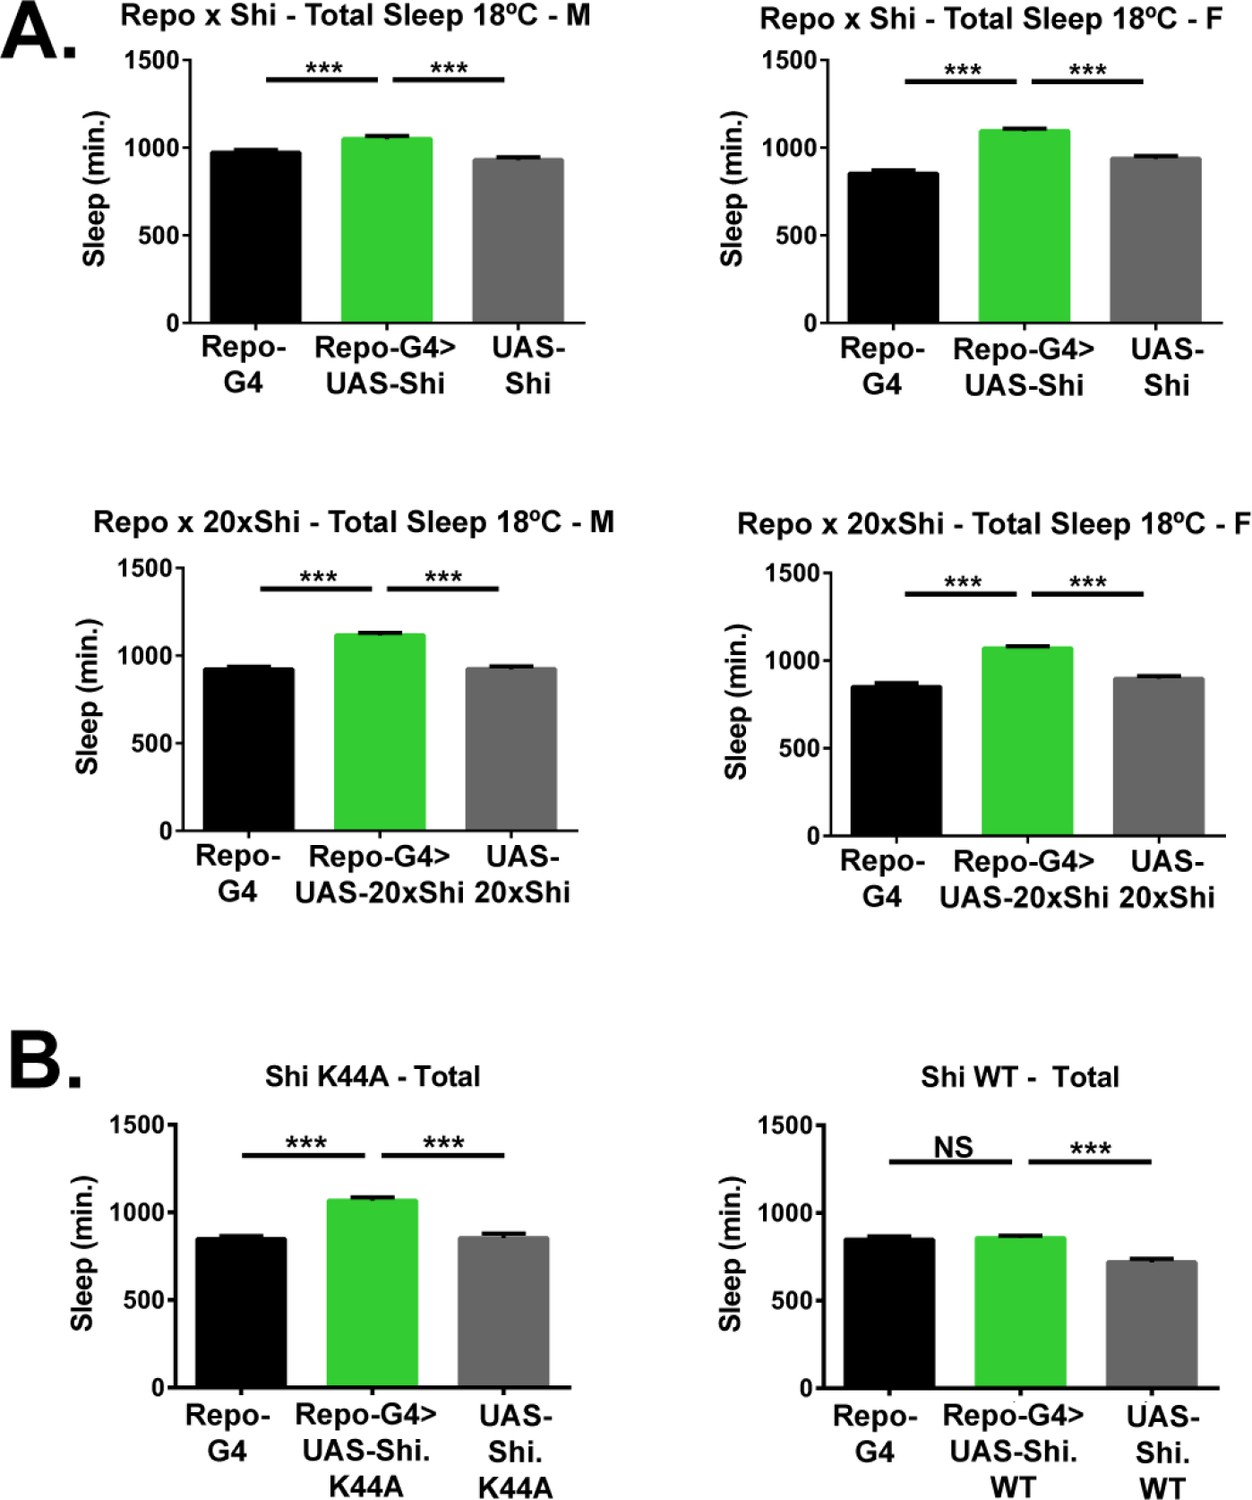
Inhibition of endocytosis in glia increases total baseline sleep.
(A) Total baseline sleep amount (3-day mean) for Repo-GAL4 > UAS Shi.ts1;UAS-Shi.ts1 female flies at 18°C (n = 19–26), Repo-GAL4 > UAS-20xShi.ts1 females (n = 23–31), Repo-GAL4 > UAS Shi.ts1;UAS-Shi.ts1 male flies at 18°C (n = 24–26), and Repo-GAL4 > UAS-20xShi.ts1 males at 18°C (n = 28–31). (B) Total sleep time for female flies at 18°C expressing either a constitutively dominant negative Shi (UAS-Shi.K44A) (n = 15–16) or a wild-type Shi (UAS-Shi.WT)(n = 15–32) by Repo-GAL4. One-way ANOVA with Holm-Sidak post-hoc test, *p<0.05, **p<0.01, ***p<0.001. Error bars represent standard error of the mean (SEM).
Figure 3 with 3 supplements
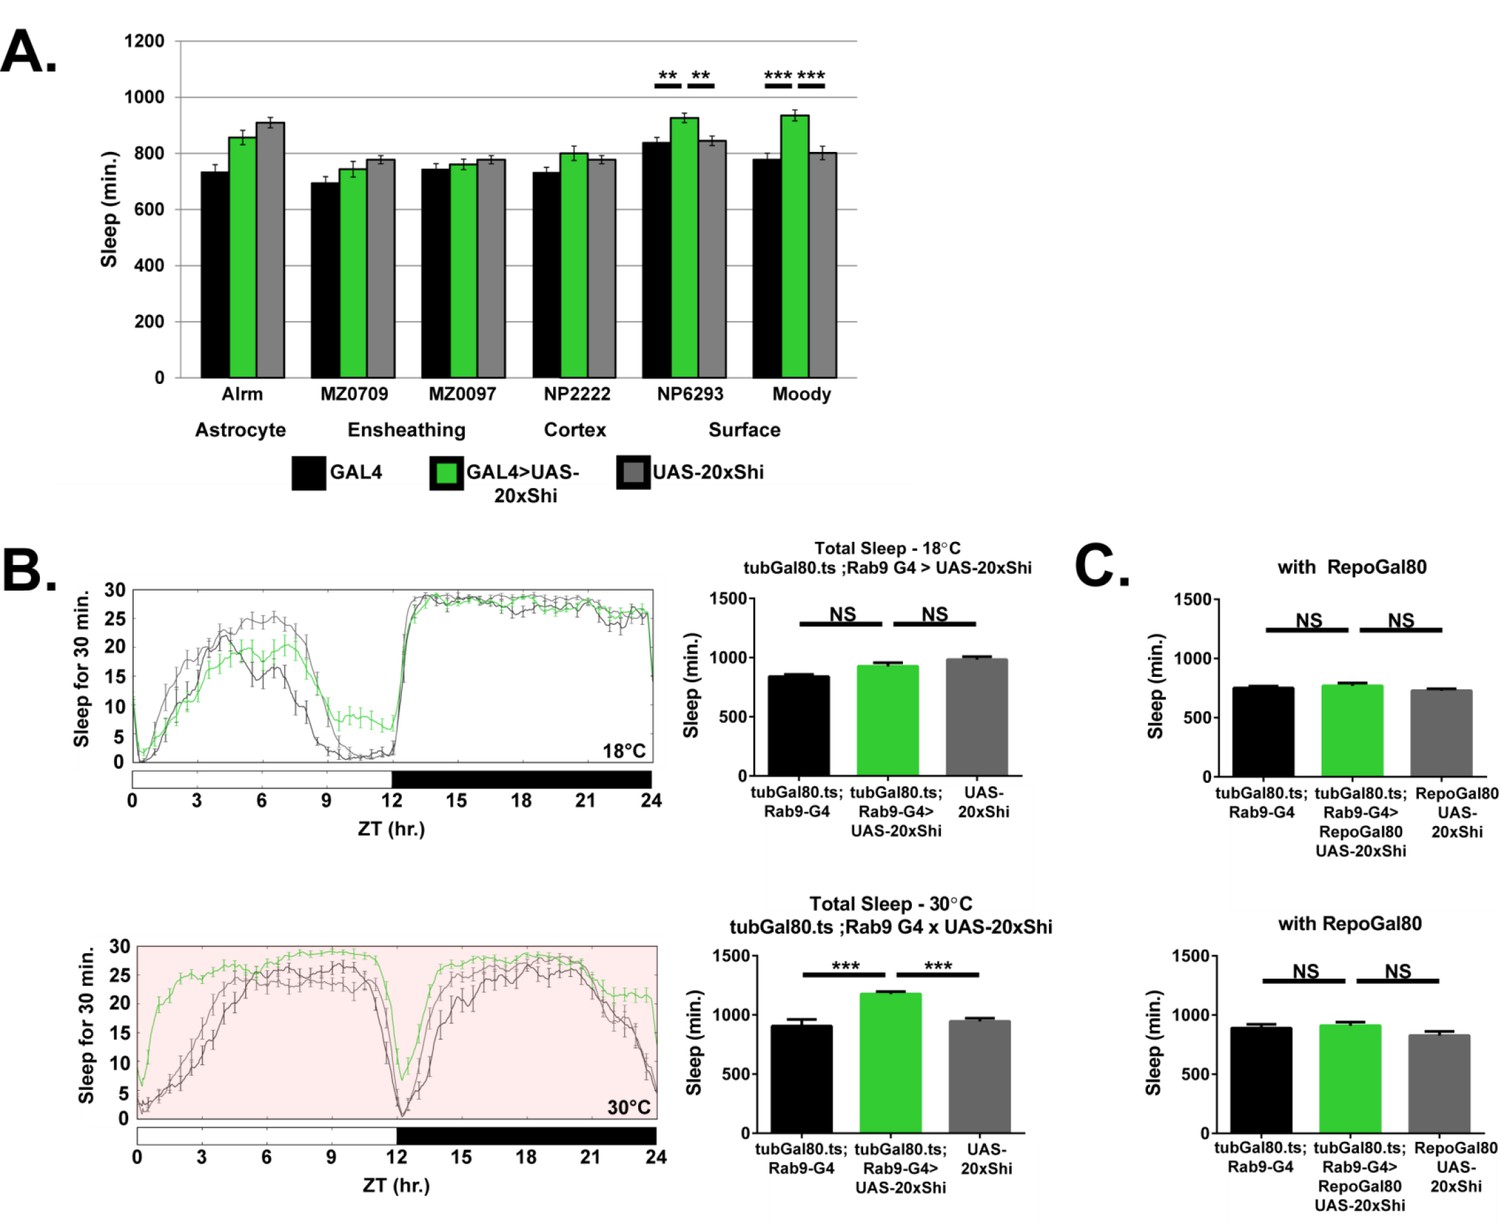
Inhibition of endocytosis in surface glia is sufficient to increase sleep.
(A) Total sleep at 18°C for female flies expressing Shibire (UAS-20xShi.ts1) by, from left to right, Alrm-GAL4 (n = 16, each genotype), MZ0709-GAL4 (n = 16–32), MZ0097-GAL4 (n = 16–32), NP2222-GAL4 (n = 16–32), NP6293-GAL4 (n = 29–32), moody-GAL4 (n = 16). MZ0709, MZ0097, and NP2222 experiments were loaded simultaneously and therefore share the same UAS-Control, graphed repeatedly for each to aid comparison. Significance markings shown for GAL4s in which the experimental group differed significantly from both controls. (B) Conditional expression of UAS-20xShi.ts1 using tubGal80.ts;Rab9-GAL4 at permissive (18°C) and restrictive temperature (30°C, red shading) (n = 9–19 females, mean of 4 days). (C) Exclusion of glial expression by Repo-Gal80 from the conditional expression of UAS-20xShi.ts1 by tubGal80.ts;Rab9-GAL4 at restrictive (18°C) and permissive temperature (30°C) (n = 15–16, mean of 4 days). One-way ANOVA with Holm-Sidak post-hoc test, *p<0.05, **p<0.01, *** is p<0.001. Error bars represent standard error of the mean (SEM).
Figure 3—figure supplement 1
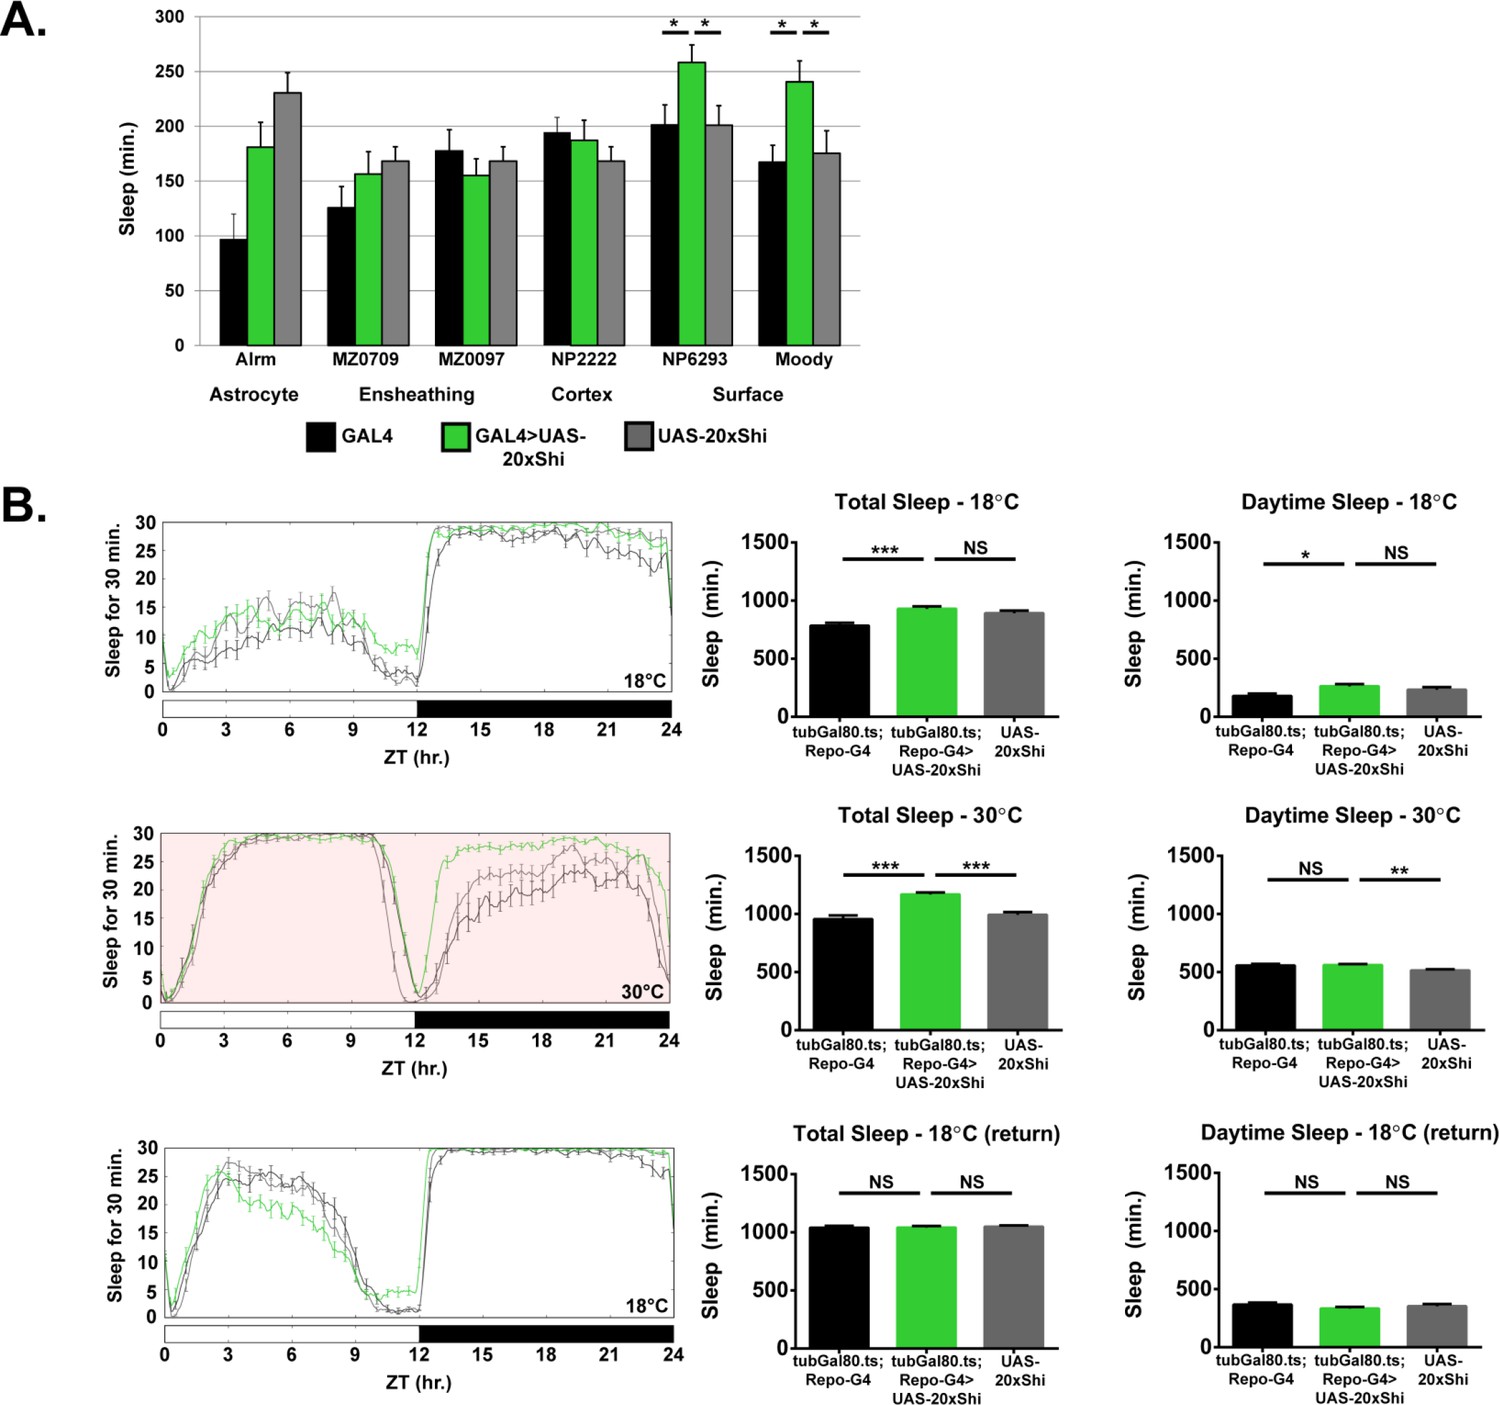
Glial adult-specific Shibire induction increases sleep and is reversible.
(A) Day sleep at 18°C for female flies expressing Shibire (UAS-20xShi.ts1) by, from left to right, Alrm-GAL4 (n = 16, each genotype), MZ0709-GAL4 (n = 16–32), MZ0097-GAL4 (n = 16–32), NP2222-GAL4 (n = 16–32), NP6293-GAL4 (n = 29–32), moody-GAL4 (n = 16). MZ0709, MZ0097, and NP2222 experiments were loaded simultaneously and therefore share the same UAS-Control, graphed repeatedly for each to aid comparison. Significance markings shown for GAL4s in which the experimental group differed significantly from both controls. (B) Conditional expression of UAS-20xShi.ts1 using UAS-tubGal80.ts;Repo-GAL4 at restrictive (18°C), then permissive temperature (30°C, red shading), and back to restrictive (n = 14–16 females, mean of 3–4 days). One-way ANOVA with Holm-Sidak post-hoc test, *p<0.05, **p<0.01, *** is p<0.001. Error bars represent standard error of the mean (SEM).
Figure 3—figure supplement 2
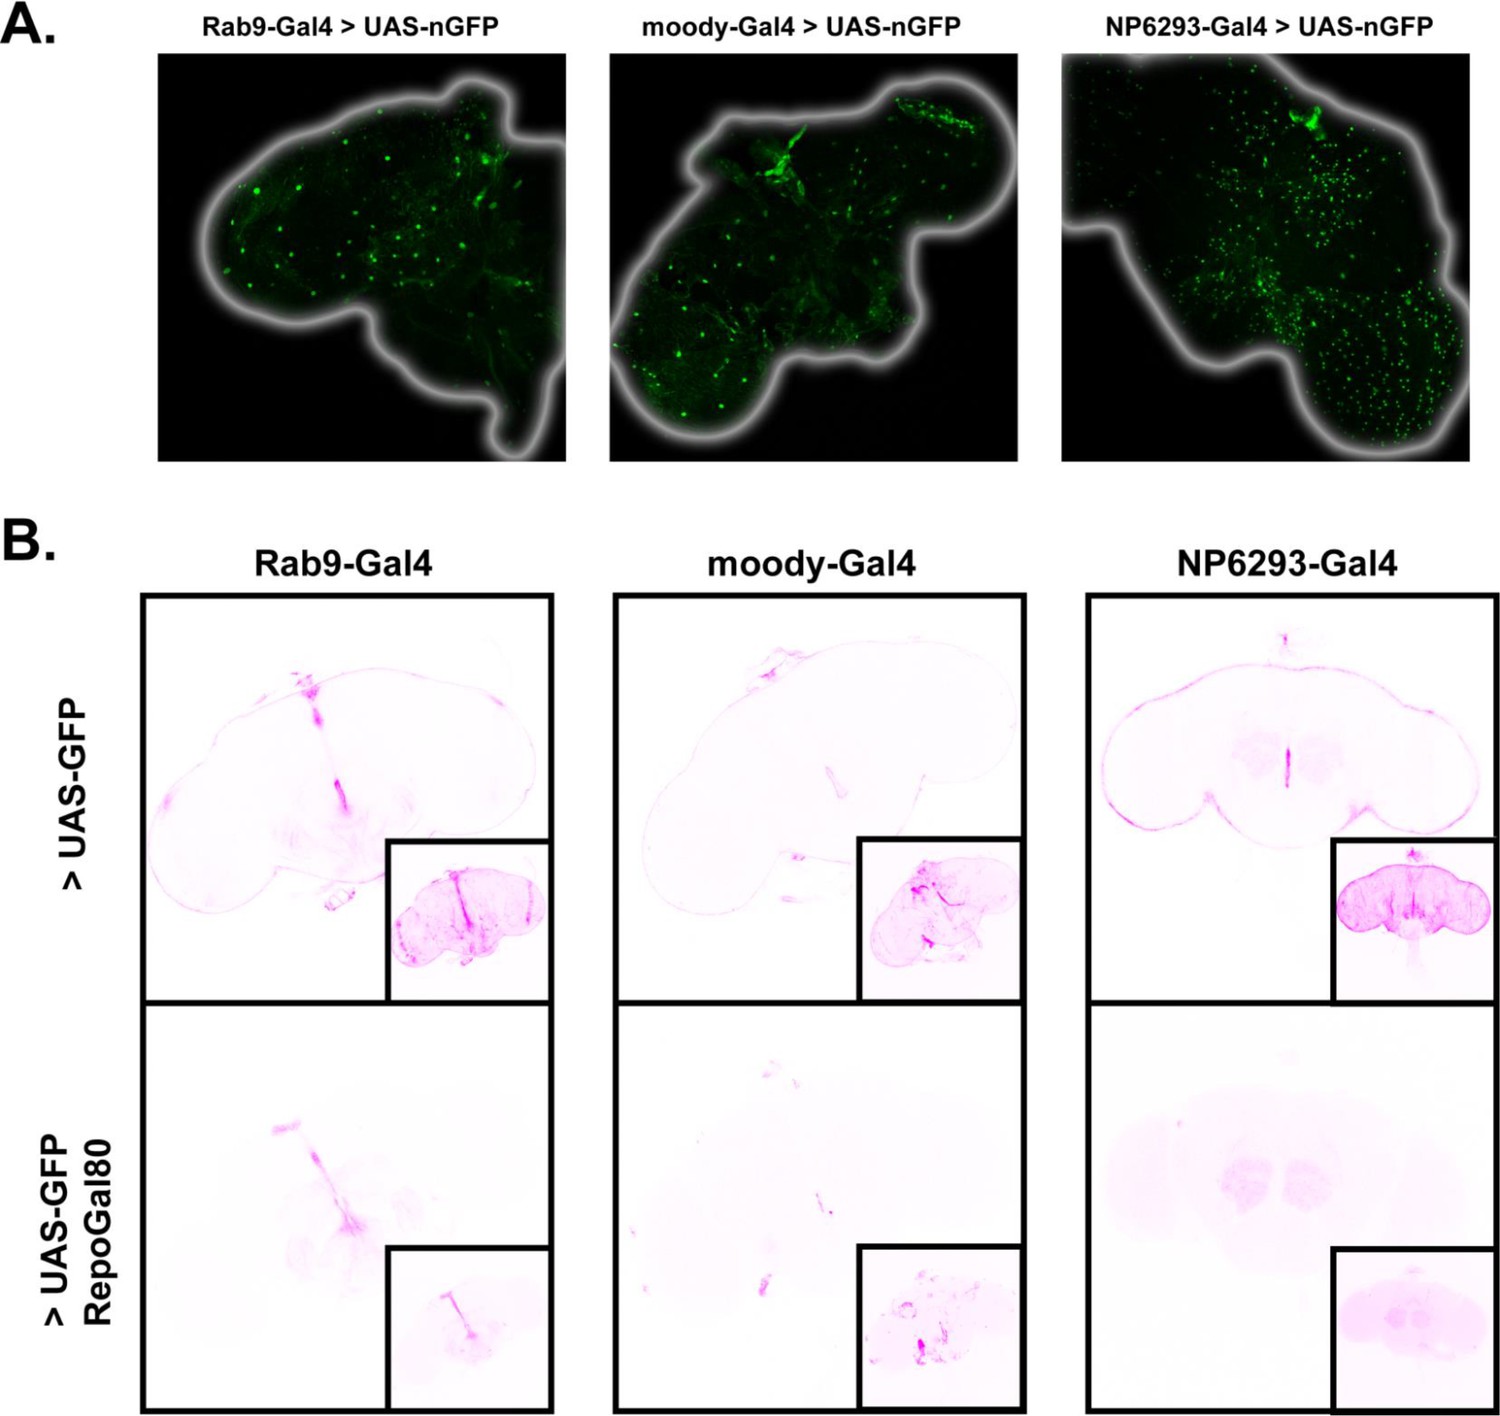
Expression patterns of Rab9-G4 and the BBB drivers.
(A) Superficial z-slices from confocal images of brains expressing UAS-nGFP driven by Rab9-GAL4, moody-GAL4 (subperineurial glia), and NP6293-GAL4 (perineurial glia) reveals the characteristically large and sparse nuclei of subperineurial glia. (B) BBB driver expression of UAS-CD8::GFP without and with Repo-Gal80 (revealing neuronal expression). Large images are single slices from the middle of the brain, insets are max projections of the entire brain. Laser power settings were maintained for comparison except in NP6293-GAL4 > UAS GFP+Repo-Gal80 images where they are higher to reveal weak expression which is otherwise not visible at all.
Figure 3—figure supplement 3
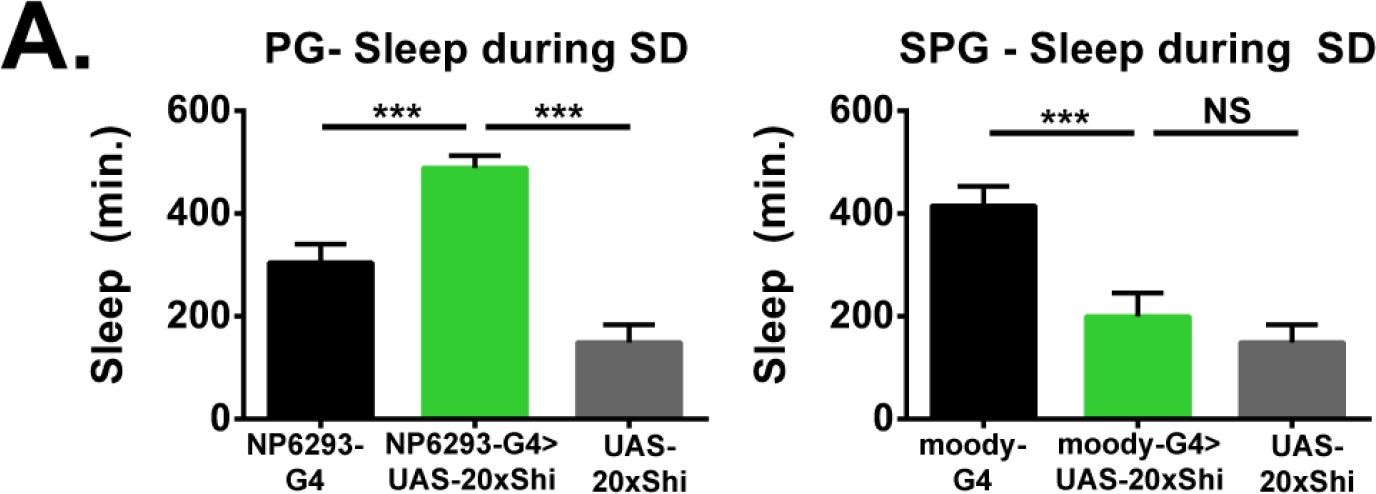
Perineurial glia are sufficient for Shibire rebound phenotype.
Sleep during deprivation for NP6293-GAL4 and moody-GAL4 driving UAS-20xShi.ts1 at 18°C for female flies (n = 16–30). One-way ANOVA with Holm-Sidak post-hoc test, *p<0.05, **p<0.01, *** is p<0.001. Error bars represent standard error of the mean (SEM).
Figure 4 with 2 supplements
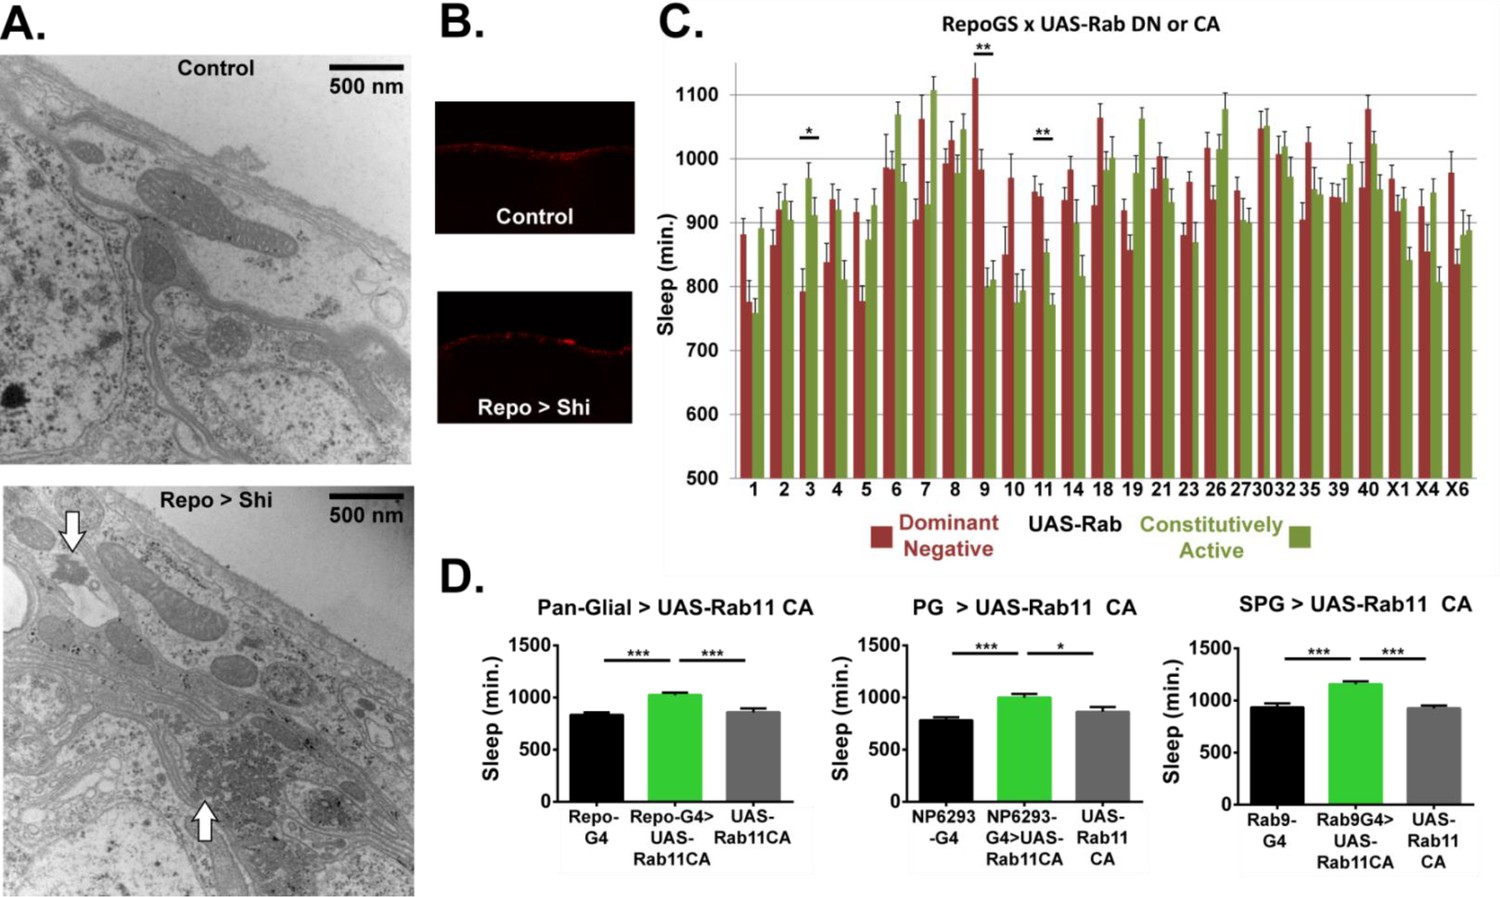
Ultrastructural morphology and genetic analysis of Rab proteins support a sleeprelevant function of vesicle trafficking in surface glia.
(A) Transmission electron micrographs of surface glia of individual Repo-GAL4 > UAS-20xShi.ts1 and Control female fly brains. Perineurial glia are the most superficial layer with subperineurial glia appearing as the generally thinner and darker layer immediately basal to the perineurial glia. White arrows indicate presence of microtubule bundles. (B) External aspect of hemolymph-brain barrier visualized by injection and fixation of Alexa647-10kd dextran in Repo-GAL4 > USA-20xShi.ts1 and control brains, demonstrating an intact barrier in both genotypes. (C) Total sleep time of RepoGS > UAS Rab CA or DN flies, in the absence of RU486. Red bars represent UAS-Rab DN and green bars are UAS-Rab CA, with two insertions available in most cases (n = 7–16, for all genotypes). Significant Rabs are those in which all DN lines were consistently and significantly different from all CA lines measured by one-way ANOVA with Holm-Sidak post-hoc test or unpaired t-test for Rab30, with *p<0.05, **p<0.01, ***p<0.001. Displayed significance value represents the largest p-value of the 3–4 comparisons. Error bars represent standard error of the mean (SEM). (D) Total sleep time of flies expressing Rab11 CA in all glia (Repo-GAL4), perineurial glia (NP6293-GAL4), and subperineurial glia (Rab9-GAL4) as compared to GAL4 and UAS controls (n = 15–30), statistics as above.
Figure 4—figure supplement 1
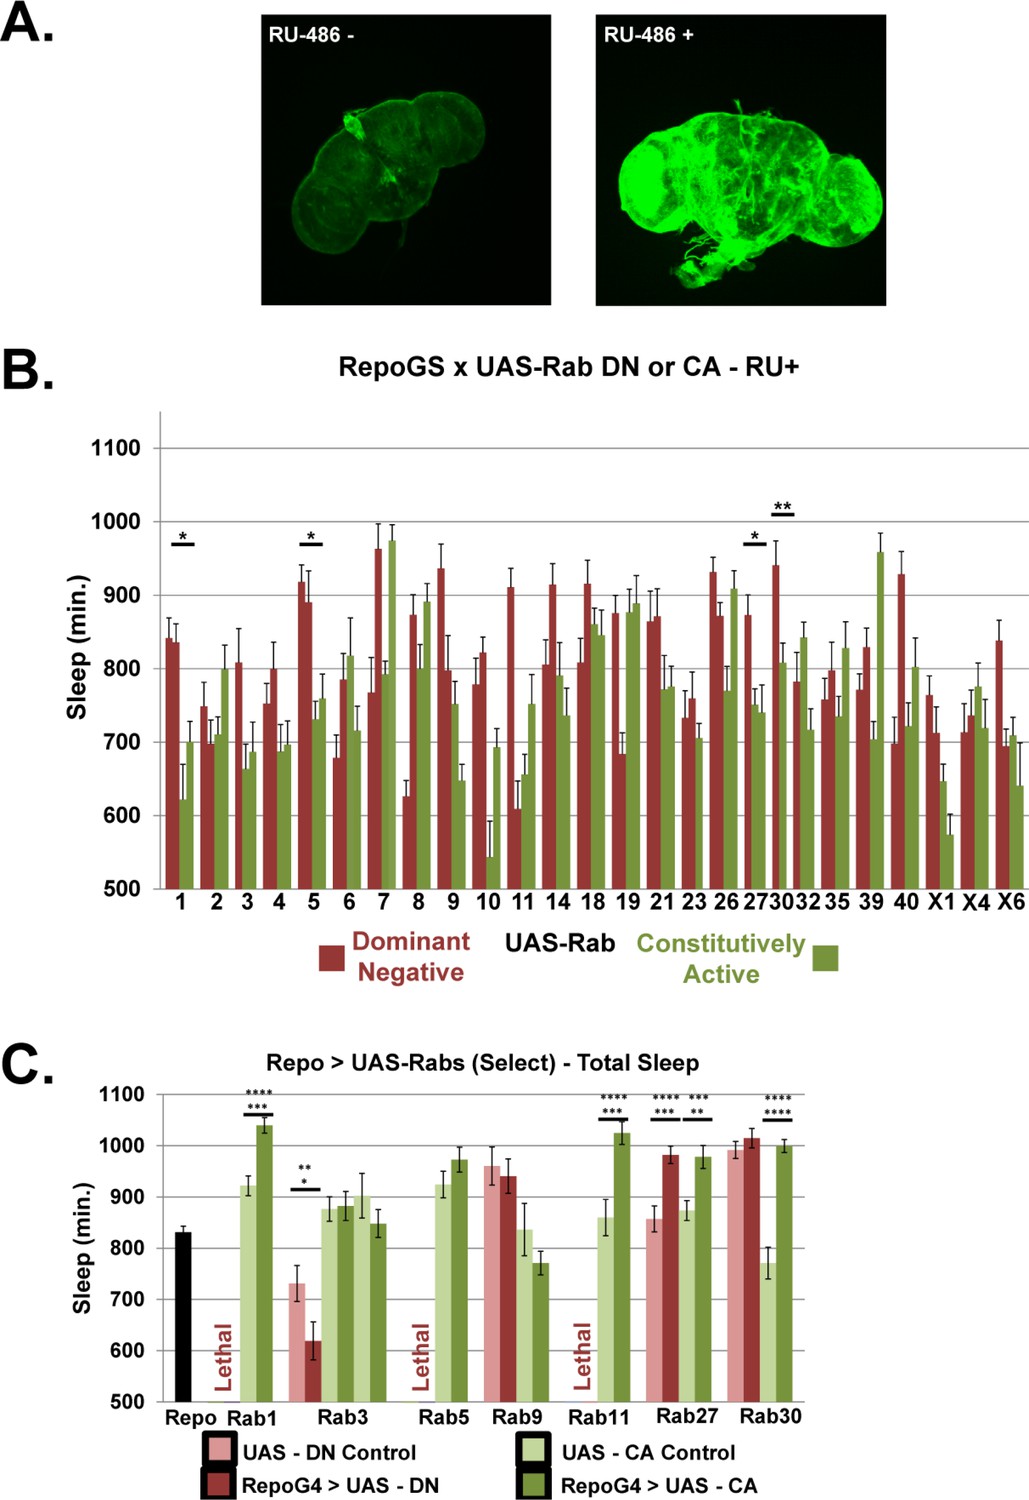
Rab screen with pan-glial driver Repo-GS and Repo-GAL4.
(A) Maximum projection z-stack confocal images of brains from Repo-GeneSwitch >CD8::GFP flies in the presence and absence of RU486. Confocal imaging parameters are kept constant to demonstrate difference in expression between conditions. (B) Total sleep time of Repo-GeneSwitch > UAS Rab CA and DN flies, in the presence of RU486. Red bars represent UAS-Rab DN and green bars are UAS-Rab CA lines, n = 5–16, per each genotype. Significant Rabs are those in which all available DN lines were consistently and significantly different from all CA lines measured by One-way ANOVA with Holm-Sidak posthoc test or unpaired t-test for Rab30, *p<0.05, **p<0.01, ***p<0.001. Displayed significance value represents the largest p-value of the 3–4 comparisons between all DN and CA lines. Error bars represent standard error of the mean (SEM). (C) Total sleep time of flies with Repo-GAL4 driving select UAS-Rab CA and DN lines, including both parental controls. Lethality was seen for pan-glial expression of the DN constructs of Rab1, 5 and 11. One-way ANOVA with Holm-Sidak post-hoc test, *p<0.05, ** is p<0.01, *** is p<0.001. Error bars represent standard error of the mean (SEM). The top star(s) represent significance compared to Repo-GAL4 Control (n = 92, average five experiments), while bottom star(s) represent comparison to UAS Control. (n = 15–16, for each UAS Control and Experimental genotype).
Figure 4—figure supplement 2

Daytime sleep, sleep deprivation resistance and barrier integrity with Rab11 expression in surface glia.
(A) Day sleep time of female flies expressing Rab11 CA in all glia (Repo-GAL4), perineurial glia (NP6293-GAL4), and subperineurial glia (Rab9-GAL4) as compared to GAL4 and UAS controls (n = 15–30). One-way ANOVA with Holm-Sidak post-hoc test with *p<0.05, **p<0.01, ***p<0.001. Error bars represent standard error of the mean (SEM). (B) Sleep during deprivation for Repo-GAL4 and driving UAS-Rab11 CA for female flies (n = 16, each genotype). Statistics as above. (C) Intact hemolymph-brain barrier visualized by injection and fixation of Alexa647-10kd Dextran in Repo-GAL4 > UAS-Rab11::YFP and UAS-CD8::GFP control brains.
Figure 5 with 4 supplements
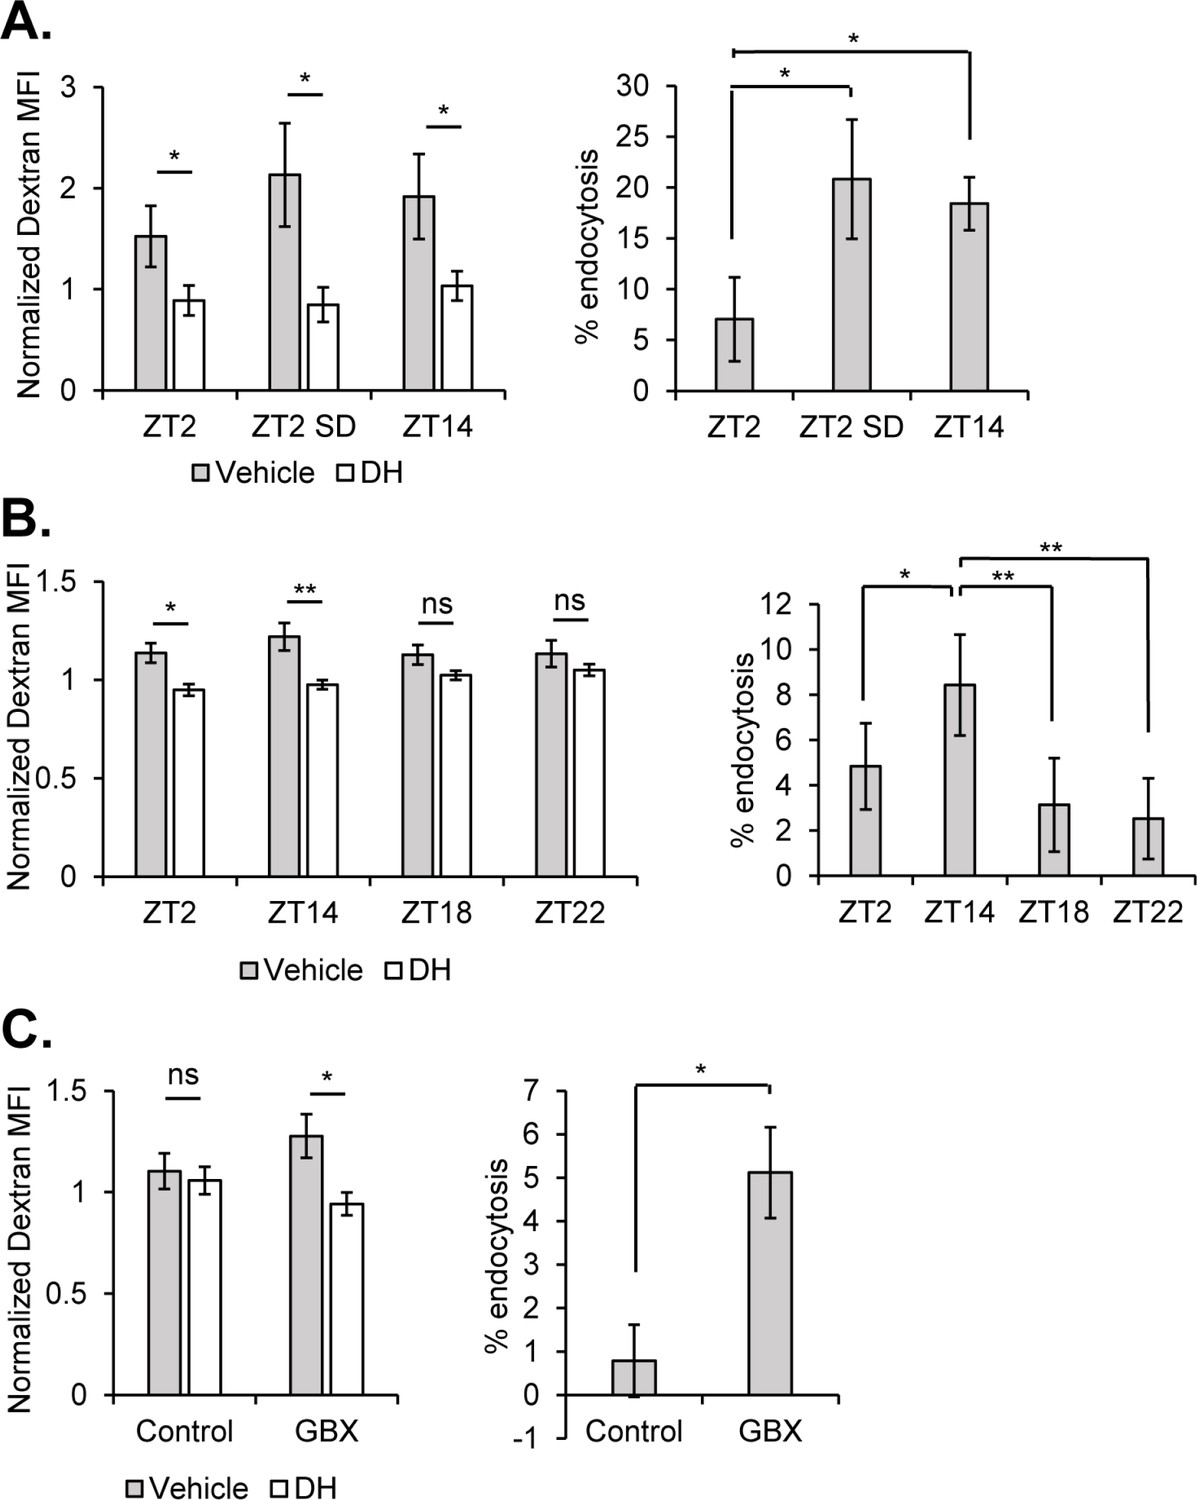
Sleep promotes endocytosis at the surface glia.
Brains (n = 20, per condition in experiment) from 9-137 GAL4, UAS-CD8::GFP flies were dissected, dissociated, and the samples incubated with Alexa647-conjugated 10kd dextran in the presence or absence of the dynamin inhibitor, dynasore hydrate. Endocytosis measured from surface glial cells by AF647-Dextran signal, expressed as normalized median fluorescence intensity (MFI) (left) and percentage of cells with high endocytosis signal (right). Dextran MFI is normalized to the average MFI of the DH-treated samples. Paired Student’s T-test with *p<0.05 and **p<0.01. Percentage of GFP+ cells displaying high signal with vehicle conditions was normalized to inhibitor for each respective timepoint to compare between experiments. One-way ANOVA with correlated measures with post-hoc Tukey’s test with *p<0.05 and **p<0.01. (A) Endocytosis at ZT2, ZT2 following sleep deprivation (12 hr, mechanical stimulation) and ZT14 (n = 4 per time point, pooled from four experiments). (B) Endocytosis at night time points ZT14, ZT18, and ZT22 along with ZT2 (n = 4, pooled from four experiments). (C) Endocytosis at ZT2 after feeding of 0.1 mg/mL Gaboxadol or vehicle (n = 3, pooled from two experiments).
Figure 5—figure supplement 1
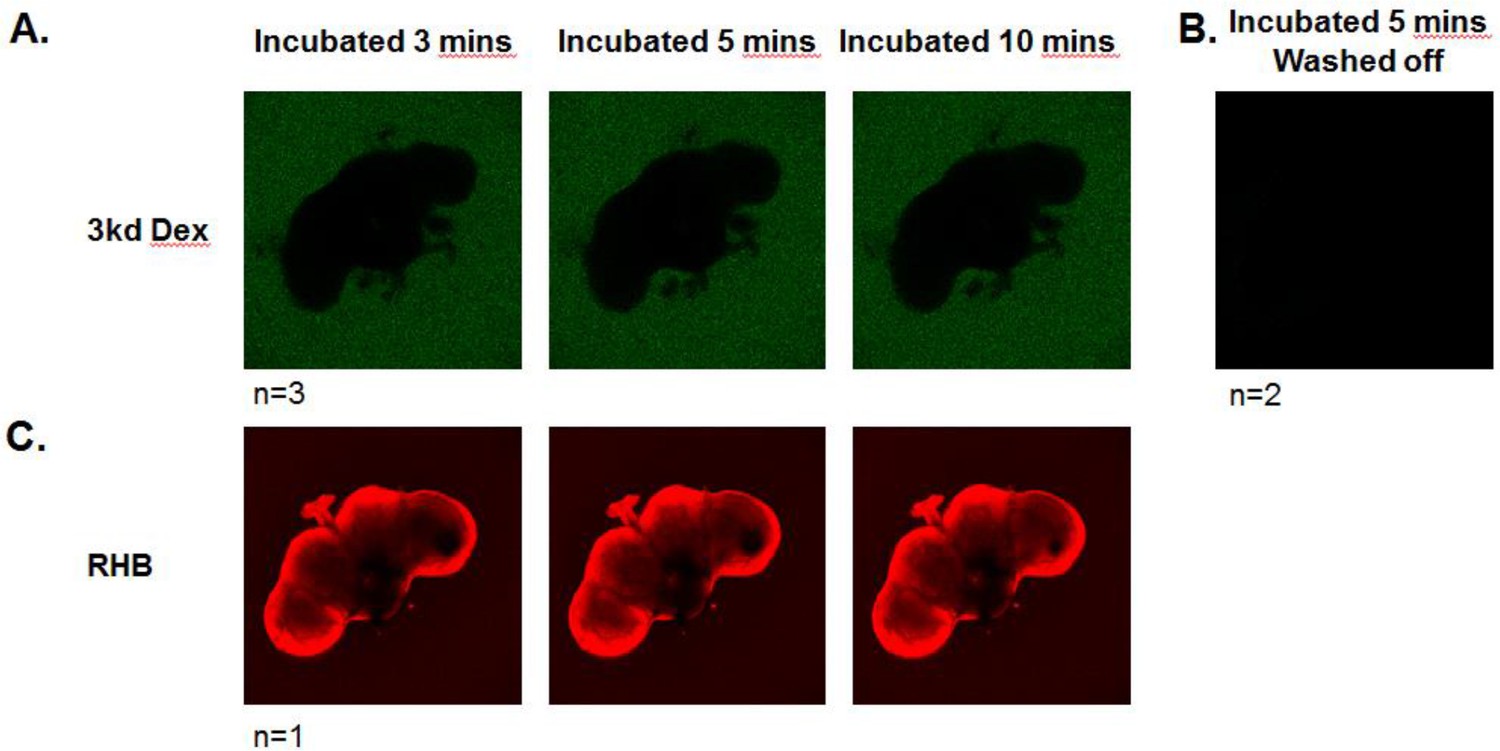
Blood-brain barrier restricts passage of 3kD dextran into the brain.
Live dissected brains were incubated with 3kD FITC-conjugated dextran for up to 10 mins (A) or (B) washed off after 5 min of incubation. (A) shows representative images of brains 3, 5, and 10 min following start of incubation. (B) After wash off, no fluorescence of dextran above background was seen. (C) Live dissected brains were incubated with Rhodamine B. Brains were imaged continuously by confocal microscopy. Representative images are shown of 3, 5, and/or 10 min following start of incubation.
Figure 5—figure supplement 2
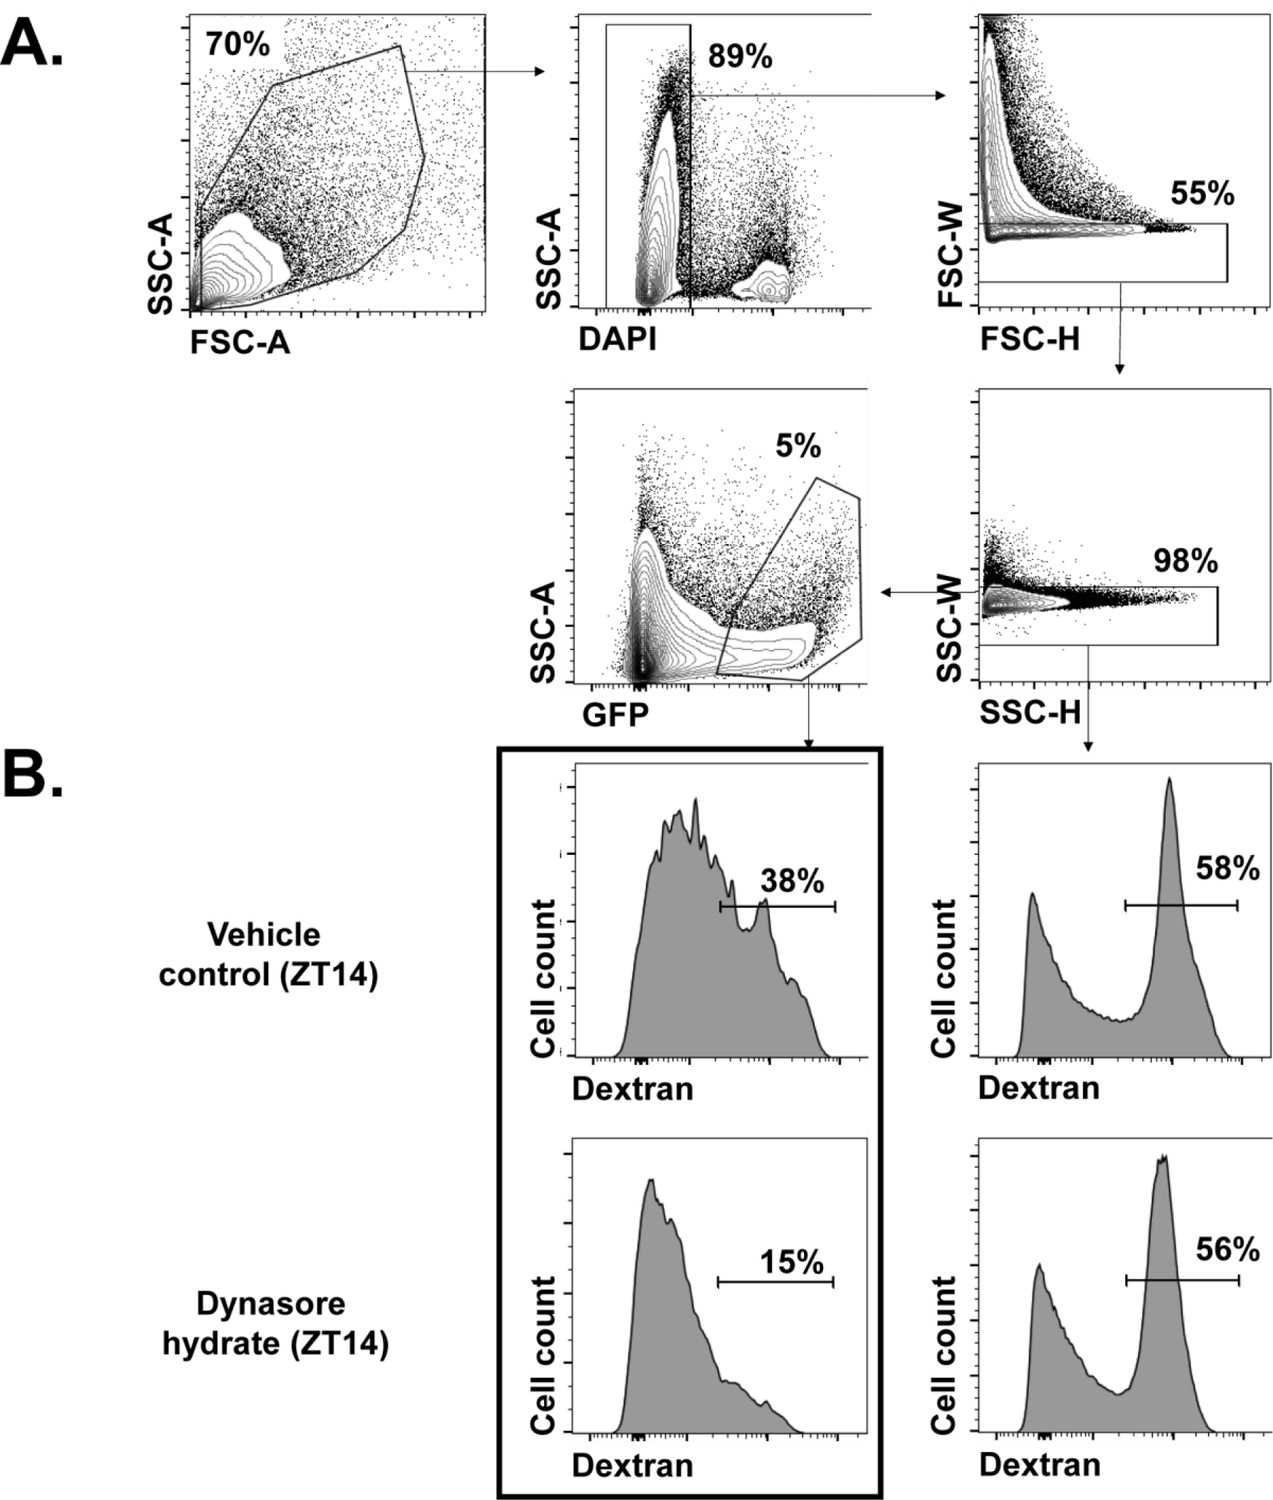
Analysis of endocytosis using flow cytometry.
(A) Gating strategy for FACS analysis. Events were gated on cell size, live cells, and forward scatter (FSC) and side scatter (SSC) singlets. GFP+ gates were determined with a GFP- sample. (B) Endocytosis of Drosophila BBB cells. Total dissociated brain cells from 9-137-GAL4 > UASCD8 GFP flies were treated with vehicle or dynasore hydrate and analyzed by flow cytometry. Gates for dextran-high cells were determined using the bimodal distribution of dextran in live singlets (right panels) and applied to GFP+ BBB cells (left panels). Mean fluorescent intensity (MFI) and percentages used for the analysis of endocytosis were derived from outlined panels. All primary data analyses were performed using FlowJo software.
Figure 5—figure supplement 3
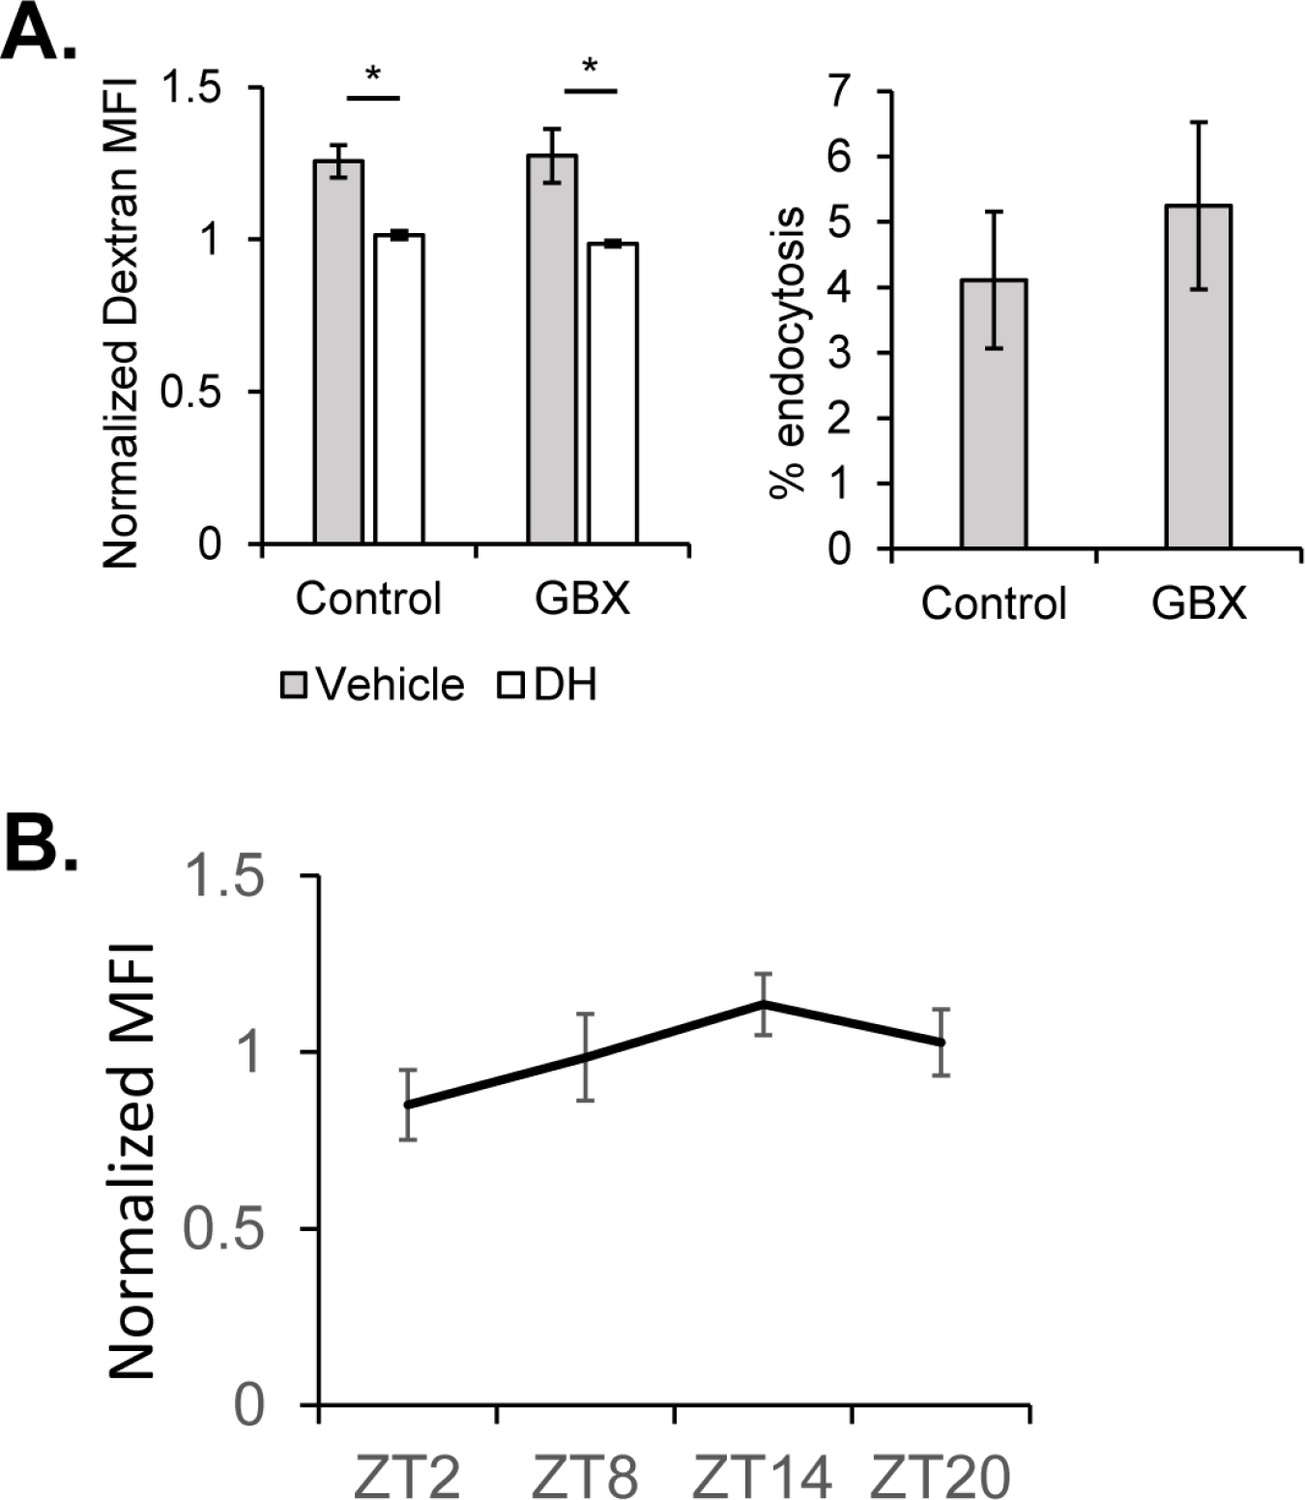
Endocytosis at the BBB across circadian timepoints and upon Gaboxadol feeding at night (ZT14).
(A) Endocytosis measured from surface glial cells by AF647-Dextran signal at ZT14 after feeding of 0.1 mg/mL Gaboxadol or control (n = 3, pooled from two experiments). Expressed as normalized median fluorescence intensity (MFI) (left) and percentage of cells with high endocytosis signal (right). Dextran MFI is normalized to the average MFI of the DH-treated samples. Paired Student’s T-test with *p<0.05 and **p<0.01. Percentage of GFP+ cells displaying high signal with vehicle conditions normalized to inhibitor for each respective timepoint to compare between experiments. One-way ANOVA with correlated measures with post-hoc Tukey’s test with *p<0.05 and **p<0.01. (B) Mean endocytosis amount represented by normalized median fluorescence intensity (normalized to average MFI per experiment, as inhibitor was not used in these experiments) for ZT2, ZT8, ZT14 and ZT20 (n = 5 experiments). Not significant by JTK_CYCLE (p=0.13).
Figure 5—figure supplement 4
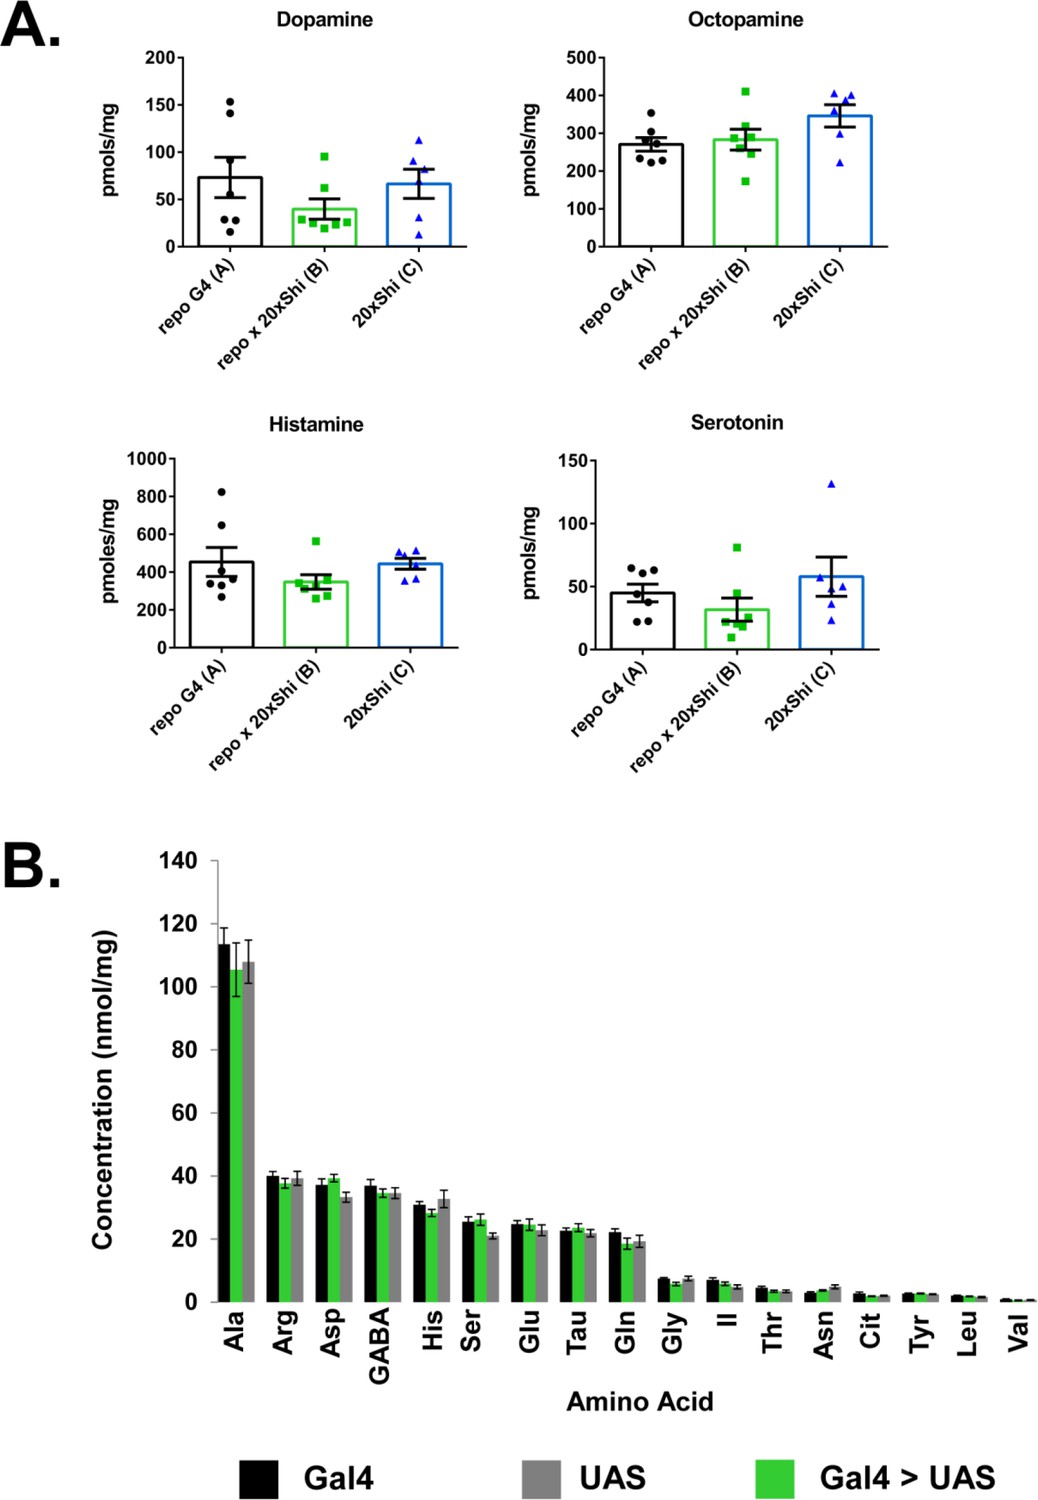
Whole-brain biogenic amines and amino acids are unaltered in Repo > Shi flies.
(A) Dopamine, octopamine, histamine and serotonin measured by LC-MS. n = 20 brains per sample, seven replicates. (B) Amino acids measured by HPLC. n = 20 brains per sample, six replicates.
Author response image 1
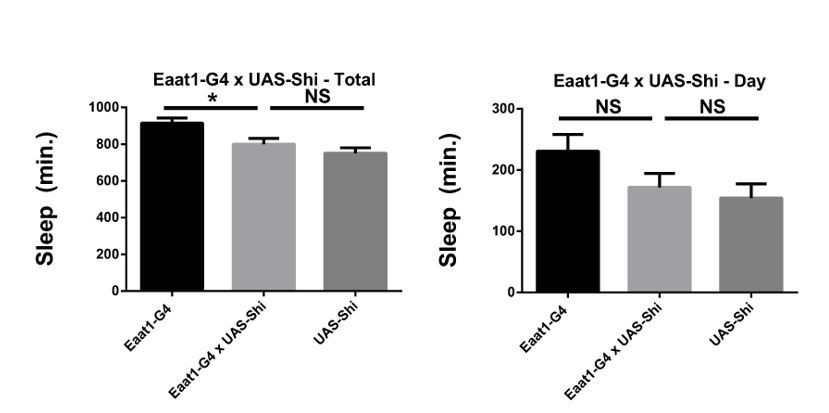
Shibire expression in astrocyte-like glia does not increase sleep.
Total and daytime sleep of Eaat1-GAL4>UAS-Shi.ts1;UAS-Shi.ts1 female flies at 18°C (n=16, each genotype). One-way ANOVA with Holm-Sidak post-hoc test, * P < 0.05, ** P < 0.01, *** P < 0.001. Error bars represent standard error of the mean (SEM).
Additional files
-
Transparent reporting form
- https://doi.org/10.7554/eLife.43326.020
Download links
A two-part list of links to download the article, or parts of the article, in various formats.
Downloads (link to download the article as PDF)
Open citations (links to open the citations from this article in various online reference manager services)
Cite this article (links to download the citations from this article in formats compatible with various reference manager tools)
Endocytosis at the Drosophila blood–brain barrier as a function for sleep
eLife 7:e43326.
https://doi.org/10.7554/eLife.43326


