Neural basis of somatosensory target detection independent of uncertainty, relevance, and reports
- Freie Universität Berlin, Germany
Figures
Figure 1

Experimental design.
(A) Trial design. After a variable intertrial interval of 2.5–7 s, electrical target stimuli and visual matching cues were presented simultaneously. A white matching cue signalled stimulus presence, a dark grey matching cue signalled stimulus absence. After a short delay, participants reported a match or mismatch between the cue and their somatosensory percept by selecting one of two colour-coded disks with a saccadic eye movement. Example: If participants detected the target and saw a white matching cue, they would report a match. Likewise, if they did not detect the target and saw a dark grey matching cue, they would also report a match, resulting in the same behavioural relevance of detected and undetected targets and orthogonalisation of target detection and overt reports. (B) Graphical depiction of experimental regressors plotted against stimulus intensity levels. Five stimulus and behavioural dimensions of our task were specified as parametric regressors on trial onsets: physical stimulus intensity, target detection, detection probability, expected uncertainty, and overt reports.
Figure 2
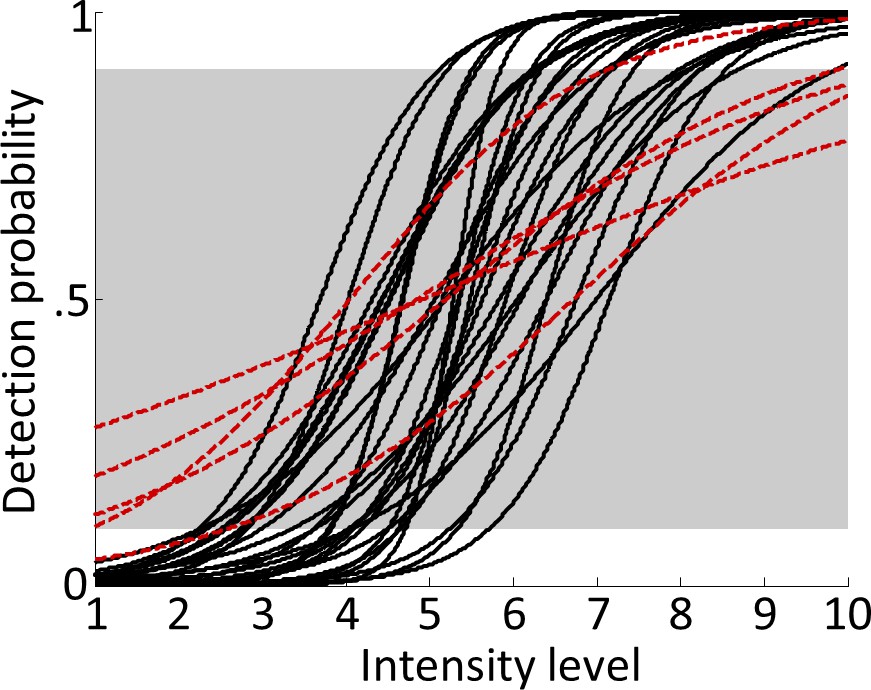
Psychometric functions.
Logistic functions were fitted to each participant’s behavioural data during the main experiment and averaged across runs to obtain continuous models of individual psychometric functions. Note that although the shape of the psychometric function can vary considerably across participants, due to the individually adjusted stimulus intensities, the resulting curves were normalised to span 0–100% detection probability from intensity levels 1 to 10. Red dashed lines show fitted psychometric functions of five participants that failed to reach ≤10% detection probability for intensity level 1 or ≥90% detection probability for intensity level 10 (outside the grey-shaded area) and were therefore excluded from all further analyses.
-
Figure 2—source data 1
Target detection rates for all intensity levels.
Participants were required to detect targets at ten linearly increasing intensity levels that were centred on their individual detection thresholds. The resulting psychometric functions are displayed in Figure 2. Runwise detection rates for each intensity level are reported for all participants.
- https://doi.org/10.7554/eLife.43410.004
Figure 3 with 1 supplement
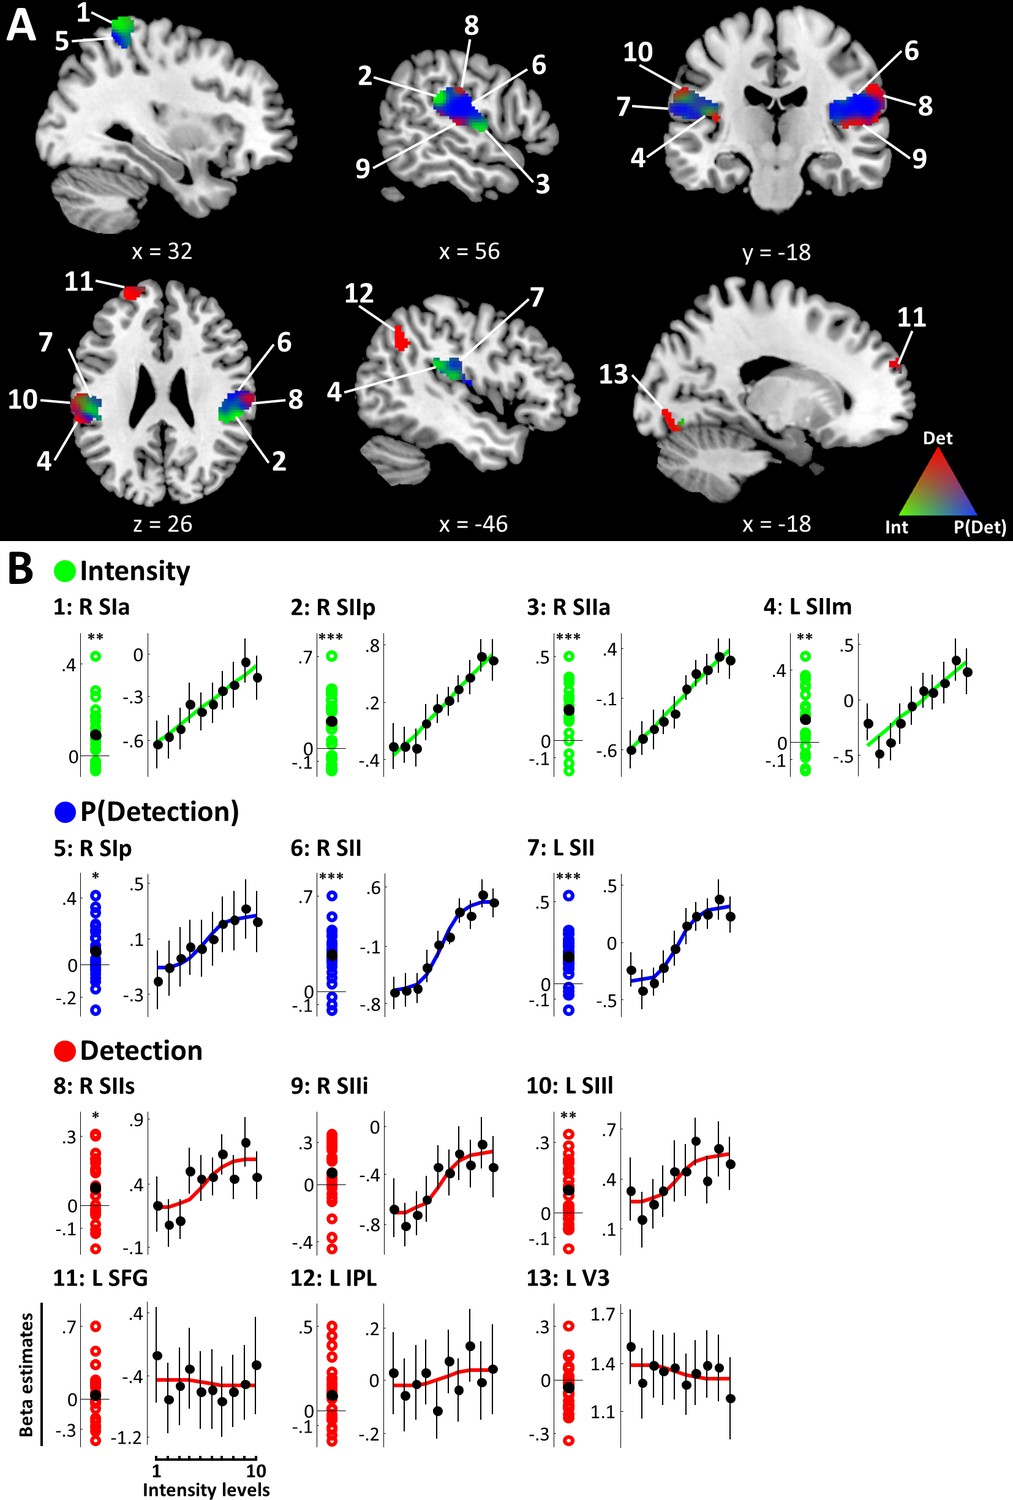
+family models.
(A) BMS results (ROI analysis). EPs of the +family models are displayed within +family ROIs. RGB values indicate model EPs: The corners of the RGB triangle correspond to EP = 1 signifying a clear winner of the BMS, whereas intermixed colours indicate similar EPs for respective models. Intensity (green), P(Detection) (blue), Detection (red). k ≥ 50 voxels. (B) Beta estimates and stimulus response profiles. Left panels: Beta estimates of the winning models’ experimental regressors were extracted from individual BMS peak voxels. Each coloured circle corresponds to one participant’s beta estimate. Black circles mark group means. Asterisks indicate evidence for a deviation from zero: *BF >3, **BF >20, ***BF >150. Right panels: beta estimates for different intensity levels were extracted from regions of interest and plotted to provide SRPs. For visualisation, fitted representations of the winning models are plotted along with the beta estimates. Error bars represent the standard error of the mean. Somatosensory regions show representations of stimulus intensity, detection probability, and binary target detection, which are reflected in their SRPs. Detection-sensitive regions in prefrontal, posterior parietal, and visual areas do not show systematic relationships with stimulus intensity.
-
Figure 3—source data 1
Beta estimates for clusters defined by the +family models.
Beta estimates of the winning models’ experimental regressors were extracted from individual BMS peak voxels. To obtain stimulus response profiles for regions well explained by the intensity, detection probability, or detection models, beta estimates for each intensity level were extracted from 4 mm spheres centred on these peaks. Resulting beta distributions and stimulus response profiles are displayed in Figure 3B. Beta estimates for experimental regressors and for all intensity levels are provided for each region of interest, participant, and run.
- https://doi.org/10.7554/eLife.43410.007
Figure 3—figure supplement 1
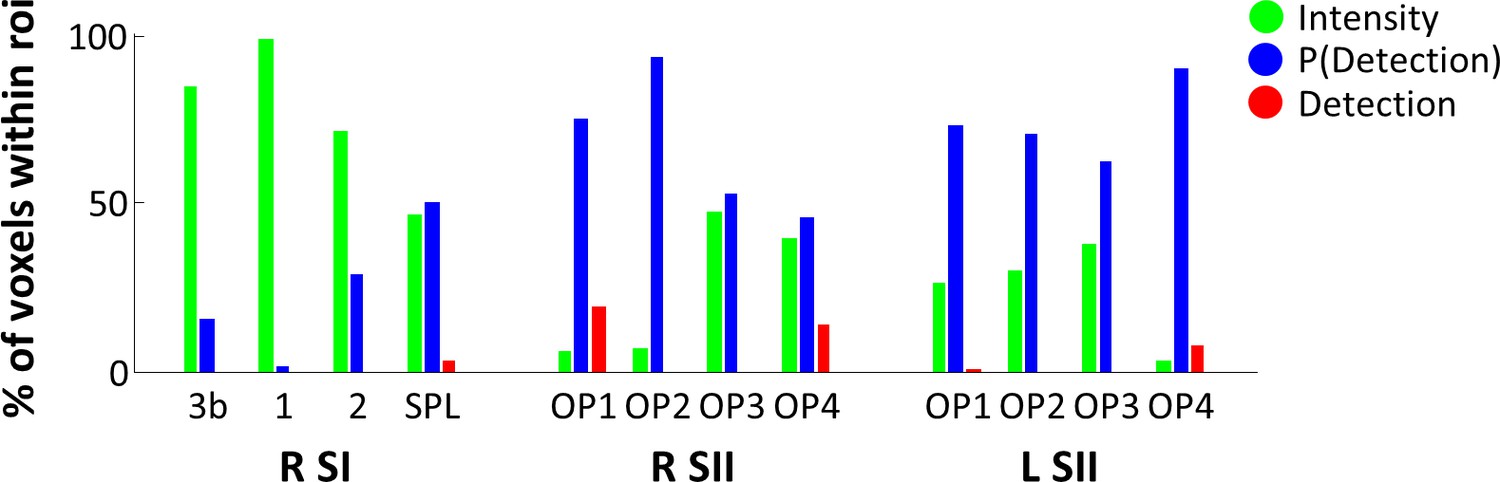
Distribution of models in cytoarchitectonic subregions of SI and SII.
FMRI voxels in observed SI and SII clusters were labelled by the models yielding the highest EP in the group level BMS and the relative number of voxels labelled by the respective models was determined for each cytoarchitectonic subregion in anterior parietal cortex (SI) and the parietal operculum (SII) as defined by the Anatomy Toolbox (Eickhoff et al., 2005). In SI, a shift from intensity to detection probability representations was observed from anterior to posterior subregions, whereas SII did not show a clear functional organisation.
Figure 4
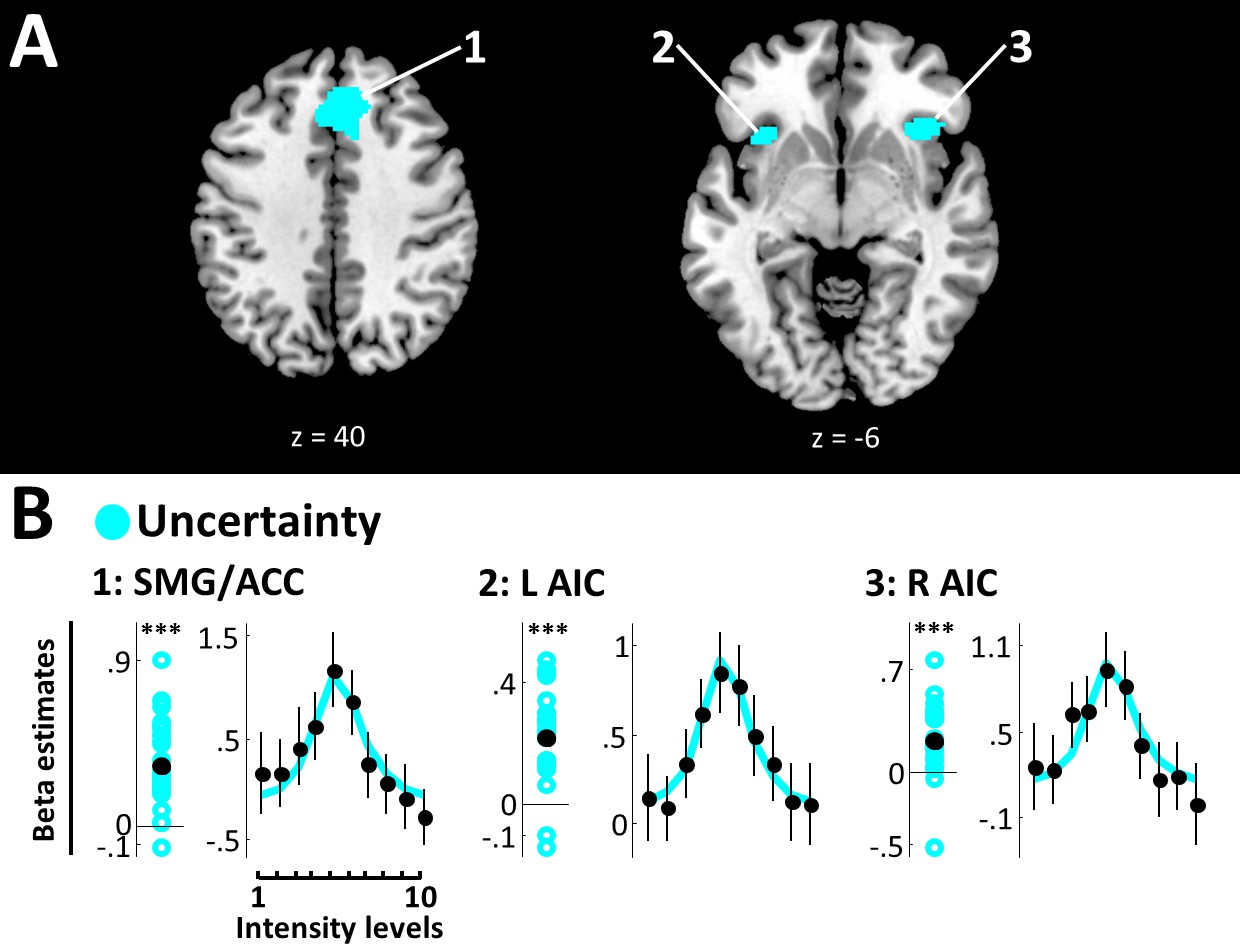
Uncertainty model.
(A) BMS results (whole-brain analysis). Voxels with EP ≥.99 for the uncertainty model are displayed. Expected uncertainty best modelled data in bilateral SMG/ACC and bilateral AIC. k ≥50 voxels. (B) Beta estimates and stimulus response profiles. Beta estimates of the winning models’ experimental regressors (left panels) and SRPs (right panels) are displayed as in Figure 3. *BF >3, **BF >20, ***BF >150. SMG/ACC and AIC show positive beta estimates and clear inverse U-shaped SRPs, confirming a representation of stimulus uncertainty.
-
Figure 4—source data 1
Beta estimates for clusters defined by the uncertainty model.
Beta estimates and stimulus response profiles for regions modelled by the uncertainty model were extracted as described for Figure 3—source data 1 and are displayed in Figure 4B. Beta estimates for experimental regressors and for all intensity levels are provided for each region of interest, participant, and run.
- https://doi.org/10.7554/eLife.43410.010
Figure 5

Report model.
(A) BMS results (whole-brain analysis). Voxels with EP ≥.99 for the report model are displayed. Overt reports best modelled data in left SMA, left thalamus, and right SMarG. k ≥50 voxels. (B) Beta estimates and stimulus response profiles. Beta estimates of the winning models’ experimental regressors (left panels) and SRPs (right panels) are displayed as in Figure 3. *BF >3, **BF >20, ***BF >150. L SMA is the only report region that shows beta estimates that systematically deviate from zero. None of the identified report regions show systematic relationships with stimulus intensity, as expected from the lack of association between overt reports and target detection.
-
Figure 5—source data 1
Beta estimates for clusters defined by the report model.
Beta estimates and stimulus response profiles for regions modelled by the report model were extracted as described for Figure 3—source data 1 and are displayed in Figure 5B. Beta estimates for experimental regressors and for all intensity levels are provided for each region of interest, participant, and run.
- https://doi.org/10.7554/eLife.43410.012
Author response image 1

Tables
Table 1
Brain regions showing EP ≥ .99 for any of the tested models.
For the +family models the .99 EP threshold was applied on the family level and individual peak EPs are reported for every model. k ≥50 voxels. Betas of experimental regressors extracted from individual BMS peaks are reported as mean ± SEM. ACC: anterior cingulate cortex, AIC: anterior insular cortex, IPL: inferior parietal lobule, SI: primary somatosensory cortex, SII: secondary somatosensory cortex, SFG: superior frontal gyrus, SMA: supplementary motor area, SMarG: supramarginal gyrus, SMG: superior medial gyrus. a: anterior, p: posterior, i: inferior, s: superior, m: medial, l: lateral.
| Cluster size | Region | Peak MNI (x,y,z) | Peak EP | Beta | BF10 | ||
|---|---|---|---|---|---|---|---|
| Intensity | |||||||
| 247 | R SIa (BA 3b, 1, 2) | 38 | −40 | 66 | .96 | .09 ± .02 | 33.94 |
| 276 | R SIIp | 62 | −34 | 22 | .98 | .18 ± .03 | 385.13 |
| 213 | R SIIa | 54 | −6 | 4 | .90 | .20 ± .04 | 6114.09 |
| 212 | L SIIm | −46 | −34 | 22 | .90 | .13 ± .03 | 81.58 |
| Detection probability | |||||||
| 71 | R SIp (BA 2) | 34 | −50 | 62 | .99 | .08 ± .03 | 3.04 |
| 932 | R SII | 56 | −16 | 20 | .99 | .27 ± .04 | 232795.89 |
| 602 | L SII | −60 | −36 | 20 | .98 | .17 ± .03 | 7961.84 |
| Detection | |||||||
| 189 | R SIIi | 52 | −22 | 8 | .96 | .09 ± .04 | 1.36 |
| 76 | R SIIs | 62 | −20 | 30 | .95 | .08 ± .03 | 8.63 |
| 128 | L SIIl | −62 | −36 | 26 | .93 | .10 ± .02 | 96.70 |
| 116 | L SFG | −26 | 56 | 22 | 1 | .04 ± .05 | .31 |
| 66 | L IPL | −50 | −58 | 46 | 1 | .09 ± .03 | 2.84 |
| 72 | L V3 | −12 | −80 | −16 | 1 | −.04 ± .02 | .65 |
| Uncertainty | |||||||
| 664 | SMG/ACC | 2 | 30 | 40 | 1 | .33 ± .04 | 366797.07 |
| 127 | R AIC | 36 | 22 | −6 | 1 | .22 ± .03 | 453.09 |
| 70 | L AIC | −34 | 18 | −8 | 1 | .22 ± .05 | 479302.70 |
| Report | |||||||
| 132 | L SMA | −2 | 8 | 64 | 1 | −.12 ± .03 | 65.14 |
| 71 | L Thalamus | −6 | −16 | 10 | 1 | −.01 ± .02 | .22 |
| 51 | R SMarG | 60 | −34 | 44 | 1 | .02 ± .04 | .23 |
Additional files
-
Transparent reporting form
- https://doi.org/10.7554/eLife.43410.013
Download links
A two-part list of links to download the article, or parts of the article, in various formats.
Downloads (link to download the article as PDF)
Open citations (links to open the citations from this article in various online reference manager services)
Cite this article (links to download the citations from this article in formats compatible with various reference manager tools)
Neural basis of somatosensory target detection independent of uncertainty, relevance, and reports
eLife 8:e43410.
https://doi.org/10.7554/eLife.43410


