Empirical examination of the replicability of associations between brain structure and psychological variables
- Research Centre Jülich, Germany
- Heinrich Heine University Düsseldorf, Germany
Figures
Figure 1
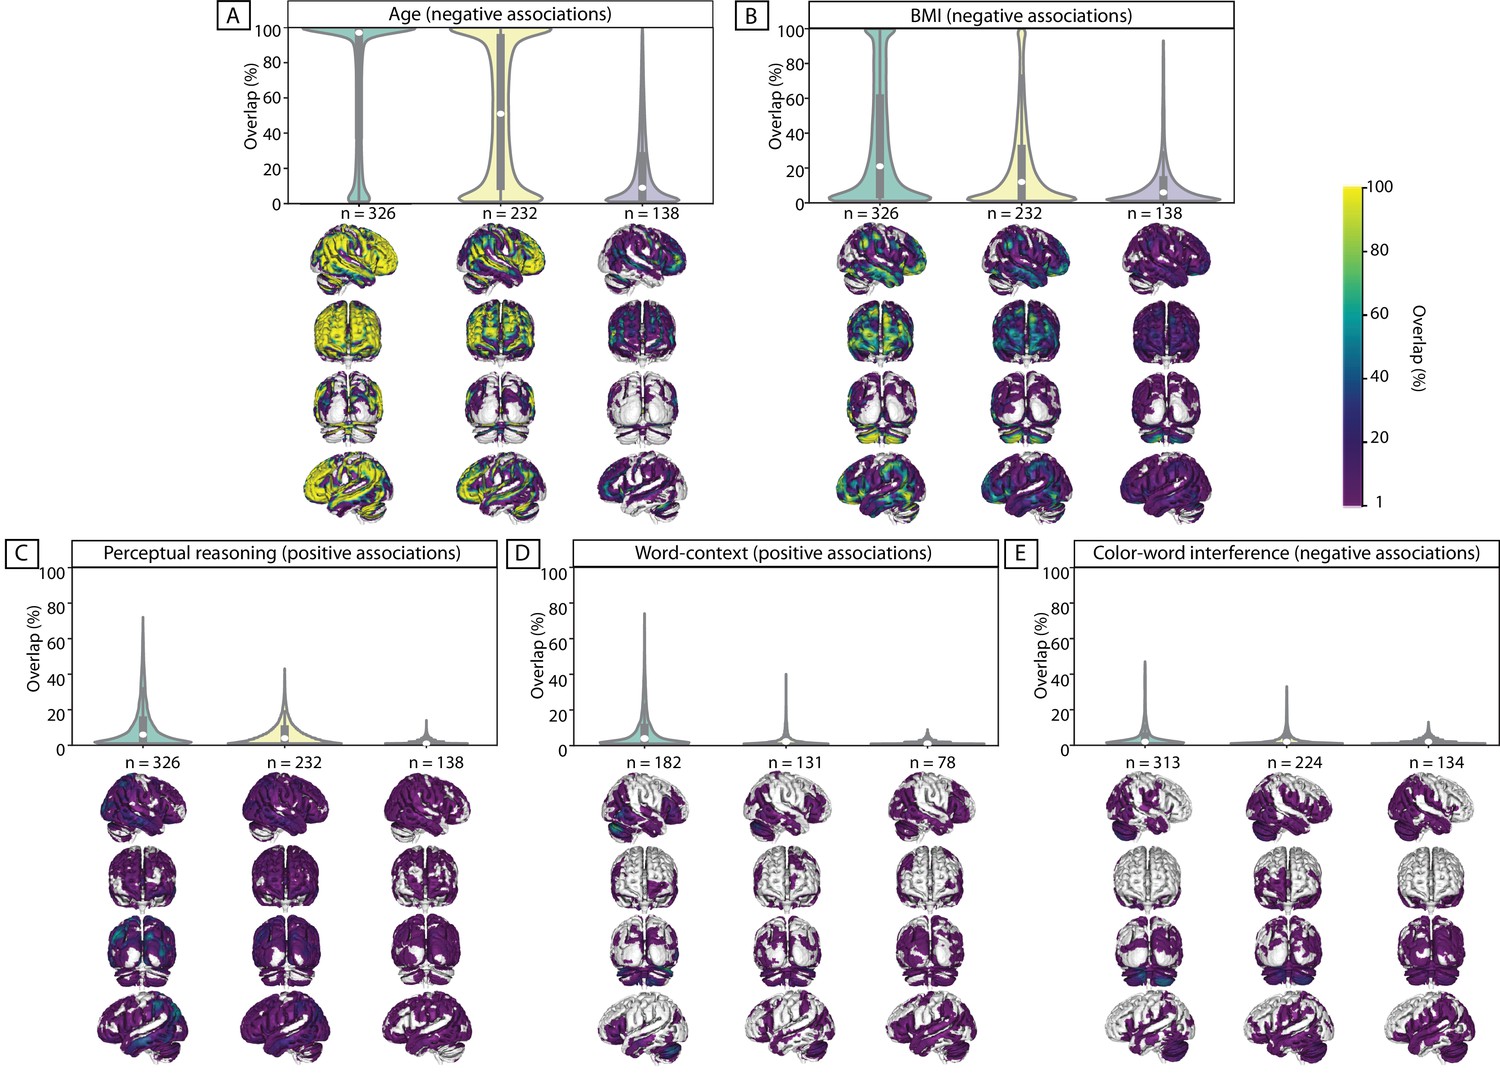
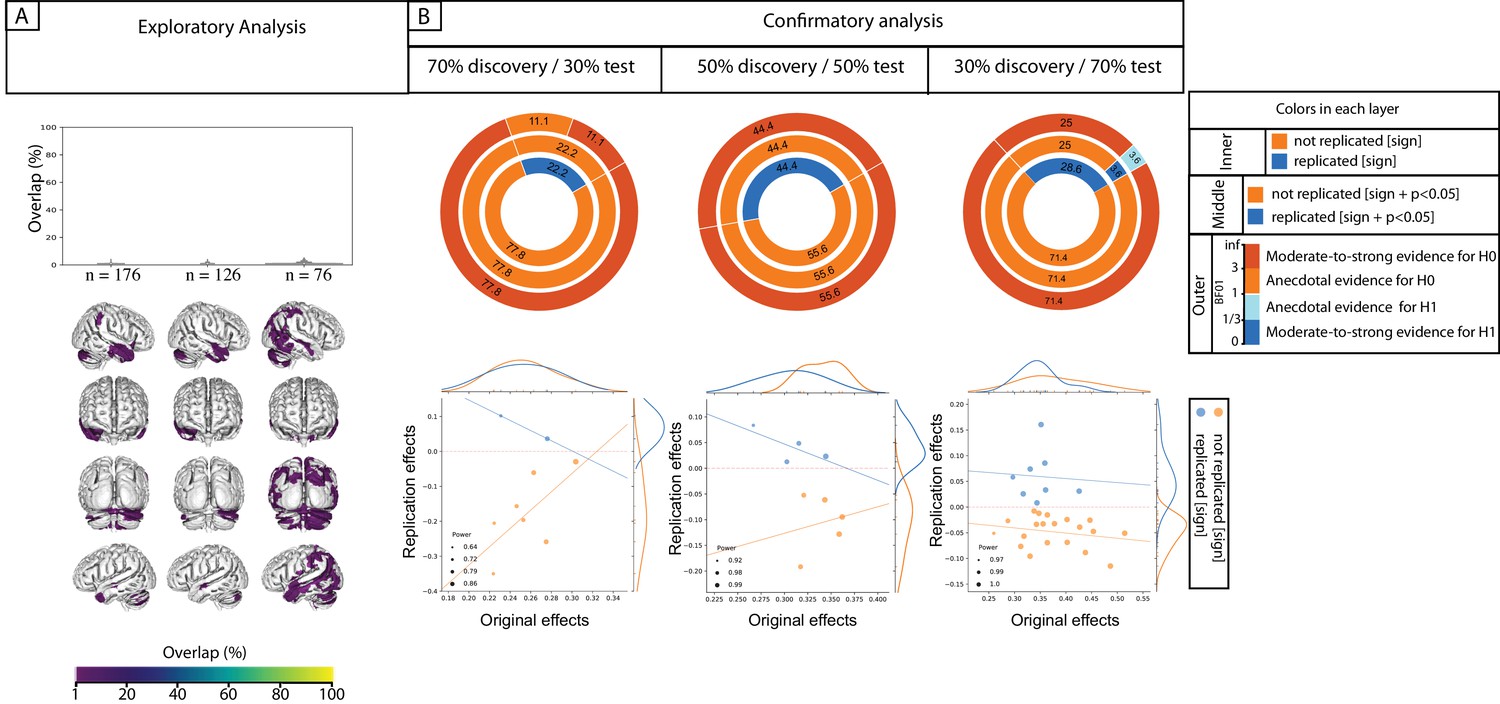
Replicability of exploratory results within healthy cohort.
Frequency of spatial overlap (density plots and aggregate maps) of significant findings from exploratory analysis over 100 random subsamples are depicted for few behavioral score. For each score, columns show the results of three different discovery sample sizes (i.e. when discovery cohorts are generated from 70%, 50% or 30% of the main sample, from left to right respectively (x-axis)). The density plots show the distribution of values within their corresponding aggregate map. The y-axis depicts the frequency of spatial overlap (in %) and the density plots show the distribution of values within their corresponding aggregate maps. In addition to age and BMI (A,B), which are used as benchmarks, the top three behavioral scores with the highest frequency of overlapping findings are depicted (C–E). Within each density plot, the box-plot shows the quartiles and extent of the distribution and the white dot depicts the median of percentage of overlap. On the spatial maps, lighter colors denote higher number of samples with a significant association at the respective voxel. BMI: body mass index; CWI: color-word interference; n = number of participants within the discovery samples.
Figure 2 with 1 supplement
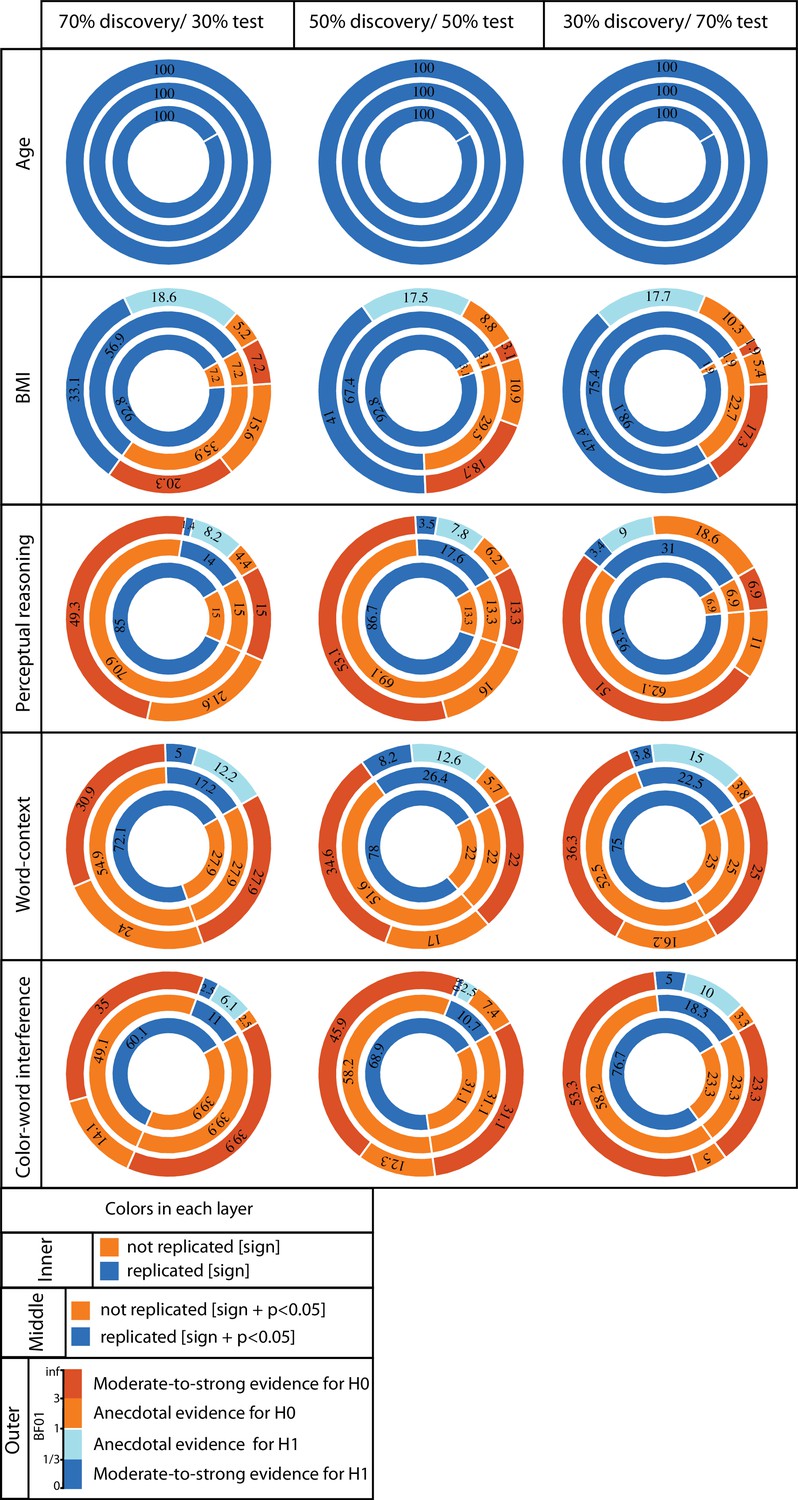
ROI-based confirmatory replication results within healthy cohort.
Donut plots summerising ROI-based replication rates (% of ROI) using three different critera for three different sample sizes among heathy participants. The most inner layers depict replication using ‘sign’ only (blue: replicated, orange: not replciated). The middle layers define replication based on similar ‘sign’ as well as ‘statistical significance’ (i.e. p<0.05) (blue: replicated, orange: not replciate). The most outer layers define replication using ‘bayes factor’ (blue: “moderate-to-string evidece for H1, light blue: anecdotal evidence for H1; light orange: anecdotal evidence for H0, orange: “moderate-to-string evidece for H0).
Figure 2—figure supplement 1
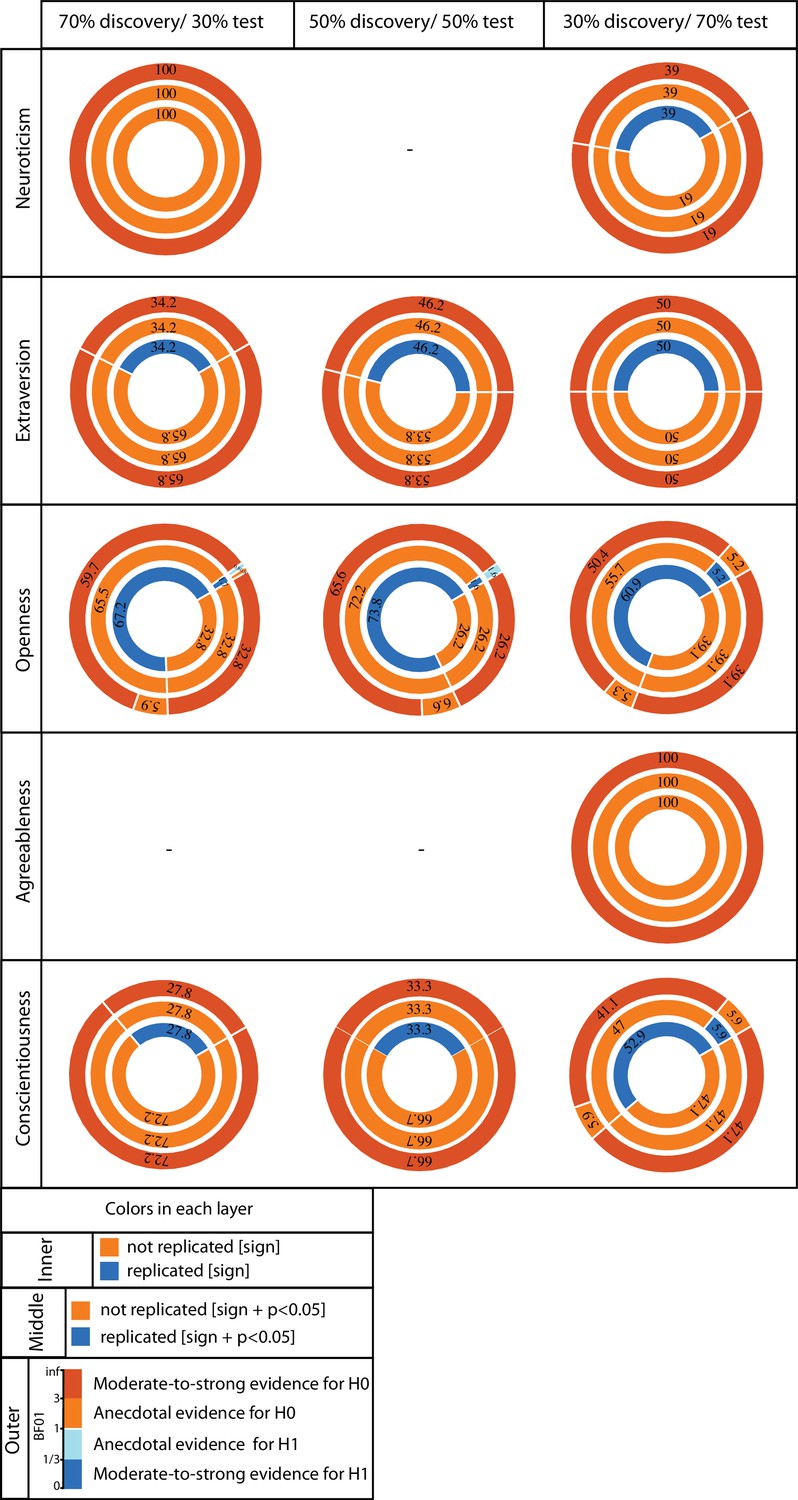
ROI-based confirmatory replication results for five personality subscores within healthy cohort.
Donut plots summerising ROI-based replication rates (% of ROI) using three different critera for three different sample sizes among heathy participants. The most inner layers depict replication using ‘sign’ only (blue: replicated, orange: not replciated). The middle layers define replication based on similar ‘sign’ as well as ‘statistical significance’ (i.e. p<0.05) (blue: replicated, orange: not replciate). The most outer layers define replication using ‘bayes factor’ (blue: “moderate-to-string evidece for H1, light blue: anecdotal evidence for H1; light orange: anecdotal evidence for H0, orange: “moderate-to-string evidece for H0).
Figure 3

Discovery versus replication effects sizes: Scatter plots of correlation coefficients in the discovery versus replication sample for all ROIs from 100 splits within healthy cohort; each point denotes one ROI, which is color-coded based on its replication status (by-‘sign’).
The size of each point is proportional to its estimated statistical power of replication. Regresion lines are drawn for the replicated and unreplicated ROIs, separately.
Figure 4 with 1 supplement
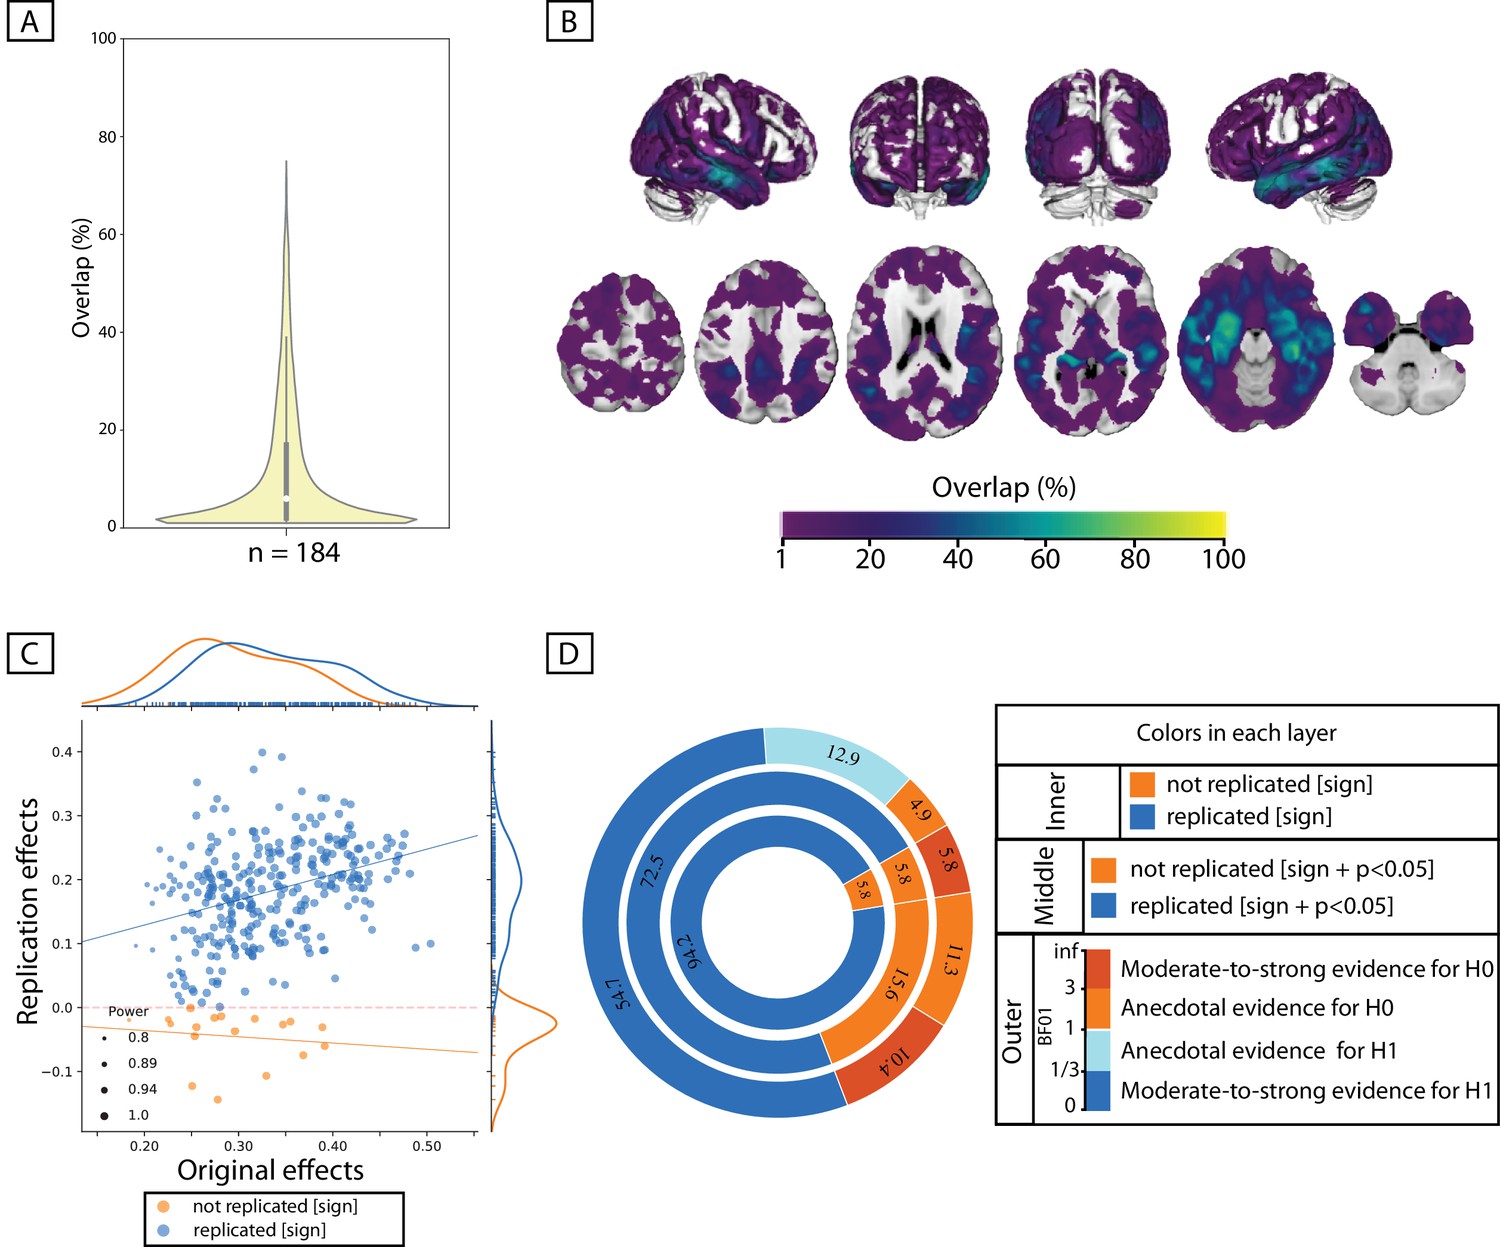
Replicability of positive association between immediate-recall and GMV within ADNI cohort.
(A, B) Replicability of exploratory results: Frequency of spatial overlaps (density plot and aggregate maps) over 100 random subsamples. Within the density plot, the box-plot shows the quartiles and extent of the distribution and the white dot depicts the median of percentage of overlap. (C, D) ROI-based confirmatory replication results: C: Original versus replication effects sizes (correlation coefficient) for all ROIs from 100 splits; points are color-coded based on their replciation status (by-‘sign’) and size of each point is proportional to the estimated statistical power of replication. Regresion lines are drawn for the replicated and unreplicated ROIs, separately. D: Donut plots summerising ROI-based replicability rates using three different critera. The most inner layer depicts replicability using ‘sign’ only (blue: replicated, orange: not replciated). The middle layer, defines replication based on similar ‘sign’ as well as ‘statistical significance’ (i.e. p<0.05) (blue: replicated, orange: not replciate). The most outer layer reflects replicability using bayes factor’ (blue: 'moderate-to-string evidece for H1, light blue: anecdotal evidence for H1; light orange: anecdotal evidence for H0, orange: 'moderate-to-string evidece for H0); Discovery and replication samples have equal size (n = 184) and are matched for age, sex and site.
Figure 4—figure supplement 1
Summary of replication of positive associations between immediate-recall and GMV within healthy cohort.
(A) Frequency of spatial overlap (density plots and aggregate maps) of significant findings from exploratory analysis over 100 random subsamples. Columns show results of three different discovery sample sizes (i.e. when discovery cohorts are generated from 70%, 50% or 30% of the main sample, from left to right respectively (x-axis)). The density plots show distribution of values within their corresponding aggregate map. The y-axis depicts frequency of spatial overlap (in %) and the density plots show distribution of values within their corresponding aggregate map. On the spatial maps, warmer colors denote higher number of samples with a significant association at the respective voxel. (B) ROI-based confirmatory replication results: Top row: Donut plots summerising ROI-based replicability rates (% of ROI) using three different critera for three different sample sizes. The most inner layers depict replicability using ‘sign’ only (blue: replicated, orange: not replciated). The middle layers define replication based on similar ‘sign’ as well as ‘statistical significance’ (i.e. p<0.05) (blue: replicated, orange: not replciate). The most outer layers reflects replicability using bayes factor’ (blue: 'moderate-to-string evidece for H1, light blue: anecdotal evidence for H1; light orange: anecdotal evidence for H0, orange: 'moderate-to-string evidece for H0); Bottom row: Scatter plots of effect sizes (correlation coefficient) in the discovery versus replication sample for all ROIs from 100 splits within healthy cohort; Points are color-coded based on their replciation status (by-‘sign’) and size of each point is proportional to the estimated statistical power of replication. Regresion lines are drawn for the replciated and unreplicated ROIs, separately.
Figure 5

box-plots showing distribution of sample sizes (log-scale) of VBM studies by their publication year (data from the BrainMap database; see Vanasse et al., 2018).
Each box shows the quantiles (25% and 75%) of the distribution and the gray horizontal line within each box, depicts the median of the distribution.
Tables
Table 1
Summary of exploratory findings.
For each discovery sample size, the number of clusters in which gray matter volume is positively or negatively associated with the tested phenotypic or psychological score is reported. The number of splits (out of 100) in which the clusters were detected are noted in parentheses (i.e. % of splits with at least one significant cluster [in the respective direction]).
| Healthy cohort | n_discovery = 70% n_total | n_discovery = 50% n_total | n_discovery = 30% n_total | |||
|---|---|---|---|---|---|---|
| # positively associated clusters (split%) | # negatively associated clusters (split%) | # positively associated clusters (split%) | # negatively associated clusters (split%) | # positively associated clusters (split%) | # negatively associated clusters (split%) | |
| Age (years) n-total = 466 | 77 (54%) | 154 (100%) | 5 (4%) | 522 (100%) | 1 (1%) | 1781 (100%) |
| BMI (kg/m2) n-total = 466 | 0 | 1741 (100%) | 0 | 2276 (100%) | 0 | 1937 (96%) |
| Perceptual IQ (sum of t-scores) n-total = 466 | 499 (83%) | 0 | 256 (58%) | 0 | 145 (33%) | 0 |
| Word-context (# of consecutively correct) n-total = 262 | 337 (80%) | 0 | 159 (47%) | 0 | 80 (21%) | 0 |
| CWI (interference) (sec) n-total = 449 | 0 | 163 (53%) | 1 (1%) | 122 (39%) | 6 (1%) | 60 (26%) |
| Clinical cohort | - | n_discovery = 50% n_total | - | |||
| RAVLT (# total immediate recall) | - | - | 309 (84%) | 0 | - | - |
-
Abbreviations: BMI: body mass index; IQ: intelligence quotient, CWI: color-word interference task; RAVLT: Rey auditory verbal learning task;
Additional files
-
Supplementary file 1
Participants characteristics.
Distribution of the raw phenotypical and psychological scores in the whole sample.
- https://doi.org/10.7554/eLife.43464.011
-
Supplementary file 2
Summary of the exploratory findings.
For each discovery sample size, the number of clusters in which gray matter volume is positively or negatively associated with the tested psychological score is reported. Number of splits (out of 100) in which the clusters were detected are noted in parentheses.
- https://doi.org/10.7554/eLife.43464.012
-
Transparent reporting form
- https://doi.org/10.7554/eLife.43464.013
Download links
A two-part list of links to download the article, or parts of the article, in various formats.
Downloads (link to download the article as PDF)
Open citations (links to open the citations from this article in various online reference manager services)
Cite this article (links to download the citations from this article in formats compatible with various reference manager tools)
Empirical examination of the replicability of associations between brain structure and psychological variables
eLife 8:e43464.
https://doi.org/10.7554/eLife.43464


