The mother’s risk of premature death after child loss across two centuries
- University of Iceland, Iceland
- Harvard TH Chan School of Public Health, United States
- Karolinska Institutet, Sweden
- Brigham and Women's Hospital, Harvard Medical School, United States
- deCODE Genetics, Iceland
- Örebro University, Sweden
Figures
Figure 1 with 2 supplements
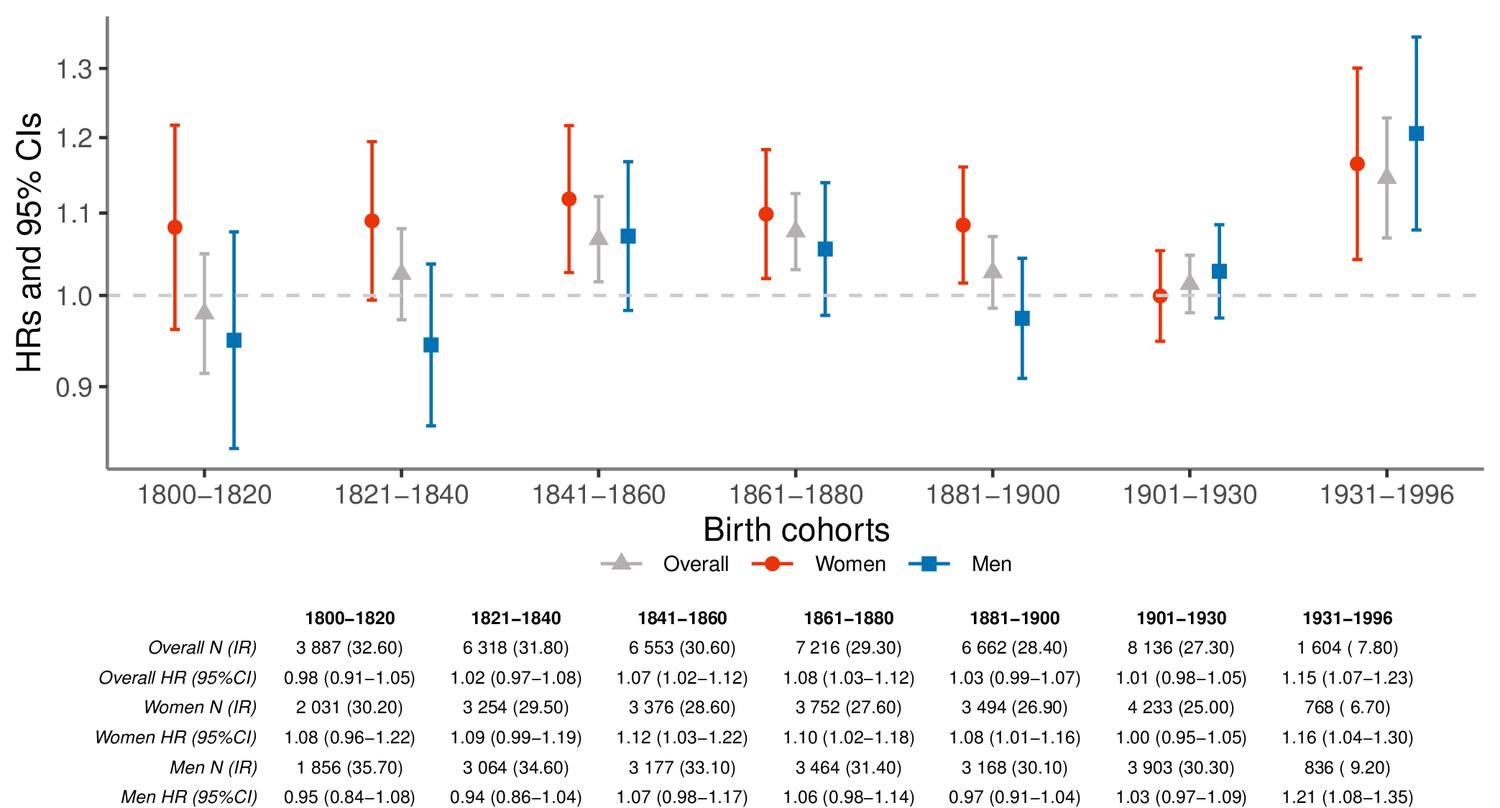
Hazard ratios (HRs) and 95% confidence intervals (CIs) of parental mortality after loss of a child by birth cohorts (every 20 years until 1900, 1901–1930, and 1931–1996), in the sibling cohort.
We estimated HRs from stratified Cox proportional hazards model using age as underlying time scale. We stratified by sibling groups and additionally adjusted for birth year and sex. IR, incidence rate, per 1000 person-years.
Figure 1—figure supplement 1
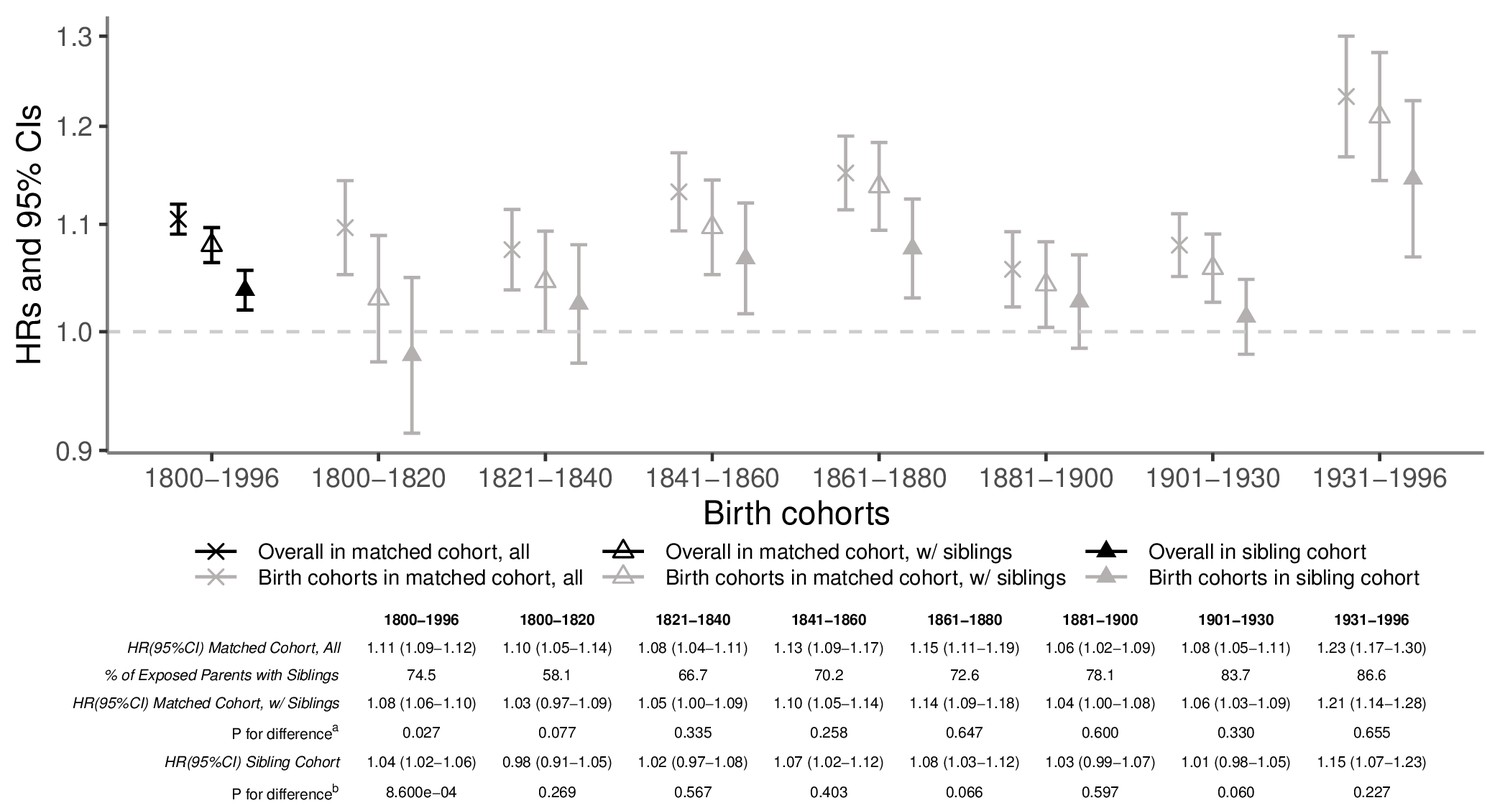
Hazard ratios (HRs) and 95% confidence intervals (CIs) of parental mortality after loss of a child among all parents and parents with identifiable siblings (those subsequently included in the sibling cohort) in the population-based matched cohort.
a p-Value for difference between HRs estimated from all parents and HRs from parents with identifiable siblings in the population-based matched cohort. b p-Value for difference between HRs estimated from a subset of the population-based matched cohort of parents with siblings and HRs from the sibling cohort.
Figure 1—figure supplement 2

Hazard ratios (HRs) and 95% confidence intervals (CIs) of parental mortality after loss of a child by birth cohorts (every 20 years until 1900, 1901–1930, and 1931–1996) in the sibling cohort, excluding parents who died on the same day as the child.
We estimated HRs from stratified Cox proportional hazards model using age as underlying time scale. We stratified by sibling groups and additionally adjusted for birth year and sex. IR, incidence rate, per 1000 person-years.
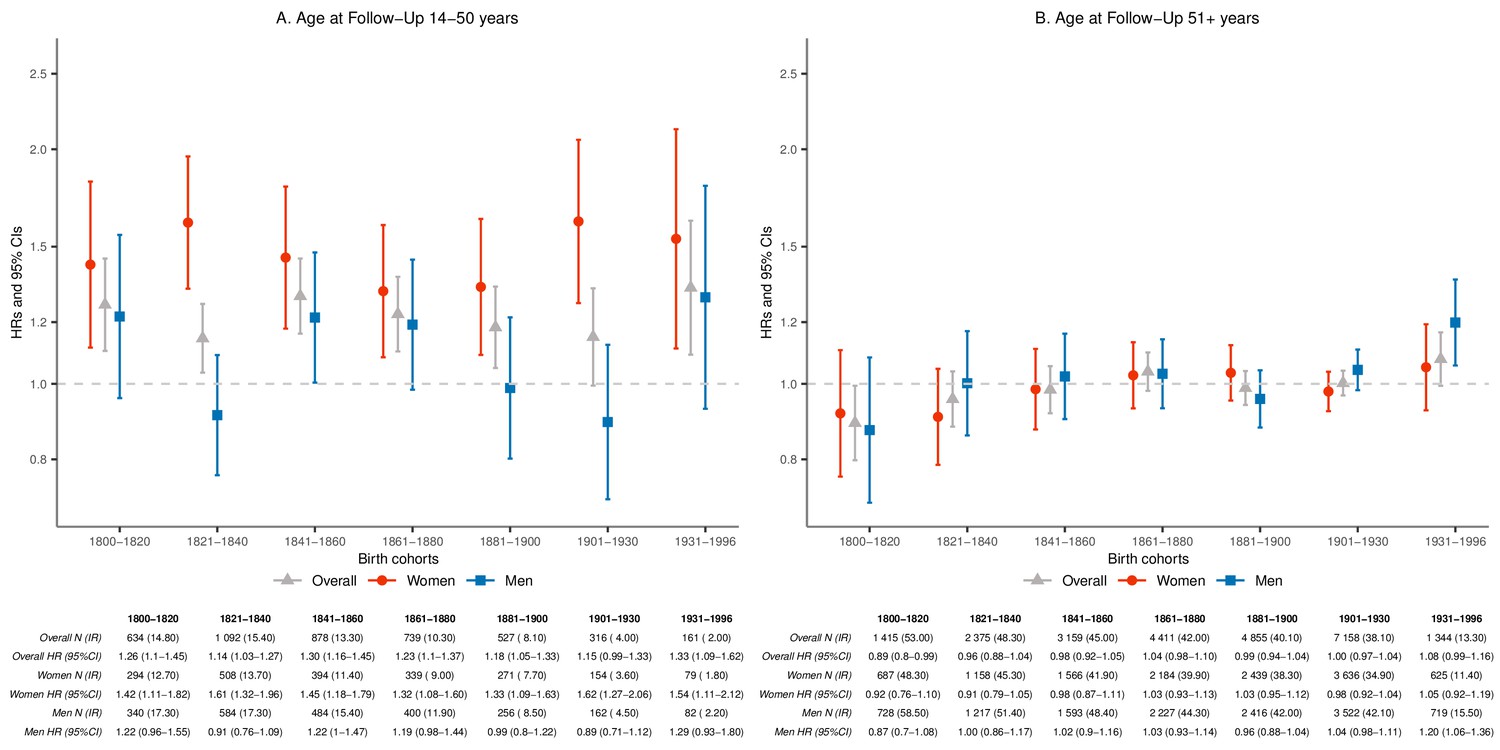
Figure 2 with 6 supplements
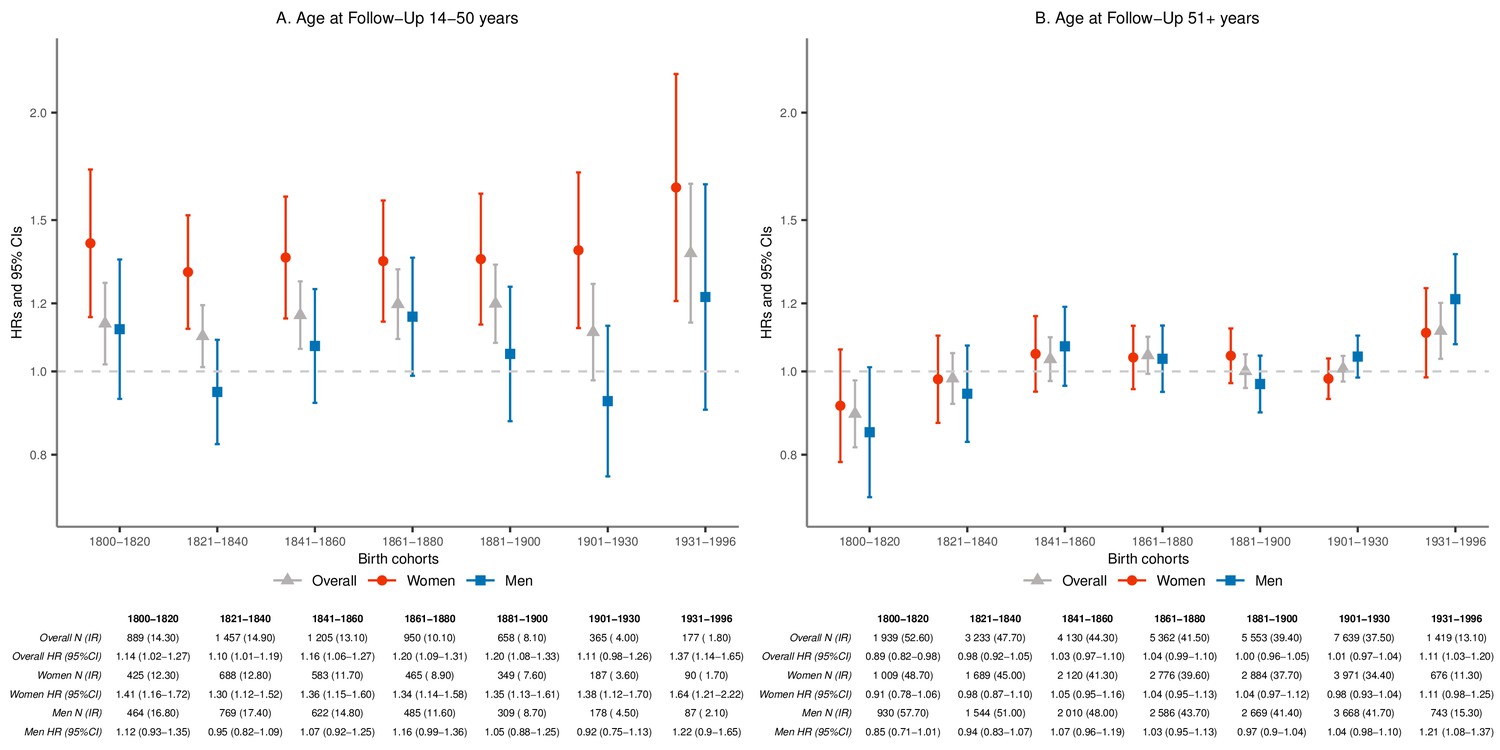
Hazard ratios (HRs) and 95% confidence intervals (CIs) of parental mortality after loss of a child, by age bands at follow-up (age 14–50 and 51+) and birth cohorts (every 20 years until 1900, 1901–1930, and 1931–1996), in the sibling cohort.
We stratified by sibling groups and additionally adjusted for birth year and sex in Cox proportional hazards model. IR, incidence rate, per 1000 person-years.
Figure 2—figure supplement 1
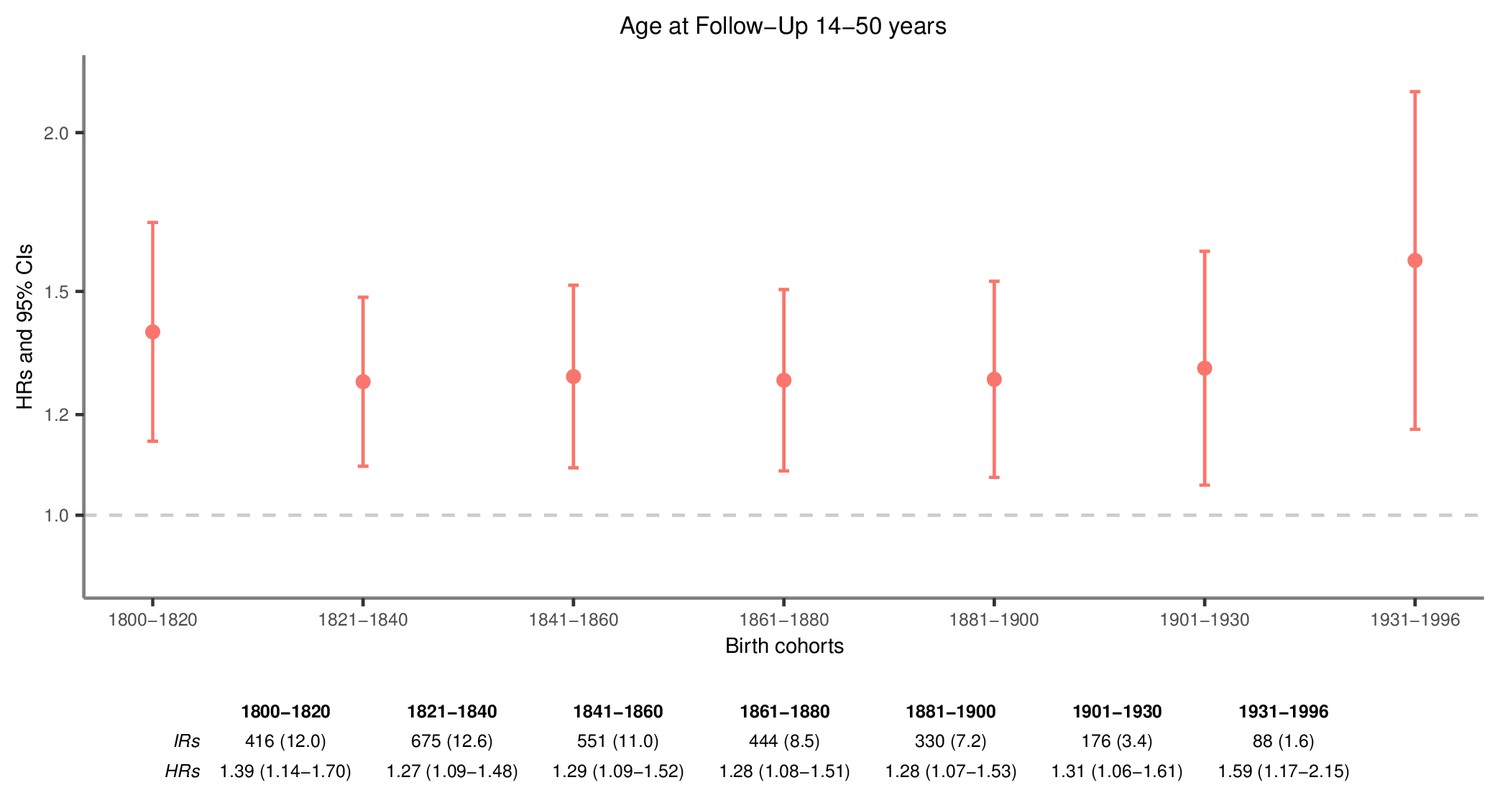
Hazard ratios (HRs) and 95% confidence intervals (CIs) of maternal mortality after loss of a child, by age bands at follow-up, excluding mothers dying within 1 week after giving birth, in the sibling cohort.
We stratified by sibling groups and additionally adjusted for birth year and sex in Cox proportional hazards model.
Figure 2—figure supplement 2
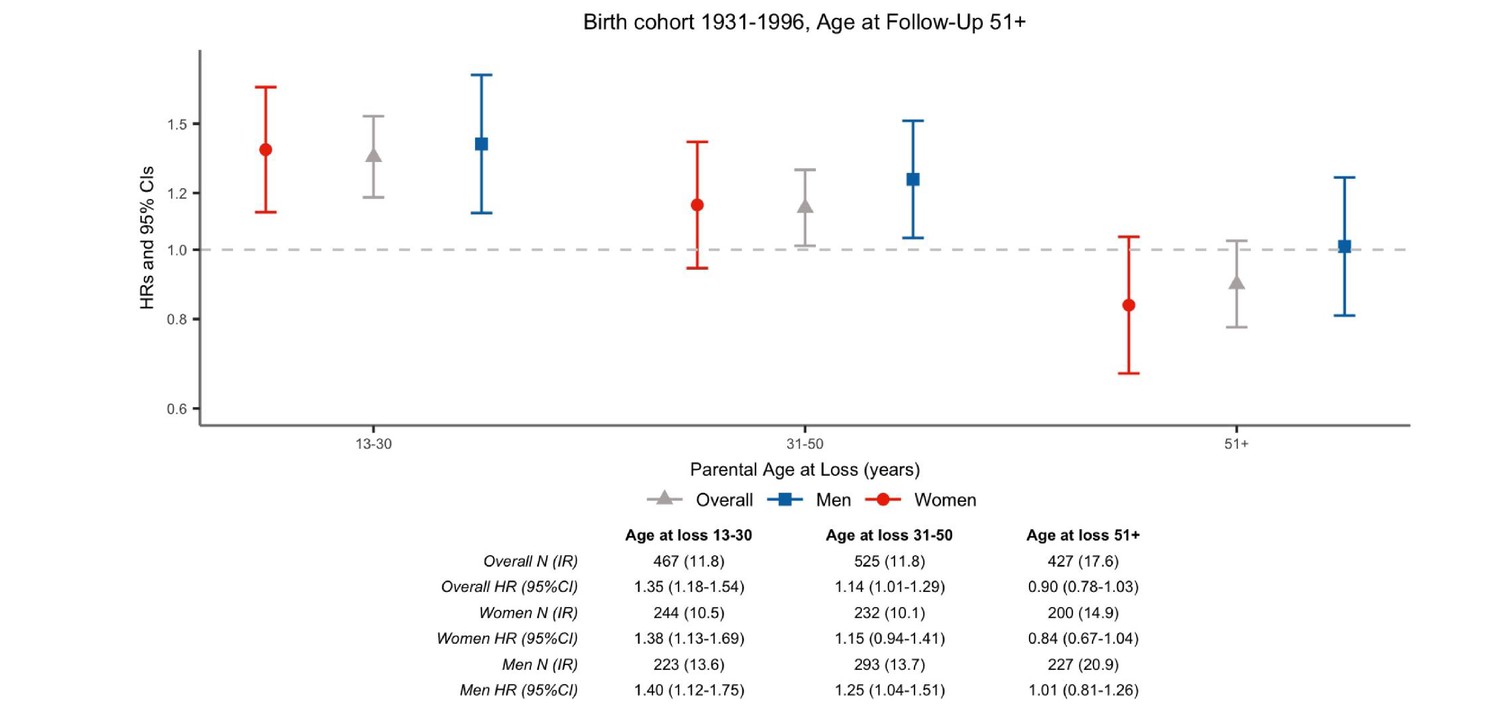
Hazard ratios (HRs) and 95% confidence intervals (CIs) of parental mortality after loss of a child among parents born during 1931–1996 and followed from age 51 onward, by age at loss, in the sibling cohort.
We stratified by sibling groups and additionally adjusted for birth year and sex in Cox proportional hazards model.
Figure 2—figure supplement 3

Hazard ratios (HRs) and 95% confidence intervals (CIs) of parental mortality after loss of a child, by age bands at follow-up (age 14–50 and 51+) and birth cohorts (every 20 years until 1900, 1901–1930, and 1931–1996), among the siblings born 5 years before or after the index parents.
We stratified on sibling groups and additionally adjusted for birth year and sex in Cox proportional hazards model. IR, incidence rate, per 1000 person-years.
Figure 2—figure supplement 4

Hazard ratios (HRs) and 95% confidence intervals (CIs) of parental mortality after loss of a child, by age bands at follow-up (age 14–50 and 51+) and birth cohorts (every 20 years until 1900, 1901–1930, and 1931–1996), by restricting to same-sex siblings.
We stratified by sibling groups and additionally adjusted for birth year and number of alive children at the matching in Cox proportional hazards model. IR, incidence rate, per 1000 person-years.
Figure 2—figure supplement 5

Hazard ratios (HRs) and 95% confidence intervals (CIs) of parental mortality after loss of a child, by age bands at follow-up (age 14–50 and 51+) and birth cohorts (every 20 years until 1900, 1901–1930, and 1931–1996), in the sibling cohort with additional adjustment for number of alive children at matching.
We stratified by sibling groups and additionally adjusted for birth year, sex, and number of alive children at the matching in Cox proportional hazards model. IR, incidence rate, per 1000 person-years.
Figure 2—figure supplement 6
Hazard ratios (HRs) and 95% confidence intervals (CIs) of parental mortality after loss of a child, by age bands at follow-up (age 14–50 and 51+) and birth cohorts (every 20 years until 1900, 1901–1930, and 1931–1996), by restricting to unexposed siblings who were already parents at the same age as when the index parents lost a child.
We stratified by sibling groups and additionally adjusted for birth year, sex, and number of alive children at the matching in Cox proportional hazards model. IR, incidence rate, per 1000 person-years.
Tables
Table 1
Descriptive characteristics of parents born from 1800 to 1996 who lost a child by death during their life course, and their siblings who did not lose a child, N (%).
https://doi.org/10.7554/eLife.43476.002| Parents with loss | Parents without loss | P for difference | |
|---|---|---|---|
| Total number | 47 711 | 126 342 | - |
| Sex | |||
| Female | 25 125 (53) | 63 328 (50) | 3.65e-21 |
| Male | 22 586 (47) | 63 014 (50) | |
| Total number of children | 276 819 | 531 736 | - |
| Number of children, mean (SD) | 5.80 (3.19) | 4.21 (2.71) | 0 |
| Number of children | |||
| 1 | 1775 (4) | 16 012 (13) | 0 |
| 2–4 | 17 766 (37) | 64 908 (51) | |
| 5–9 | 21 947 (46) | 39 019 (31) | |
| 10+ | 6223 (13) | 6403 (5) | |
| Age at first child birth, mean (SD) | 25.55 (5.09) | 27.16 (6.11) | 0 |
| Age at matching*, mean (SD) | 38.76 (15.39) | 37.35 (14.60) | 8.84e-67 |
| Age at matching* | |||
| 13–30 | 17 963 (38) | 52 434 (42) | 1.84e-70 |
| 31–50 | 19 980 (42) | 51 348 (41) | |
| 51–75 | 8123 (17) | 19 480 (15) | |
| 76+ | 1645 (3) | 3080 (2) | |
| Age of deceased child, mean (SD) | 9.44 (14.95) | - | - |
| Length of follow-up, mean (SD) | 31.79 (18.36) | 25.45 (18.03) | 0 |
| Age at death | 70.81 (16.66) | 71.80 (16.20) | 1.40e-21 |
-
* Age at loss of first child for parents who lost a child; the same age for their siblings who did not lose a child or the age when the siblings became parents, whichever came later.
Table 2
Hazard ratios (HRs) and 95% confidence intervals (CIs) of premature mortality after loss of a child among young parents followed up to age 50, by time since loss and demographic characteristics, compared to their siblings.
We stratified by sibling groups and additionally adjusted for birth year and sex. IR, incidence rate, per 1000 person-years.
| Overall | Women | Men | ||||
|---|---|---|---|---|---|---|
| N (Crude IR) | HR (95% CI) | N (Crude IR) | HR (95% CI) | N (Crude IR) | HR (95% CI) | |
| Time since loss | ||||||
| 0–4 years | 1711 (10.2) | 1.19 (1.11–1.27) | 907 (10.3) | 1.52 (1.35–1.71) | 804 (10.0) | 0.96 (0.85–1.07) |
| 0–4 years* | 1595 (9.5) | 1.10 (1.03–1.18) | 832 (9.4) | 1.40 (1.24–1.58) | 763 (9.5) | 0.89 (0.80–1.01) |
| 5–9 years | 1145 (7.9) | 1.13 (1.05–1.23) | 508 (6.5) | 1.22 (1.06–1.41) | 637 (9.5) | 1.02 (0.90–1.16) |
| 10–19 years | 1654 (8.2) | 1.15 (1.07–1.23) | 764 (6.7) | 1.33 (1.18–1.50) | 890 (10.0) | 1.09 (0.97–1.22) |
| 20–39 years | 388 (6.2) | 1.12 (0.98–1.29) | 214 (5.3) | 1.28 (1.03–1.59) | 174 (7.9) | 1.16 (0.91–1.48) |
| Child’s age at loss | ||||||
| 0 | 3357 (8.9) | 1.14 (1.08–1.20) | 1672 (8.0) | 1.43 (1.31–1.57) | 1685 (9.9) | 0.94 (0.86–1.03) |
| 1–5 | 2016 (9.4) | 1.16 (1.09–1.24) | 964 (8.1) | 1.26 (1.13–1.41) | 1052 (11.0) | 1.12 (1.00–1.25) |
| 6–17 | 269 (6.7) | 1.17 (0.99–1.38) | 130 (5.6) | 1.31 (0.99–1.74) | 139 (8.3) | 1.32 (1.00–1.73) |
| 18+ | 66 (5.4) | 1.44 (1.05–1.97) | 22 (2.8) | 0.96 (0.54–1.71) | 44 (10.3) | 1.99 (1.24–3.20) |
| Number of alive children at loss | ||||||
| 0 | 2390 (9.7) | 1.20 (1.13–1.28) | 1135 (8.3) | 1.39 (1.24–1.56) | 1255 (11.4) | 1.15 (1.04–1.28) |
| 1–3 | 2793 (8.4) | 1.12 (1.06–1.18) | 1379 (7.5) | 1.37 (1.25–1.51) | 1414 (9.5) | 0.98 (0.89–1.07) |
| 4+ | 525 (8.1) | 1.12 (0.99–1.26) | 274 (7.3) | 1.18 (0.97–1.44) | 251 (9.1) | 0.94 (0.77–1.14) |
| Sex of the lost child | ||||||
| Female | 3075 (8.6) | 1.14 (1.08–1.20) | 1483 (7.5) | 1.29 (1.17–1.41) | 1592 (10.0) | 1.06 (0.97–1.16) |
| Male | 2633 (9.2) | 1.17 (1.10–1.24) | 1305 (8.2) | 1.44 (1.30–1.59) | 1328 (10.4) | 1.01 (0.92–1.11) |
| Age at loss | ||||||
| 13–30 | 3459 (8.5) | 1.13 (1.08–1.19) | 1815 (7.5) | 1.33 (1.22–1.45) | 1644 (10.1) | 1.02 (0.93–1.12) |
| 31–40 | 1945 (9.5) | 1.19 (1.12–1.27) | 873 (8.7) | 1.43 (1.27–1.61) | 1072 (10.2) | 1.04 (0.93–1.15) |
| 41–50 | 304 (8.7) | 1.14 (0.98–1.32) | 100 (6.1) | 1.11 (0.81–1.52) | 204 (11.0) | 1.12 (0.90–1.40) |
| Age at first childbirth | ||||||
| 13–21 | 988 (6.0) | 1.20 (1.09–1.32) | 653 (5.4) | 1.29 (1.13–1.47) | 335 (7.7) | 1.15 (0.95–1.40) |
| 22–24 | 1507 (8.5) | 1.09 (1.01–1.17) | 829 (8.0) | 1.27 (1.12–1.44) | 678 (9.2) | 0.97 (0.84–1.11) |
| 25–27 | 1520 (10.3) | 1.20 (1.11–1.30) | 665 (9.5) | 1.35 (1.17–1.56) | 855 (11.1) | 1.08 (0.96–1.23) |
| 28+ | 1693 (10.8) | 1.16 (1.08–1.24) | 641 (9.9) | 1.55 (1.34–1.80) | 1052 (11.3) | 1.01 (0.91–1.13) |
-
* A sensitivity analysis excluding parents dying on the same day as their child.
Additional files
-
Source code 1
R script used for the primary analyses.
- https://doi.org/10.7554/eLife.43476.014
-
Supplementary file 1
Descriptive characteristics of parents born from 1800 to 1996 who lost a child by birth cohorts in the population-based matched cohort, N (%).
- https://doi.org/10.7554/eLife.43476.015
-
Transparent reporting form
- https://doi.org/10.7554/eLife.43476.016
Download links
A two-part list of links to download the article, or parts of the article, in various formats.
Downloads (link to download the article as PDF)
Open citations (links to open the citations from this article in various online reference manager services)
Cite this article (links to download the citations from this article in formats compatible with various reference manager tools)
The mother’s risk of premature death after child loss across two centuries
eLife 8:e43476.
https://doi.org/10.7554/eLife.43476


