Using parasite genetic and human mobility data to infer local and cross-border malaria connectivity in Southern Africa
- University of California, San Francisco, United States
- Johns Hopkins Bloomberg School of Public Health, United States
- University of Namibia, Namibia
- University of Southampton, United Kingdom
- Clinton Health Access Initiative, United States
- University of Texas Southwestern Medical Center, United States
- UCSF Benioff Children's Hospital, United States
- University of Washington, United States
- Chan Zuckerberg Biohub, United States
Figures
Figure 1 with 1 supplement
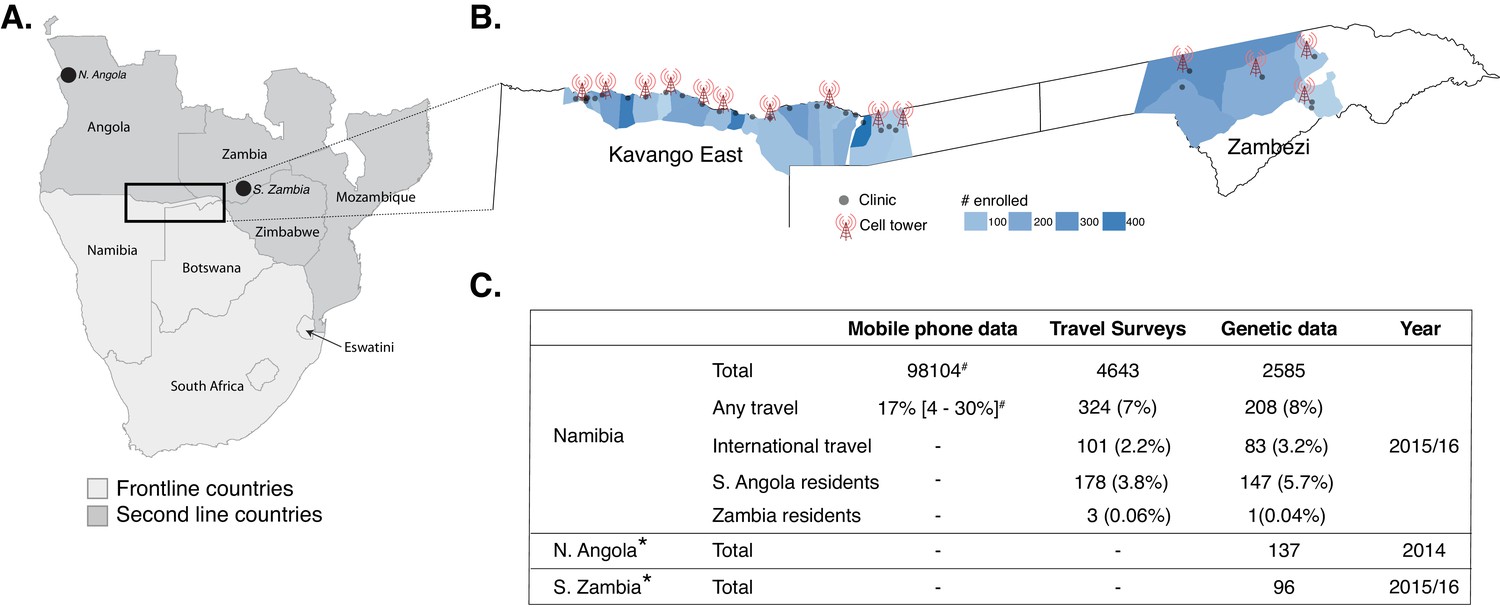
Study area and summary of data analyzed.
(A) Samples were analyzed from Namibia, northern Angola and southern Zambia (black points and box) from the Elimination 8 (E8) region, which is operationally divided into frontline, low-transmission areas (light gray) and second line, higher transmission areas (dark gray). (B) In Namibia, malaria cases from 29 health facilities in two regions (Kavango East and Zambezi) were enrolled and genotyping data generated on a subset. The locations of the health facilities are shown in gray dots and the sample sizes are shown in blue for the catchment areas of each health facility (Alegana et al., 2016). Data from mobile phone subscribers at 14 cell towers in the study area were used to estimate population mobility. (C) Summary of mobile phone, travel survey, and genetic data analyzed. *Additional genotyping data from Northern Angola and Southern Zambia were included in the analyses. #Number of mobile phone subscribers in the study area and percent time spent outside of the primary cell tower.
Figure 1—figure supplement 1
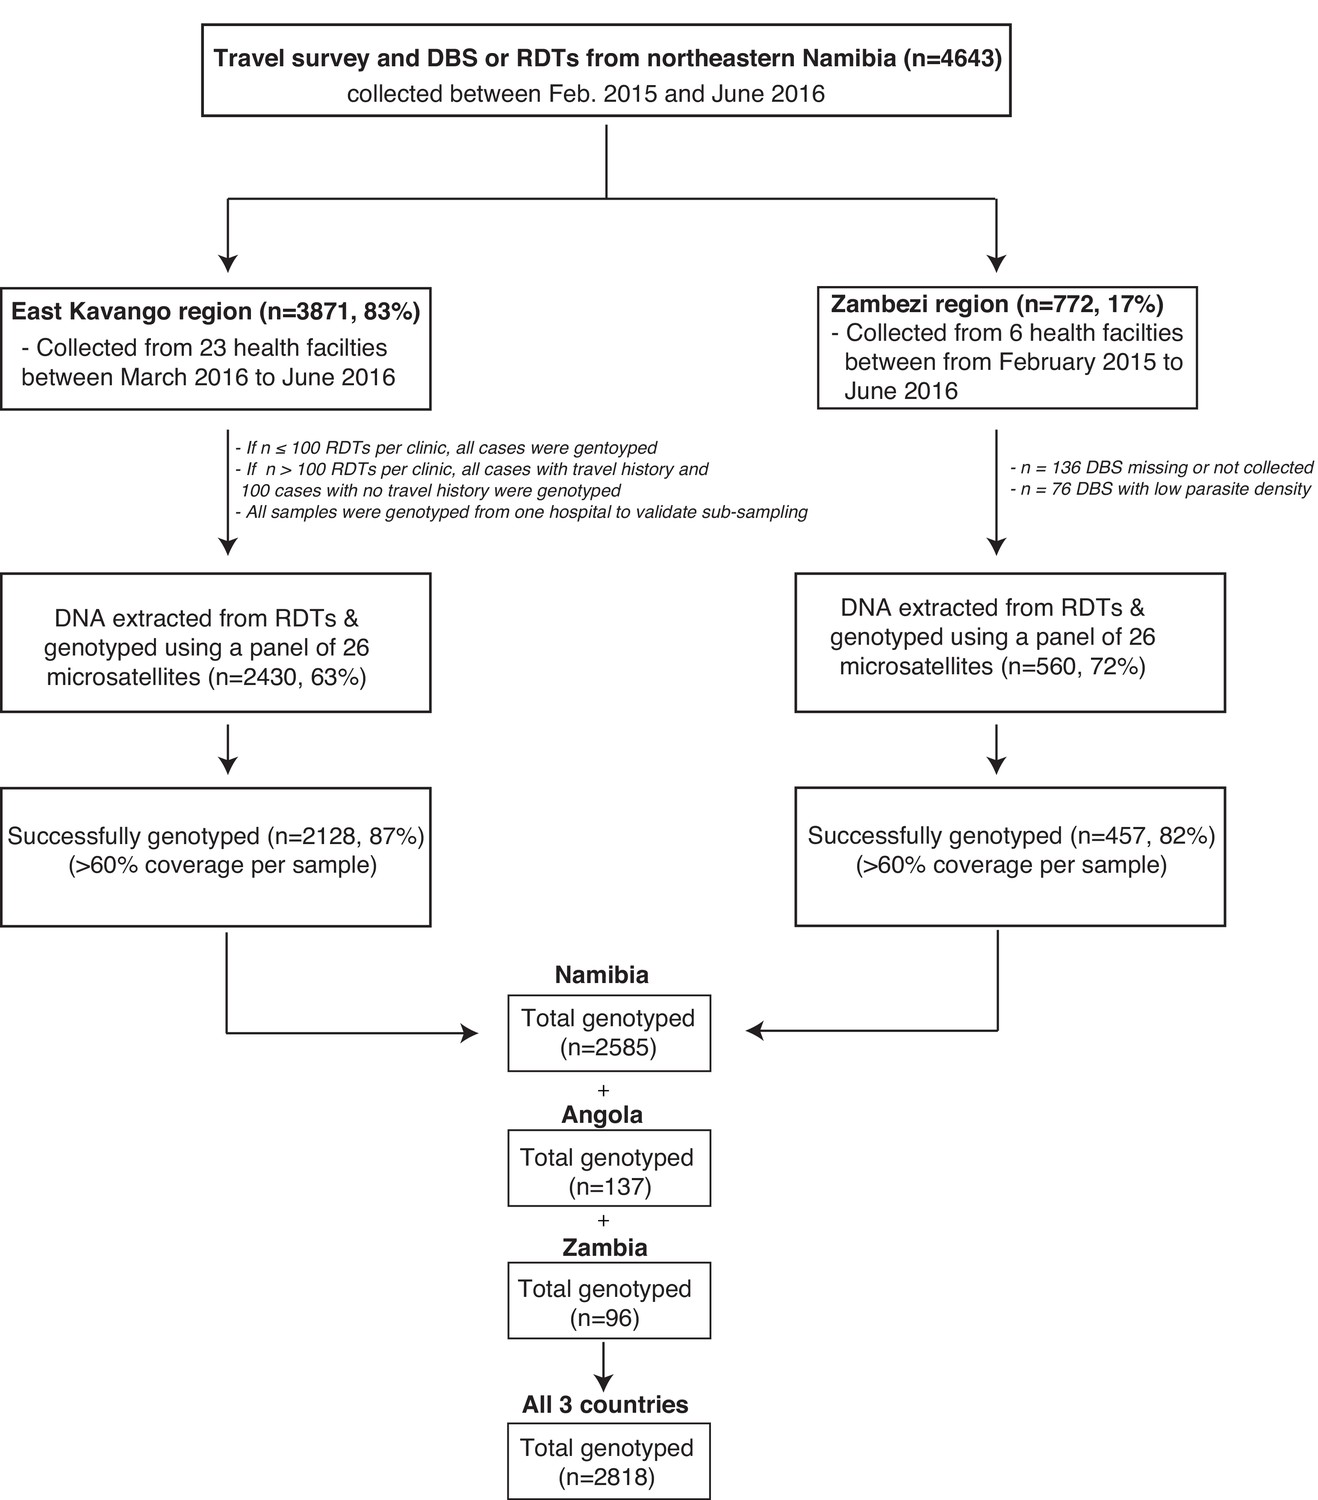
Flow chart of samples collected and genotyped.
Abbreviations are as follows: n = sample size; DBS = dried blood spot and RDT = rapid diagnostic test.
Figure 2 with 4 supplements
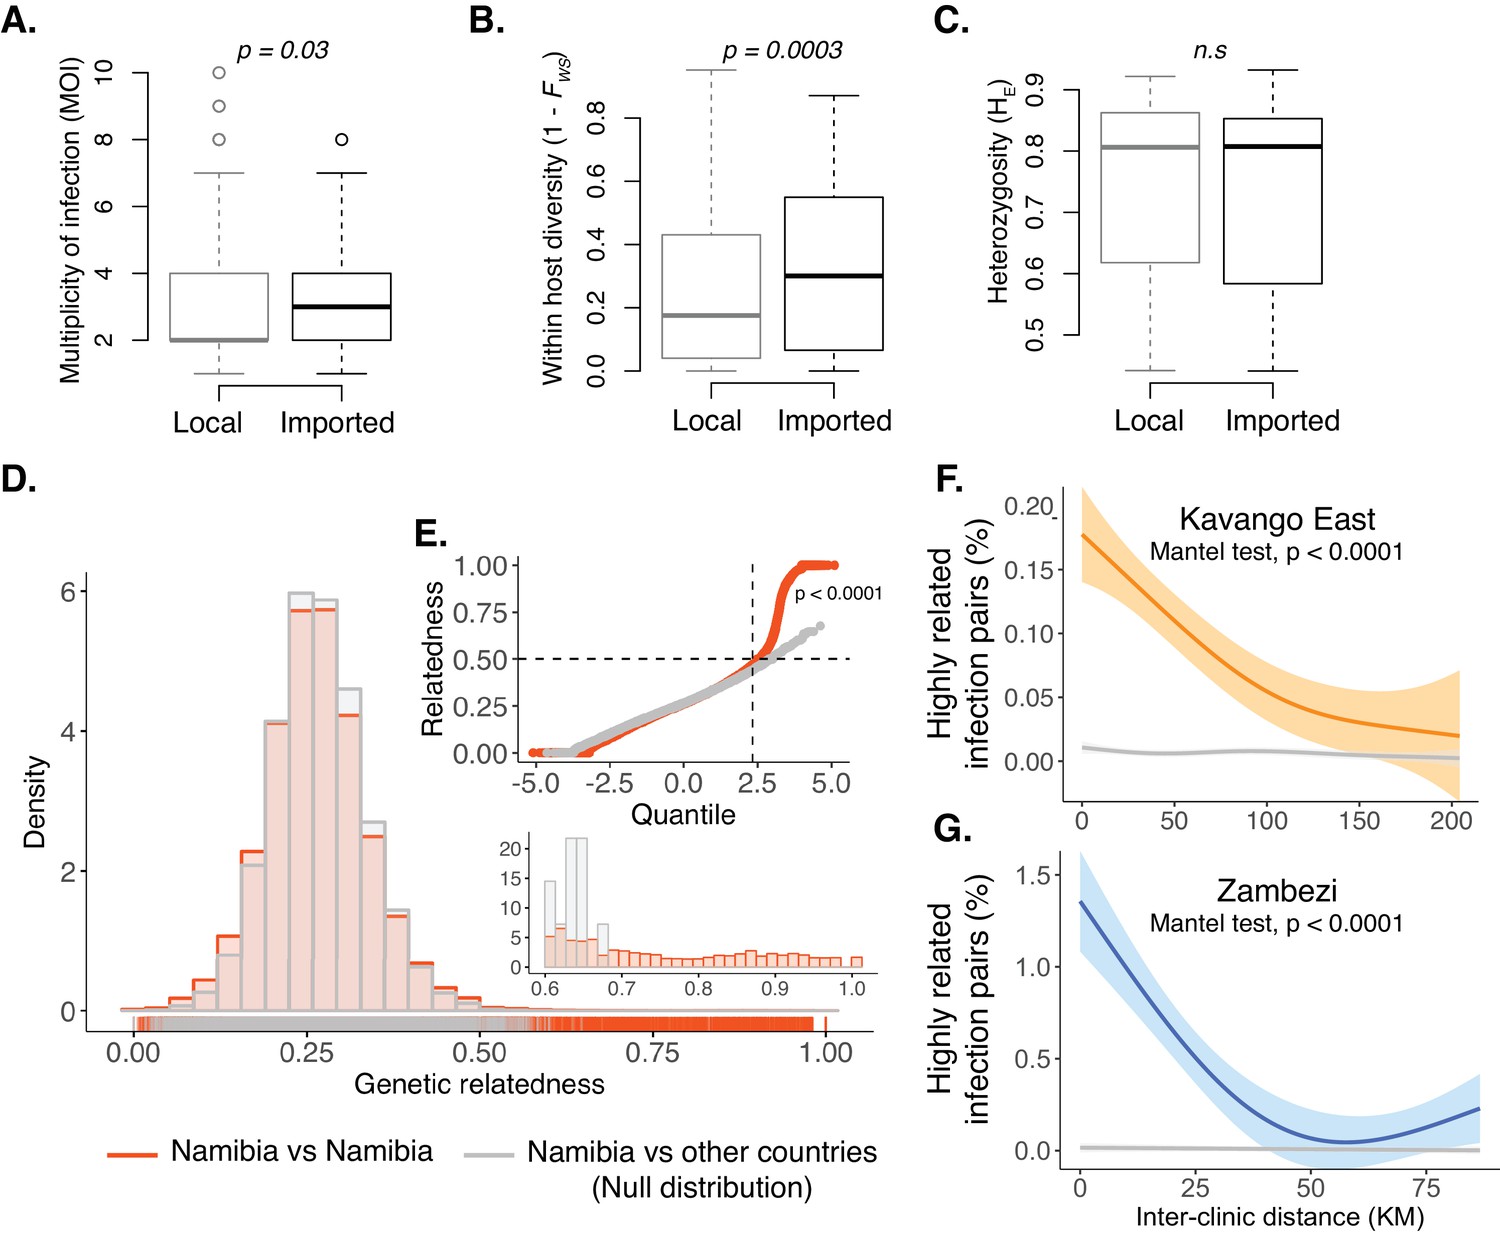
Within-host diversity, heterozygosity and genetic relatedness.
(A) Multiplicity of infection (MOI); (B) within-host diversity index (1-FWS) and (C) population level genetic diversity (heterozygosity, HE) compared between potentially imported samples (black) and those without any evidence of being imported (gray). FWS is analogous to an inbreeding coefficient. A 1-FWS value shows outbreeding and a value of 0 indicates a single clone infection. Population level genetic diversity was measured as the distribution of heterozygosity in 26 microsatellites. (D) Pairwise genetic relatedness between samples was calculated using the identity by state (IBS) metric including all alleles detected in polyclonal samples. Highly related infection pairs were identified based on a null distribution, pairwise relatedness between samples from Namibia and other countries from West, Central and East Africa. The inset shows a zoomed in histogram of pairwise genetic relatedness between samples with genetic relatedness ≥0.6. (E) The quantile plot indicates the divergence of the distributions at genetic relatedness ≥0.5 (n = 20,988 pair-wise comparisons between infections collected from Namibia). The x-axis is the z-score values of the population quantiles of the distributions. The dashed vertical line corresponds to the 99% percentile of the distribution. (F and G) The relationship between highly related infections (i.e. number of pairs with a genetic relatedness ≥0.6/ total number of pairs) and the inter-clinic distance in Kavango (F) and Zambezi (G). Geographically adjacent infections were more highly related than those at further distances. The shaded areas show the 95% confidence interval. The gray line indicates a null distribution created by bootstrapping (n = 1000) over the inter-clinic distance.
Figure 2—figure supplement 1
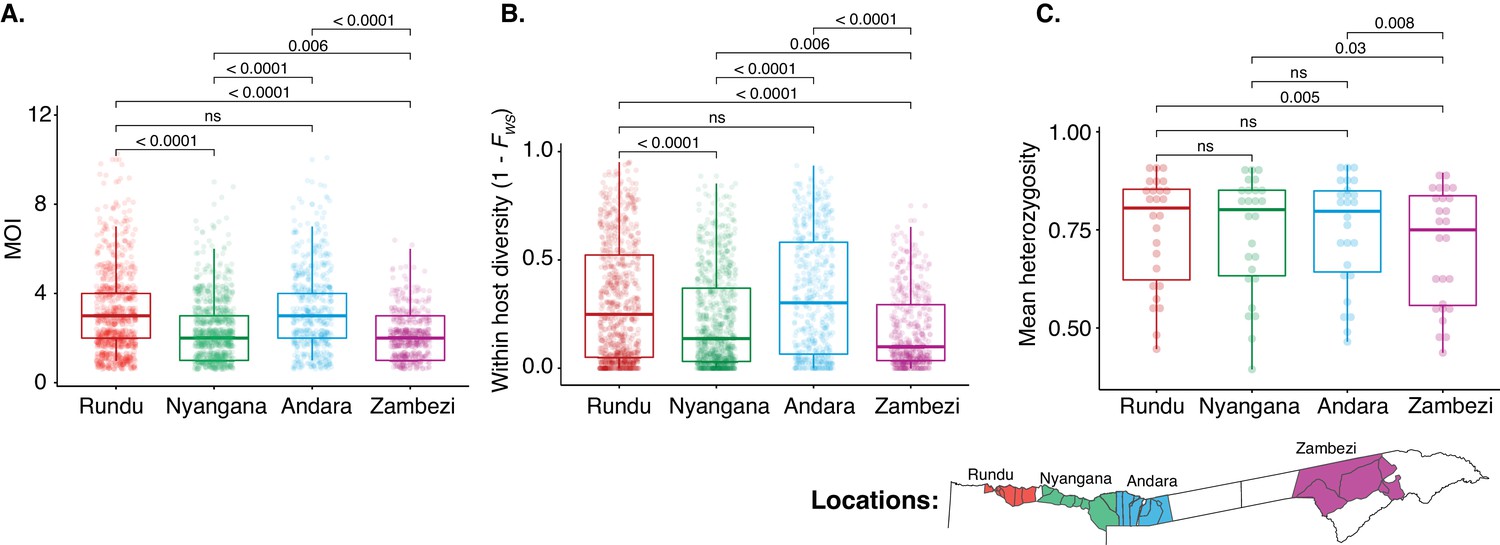
Within-host and population diversity by health district.
(A) Multiplicity of infection. (B) Within-host diversity index (1-FWS). 1-FWS value shows outbreeding and a value of 0 indicates a perfect clone. (C) Population level genetic diversity measured as the distribution of heterozygosity in 26 microsatellites. Bonferroni adjusted pairwise p-values are indicated.
Figure 2—figure supplement 2
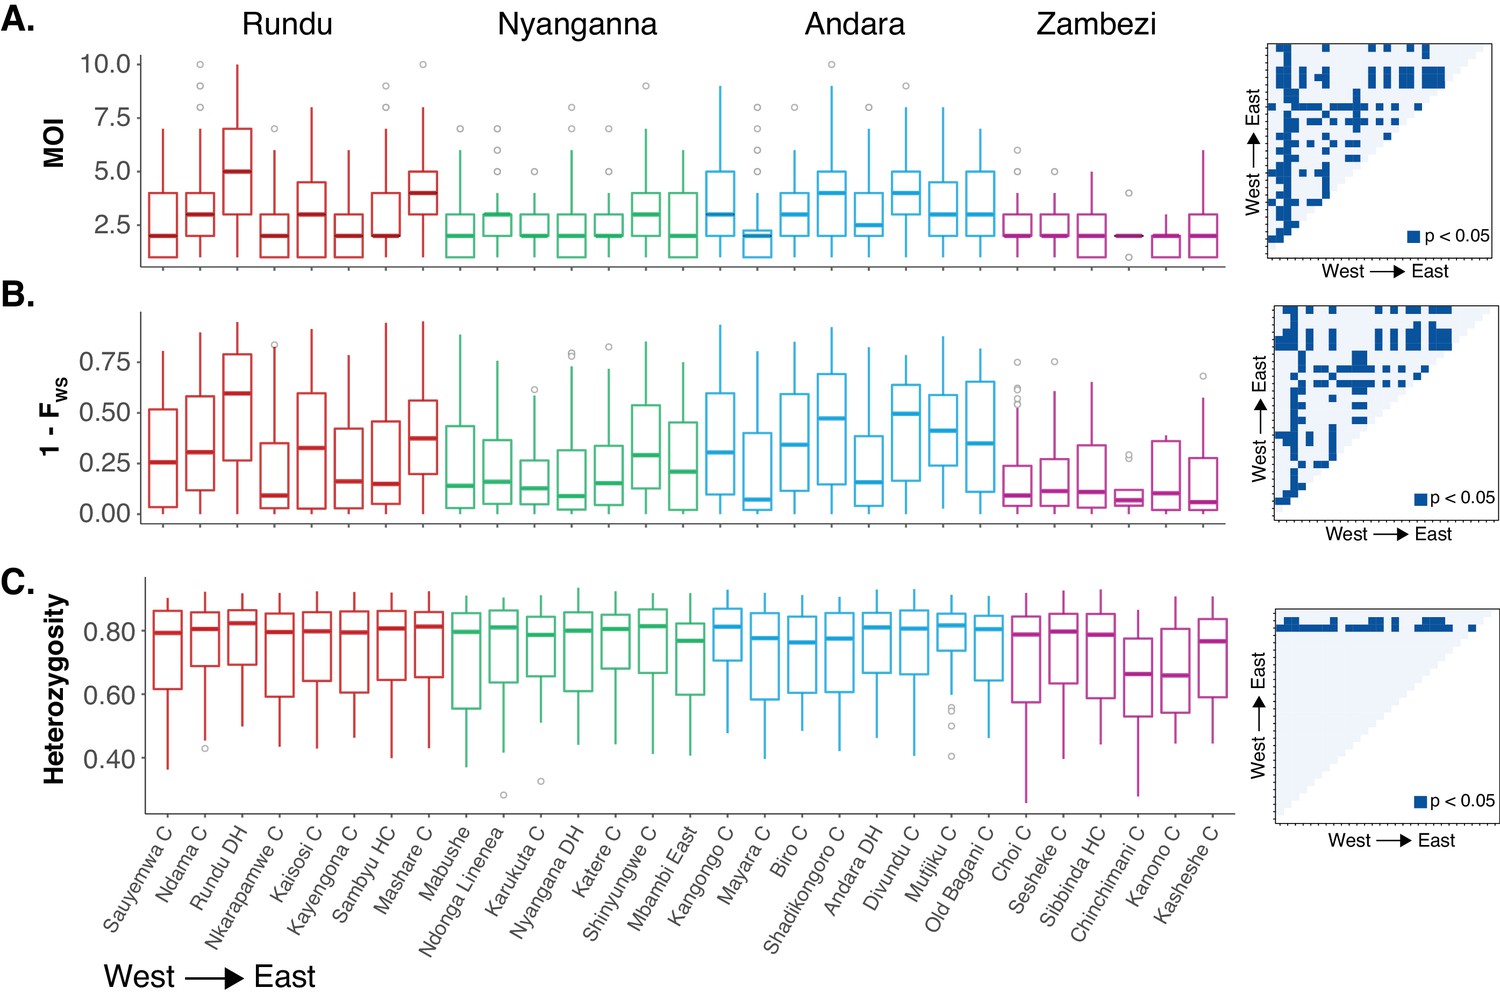
Within-host and population diversity by health facilities.
(A) Multiplicity of infection. (B) Within-host diversity index (1-FWS). 1-FWS value shows outbreeding and a value of 0 indicates a perfect clone. (C) Population level genetic diversity measured as the distribution of heterozygosity in 26 microsatellites. Matrix of Bonferroni adjusted pairwise p-values are indicated on the right for each panel.
Figure 2—figure supplement 3
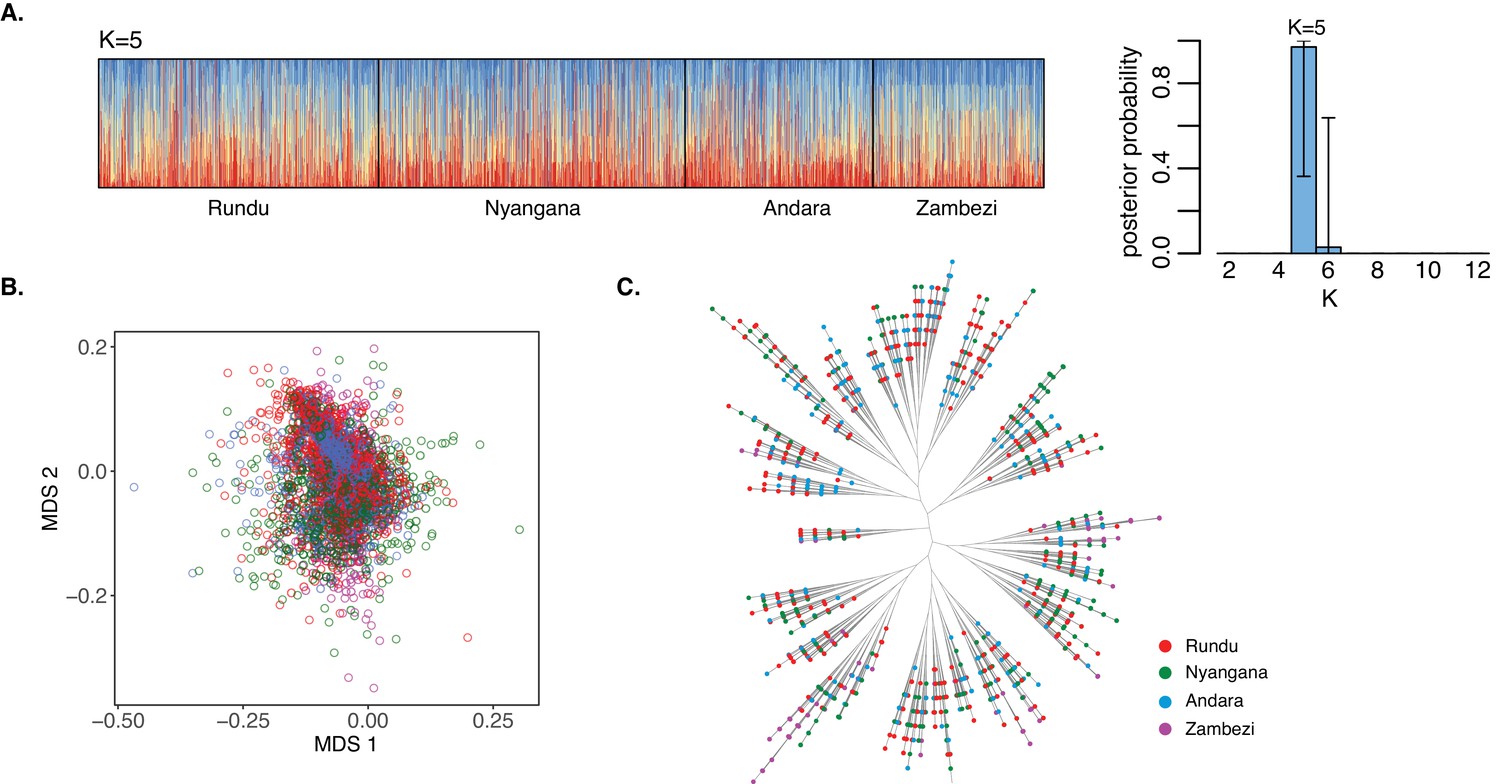
Existing methods reveal no parasite population structure in northern Namibia.
(A) Population cluster analysis of P. falciparum microsatellite haplotypes from dominant alleles in northern Namibia. Individual ancestry coefficients and optimum K value (K=5) is shown as inferred by MavericK (Verity and Nichols, 2016). Each vertical bar represents an individual haplotype and its membership to the five populations were defined by the different colors. Black borders separate the four districts. (B) Multidimensional scaling and (C) phylogenetic tree of P. falciparum infections were computed using pairwise genetic distance (1-IBS). Dots indicate individual infections and colors indicate the four health districts of northern Namibia.
Figure 2—figure supplement 4
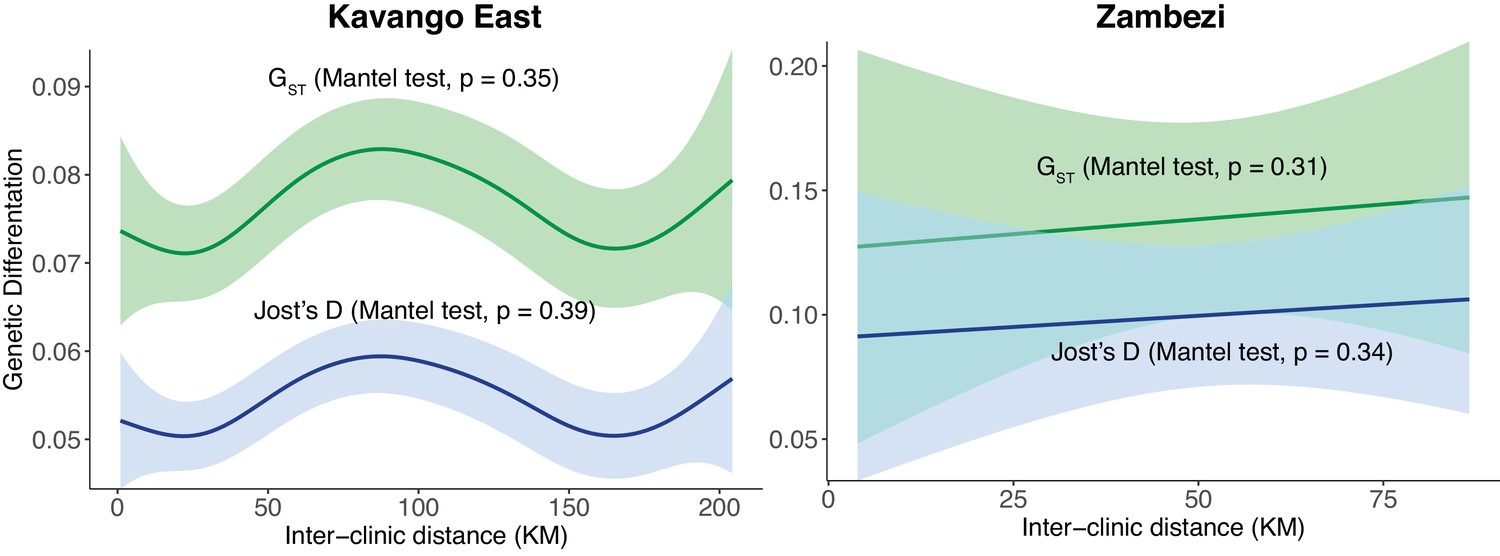
Relationship between pairwise genetic differentiation and inter-clinic distance between health facilities in two regions of northern Namibia.
Pairwise differentiation was measured using GST and Jost’s D from n = 23 clinics in Kavango East and n = 6 clinics in Zambezi.
Figure 3

Local genetic connectivity in northeastern Namibia.
(A) Proportion of highly related infections between 29 health facilities in Kavango East and Zambezi regions is shown. The heat map shows 406 pairwise proportions of highly related infections between health facilities. Highly related values are shown in color, all other values are shown in gray. Top 10% of the pairwise connections are shown on the map of the study area. Highly related connections were determined after correcting for multiple comparisons using a Bonferroni correction. The boxplot illustrates that infections within Zambezi were more related to each other than to Kavango East. (B) Health facilities in Kavango East and Zambezi are shown from west to east. The connectivity score (top heatmap) ranges from 0 to 1, where a score of 1 indicates a health facility is highly connected to all other health facilities in the region. The proportions of highly related infections among the health facilities is shown to illustrate the strength of these connections (boxplot). Health facilities with the highest connectivity are indicated by a star (Nkarapamwe, Sambyu, Nyangana, and Karukuta health facilities in Kavango East and Choi and Sesheke health facilities in Zambezi). Scatterplot shows comparison of within region and between region connectivity. Boxplots and points are colored to indicate the geographic location of the health facility catchment on the inset map.
-
Figure 3—source data 1
Proportion of highly related infections and connectivity scores by health facility.
- https://doi.org/10.7554/eLife.43510.011
Figure 4 with 2 supplements
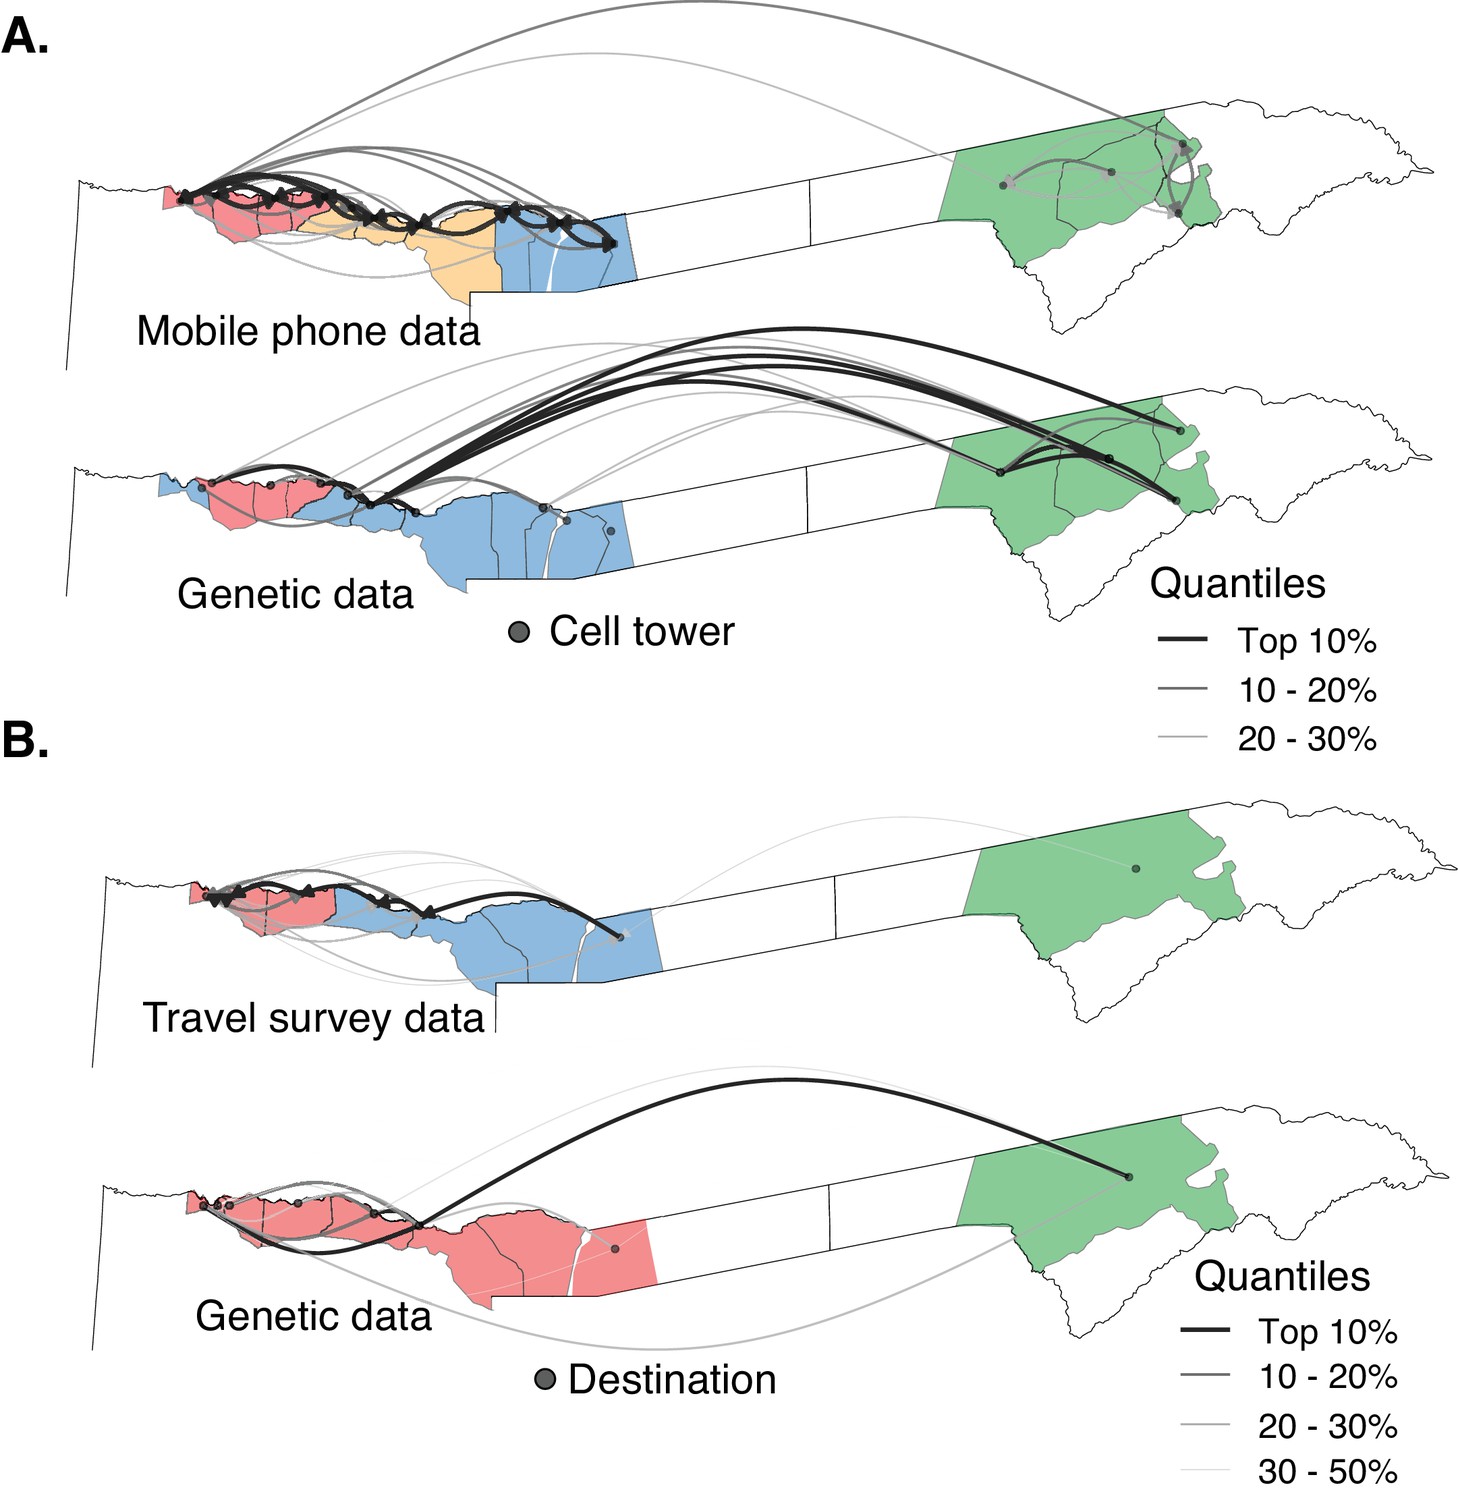
The relationship between parasite connectivity estimated from the two sources of mobility data and parasite genetic data.
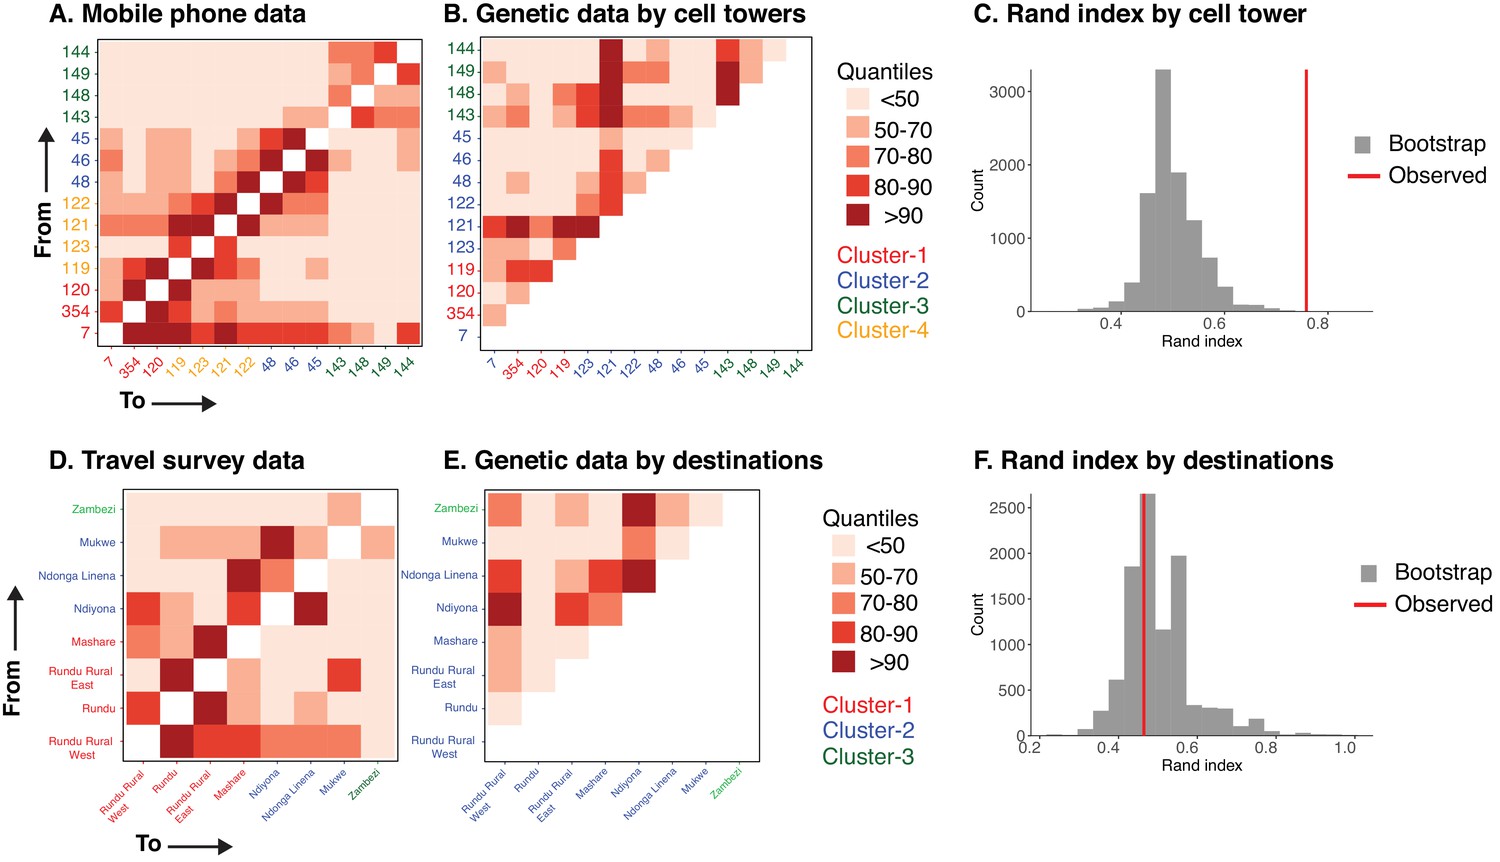
Mobility-based (top row) and parasite genetic (bottom row) clusters were identified using mobility estimated from the (A) mobile phone data and (B) travel survey data and genetic data aggregated to the level of the respective mobility data. The top routes of mixing by human mobility and connectivity by parasites genetic data are shown. For the genetic data, highly related connections are shown. Catchment areas are colored with identified clusters from each data type (see Figure 4—figure supplement 2). Genetic data identified a greater number of long distance connections than either estimate from human mobility data.
-
Figure 4—source data 1
The relationship between parasite connectivity estimated from the two sources of mobility data (i.e. mobile phone and travel history) and parasite genetic data.
- https://doi.org/10.7554/eLife.43510.015
Figure 4—figure supplement 1

Human mobility and parasite mixing based on travel survey and mobile phone data in two regions of northern Namibia.
(A) Using the travel survey data the proportion of time spent within the region and internationally was calculated. Similarly, the proportion of time spent at the primary mobile phone tower or at other mobile phone towers within the study area was calculated using the mobile phone data. Values are shown for Kavango (dark gray) and Zambezi (white). (B) The time spent values were scaled by the incidence ratio to calculate a proportion of time at risk or parasite mixing contribution with results similar to the time spent values.
Figure 4—figure supplement 2
The relationship between parasite connectivity estimated from human mobility and parasites genetic data sources.
(A) Importation estimates from mobile phone data scaled by incidence. Connectivity between 14 towers is shown. Axes are colored by cluster identified by hierarchical modularity maximization algorithm. (B) Proportion of highly related infections aggregated by 14 cell towers. (C) Rand index showing agreement between clusters from mobile phone and genetic data. Vertical line (black) shows the observed Rand index and the histogram shows the expected distribution by random chance (gray). (D) Importation estimates from travel survey data scaled by incidence. Connectivity between eight destination locations is shown. (E) Proportion of highly related infections aggregated by eight destination locations. (F) Rand index showing agreement between clusters from importation estimates from travel survey and genetic data. Vertical line (black) shows the observed Rand index and the histogram shows the expected distribution by random chance (gray). Since, mobile phone and travel survey data are directional, the connectivity matrix is shown for both directions (eg. Mobility from tower # 7 to 354 and vice versa).
Figure 5
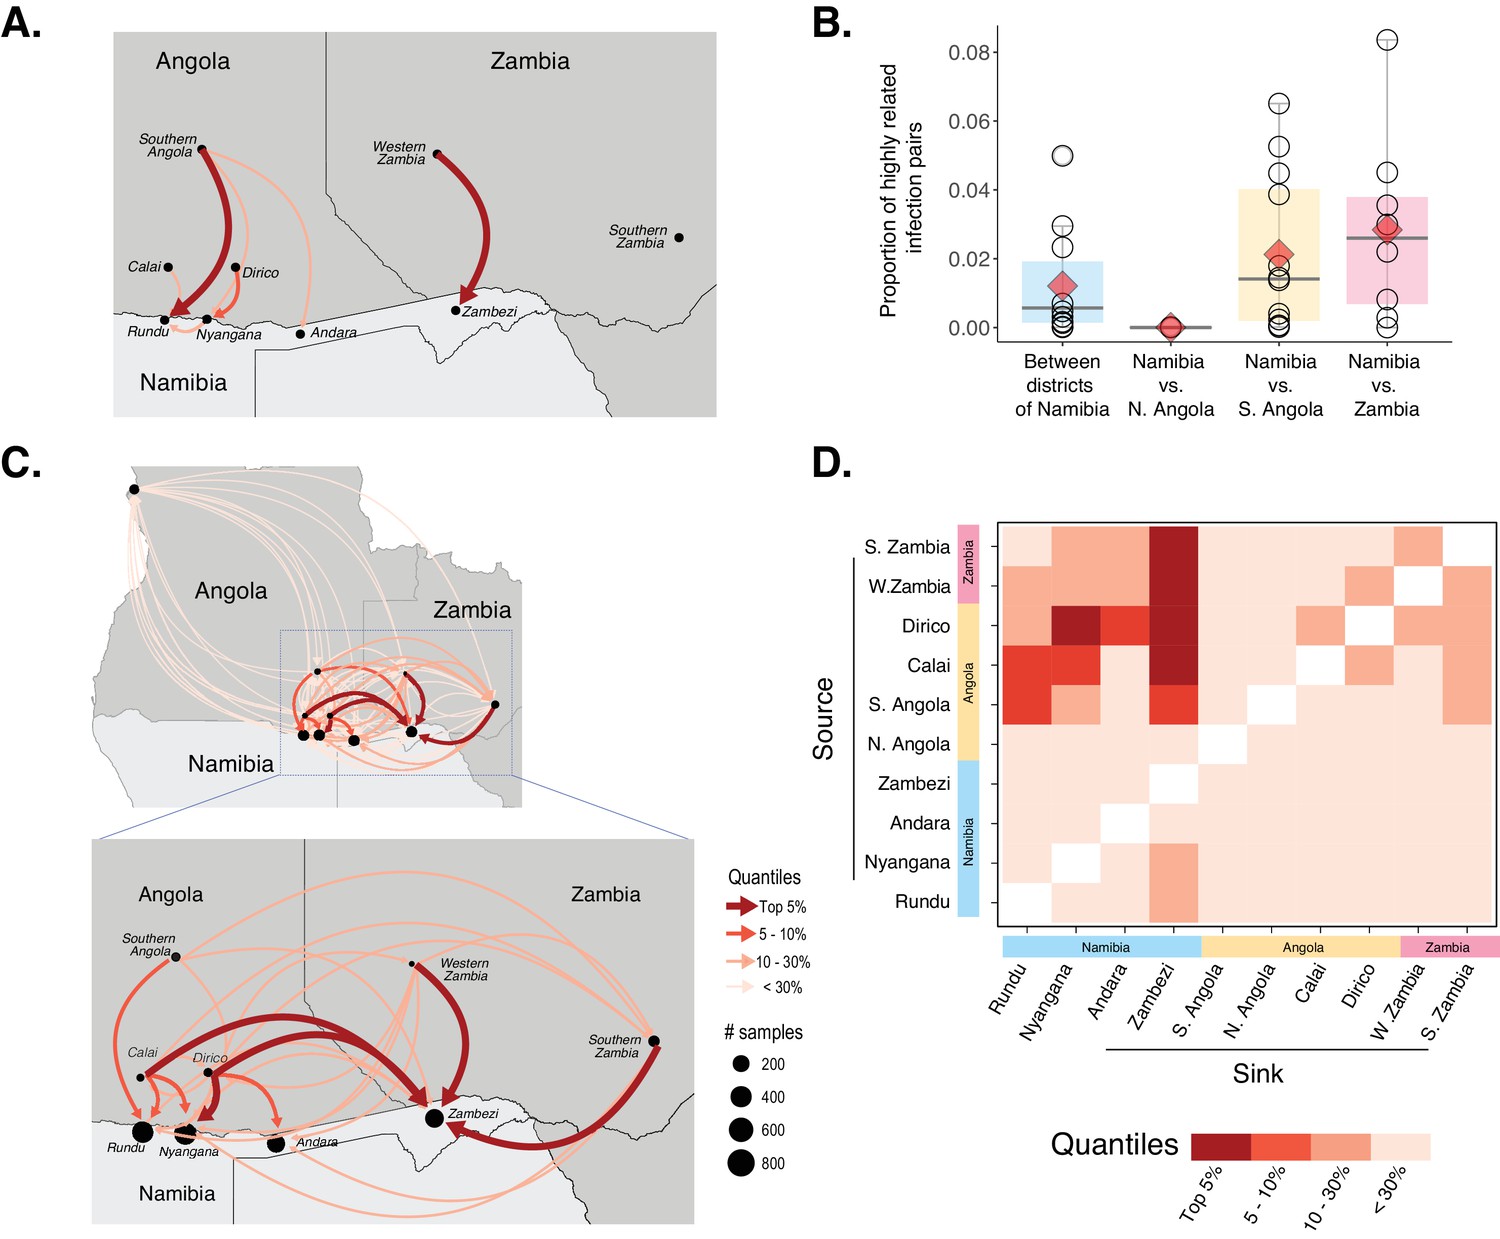
Cross-border connectivity estimated from genetic and travel survey data.
(A) Cross-border connectivity estimated from travel survey data. Importation was estimated from the proportion of individuals who reported travel to each destination weighted by the ratio of malaria incidence from local health system data at a destination to the residence location (see Materials and methods). The importation estimate was visualized on the map and colored by quantiles (lowest values - light pink, highest values - dark red). The arrows indicate the direction of malaria importation. Three individuals reported travel beyond the scope of the map: two individuals, from Andara and Zambezi, reported travel to northern Angola and one individual from Zambezi reported travel to Northern Province of Zambia. (B) Samples across Namibia, Angola, and Zambia were genotyped and the proportion of highly related infections are shown between health districts of Namibia and between Namibia and northern Angola, southern Angola and Zambia. The mean proportions of highly related infections are indicated by red diamonds. (C) Importation estimates and directionality of parasite flow was estimated from genetic data along with malaria incidence values in the pairs of locations indicated. Estimates of importations between locations are shown by quantiles (lowest values - light pink, highest values - dark red). The arrows indicate the direction of malaria importation. Estimates of importations were based on the proportion of highly related infections between pairs of location weighed by the ratio of malaria incidence between the two locations (See Materials and methods: Estimates of cross-border importation and connectivity). Locations in Angola are indicated for centroid location of Calai area, Dirico area and the Cuando Cubango province (i.e. southern Angola). For Namibia, centroid locations of the health districts were indicated. For Zambia, centroid locations of Western and Southern provinces are shown. Northern Angola was not strongly related to samples in the study area and corresponding cross-border region, suggesting that parasite flow between southern and northern Angola is less than that between (more geographically proximate) cross-border regions of northern Namibia and southern Angola. (D) Heat map showing sources and sinks in the Namibia-Angola-Zambia block. Within the regional block, locations within Namibia were related to locations across the border, with higher estimated parasite flow to Zambezi from these locations than to Kavango East. Interestingly, locations in Zambezi demonstrated more connectivity to Calai, Dirico, Western and Southern Zambia than locations in Kavango East.
-
Figure 5—source data 1
Importation estimates from genetic data.
- https://doi.org/10.7554/eLife.43510.017
Additional files
-
Supplementary file 1
Microsatellites and associated metadata for 2585 infections genotyped in this study.
- https://doi.org/10.7554/eLife.43510.018
-
Transparent reporting form
- https://doi.org/10.7554/eLife.43510.019
Download links
A two-part list of links to download the article, or parts of the article, in various formats.
Downloads (link to download the article as PDF)
Open citations (links to open the citations from this article in various online reference manager services)
Cite this article (links to download the citations from this article in formats compatible with various reference manager tools)
Using parasite genetic and human mobility data to infer local and cross-border malaria connectivity in Southern Africa
eLife 8:e43510.
https://doi.org/10.7554/eLife.43510


