Comment on 'AIRE-deficient patients harbor unique high-affinity disease-ameliorating autoantibodies'
- Karolinska University Hospital, Karolinska Institutet, Sweden
- Science for Life Laboratory, Uppsala University, Sweden
- National Institute of Allergy and Infectious Diseases, National Institutes of Health, United States
- National Bioinformatics Infrastructure, Sweden
- Karolinska University Hospital, Sweden
- Lund University, Skåne University Hospital, Sweden
- Broad Institute of Harvard, Massachusetts Institute of Technology, United States
- Lund University, Sweden
- Science for Life Laboratory, Karolinska Institutet, Sweden
- Stanford University, United States
- University of California, San Francisco, United States
- University of Bergen, Norway
Figures
Figure 1 with 7 supplements

The statistical analysis used by Meyer et al. is biased towards overestimation of the number of autoantibody signals in the patient group.
(A) We used our previously published proteome array dataset for 51 APS1 patients and 21 healthy controls to reevaluate the autoantigen spectrum in APS1. (B) To first determine if our dataset and the one by Meyer et al. were comparable, we applied the same statistical analysis as in Meyer et al. to identify autoantibody signals among the APS1 patients and healthy controls. Z-scores were calculated for all individuals over all proteins as the number of standard deviations above the mean value, where both mean and standard deviation were calculated based on the 21 healthy controls. Similar to the results by Meyer et al., high-level autoantibody signals (Z > 5) were specially observed among the patients. (C) To next determine whether the difference between patients and controls was true our could be explained by a biased statistical analysis we performed the same analysis in groups of subjects randomly assigned to represent ‘cases’ or ‘controls’. Fifty-one subjects were assigned to represent ‘cases’ and 21 subjects were assigned to represent ‘controls’, and autoantibody cutoffs were calculated based on the ‘controls’. The process was repeated 100 times. High-level autoantibody signals were specifically observed among the subjects assigned to represent ‘cases’. Mean values over the 100 permutations are presented in the table. (D) To determine whether the bias of the statistical analysis was dominating the overall results we applied a reversed cutoff, based on the values obtained for the APS1 patients instead of the healthy controls, to the true groups of patients and controls. The controls now showed high-level autoantibodies against greater number of proteins than the patients. In all panels, the average number of hits per individual for patients and healthy controls and the number of distinct proteins targeted in each group are shown for various Z-score cutoffs. The complexity factor was calculated as the number of distinct proteins divided by number of individuals divided by the average number of proteins per individual. NaN – not a number.
Figure 1—figure supplement 1

Autoantibody signals for interferons in the protein array.
Z-scores were calculated based on the mean and standard deviation of the healthy controls. p=APS1 patients (n = 51), C = controls (n = 21).
Figure 1—figure supplement 2

Simulation where an elevated outlier value at saturation level (65 000 signal units) was introduced in either the APS1 patient group or the control group for the array protein serum albumin.
Z-scores were calculated based on the mean and standard deviation of the healthy controls. p=APS1 patients, C = controls.
Figure 1—figure supplement 3
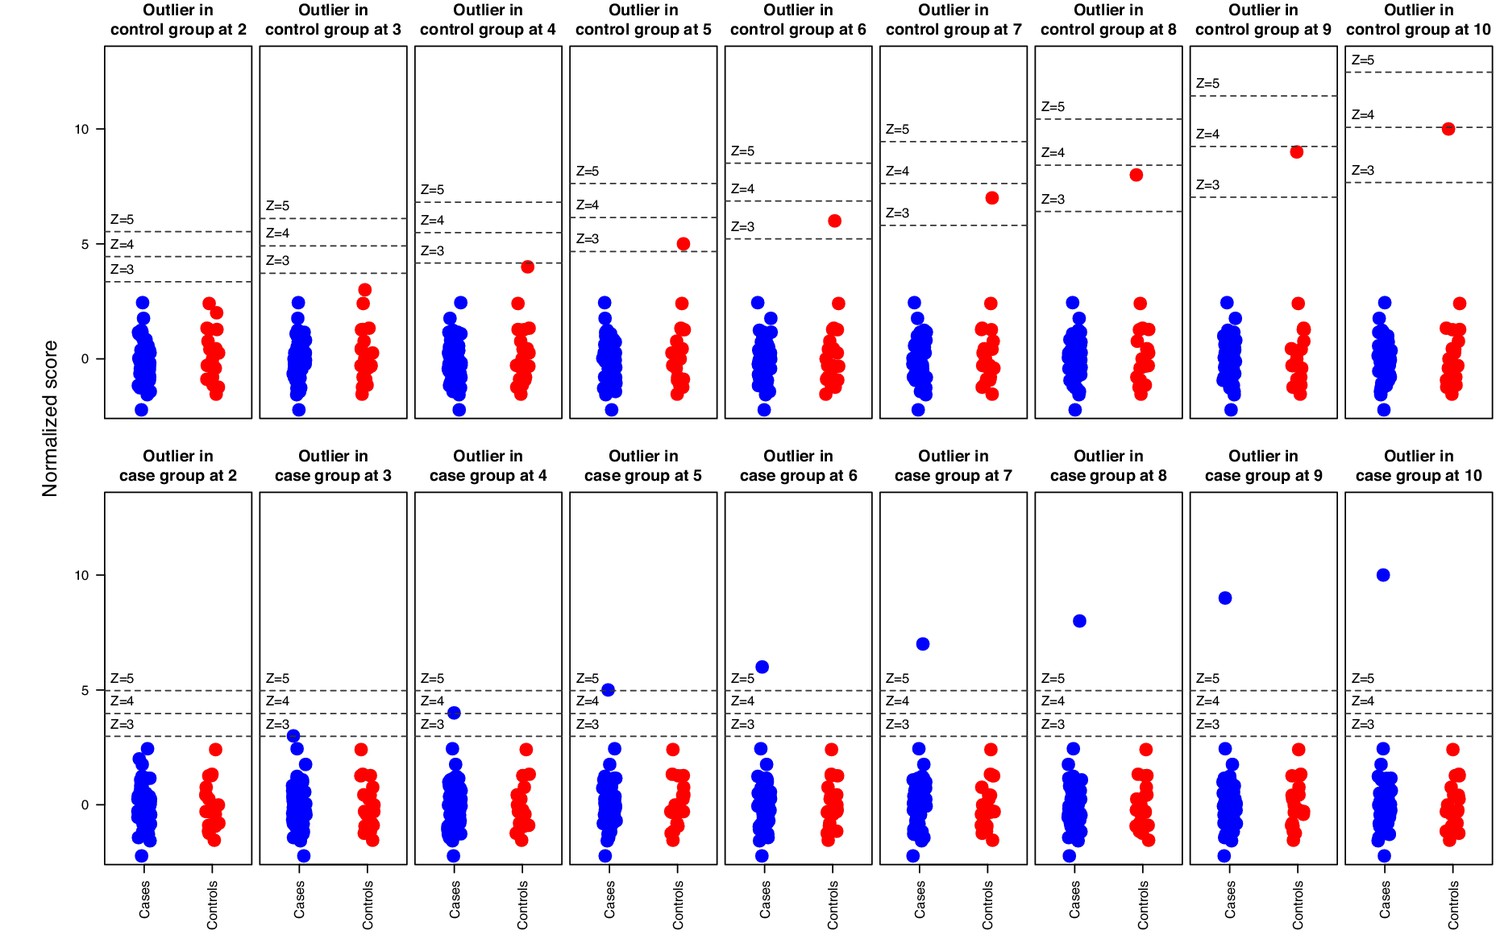
Simulation where increasingly strong outliers (z-score 2, 3, …, 10) were introduced in random normal data for in total 51 ‘cases’ and 21 ‘controls’ respectively, illustrating how the cutoff is affected by elevated outliers in the control group but not by outliers in the case group.
Horizontal bars indicate 3, 4, and five standard deviations above the ‘control’ group mean.
Figure 1—figure supplement 4
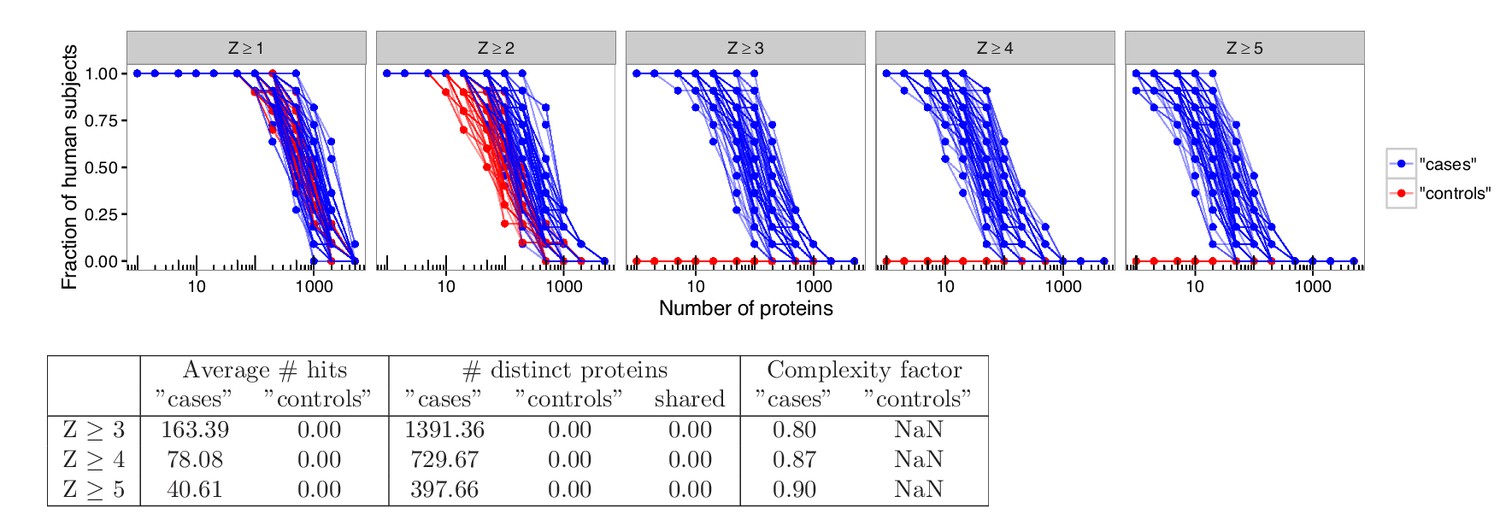
Analyses in permuted data from healthy controls reveal skewing effects in the analysis used by Meyer et al.
To investigate whether there was an inherent skewing effect associated with the statistical method used by Meyer et al., analyses were performed using healthy blood donors randomly assigned to represent ‘cases’ or ‘controls’. Out of 21 healthy blood donors, eleven were assigned to represent ‘cases’ and ten were assigned to represent ‘controls’. Autoantibody cutoffs were calculated based on the mean and average for the blood donors assigned to represent ‘controls’. The process was repeated 100 times. High-level autoantibody signals were specifically detected among the blood donors that were assigned to represent ‘cases’. The average number of hits per individual for patients and healthy controls and the number of distinct proteins targeted in each group is shown for various cutoffs. The complexity factor was calculated as the number of distinct proteins divided by the number of individuals divided by the average number of proteins per individual.
Figure 1—figure supplement 5

Random selection of 10 protein identified as autoantigens in APS1 using the criteria applied by Meyer et al.
(Z ≥ 3). Z-scores were calculated based on the mean and standard deviation of the healthy controls. p=APS1 patients (n = 51), C = controls (n = 21).
Figure 1—figure supplement 6
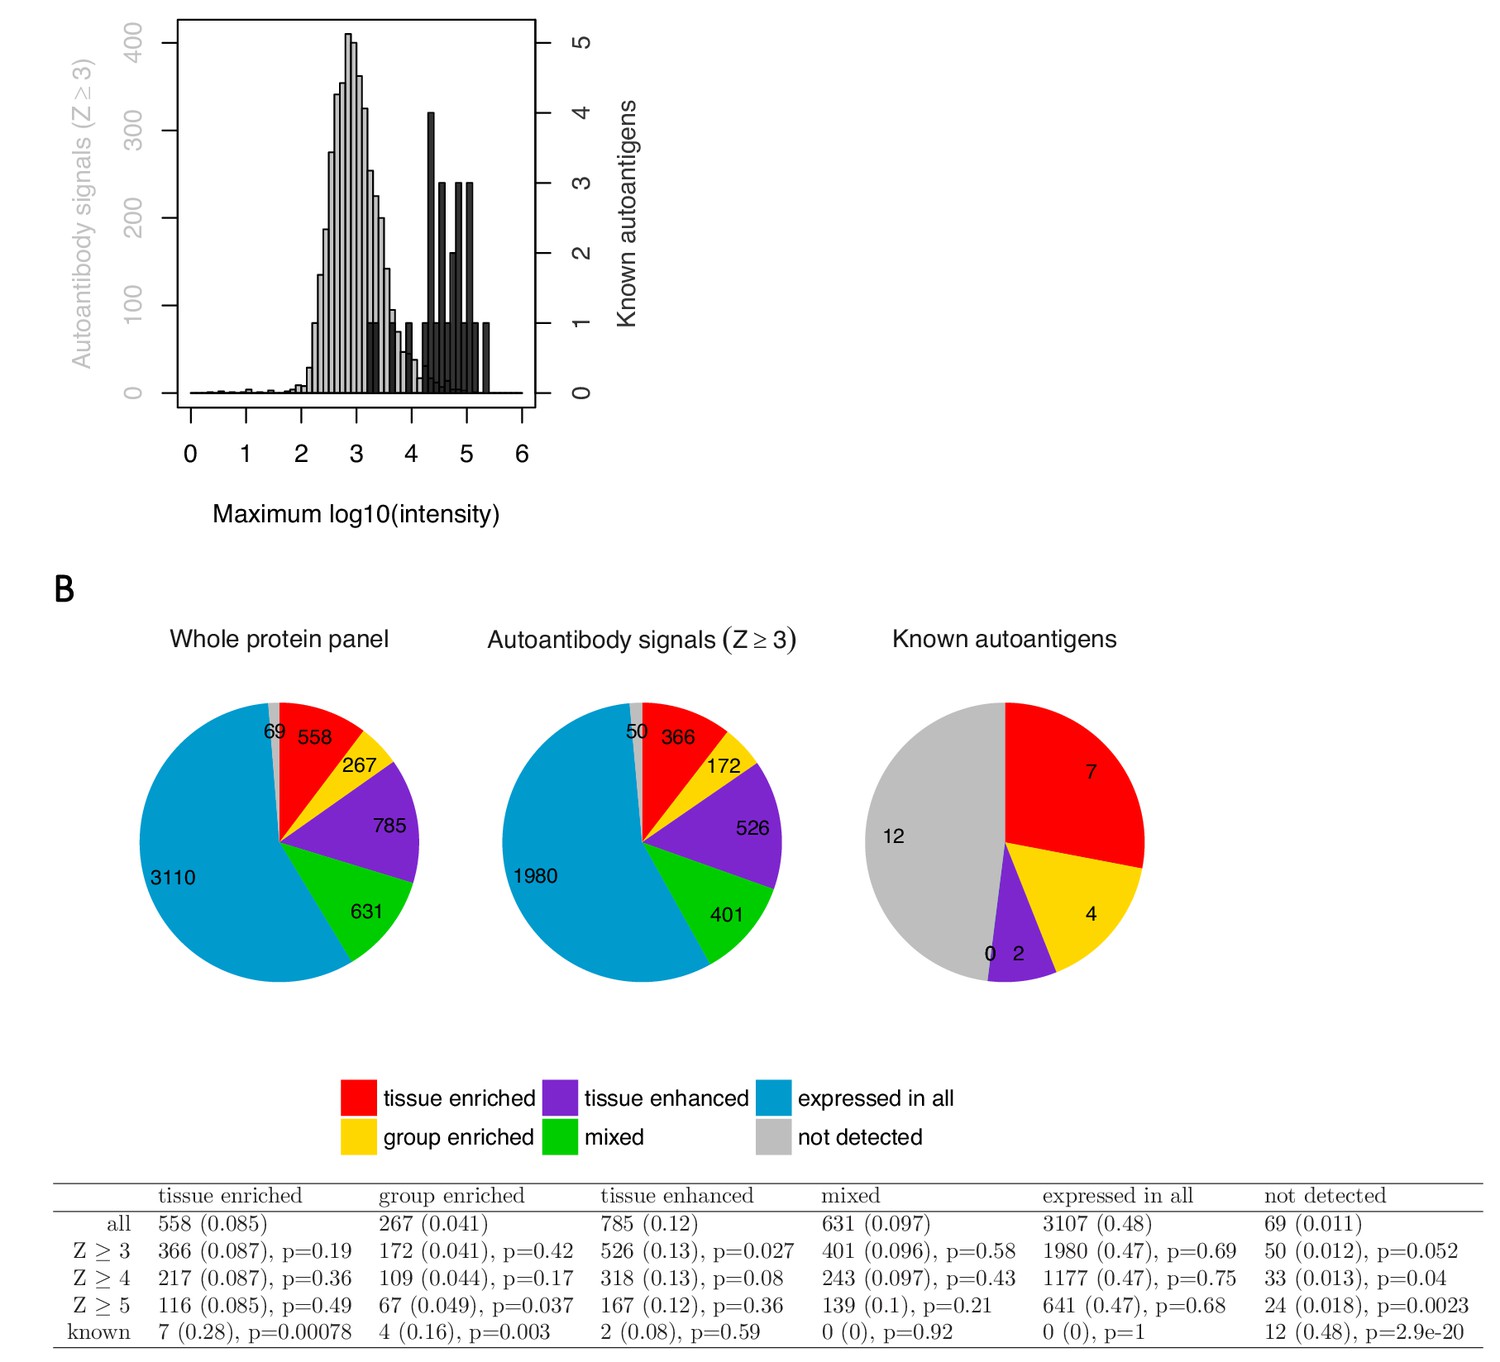
Targets identified using the analysis by Meyer et al. are low in signal and do not show enrichment for tissue-specific genes.
To further evaluate the relevance of the targets identified using the statistical analysis by Meyer et al., we compared them against the established autoantigens in APS1 with respect to the number of autoantibody positive individuals, signal intensity, and enrichment for tissue-specific genes. The great majority of the new targets (Z ≥ 3) showed elevated level in only one or a few patients, with 37% of the targets representing single outlier values and only 26% being shared by more than three patients. The novel hits were further generally low in signal intensity compared to the established APS1 autoantigens. Looking at the top signal in the cohort for each target, the previously established autoantigens showed an average signal intensity of over thirty-seven thousand arbitrary fluorescence units while the new targets averaged at just below one thousand (A). We next investigated whether the new targets showed enrichment for tissue-specific genes. It has been shown that the AIRE gene promotes thymic expression of proteins with limited tissue distribution (Anderson et al., 2002). Consistent with the function of AIRE, the previously identified autoantigens in APS1 typically show tissue-specific expression. Therefore, studying enrichment of the tissue-specific genes could provide a way to determine if the new targets differed from a random sample of the array content. RNAseq-based gene expression data over multiple human tissues from The Human Protein Atlas (www.proteinatlas.com) (Uhlén et al., 2015) was used to study enrichment for gene expression category among the new targets as compared to the known autoantigen in APS1. The known autoantigens showed enrichment for the tissue-enriched (p<0.001), group-enriched (p<0.01) and not detected (p<0.001) gene categories, and none of them belonged to the mixed or expressed in all gene categories. The new targets, however, did not show enrichment for any category of tissue expression (B). We thus did not find any indication that the targets identified using the methods by Meyer et al. differed from a random sample of the studied protein panel.
Figure 1—figure supplement 7

No support for widespread autoantigen spectrum in APS1.
As the statistical analysis used by Meyer et al. had proved to be biased in the comparison between patients and controls, the question remained whether or not the APS1 patients showed autoantibody responses against higher numbers of self-proteins than healthy subjects. We first looked at the distribution of autoantibody signals among patients and controls by applying different fixed signal cutoffs. The number of elevated IgG signals was higher in the APS1 patients than in the healthy controls, although the difference was small compared to that found by Meyer et al. (A). For example, at an arbitrary cutoff of 10,000 arbitrary fluorescence intensity units the APS1 patients displayed autoantibody responses against an average of 22 unique proteins as compared to 15 proteins in the healthy controls. Furthermore, the difference was almost completely eliminated when we excluded already known autoantigens – decreasing the number of autoantibody signals to an average of 16 proteins in the APS1 patients compared to the unchanged average of 15 proteins in the healthy controls (B). The results were similar for other cutoff values. We also compared the number of autoantibody signals between patients and controls by applying Z-score cutoffs. To allow for an unbiased detection of autoantibody signals, equally prone to register signals among patients and controls, we did not base the Z-score on the healthy controls as in the study by Meyer et al. but instead on the whole cohort. We further excluded the 10% highest and 10% lowest signals before calculating the cutoff, so that the cutoff level would not be affected by outlier values. This type of analysis is expected to detect elevated signals that occur in one or a few subjects, however, autoantibody signals that are present in many subjects are overlooked as the cutoff is consequently increased. Again we observed a small difference in the number of autoantibody signals between the patients and controls (C), which was further reduced by excluding the known autoantigens (D). Thereby, in contrast with results by Meyer et al. specifically identifying high-level autoantibody signals among the APS1 patients, we found only a small difference in the number of autoantibody signals between patients and controls. We also calculated the statistical significance that the number of autoantibody signals in APS1 differed from permutated data by comparing the number of distinct proteins with at least one hit (Z ≥ 3) among the APS1 cases to what is expected by random (when 21 samples are randomly assigned to represent controls and the remaining 51 represent cases) (E). The p-value was computed as the fraction of the permutations that result in as many distinct proteins as observed or more. At higher z-scores the numbers were borderline significant, showing a trend towards that the APS1 patients display higher numbers of autoantibody signals than the permutated data ‘cases’. The results were in line with the investigations in A-D. In all panels, the complexity factor was calculated as the number of distinct proteins divided by the number of individuals divided by the average number of proteins per individual. In panel A and B: Pat = APS1 patients, BG = healthy controls. In panel C and D: p=APS1 patients, C = healthy controls.
Figure 2
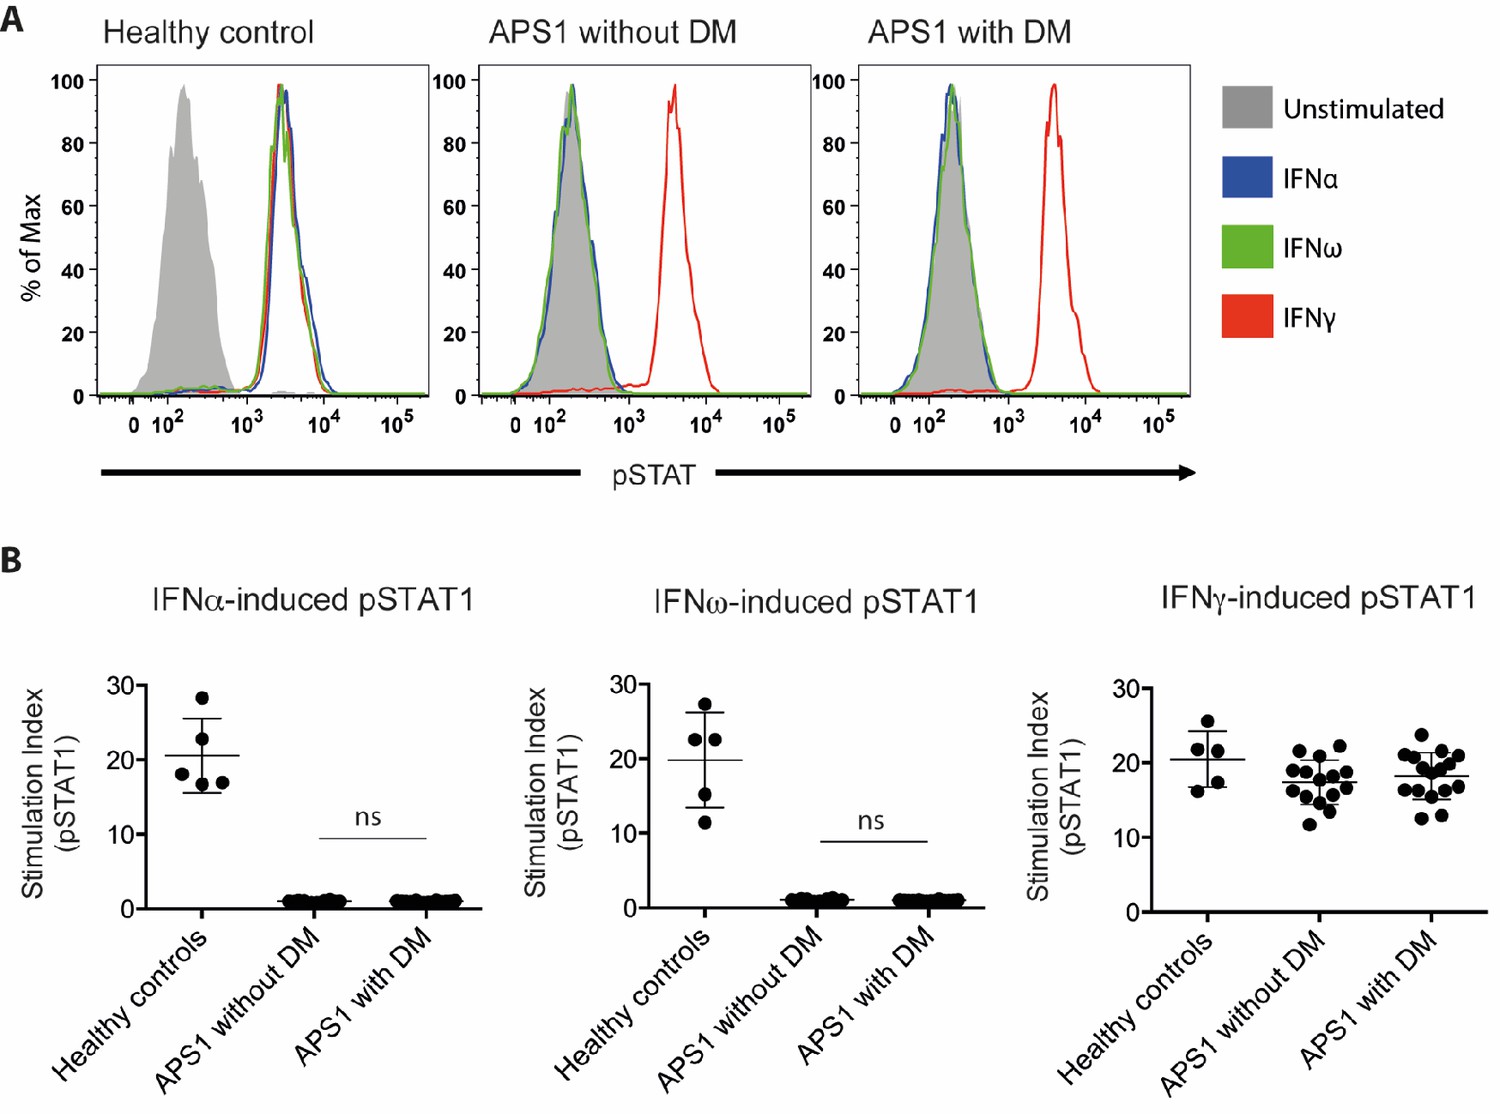
No association between neutralizing interferon autoantibodies and type 1 diabetes in APS1.
(A) Representative FACS plots showing IFNα-induced (blue), IFNω-induced (green), or IFNγ-induced (red) STAT1 phosphorylation in normal PBMC (gating on CD14 +monocytes) in the presence of 10% serum from a healthy control, an APS1 patient without type 1 diabetes (DM), or an APS1 patient with type 1 DM. (B) A stimulation index (ratio of stimulated to unstimulated geometric mean fluorescence values for pSTAT1 channel) was calculated for each serum sample tested in response to IFNα, IFNω, and IFNγ. No statistically significant difference was found between the means of APS1 patients with (n = 16) or without type 1 DM (N = 14) for IFNα- or IFNω-induced pSTAT1 (adjusted p value 0.9999 and 0.9976, respectively). IFNγ-induced pSTAT1 was not significantly different between healthy controls, APS1 patients without DM, or APS1 patients with DM. An unmatched 1-way ANOVA was used, correcting for multiple comparisons with Tukey’s test. Ns – not significant.
-
Figure 2—source data 1
Neutralizing interferon autoantibodies in APS1 patients with and without type 1 diabetes.
- https://doi.org/10.7554/eLife.43578.011
Tables
Key resources table
| Reagent type (species) or resource | Designation | Source or reference | Identifiers | Additional information |
|---|---|---|---|---|
| Biological sample (Homo sapiens) | Serum samples from patients with APS1 from Sweden, Norway and Finland, and blood donor controls from Sweden | PMID: 26084804 and 26830021 | ||
| Biological sample (Homo sapiens) | Serum samples from patients with APS1 from USA | PMID: 27588307 | ||
| Biological sample (Homo sapiens) | Blood donor controls from NIH Blood Bank | |||
| Antibody | Fluorophore-conjugated goat polyclonal anti-human IgG | Thermo Fisher Scientific | Alexa Fluor 647 Goat Anti-Human IgG; Cat#A21445, | Concentration: 1:2000 |
| Antibody | Fluorophore-conjugated mouse monoclonal anti-pSTAT1 | BD Biosciences | Alexa Fluor 647 mouse anti-human Stat1 (pY701); Cat# 612597 | 5 uL/test |
| Antibody | Fluorophore-conjugated mouse monoclonal anti-CD14 | BD Biosciences | FITC mouse anti-human CD14; Cat# 555397 | 2 uL/test |
| Recombinant protein | Recombinant human interferon-alpha 2 | PBL Assay Science | Cat # 11101–2 | Concentration: 10 ng/mL |
| Recombinant protein | Recombinant human interferon-alpha | Peprotech | Cat# 300–02J | Concentration: 10 ng/mL |
| Recombinant protein | Recombinant human interferon-gamma 1b | ActImmune | NDC 42238-111-01 | Concentration: 400 U/mL |
| Commercial assay or kit | Protein microarray | Thermo Fisher Scientific | ProtoArray v5.0 (PAH0525020) | |
| Commercial assay or kit | Blocking buffer kit used in the protein array screening | Thermo Fisher Scientific | Blocking Buffer Kit (PA055) | |
| Software, algorithm | Software used for protein microarray scanning, alignment and data acquisition | GenePix Pro microarray (v6.1) | ||
| Software | FlowJo | FlowJo (v10.5.3) | ||
| Software | Prism | GraphPad Prism (v6.0) |
Additional files
-
Transparent reporting form
- https://doi.org/10.7554/eLife.43578.012
Download links
A two-part list of links to download the article, or parts of the article, in various formats.
Downloads (link to download the article as PDF)
Open citations (links to open the citations from this article in various online reference manager services)
Cite this article (links to download the citations from this article in formats compatible with various reference manager tools)
Comment on 'AIRE-deficient patients harbor unique high-affinity disease-ameliorating autoantibodies'
eLife 8:e43578.
https://doi.org/10.7554/eLife.43578


