Multiple mechanisms link prestimulus neural oscillations to sensory responses
- Columbia University College of Physicians and Surgeons, United States
- Max Planck Institute for Human Cognitive and Brain Sciences, Germany
- National Research University Higher School of Economics, Russian Federation
- University of Münster, Germany
- Humboldt-Universität zu Berlin, Germany
- Radboud University Nijmegen, Netherlands
- University of California, Santa Cruz, United States
- Charité-Universitätsmedizin Berlin, Germany
- Bernstein Center for Computational Neuroscience, Germany
Figures
Figure 1
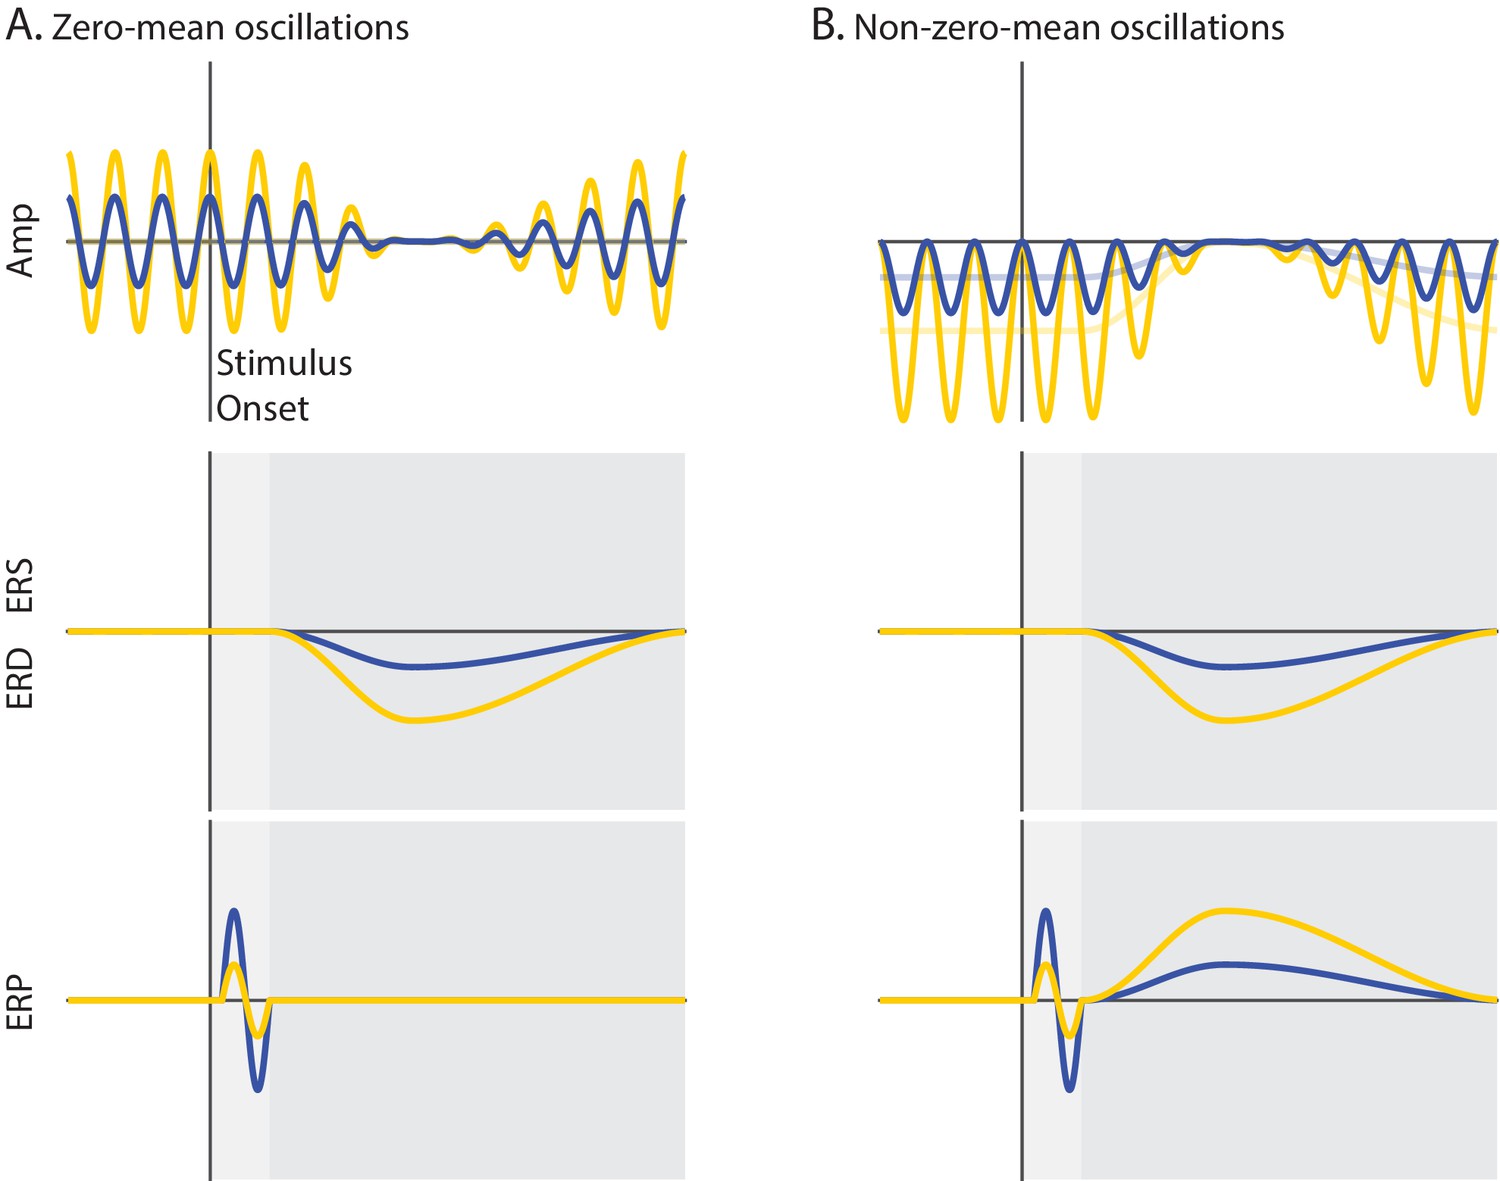
Schematic overview of the mechanisms of functional inhibition and baseline shift.
Ongoing activity (Amplitude), event-related oscillations (ERS/ERD) and potentials (ERP) are illustrated in upper, middle and lower panels, respectively. The vertical line indicates stimulus onset, while the horizontal line indicates zero signal strength. Yellow and blue represent states of strong and weak prestimulus power, respectively. (A) Non-phase-locked ongoing oscillatory activity with a zero-mean. The oscillations are symmetrical relative to the zero line of the signal (A upper panel). (B) Non-phase-locked ongoing oscillatory activity with a non-zero-mean. The oscillations are asymmetrical relative to the zero line of the signal. The signal baseline is characterized by a negative offset (opaque lines). The stronger the power of these oscillations, the stronger the negative offset of the signal baseline (B upper panel). During event-related desynchronization (ERD), the ongoing oscillations are suppressed to the zero line of the signal. This implies that the stronger the prestimulus power, the stronger the ERD (A/B middle panels). Trial averaging of zero-mean oscillations eliminates prestimulus oscillatory activity that is not time-locked to the stimulus because opposite oscillatory phases cancel out. This results in baseline signal at the zero line, which is unaffected by ERD. Therefore, an ERD of zero-mean oscillations does not generate the slow ERP component during the late time window because there is no baseline shift for these oscillations (dark gray; A lower panel). Trial averaging of non-zero-mean oscillations does not eliminate non-phase locked ongoing activity. This results in a prestimulus baseline signal with an offset relative to the zero line. During the ERD, the baseline of the signal gradually approaches the zero line of the signal. When the post-stimulus signal is corrected with the prestimulus non-zero baseline, a slow shift of the ERP signal appears, mirroring the ERD time-course. Specifically, an ERD of negative (positive) non-zero mean oscillations shifts the signal upward (downward), generating the slow ERP component of positive (negative) polarity. Crucially, the stronger the prestimulus power, the stronger the ERD, and as a consequence, the stronger the slow shift of the ERP. The baseline-shift account predicts a positive relationship between prestimulus power and the amplitude of the slow ERP during the late time window (dark gray; B lower panel). According to the functional inhibition account, strong prestimulus power attenuates the amplitude of the additive ERP components. This account predicts a negative relationship between prestimulus power and the amplitude of ERP components during the early time window (light gray; A/B lower panels).
-
Figure 1—source data 1
Simulations.
- https://doi.org/10.7554/eLife.43620.004
Figure 2
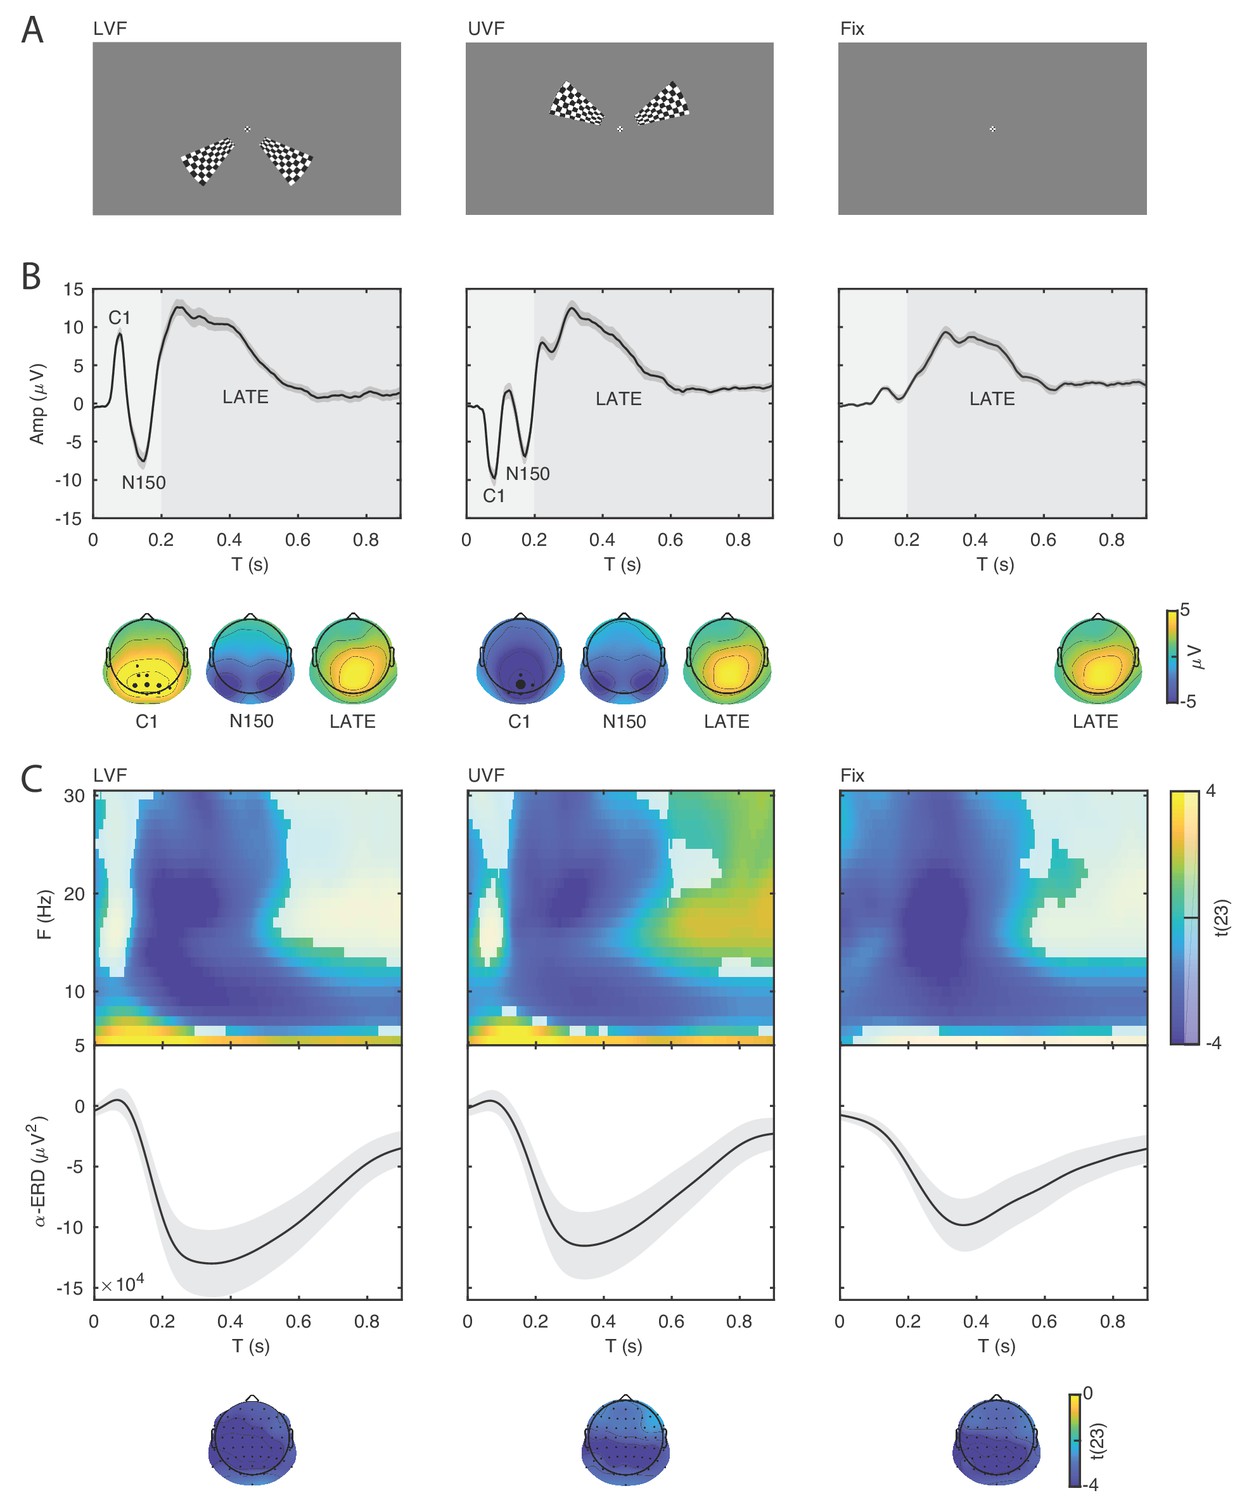
Event-related potentials and oscillations.
(A) The stimuli consisted of bilateral checkerboard wedges specifically designed to elicit the C1 component of the visual ERP. The stimuli appeared in the lower (left panel, LVF), upper visual field (middle panel, UVF), or in no field (right panel, Fix) with equal probability. Across trials, the participants were instructed to discriminate a central target during stimulus presentation. (B) Event-related potentials (ERP) were calculated for the subject-specific electrode with C1-peak activity. Additive ERP components are visible during the early time window (< 0.200 s, light grey). The C1 component is the earliest component of the visual ERP and is polarity-reversed across fields of stimulation (LVF vs. UVF). The C1 topography illustrates the ERP amplitude averaged at the subject-specific time point of peak activity between 0.055 and 0.090 s. The size of the electrodes in the topography indicates the frequency of the C1-peak electrode in the sample of participants. The C1 is followed by the N150, peaking between 0.130 and 0.180 s relative to stimulus onset. The N150 topography illustrates the ERP amplitude averaged between 0.130 and 0.180 s. Fix trials do not show any robust additive components during the early time window. The slow component of the ERP is visible during the late time window (> 0.200 s, dark gray). The topography of this late component illustrates the ERP amplitude averaged between 0.200 and 0.900 s. This late ERP component is present in all trial types. Time 0 indicates stimulus onset. (C) Group-level t-statistics maps of event-related oscillations. Negative values (blue) indicate significant power suppression across participants (ERD), while positive values (yellow) indicate significant power enhancement across participants (ERS). The maps are averaged across electrodes of the significant clusters, and masked by a final alpha of 0.05 using two-sided cluster permutation testing. The topography illustrates the group-level t-statistics averaged for the α frequency band (8–12 Hz) at the time point of most negative t-statistics. The bottom insets illustrate the group-level α-band ERD time course at occipital electrodes. The ERD is present in all trial types. Time 0 s indicates stimulus onset. Source data: the original source data are available at DOI: https://doi.org/10.5061/dryad.nm4241p.
Figure 3

Prestimulus power differently modulates the amplitude of early and late event-related potentials (ERP).
(A) Group-level t-statistics maps of the difference in ERP amplitude between states of weak () and strong () prestimulus power on lower visual field (left panel, LVF), upper visual field (middle panel, UVF), and fixation-only trials (right panel, Fix). Positive (yellow) and negative t-statistics values (blue) indicate that ERP amplitude/voltage becomes more positive or more negative during states of strong prestimulus power, respectively. Accordingly, positive t-statistics values indicate an enhancement of positive ERP components, and a dampening of negative ERP components, while negative t-statistics values indicate an enhancement of negative ERP components, and a dampening of positive ERP components. The maps are averaged across electrodes of the significant cluster, and masked by a final alpha of 0.025 using separate two-sided cluster permutation testing for early and late time windows. Note that the x-axis refers to post-stimulus ERP time, while the y-axis refers to the frequency of prestimulus oscillatory power. Bottom insets: visualization of the normalized ERP time course separately for states of strong (, yellow) and weak (, blue) prestimulus power. This was computed at the electrode and frequency of most positive/negative t-statistics during the C1 time window on stimulation trials and during the late time window on Fix trials. The ERP is characterized by distinct components occurring during the early (<0.200 s: C1 and N150, light gray) and late time windows (>0.200 s, dark gray). Time 0 indicates stimulus/fixation-target onset. (B) Group-average normalized ERP amplitude on trials sorted from weak () to strong () prestimulus power, calculated at the ERP time point and the prestimulus-power electrode and frequency of most positive/negative t-statistics. Error bars indicate ± SEM. The topographies show the positive and negative t-statistics at the time point and frequency of most positive/negative t-statistic for early (C1 and N150) and late ERP components. Black dots represent electrodes comprising the significant clusters. States of strong prestimulus power are followed by a reduction of the amplitude of additive ERP components during the early time window (consistent with the functional inhibition account), as well as by an enhancement of the slow ERP component during the late time window (consistent with the baseline-shift account). (C) Group-average prestimulus total-band power spectrum shown separately for the five bins sorted from weak () to strong () total-band power at frequencies and electrodes of most positive/negative t-statistics. (D) Group-average percentage change in total-band (dark) and aperiodic-adjusted (light) power sorted from weak () to strong () total-band power at frequencies and electrodes of most positive/negative t-statistics. indicates FDR-corrected p<0.001 for a one-sample two-sided t-test comparing values between and .
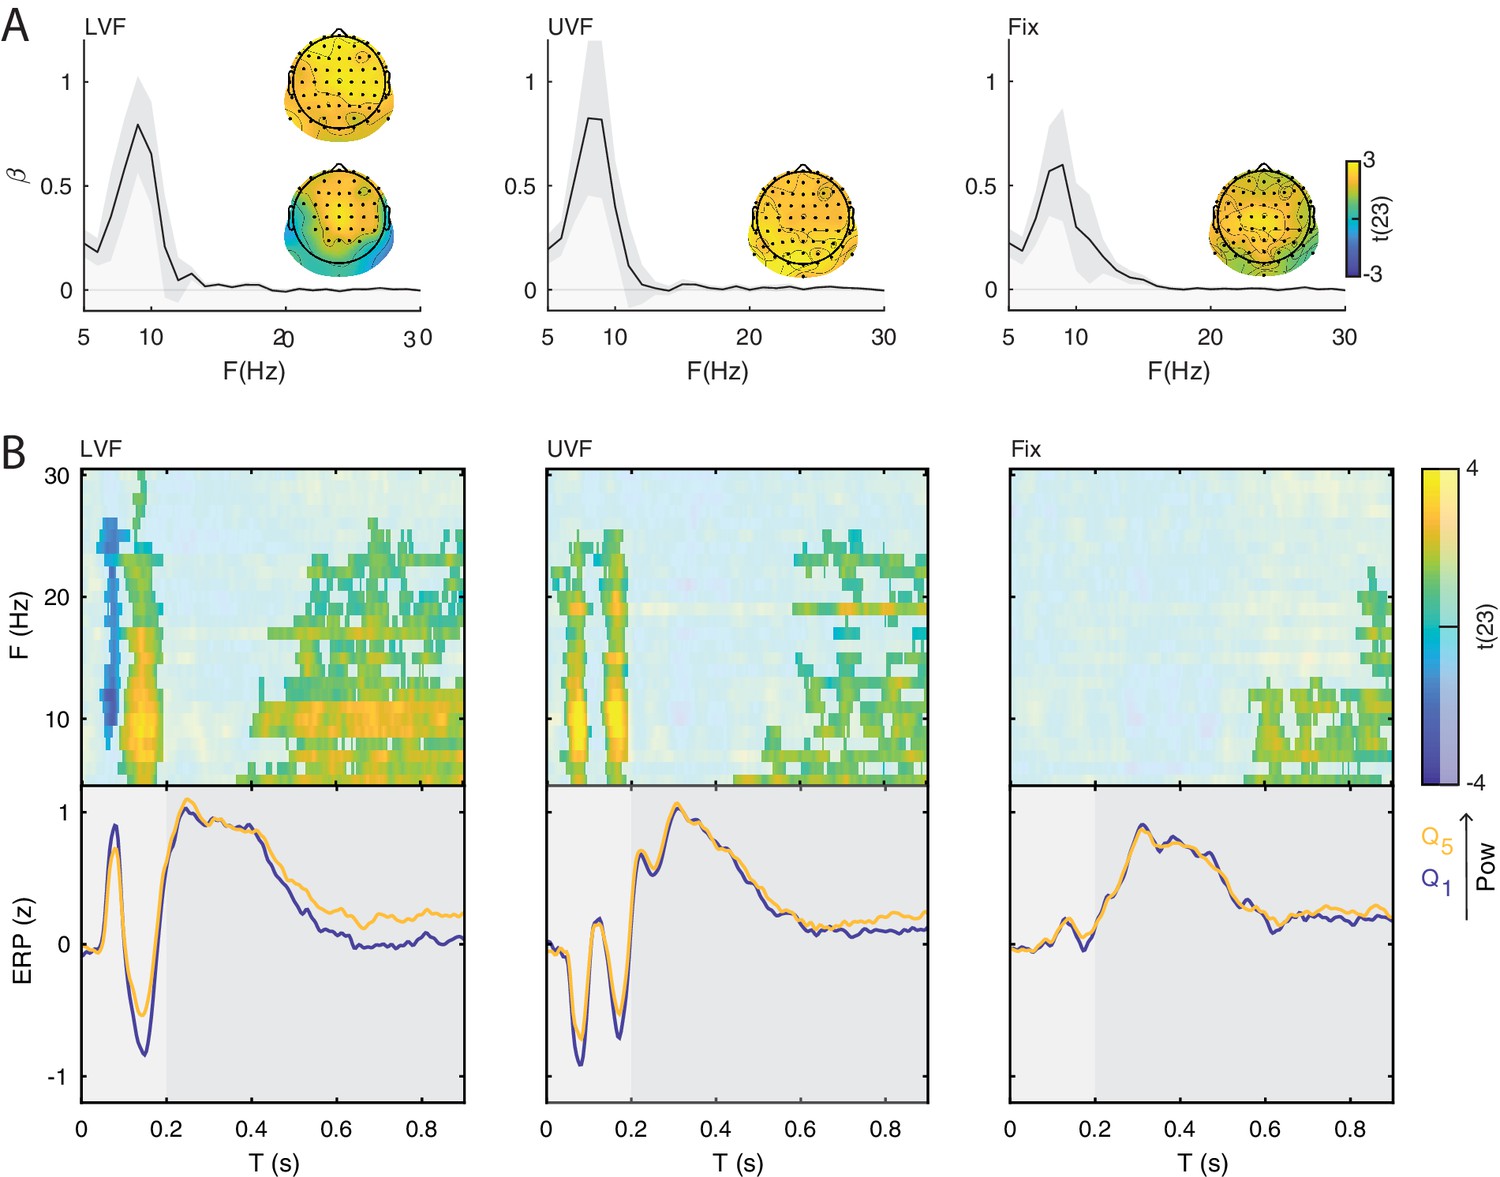
Figure 4
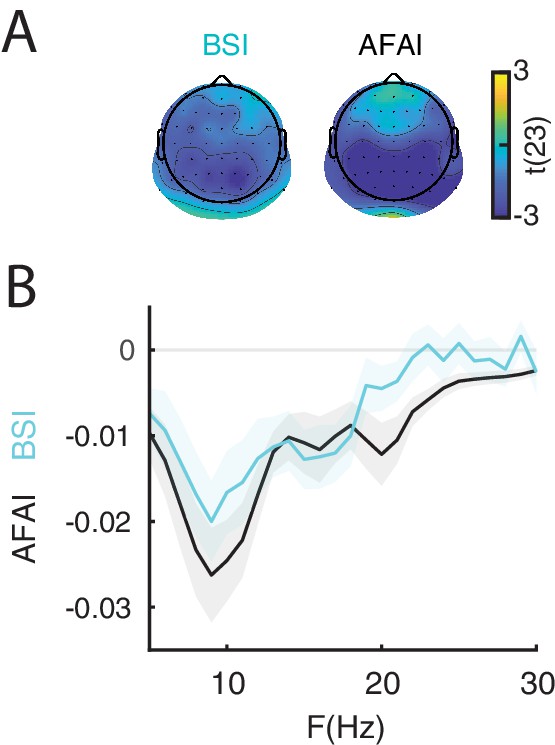
The non-zero mean property of resting-state neural oscillations is a prerequisite for the baseline-shift mechanism.
The late component of the ERP is generated by a baseline shift occurring during event-related desynchronization (ERD) of non-zero mean oscillations. (A) The amplitude fluctuation asymmetry index () is quantified as the normalized difference between the variance of the peaks and troughs of an oscillatory signal during resting state. (blue) indicates a stronger modulation of the troughs relative to the peaks, consistent with a negative mean. The topography represents the group-level t-statistics of : a significant negative cluster was found at frequencies between 5 and 30 Hz and with an occipito-parietal peak. The baseline shift index () is quantified as the correlation between the oscillatory envelope at a certain frequency and low-pass filtered EEG signal at 3 Hz during resting-state. (blue) indicate a negative relationship between oscillatory envelope and low-pass filtered signal, consistent with negative mean. The topography represents the group-level t-statistics of : a significant negative cluster was found at frequencies between 5 and 21 Hz and with an occipito-parietal peak. Black dots represent electrodes comprising the significant clusters. (B) Comparison between group-level (black) and (blue), averaged across respective cluster electrodes, and shown for each frequency. Shaded areas indicate ± SEM. These results indicate the presence of a negative oscillatory mean, consistent with the baseline-shift account.
Figure 5
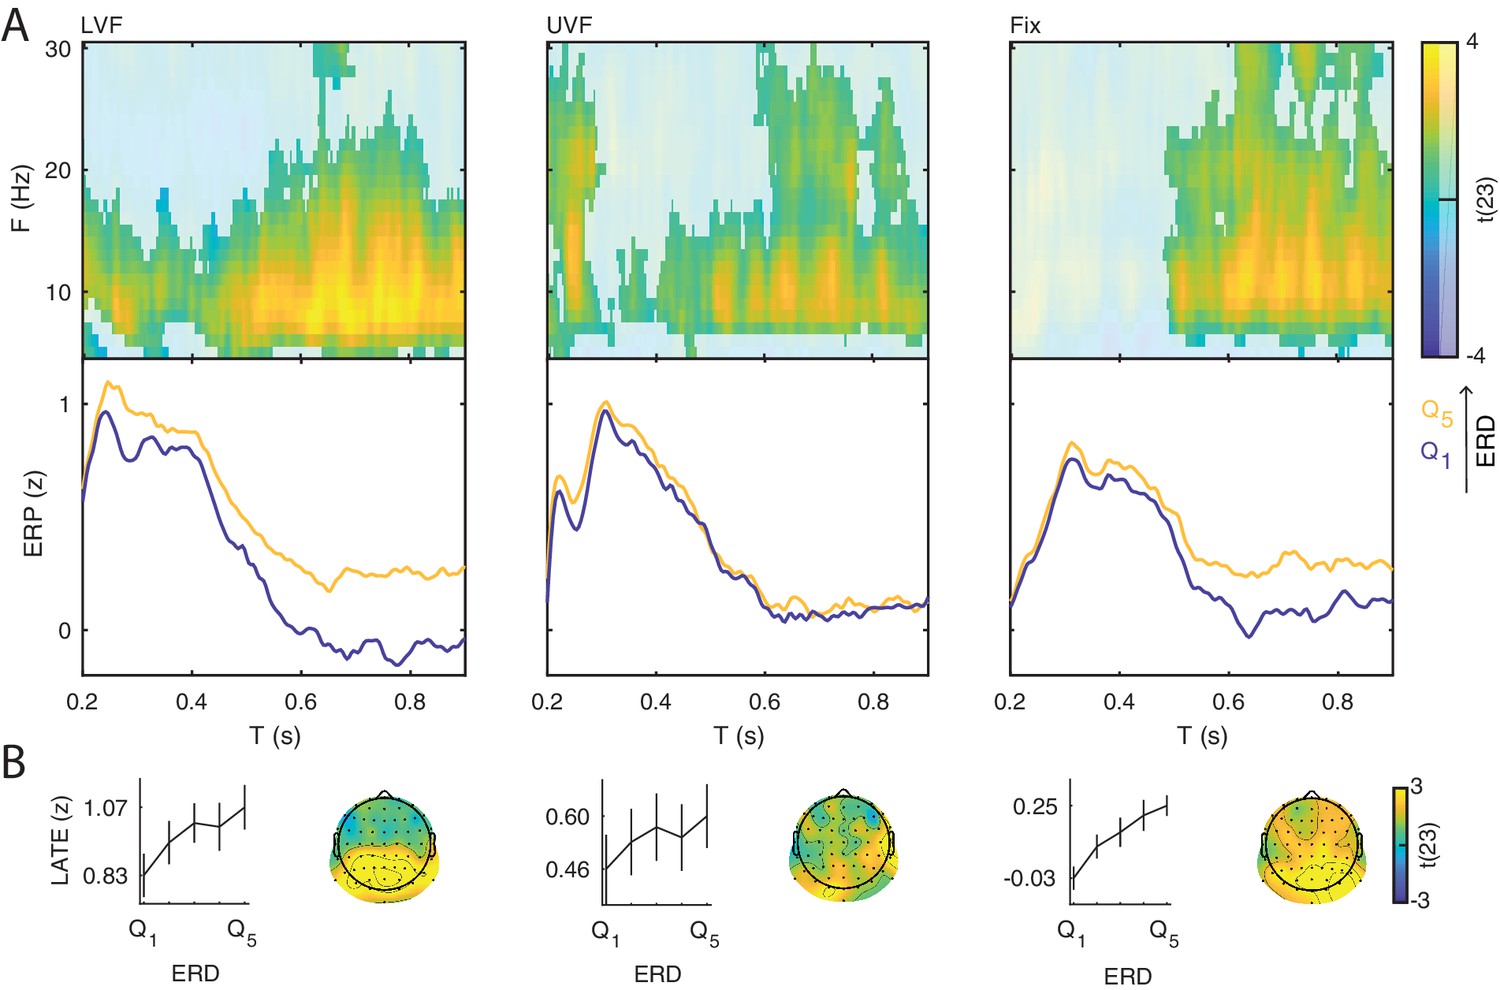
Interaction between the event-related desynchronization (ERD) and the late ERP component.
A positive relationship between the ERD magnitude and the late ERP amplitude is another prerequisite for the baseline-shift mechanism. (A) Group-level t-statistics maps of the difference in late ERP amplitude (>0.200 s) between states of weak () and strong () event-related desynchronization (ERD) on lower visual field (left panel, LVF), upper visual field (middle panel, UVF), and fixation-only trials (right panel, Fix). Positive values (yellow) indicate that the amplitude of the late ERP increases during states of strong ERD. The maps are averaged across electrodes of the significant cluster, and masked by a final alpha of 0.05 using two-sided cluster permutation testing. Note that the x-axis refers to post-stimulus ERP time, while the y-axis refers to the ERD frequency. Bottom insets: visualization of the normalized late ERP time course separately for states of strong (, yellow) and weak (, blue) ERD, computed at the electrode and frequency of most positive t-statistics. Time 0 indicates stimulus/fixation-target onset. (B) Group-average normalized ERP amplitude on trials sorted from weak () to strong () ERD, calculated at the ERP time point and ERD electrode and frequency of most positive t-statistics. The amplitude of the late ERP increases linearly as a function of ERD. Error bars indicate ± SEM. The topographies show the positive t-statistics of the significant clusters at the time point and frequency of most positive t-statistics for each trial type. Black dots represent electrodes comprising the significant positive cluster. Taken together, these results show that states of strong ERD are associated with an enhancement of the late ERP component, consistent with the baseline-shift account.
Figure 6
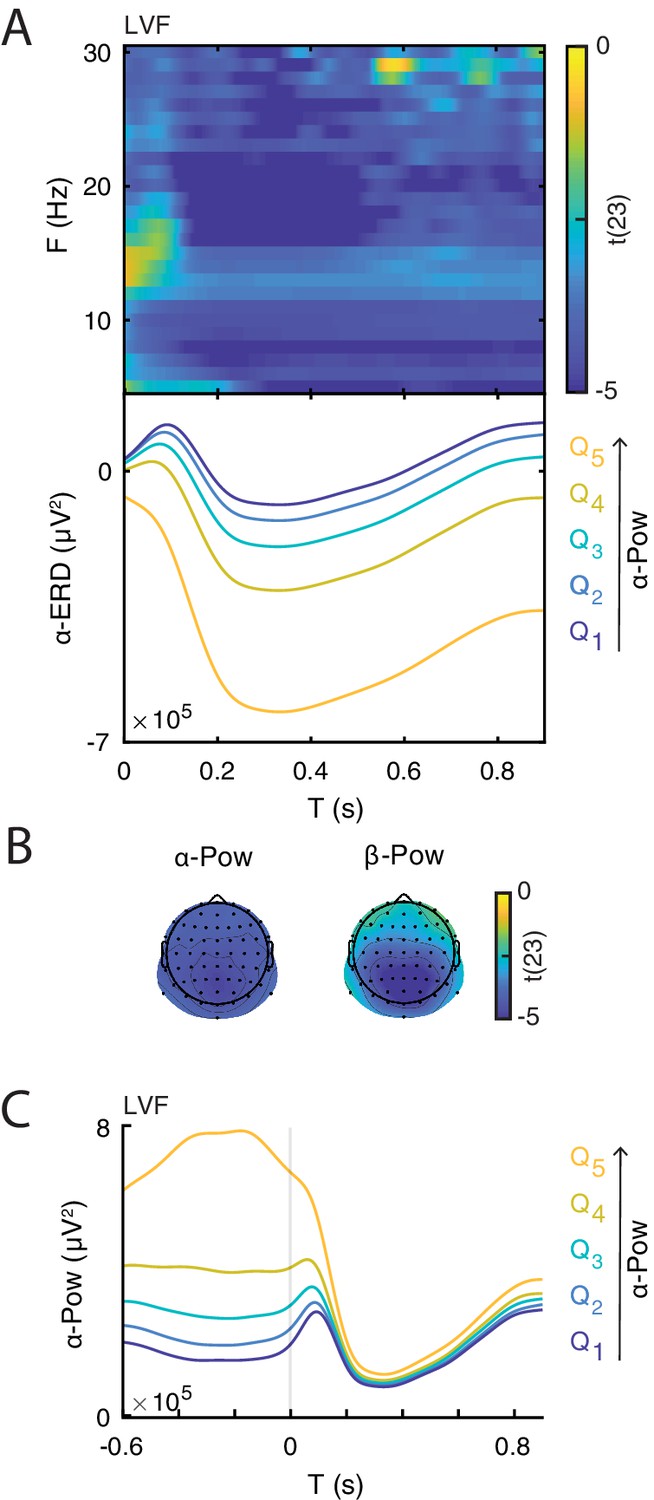
Illustration of the relationship between event-related desynchronization (ERD) and prestimulus power.
(A) Group-level t-statistics map of the difference in ERD magnitude between states of weak () and strong () prestimulus power on lower visual field (LVF) trials. Negative values (blue) indicate that the ERD magnitude increases during states of strong prestimulus power. The map is averaged across occipital electrodes. Because of the circularity in the computation of prestimulus power and ERD, the t-values are inflated and only shown for illustrative purposes. No significance testing was run for this analysis. Note that the x-axis refers to post-stimulus ERD time, while the y-axis refers to the frequency of prestimulus oscillatory power. Bottom insets: visualization of the normalized ERD time course separately for the five bins of prestimulus power (weak to strong: , blue to yellow), computed at the electrode and frequency of most negative t-statistics. Time 0 indicates stimulus onset. (B) The topographies show the negative t-statistics averaged for the - (8–12 Hz) and -band (13–30 Hz) and for the late time window (0.200–0.900 s) on LVF trials. (C) Group-average power envelope shown separately for the five bins of prestimulus power (weak to strong: , blue to yellow) averaged for the -frequency band and occipital electrodes on LVF trials. Note that poststimulus power is similar across different prestimulus -band bins. These results show that states of strong prestimulus power are followed by strong ERD, consistent with the baseline-shift account.
Appendix 1—figure 1
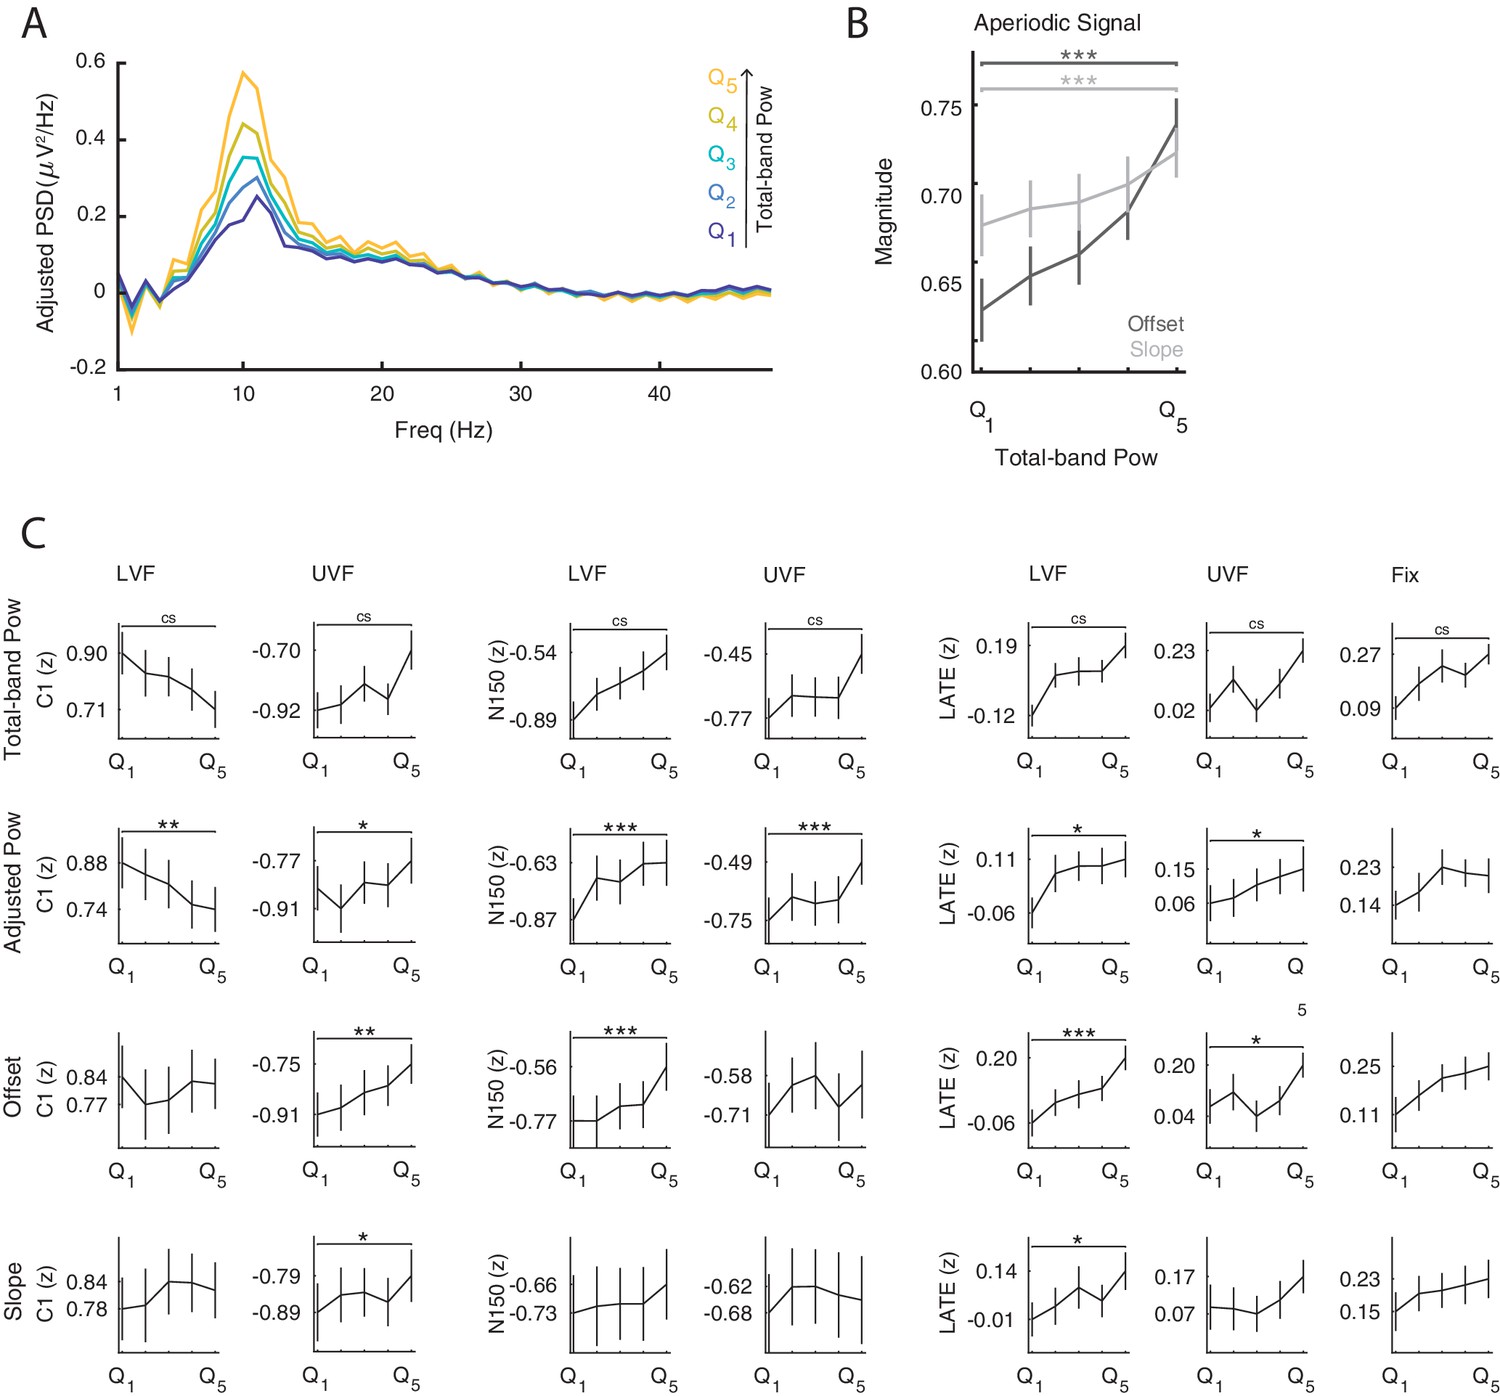
Analysis of periodic and aperiodic features of the prestimulus power spectrum.
(A) Group-average prestimulus aperiodic-adjusted power spectrum shown separately for the five bins sorted from weak () to strong () total-band power. (B) Group-average offset (dark) and slope (light) of the aperiodic signal sorted from weak () to strong () total-band power. The results in A and B are shown for the frequencies and electrodes of most positive/negative t-statistics, collapsed across the significant clusters of Figure 3. (C) Group-average normalized ERP amplitude on trials sorted by total-band power, aperiodic-adjusted power, offset and slope. ERP amplitudes were compared across most extreme bins () at the ERP time point and the prestimulus-power electrode and frequency of most positive/negative t-statistics, separately for each component and trial type. , , indicate FDR-corrected p-values<0.001, 0.01, 0.05, respectively. indicates significant p-values based on cluster-level statistics (see Figure 3).
Appendix 1—figure 2
Interaction between ERP and prestimulus power when sleepiness effects are ruled out.
(A) GLM was used to measure the contribution (regression coefficient; GLM ) of oscillatory power to subjective sleepiness ratings, obtained by the KSS questionnaire. The estimated GLM s were tested against the null hypothesis of no relationship across the sample of participants using cluster permutation tests. The plots show the group-level GLM averaged across respective cluster electrodes, and per frequency. Shaded areas indicate ± SEM. The topographies show the positive t-statistics of the significant clusters averaged across the respective cluster frequencies. Positive values (yellow) indicate that power is positively correlated with KSS. (B) Group-level t-statistics maps of the difference in ERP amplitude between states of weak () and strong () prestimulus power for lower visual field stimuli (left panel, LVF), upper visual field stimuli (middle panel, UVF), and in fixation trials (right panel, Fix) . Positive (yellow) and negative t-statistics values (blue) indicate that ERP amplitude/voltage becomes more positive or more negative during states of strong prestimulus power, respectively. The maps are averaged across electrodes of the significant cluster, and masked by a final alpha of 0.025 using separate two-sided cluster permutation testing for early and late ERP time windows. Note that the x-axis refers to post-stimulus ERP time, while the y-axis refers to the frequency of prestimulus oscillatory power. Bottom insets: visualization of the normalized ERP time course separately for states of strong (, yellow) and weak (, blue) prestimulus power. This was computed at the electrode and frequency of most positive/negative t-statistics during the C1 time window on stimulation trials and during the late time window on Fix trials. Time 0 s indicates stimulus/fixation-target onset. The results replicate the conventional analysis on raw power values reported in Figure 3.
Additional files
-
Transparent reporting form
- https://doi.org/10.7554/eLife.43620.010
Download links
A two-part list of links to download the article, or parts of the article, in various formats.
Downloads (link to download the article as PDF)
Open citations (links to open the citations from this article in various online reference manager services)
Cite this article (links to download the citations from this article in formats compatible with various reference manager tools)
Multiple mechanisms link prestimulus neural oscillations to sensory responses
eLife 8:e43620.
https://doi.org/10.7554/eLife.43620


