An atlas of polygenic risk score associations to highlight putative causal relationships across the human phenome
- University of Bristol, United Kingdom
Figures
Figure 1
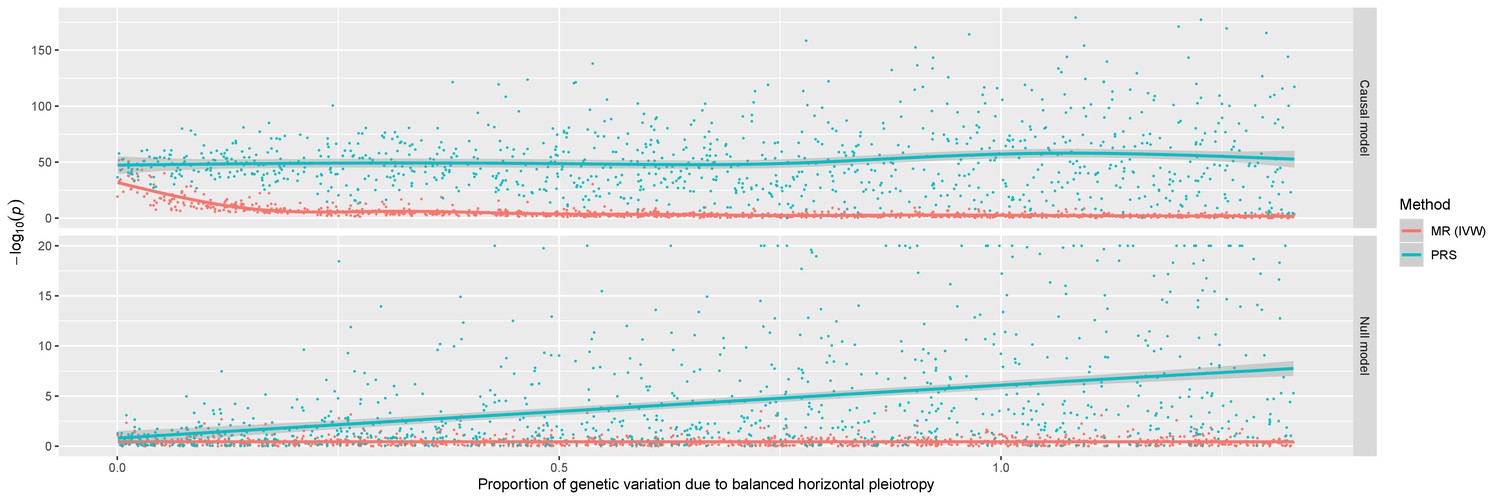
A comparison of the performance between the inverse variance weighted (IVW) Mendelian randomization (MR) model against polygenic risk score (PRS) analysis.
Simulations were conducted under different levels of horizontal pleiotropy for two different models; the causal model (where the simulated exposure has a causal effect on the outcome) and the null model (where there is no causal effect between exposure and outcome).
Figure 2
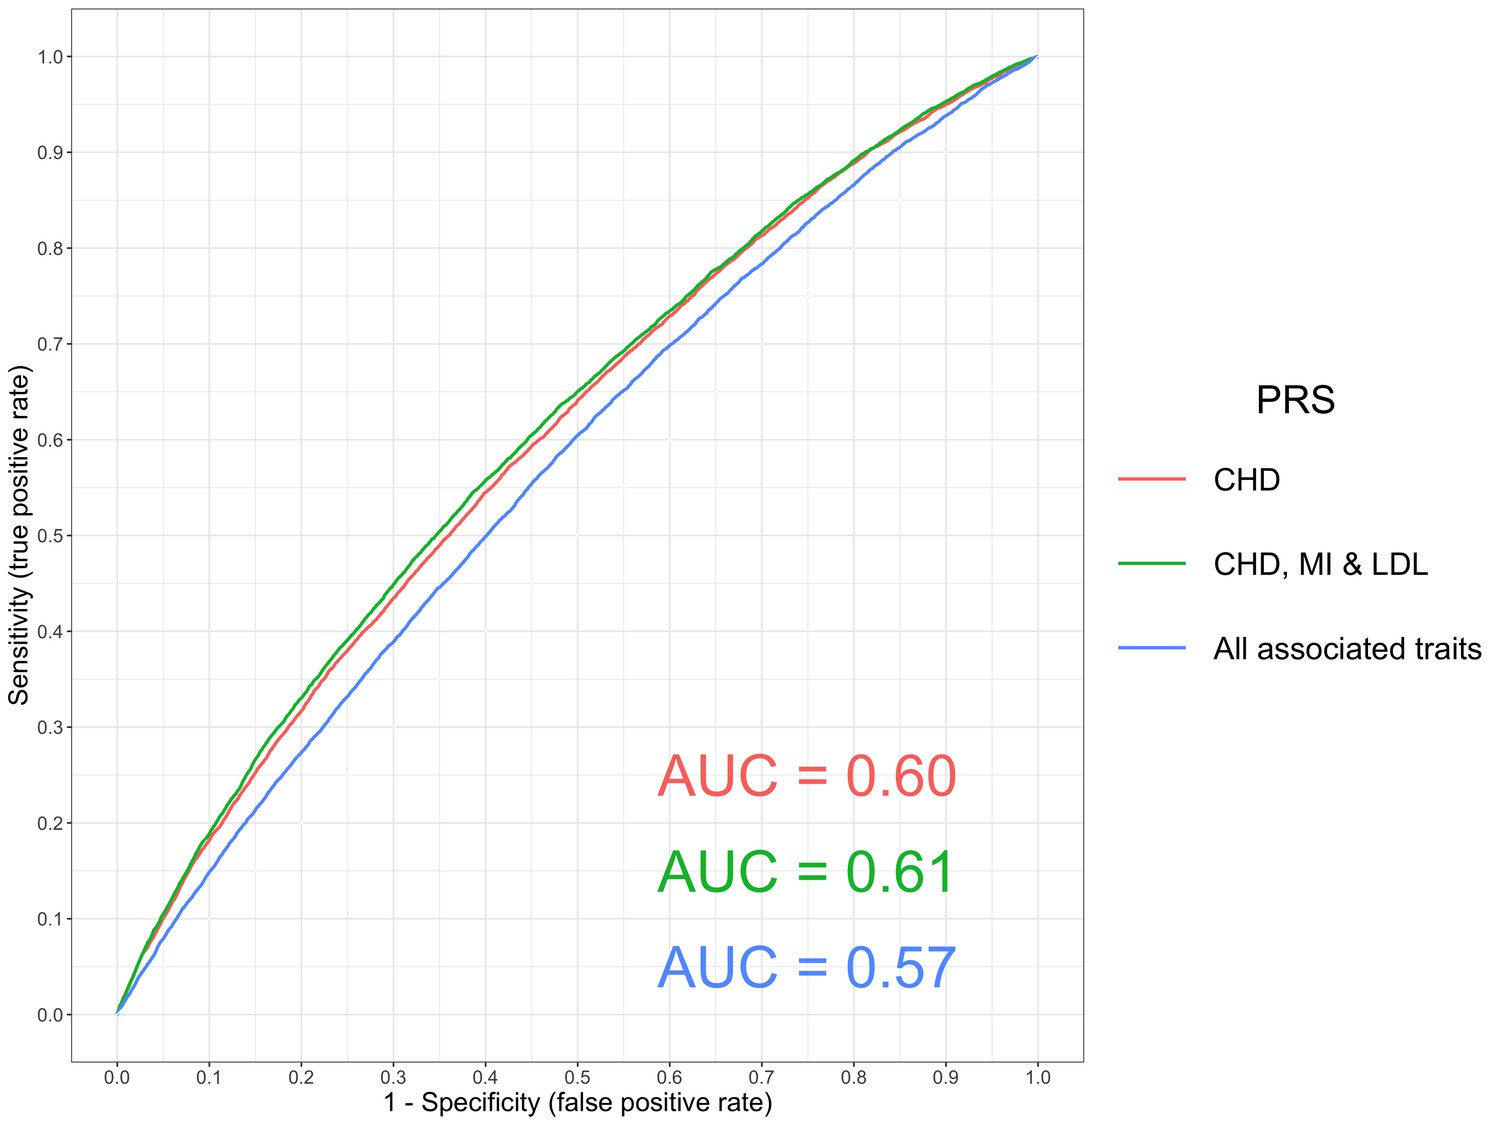
A receiver operator curve for ischaemic heart disease polygenic prediction.
A receiver operating characteristic (ROC) curve to compare the sensitivity and specificity of polygenic risk scores (PRS) and individuals with ischaemic heart disease (defined using ICD 10 codes ‘I25’) in the UK Biobank study. The scores evaluated were 1. Coronary Heart Disease (CHD), 2. A combined scored of CHD, Myocardial Infarction (MI) and Low Density Lipoprotein cholesterol (LDL), 3. All traits with a p-value<1×10−06 in our PRS analysis (excluding scores from GWAS overlapping with the UK Biobank sample). These were CHD, MI, LDL, Total cholesterol, Triglycerides, High Density Lipoprotein cholesterol, Years of schooling, Height and Waist Circumference. All PRS were constructed from GWAS using independent SNPs with p<5×10−05.
Figure 3
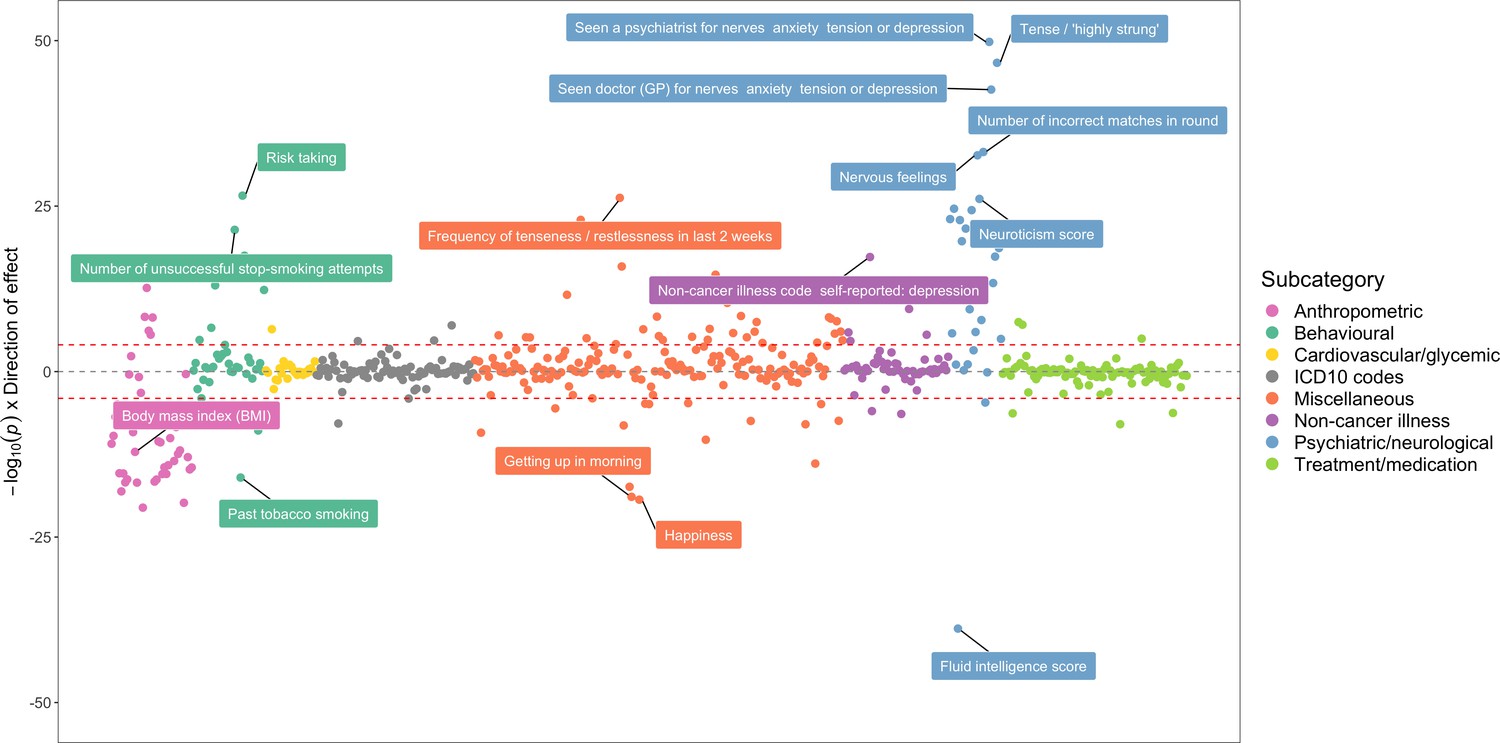
A bi-directional phenome-wide association plot for schizophrenia genetic liability.
Each point on this plot represents the association between the schizophrenia polygenic risk score (based on p<5×10−05) and a complex trait in the UK Biobank study. Along the y-axis are –log10 p-values for these associations multiplied by the direction of effect for their corresponding effect size. As such, traits positively associated with schizophrenia genetic liability reside above the horizontal grey line representing the null (i.e. –log10 (P) = 0), whereas negative associations are below. Points are grouped and coloured based on their corresponding complex traits’ subcategory. Horizontal red lines indicate the Bonferroni corrected threshold for the 551 tests undertaken (i.e. 0.05/551 = 9.07×10−05).
Figure 4

A receiver operator curve for gout polygenic prediction.
A receiver operating characteristic (ROC) curve to compare the sensitivity and specificity of polygenic risk scores (PRS) and individuals with self-reported gout in the UK Biobank study. The scores evaluated were gout and urate using independent SNPs identified by GWAS with p<5×10-05.
Figure 5
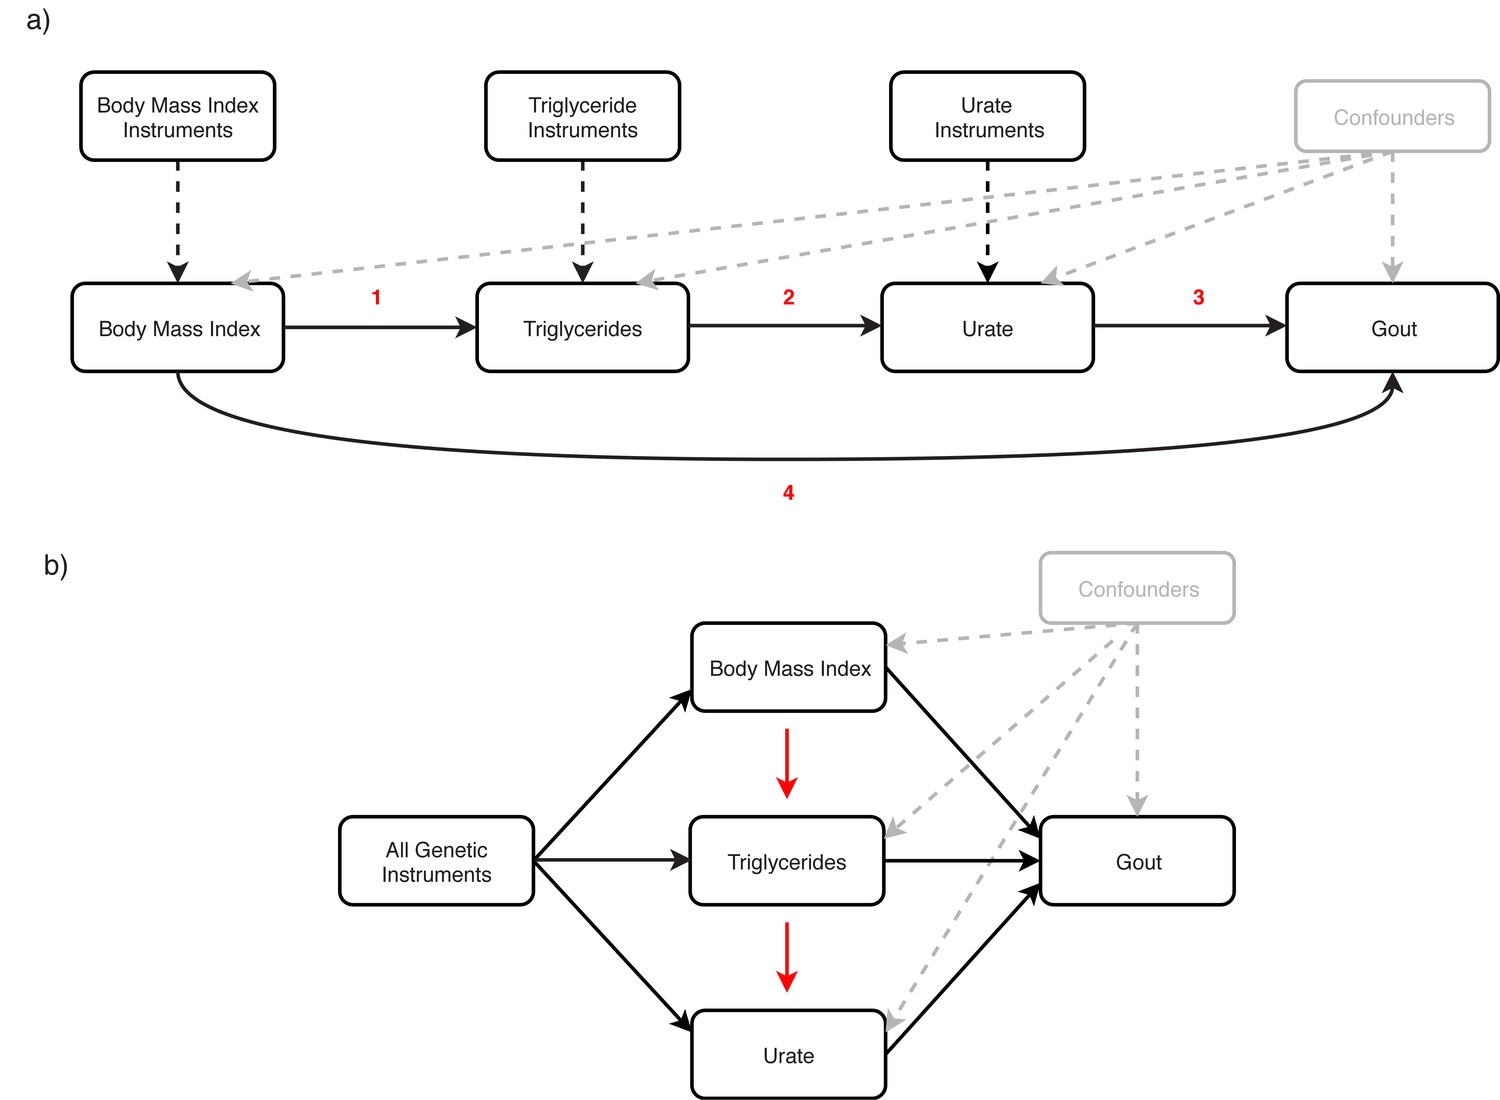
Applying (a) mediation and (b) multivariable Mendelian randomization investigate the causal effect of body mass index, triglycerides and urate on gout risk.
(a) Mediation Mendelian randomization (MR) framework to investigate whether urate mediates the effect of body mass index (BMI) and triglycerides (TG) on gout risk. The various analyses undertaken suggest that 1) elevated BMI increases TG levels 2) which subsequently has an effect on urate 3) and this in turn influences gout risk. This mediation pathway may help explain the manner by which BMI, potentially driven by lifestyle factors such as diet, is a risk factor for gout. (b) Multivariable MR framework attempting to reproduce findings from the mediation analysis. Genetic instruments for BMI, TG and urate were analysed simultaneously to evaluate the joint effect of these risk factors on gout risk. The effect of BMI and TG on gout risk attenuated compared to univariable analyses, suggesting that they influence gout risk through increased urate levels. Investigating each combination of pairwise risk factors using this framework suggested that BMI influences TG rather than the opposite direction of effect, which also supports findings from the mediation analysis.
Appendix 1—figure 1
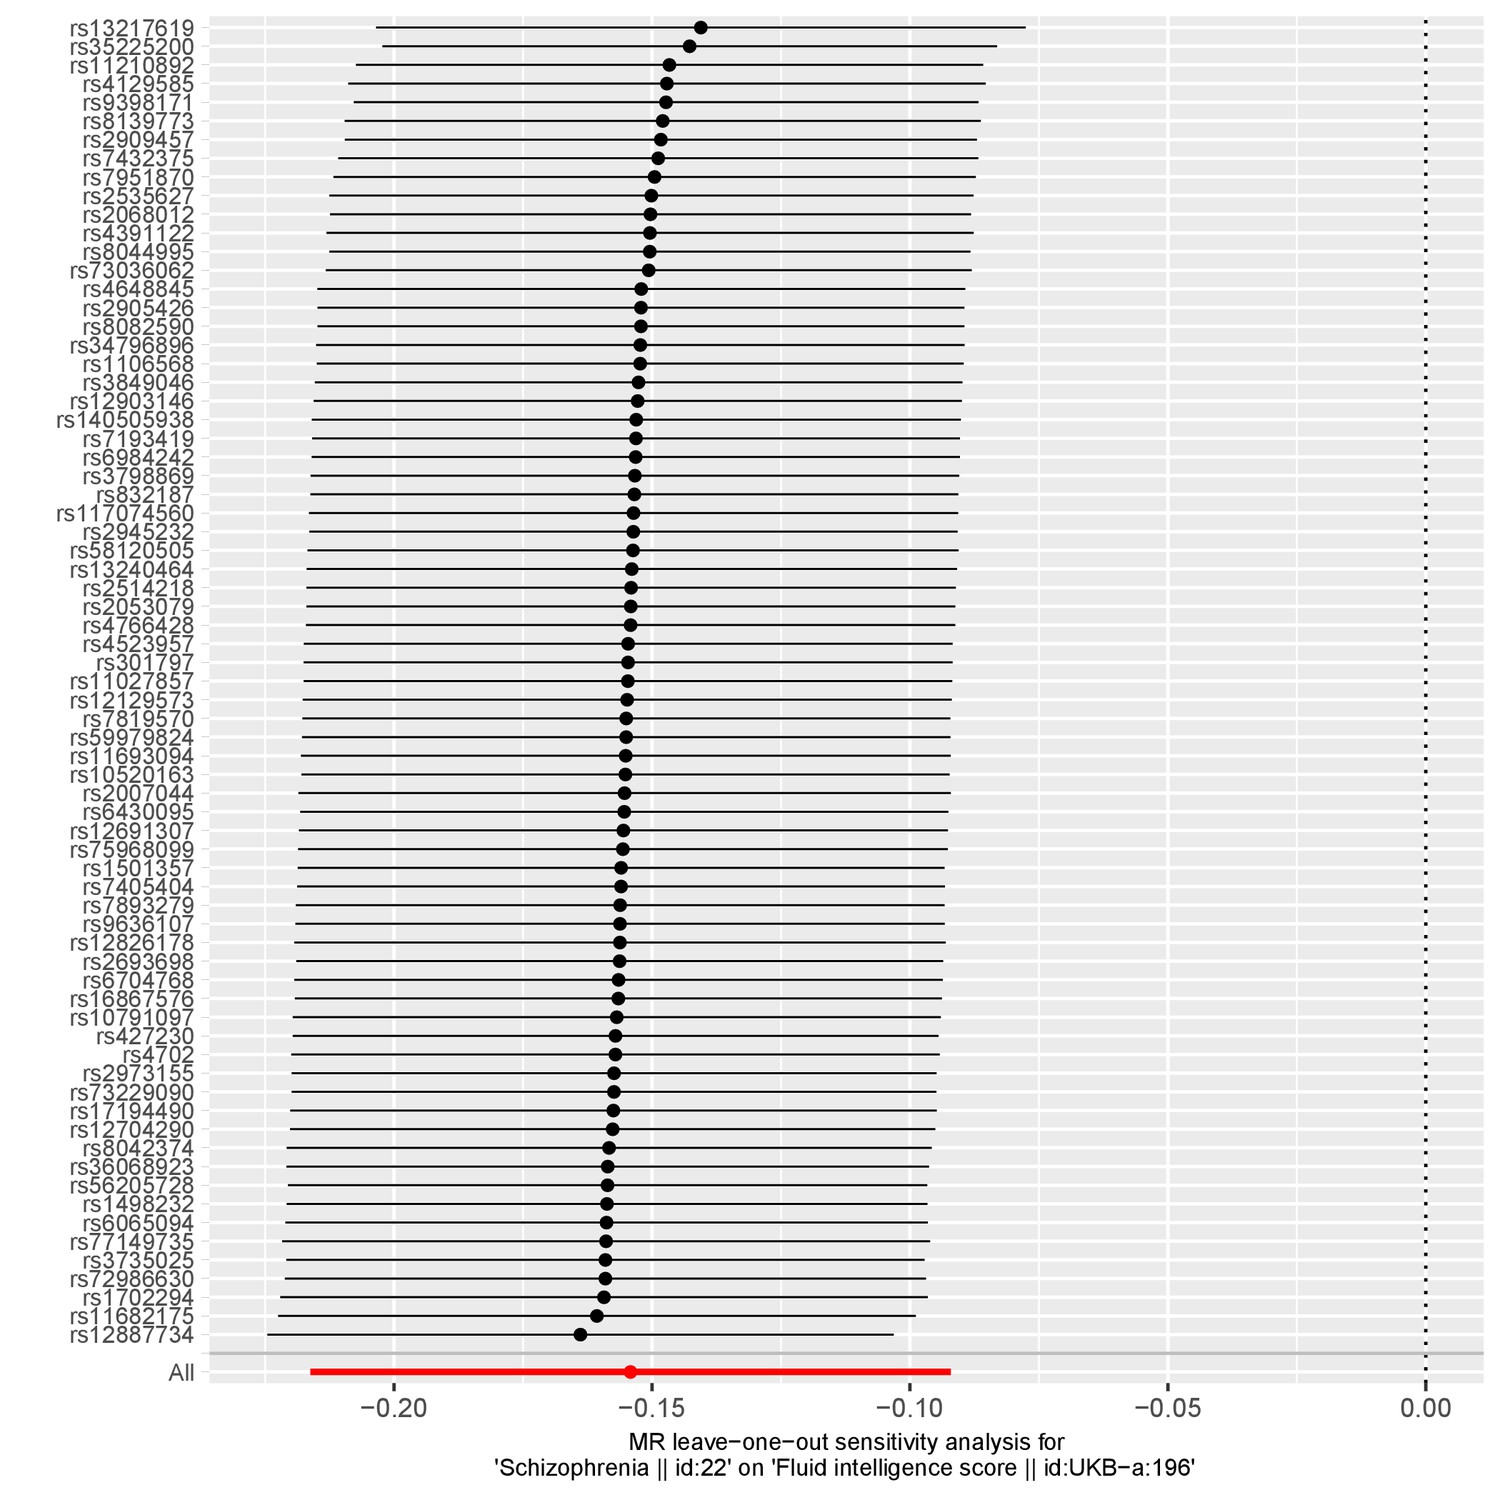
A plot illustrating a leave-one out analysis between schizophrenia genetic liability and fluid intelligence.
https://doi.org/10.7554/eLife.43657.011
Appendix 1—figure 2
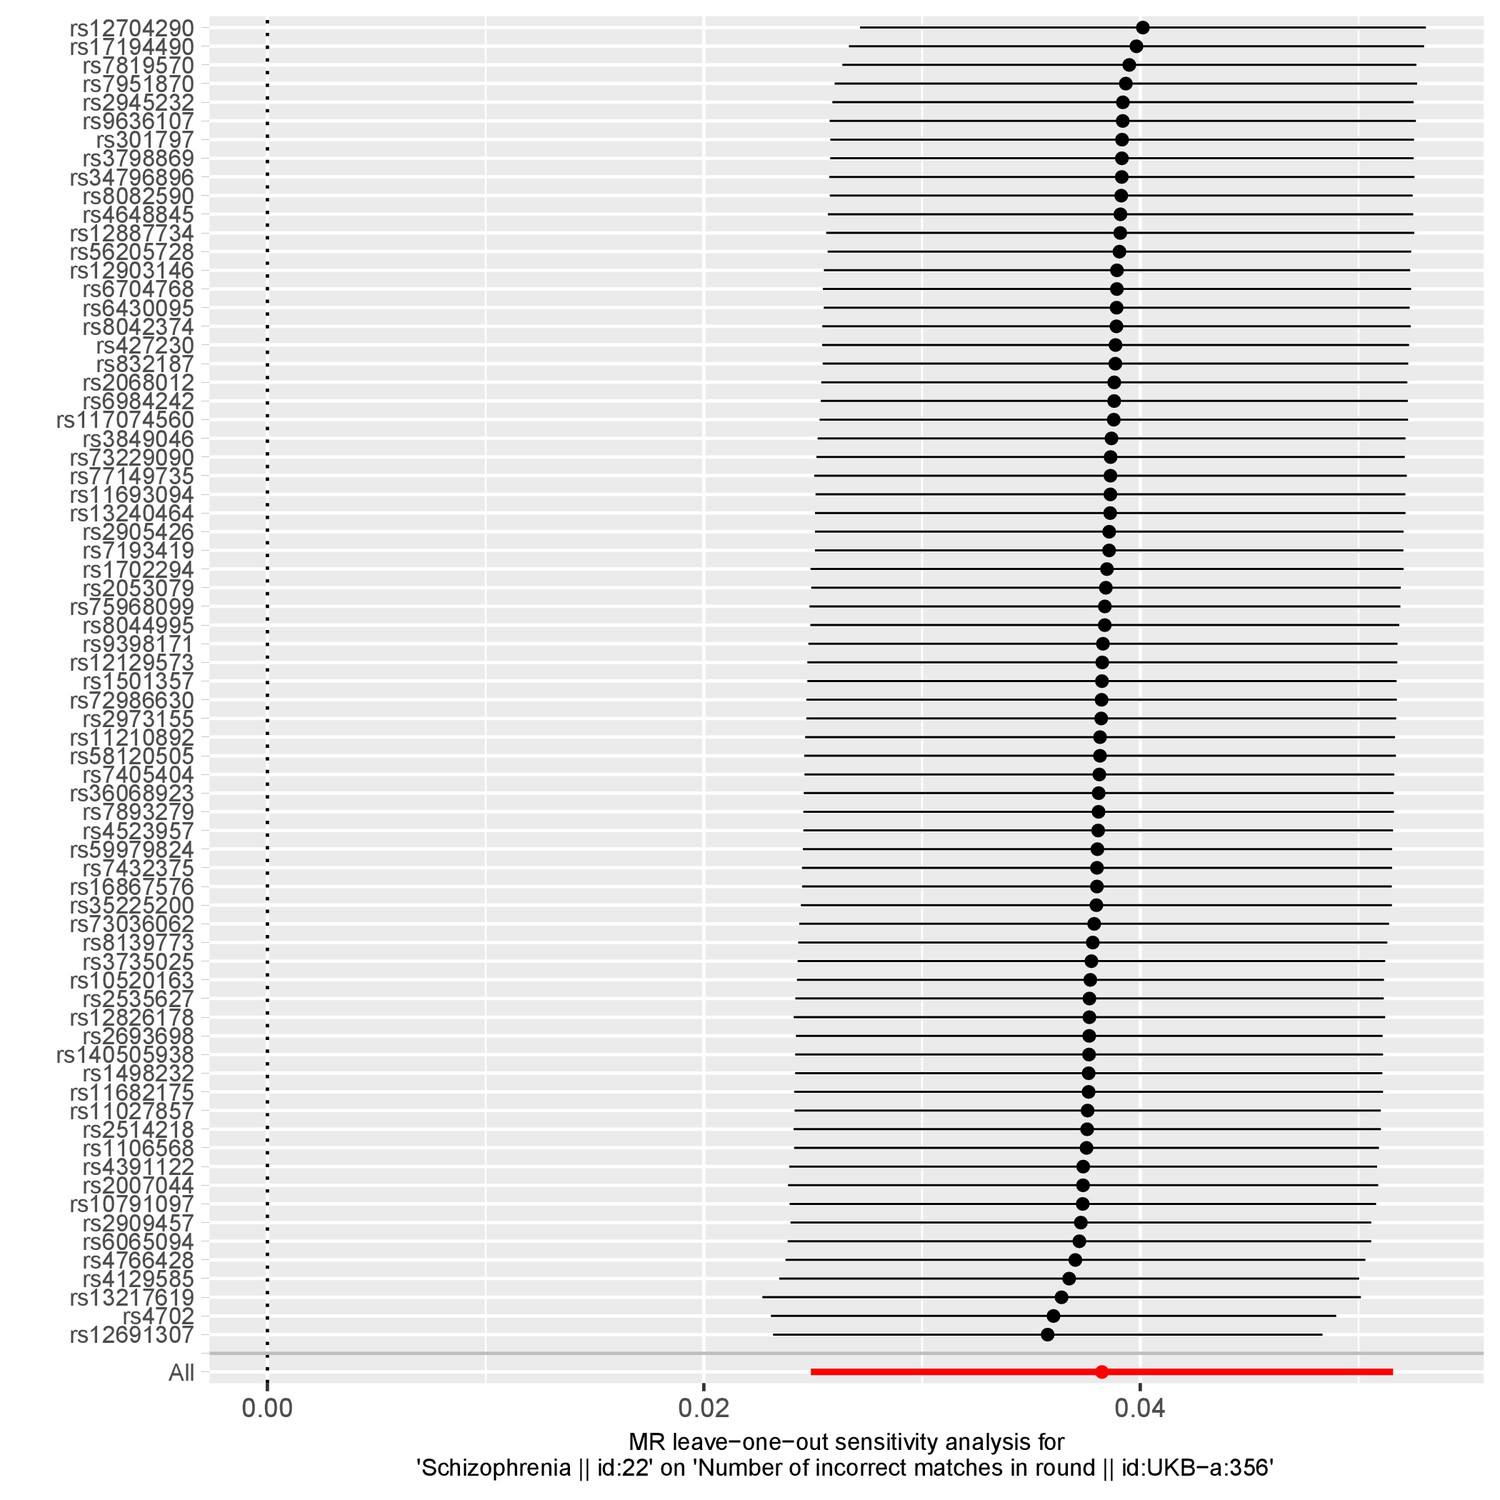
A plot illustrating a leave-one out analysis between schizophrenia genetic liability and ‘number of incorrect matches in a round’.
https://doi.org/10.7554/eLife.43657.012
Appendix 1—figure 3
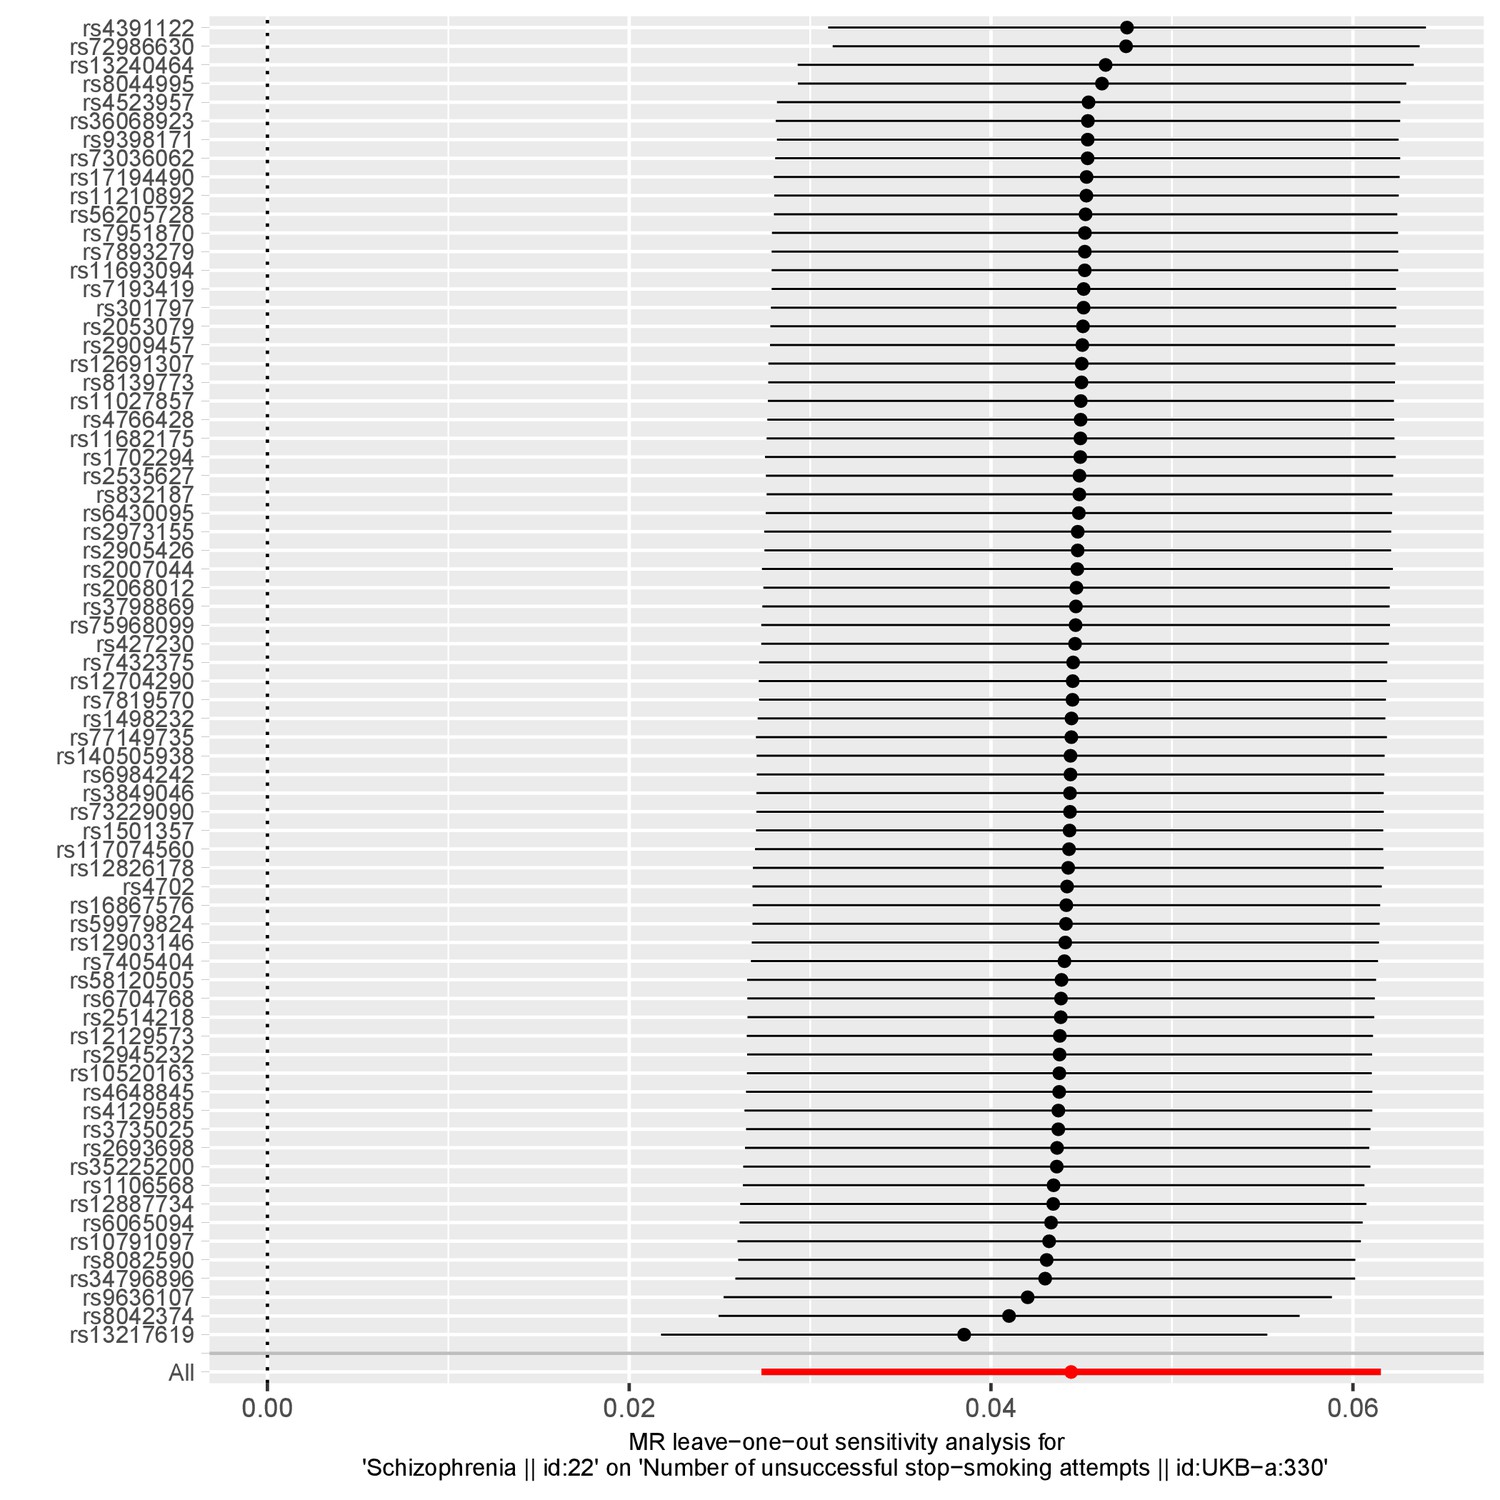
A plot illustrating a leave-one out analysis between schizophrenia genetic liability and ‘number of unsuccessful smoking attempts’.
https://doi.org/10.7554/eLife.43657.013
Appendix 1—figure 4
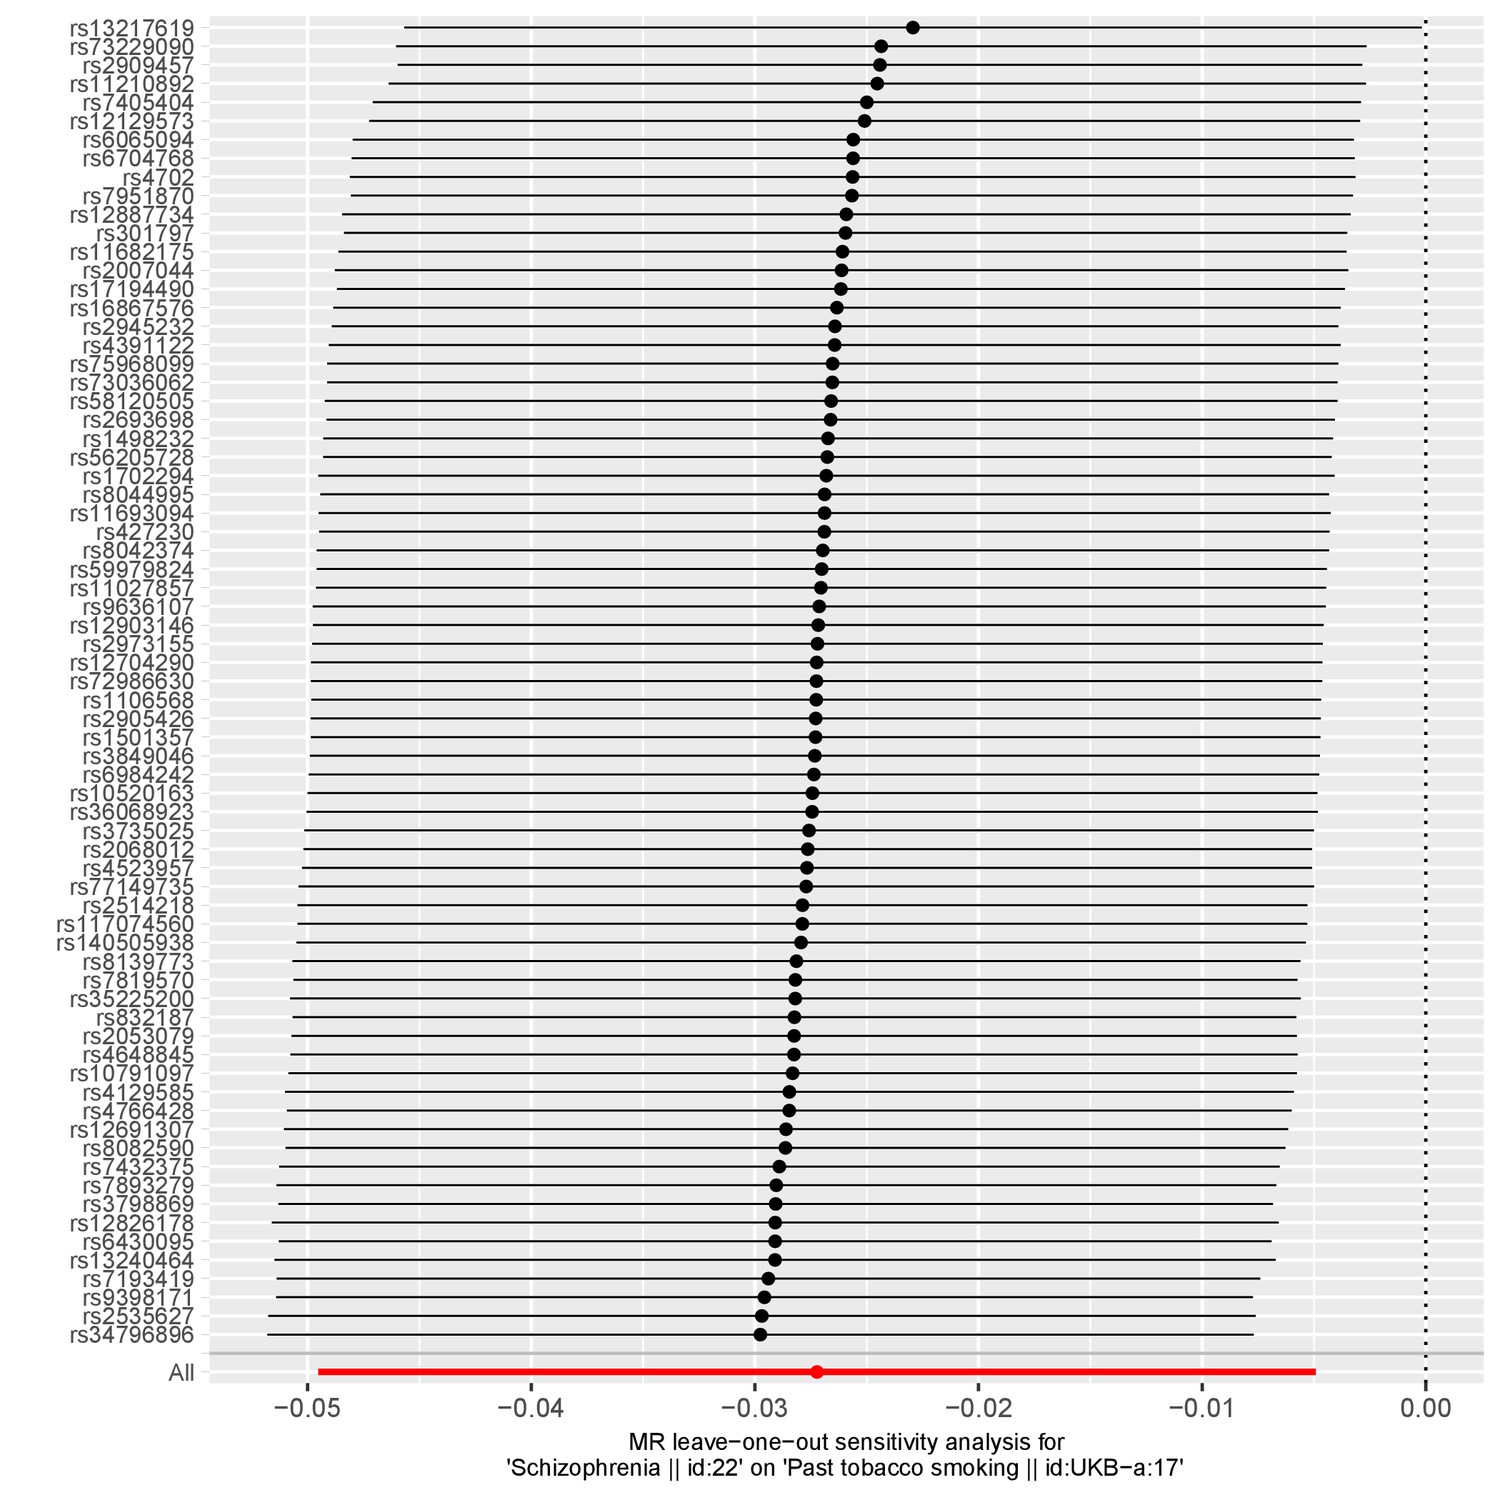
A plot illustrating a leave-one out analysis between schizophrenia genetic liability and past tobacco smoking.
https://doi.org/10.7554/eLife.43657.014
Appendix 1—figure 5
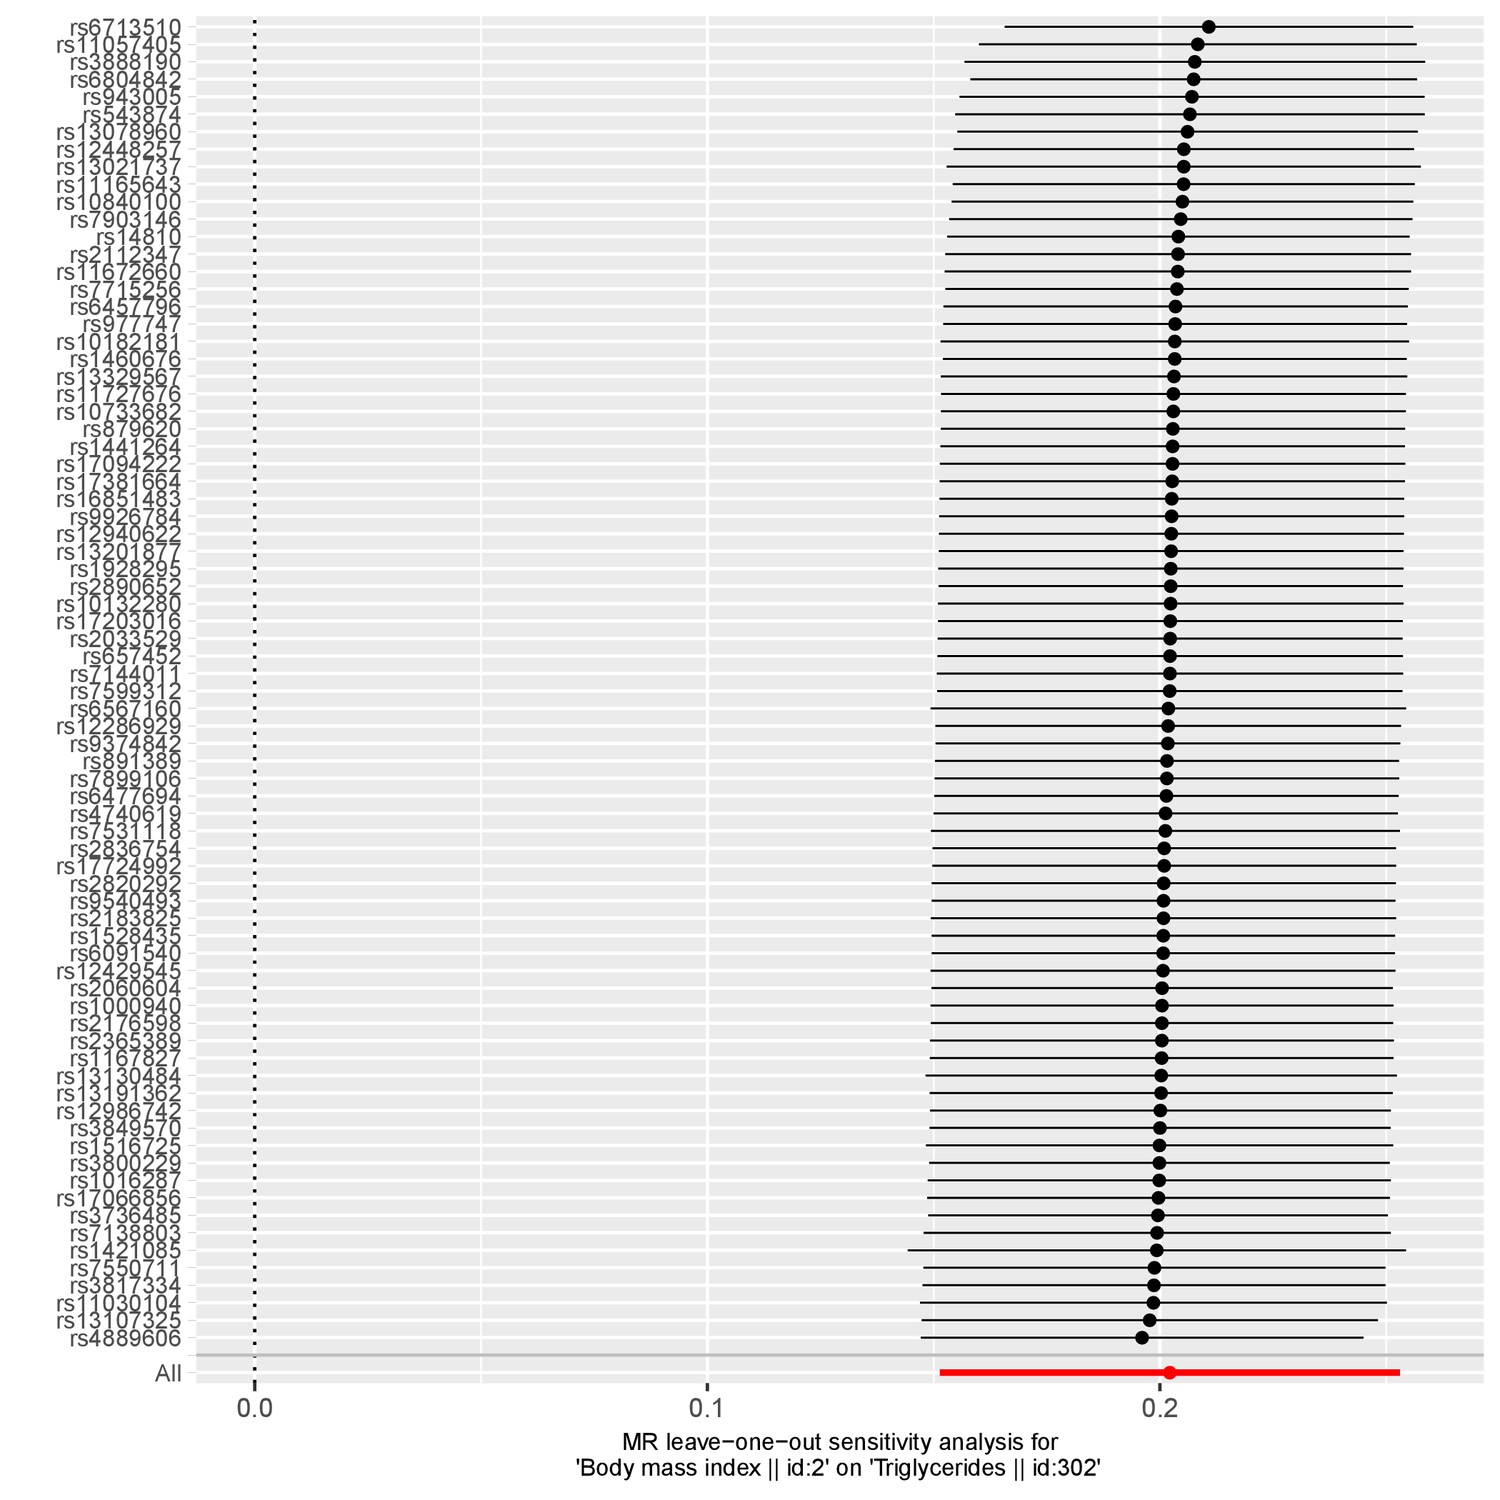
A plot illustrating a leave-one out analysis between body mass index and triglycerides.
https://doi.org/10.7554/eLife.43657.015
Appendix 1—figure 6
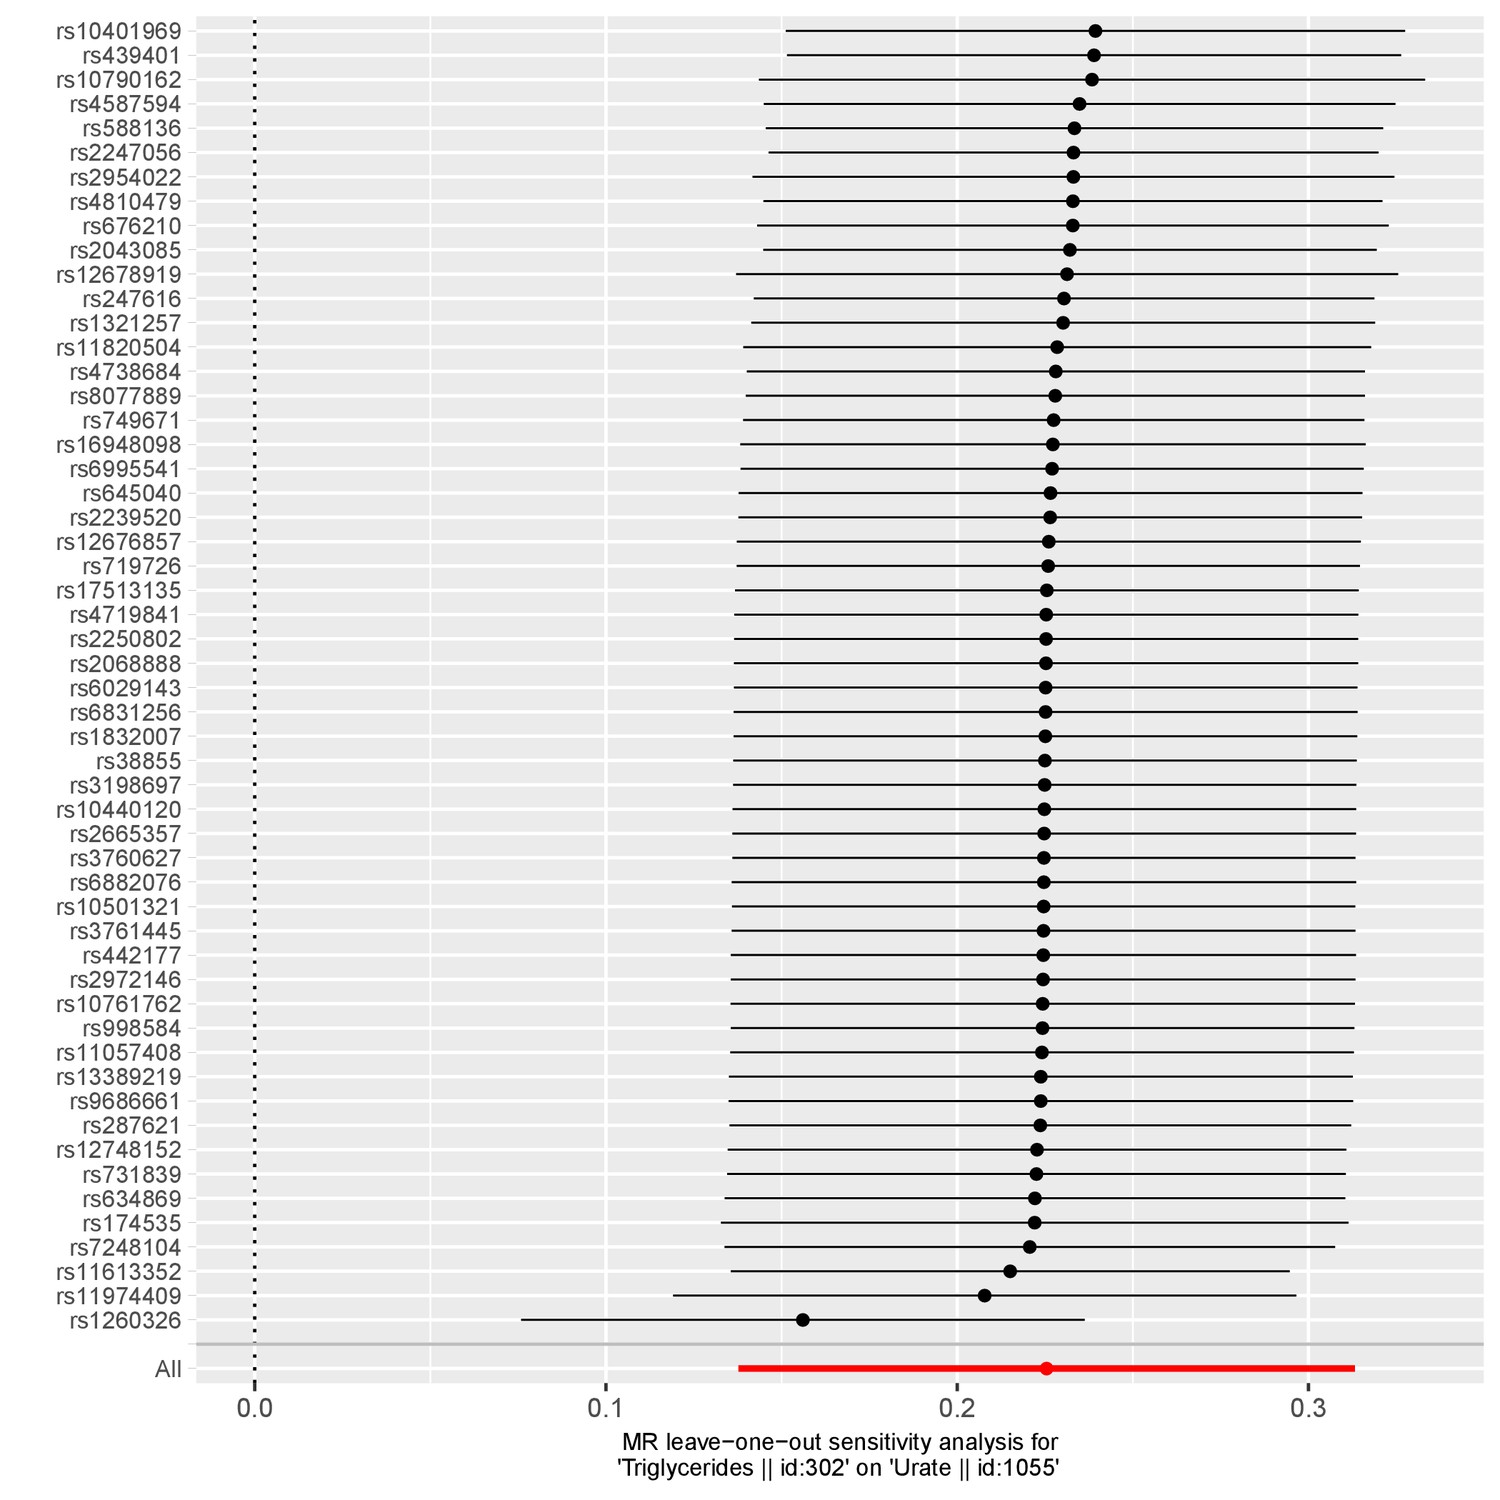
A plot illustrating a leave-one out analysis between triglycerides and urate.
https://doi.org/10.7554/eLife.43657.016
Appendix 1—figure 7
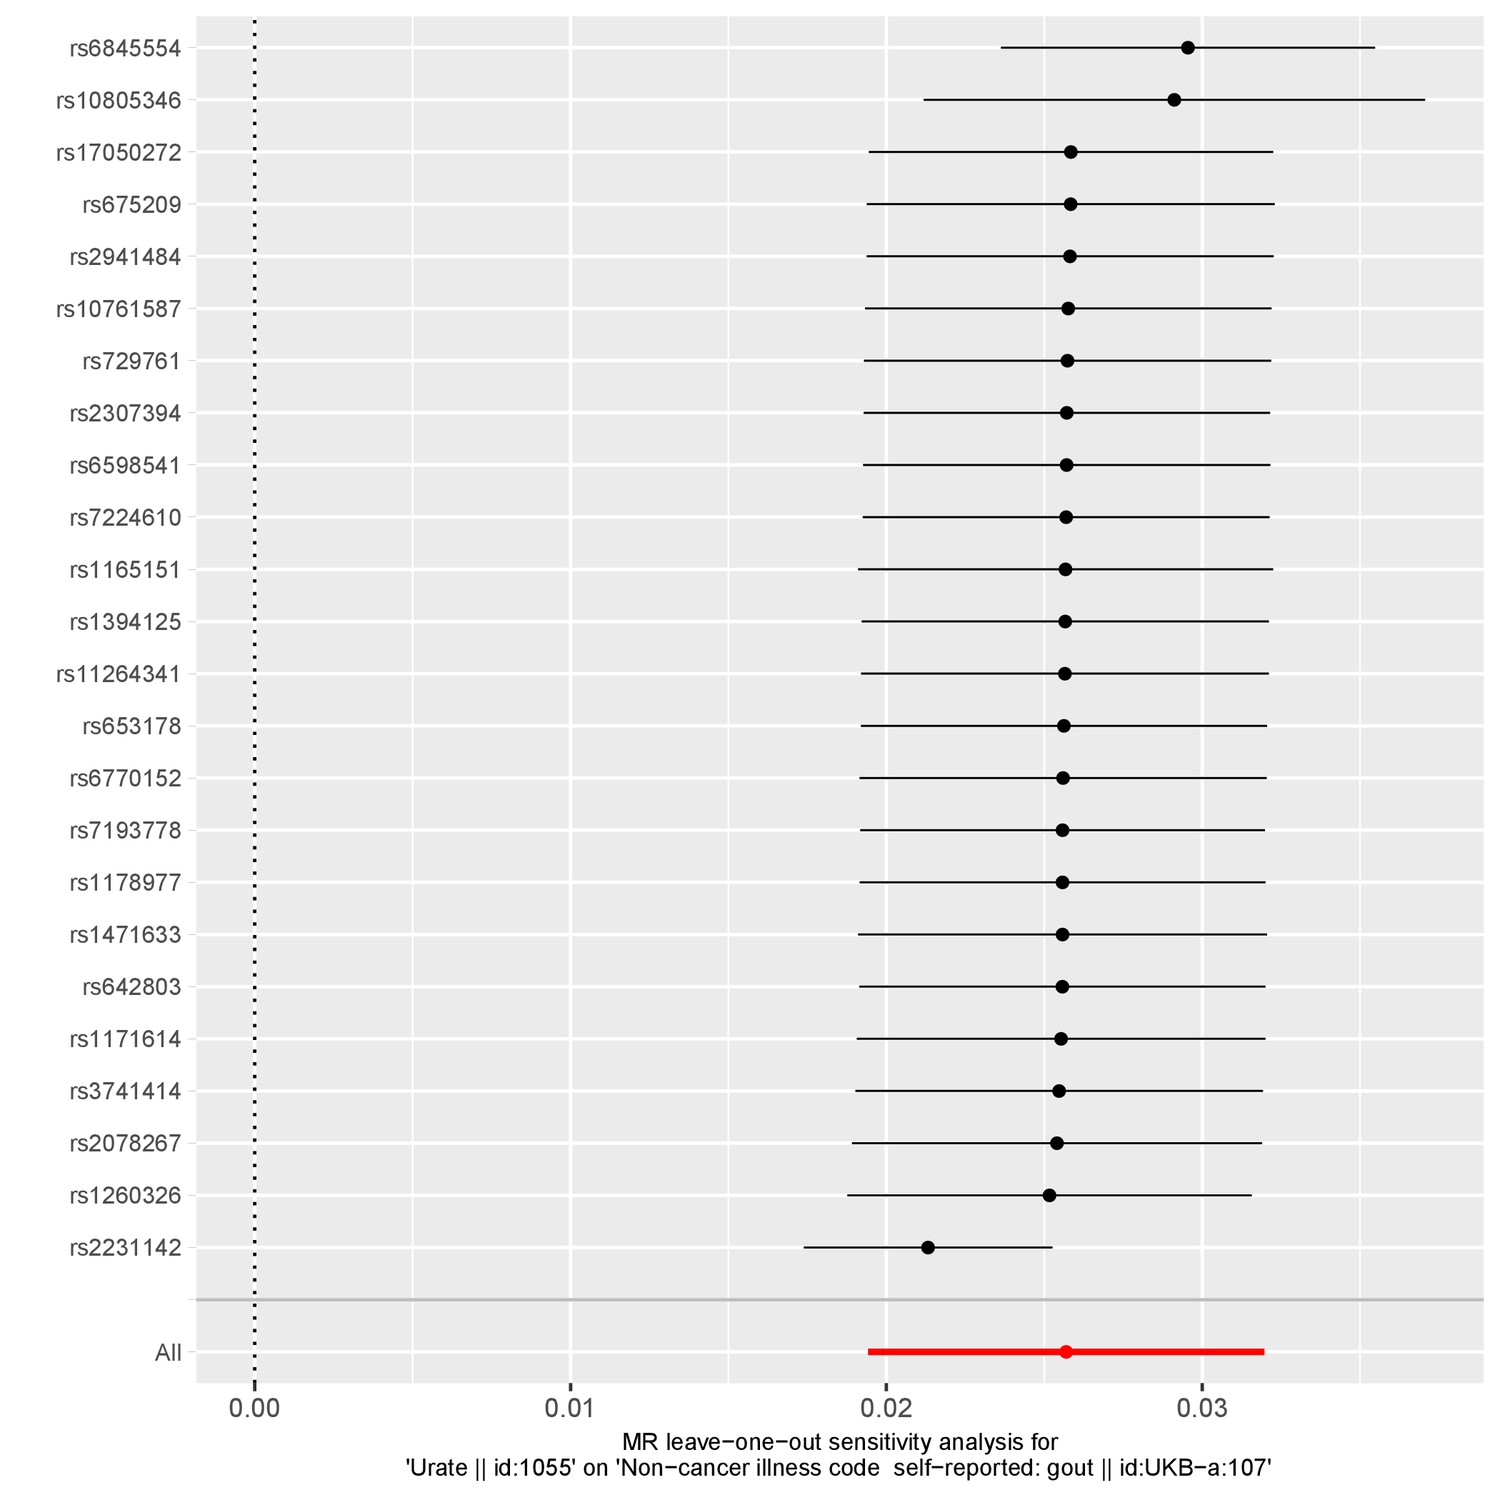
A plot illustrating a leave-one out analysis between urate and gout.
https://doi.org/10.7554/eLife.43657.017
Appendix 1—figure 8
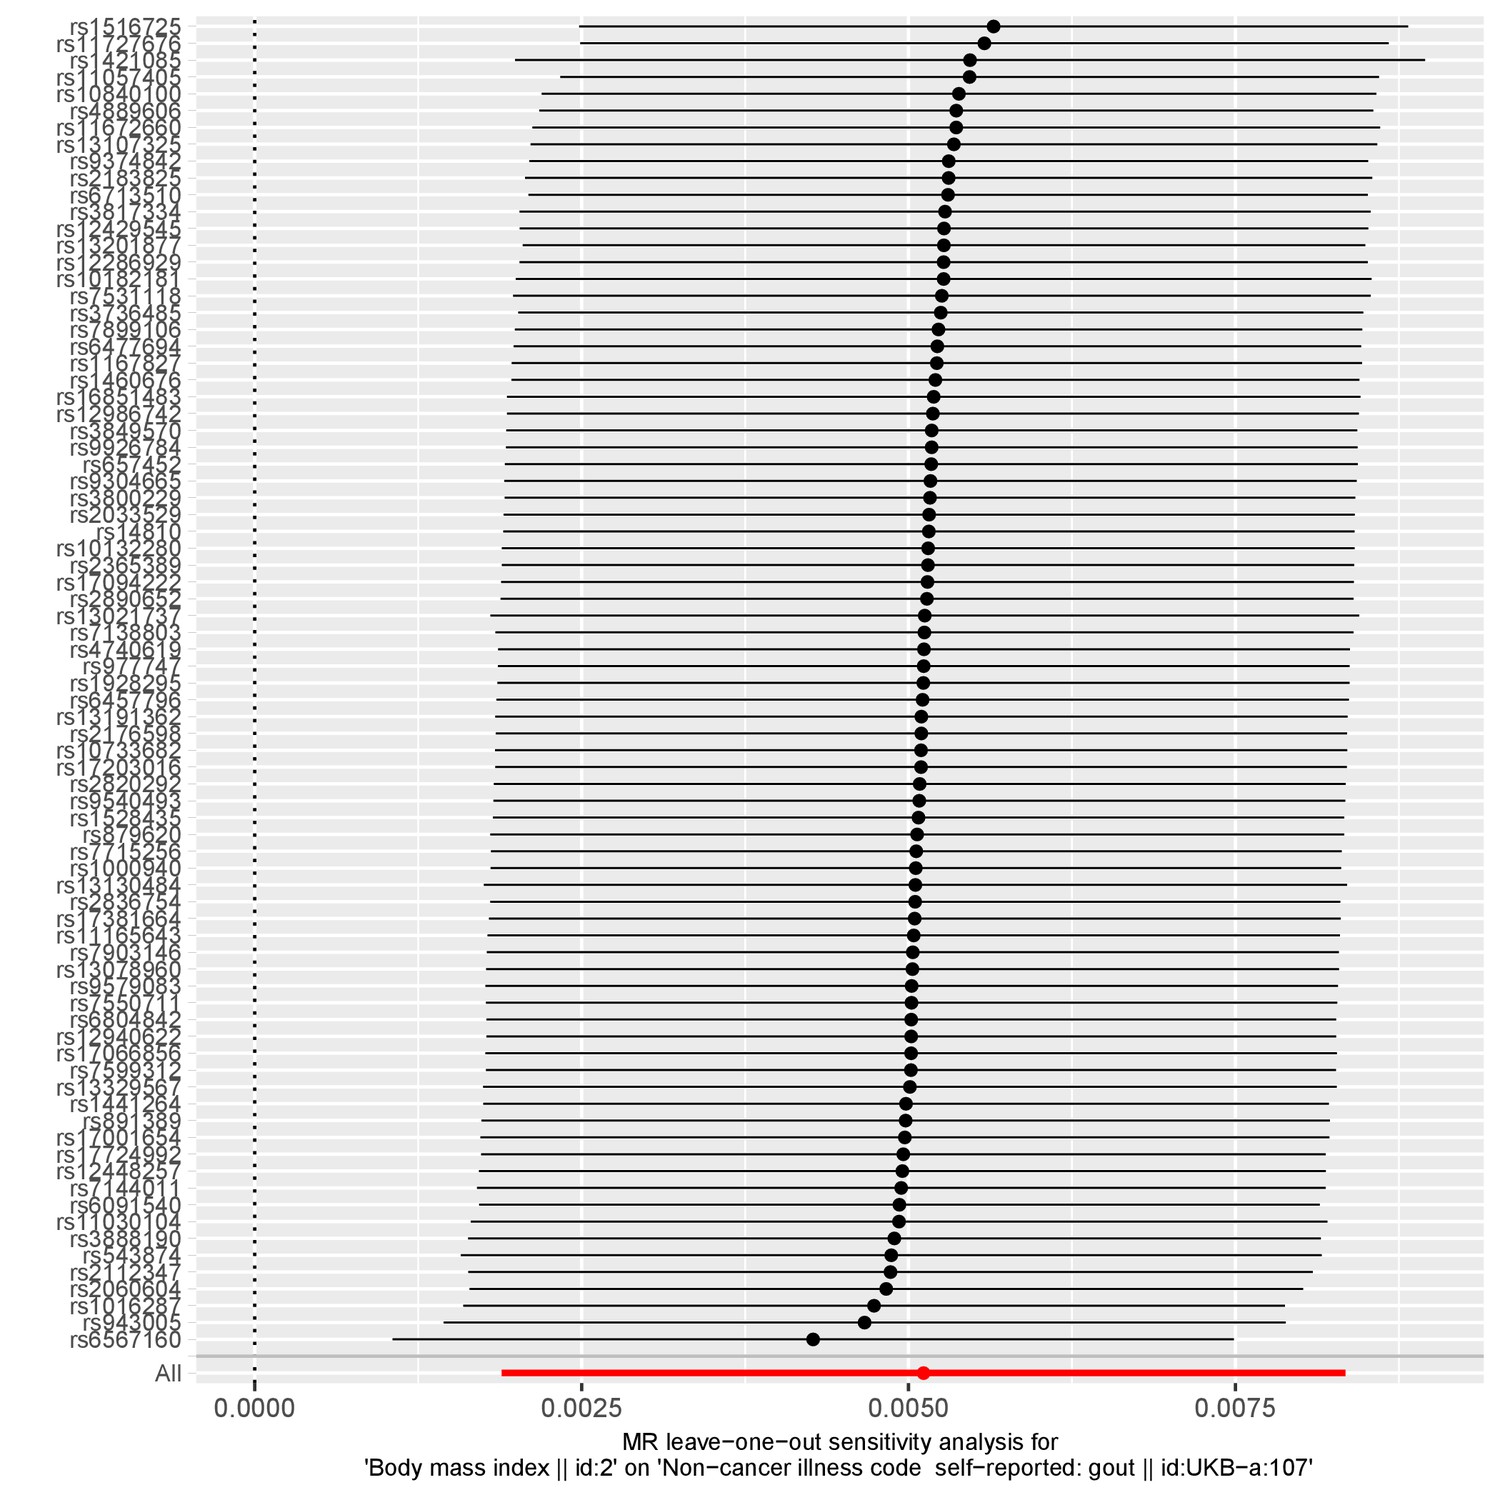
A plot illustrating a leave-one out analysis between body mass index and gout.
https://doi.org/10.7554/eLife.43657.018Additional files
-
Supplementary file 1
Supplementary Tables.
Supplementary file 1a: A list of the 162 traits and corresponding GWAS identified to construct polygenic risk scores. Supplementary file 1b: A list of the 551 complex traits analysed in the UK Biobank study. Supplementary file 1c: An evaluation of weighted and unweighted PRS where samples overlap between discovery and application. Supplementary file 1d: A phenome-wide evaluation of schizophrenia genetic liability. Supplementary file 1e: Mendelian randomization analysis to investigate the effect of schizophrenia genetic liability on neurological traits. Supplementary file 1f: Mendelian randomization analysis to investigate the effect of neurological traits on schizophrenia risk. Supplementary file 1g: Mendelian randomization analysis to investigate the effect of schizophrenia genetic liability on cognitive traits. Supplementary file 1h: Mendelian randomization analysis to investigate the effect of cognitive traits on schizophrenia risk. Supplementary file 1i: Mendelian randomization analysis to investigate the effect of schizophrenia genetic liability on smoking traits. Supplementary file 1j: Mendelian randomization analysis to investigate the effect of smoking traits on schizophrenia risk. Supplementary file 1k: Mendelian randomization analysis to investigate the effect of schizophrenia genetic liability on body mass index. Supplementary file 1l: Mendelian randomization analysis to investigate the effect of body mass index on schizophrenia risk. Supplementary file 1m: A genetic-liability phenome scan for self-reported gout. Supplementary file 1n: Mendelian randomization analysis to investigate the effect of body mass index on triglycerides, urate and gout. Supplementary file 1o: Mendelian randomization analysis to investigate the effect of triglycerides on body mass index, urate and gout. Supplementary file 1p: Mendelian randomization analysis to investigate the effect of urate on body mass index, triglycerides and gout. Supplementary file 1q: Multivariable Mendelian randomization analysis to investigate the effect of body mass index, triglycerides and urate on gout risk. Supplementary file 1r: Multivariable Mendelian randomization analysis to investigate the effect of body mass index and urate on gout risk. Supplementary file 1s: Multivariable Mendelian randomization analysis to investigate the effect of triglycerides and urate on gout risk. Supplementary file 1t: Multivariable Mendelian randomization analysis to investigate the effect of body mass index and triglycerides on gout risk.
- https://doi.org/10.7554/eLife.43657.008
-
Transparent reporting form
- https://doi.org/10.7554/eLife.43657.009
Download links
A two-part list of links to download the article, or parts of the article, in various formats.
Downloads (link to download the article as PDF)
Open citations (links to open the citations from this article in various online reference manager services)
Cite this article (links to download the citations from this article in formats compatible with various reference manager tools)
An atlas of polygenic risk score associations to highlight putative causal relationships across the human phenome
eLife 8:e43657.
https://doi.org/10.7554/eLife.43657


