Transitioning between preparatory and precisely sequenced neuronal activity in production of a skilled behavior
- UT Southwestern Medical Center, United States
- The University of Tokyo, Japan
- University of Zurich/ETH Zurich, Switzerland
- Texas Christian University, United States
- Neuroscience Center Zurich (ZNZ), Switzerland
- Korea Brain Research Institute, Republic of Korea
- Emory University, United States
Figures
Figure 1 with 1 supplement
Population imaging of song-related HVCRA sequences.
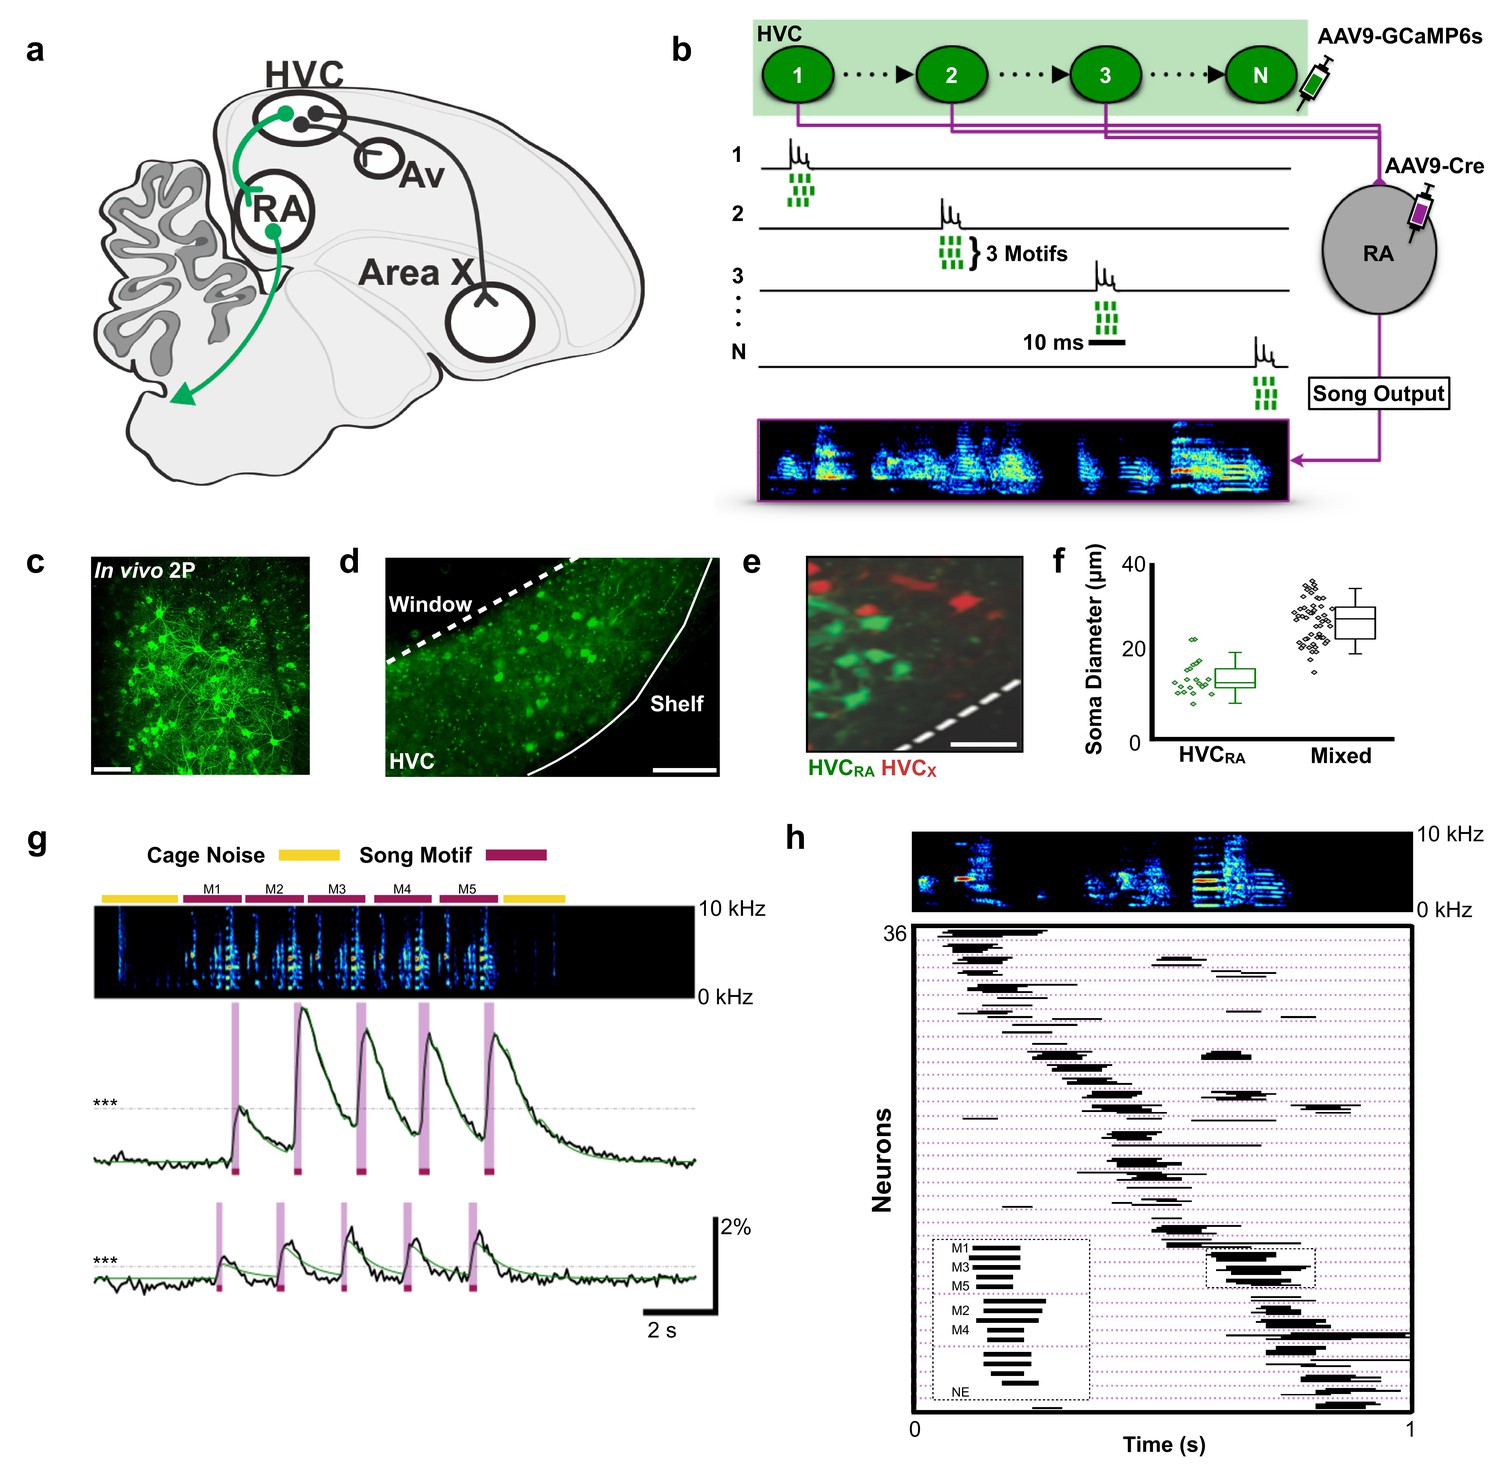
(a) Diagram showing three distinct projection neuron targets of the vocal premotor nucleus HVC. The projection neurons connecting HVC to the downstream motor nucleus RA (HVCRA neurons) are shown in green. Auditory region Avalanche (Av), robust nucleus of the arcopallium (RA), nucleus HVC of the nidopallium (HVC). (b) Schematic showing HVCRA neuron somata (green) and their outputs (magenta) to the downstream motor nucleus RA. AAV9-Flex-CAG-GCaMP6s was injected into HVC (green syringe) and AAV9-CAG-Cre was injected into RA (magenta syringe) to selectively label HVCRA neurons. (c) In vivo two-photon maximum density projection of retrogradely labeled HVCRA neurons expressing GCaMP6s. Scale bar = 100 µm. (d) A cross-section of HVC showing GCaMP6s-labeled HVCRA neurons (green). The dashed line indicates where the cranial window was made over HVC. Note the lack of labeling in the region directly ventral of HVC, known as the HVC shelf. Scale bar = 100 µm. (e) A sagittal section of HVC showing HVCRA neurons (green) and retrogradely labeled HVCX neurons (red). The dashed line indicates the border between HVC and HVC shelf. Scale bar = 50 µm. (f) Whisker and scatter plots of soma diameters of GCaMP6s expressing cells show that retrogradely labeled HVCRA neurons (green) have smaller diameters than neurons labeled using only direct viral injections (AAV9-CAG-GCaMP6s) into HVC (mixed population neurons, black). Boxes depict 25th and 75th percentiles, whiskers depict SD. HVCRA: N = 21 neurons; mean diameter = 14.0 ± 3.8 µm (SD); Mixed: N = 52 neurons; mean = 26.9 ± 4.9 µm; t = −10.7, p=2.0×10⁻¹⁶, two-sample t test. (g) Example calcium traces from 2 HVCRA neurons in a bird that sang five consecutive motifs. Shown are the background-subtracted traces (black) and the inferred calcium traces (green). The magenta overlays indicate the rise time (intervals between onset and peak times) of the recorded calcium transients. The horizontal dashed line (gray) denotes 3 SD above baseline activity. The bars above the spectrogram denote cage noise associated with birds hopping or flapping their wings (yellow) or production of song motifs (red). (h) Motif-related activity of 36 HVCRA neurons across five motifs. Each row shows activity of a neuron from one trial. The dashed magenta lines separate different neurons. Empty spaces indicate trials wherein neurons were not active (no event, NE). The inset shows a zoom-in of activity from three separate HVCRA neurons.
-
Figure 1—source data 1
Raw soma diameter measurements for Figure 1F.
- https://doi.org/10.7554/eLife.43732.004
Figure 1—figure supplement 1
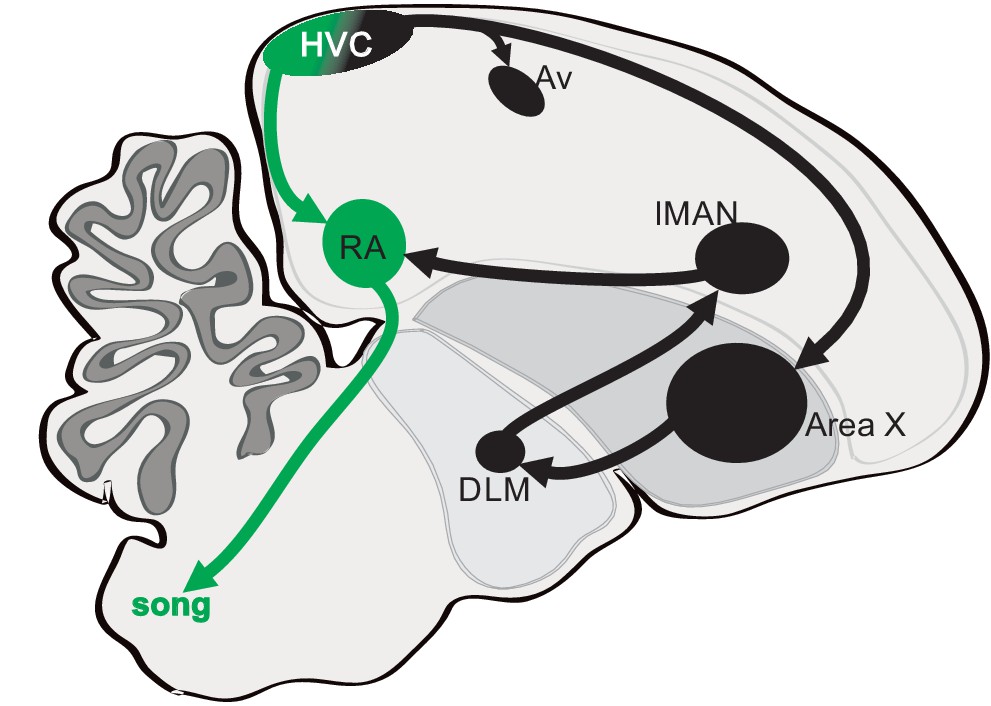
Diagram showing three distinct projection neuron targets of the vocal premotor nucleus HVC.
The projection neurons connecting HVC to the downstream motor nucleus RA (HVCRA neurons) are shown in green and pathways to the striatopallidal region Area X and the auditory region Avalanche (Av) are shown in black. Area X relays through the medial portion of the dorsolateral thalamus (DLM) and the lateral magnocellular nucleus of the anterior nidopallium (LMAN) and then onto RA.
Figure 2 with 11 supplements
Most HVCRA neurons exhibit peri-song activity.
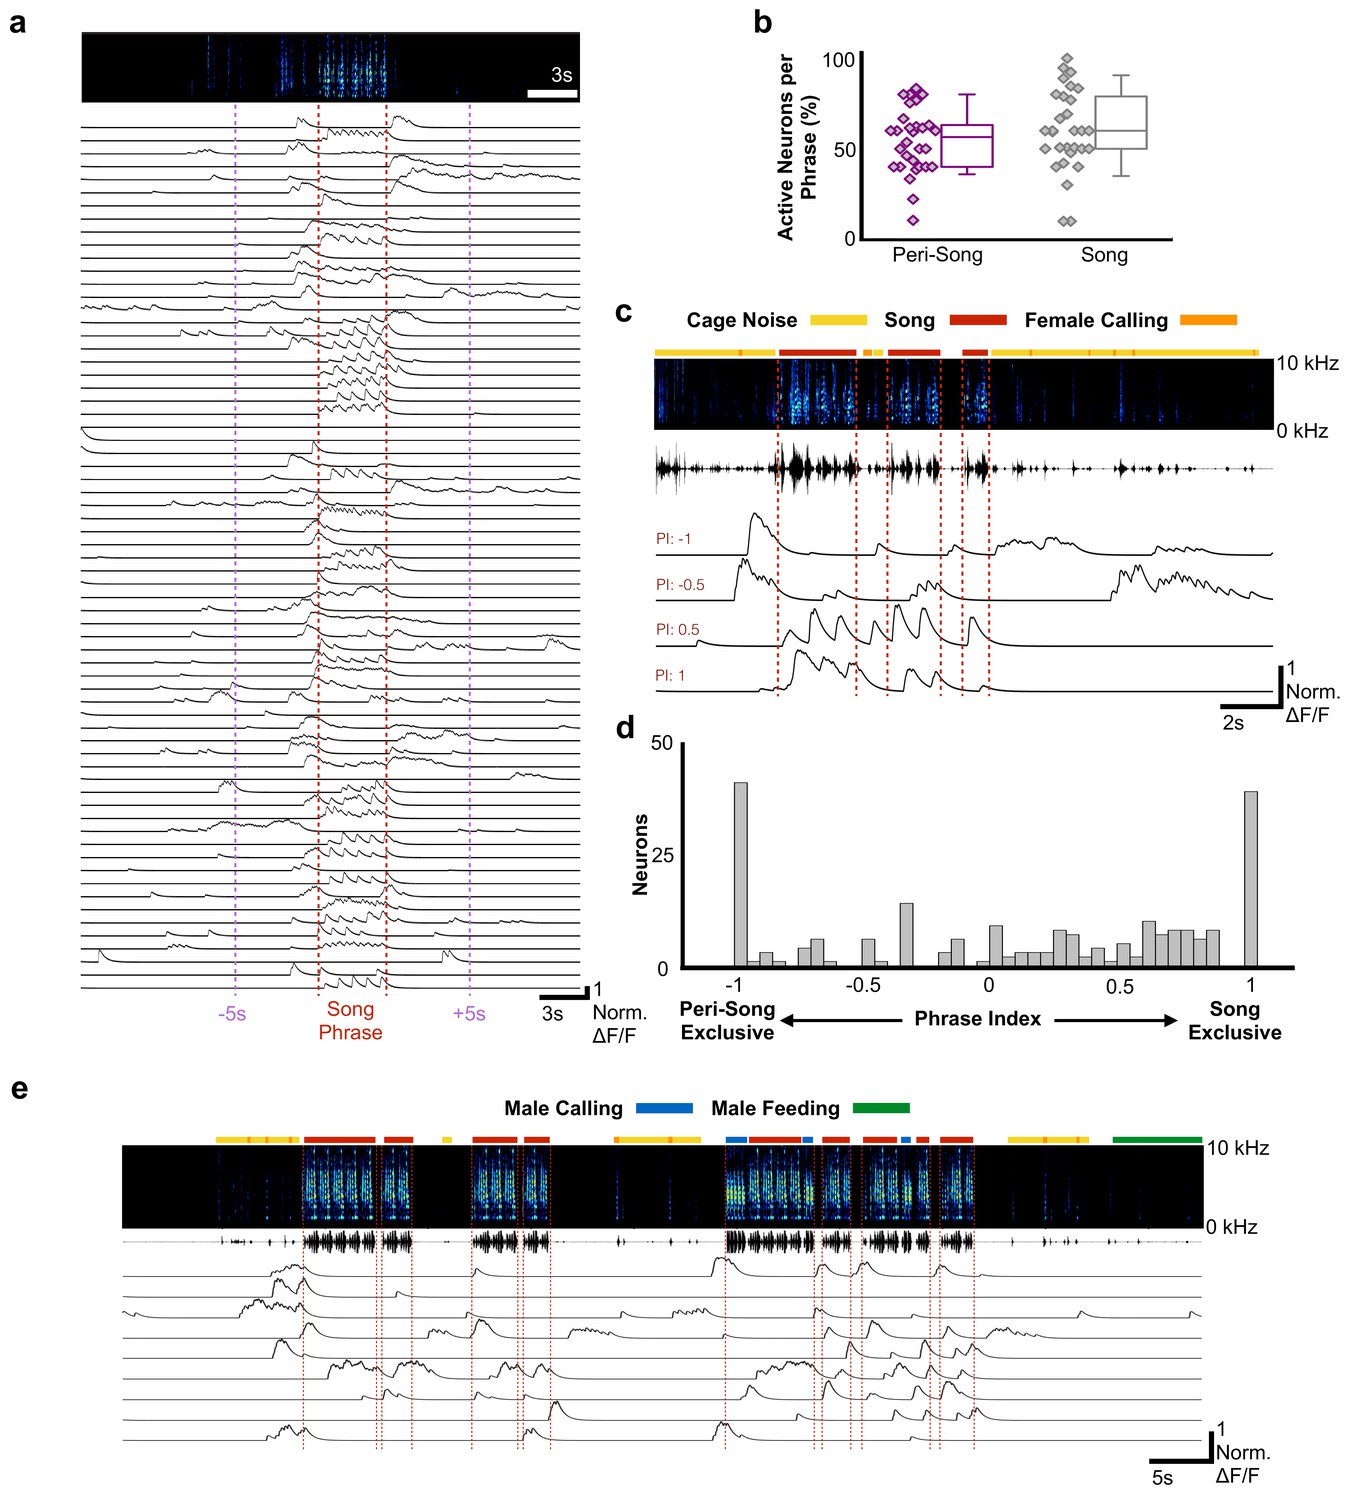
(a) Normalized calcium transients from 67 simultaneously recorded HVCRA neurons during production of a song phrase. The red dashed lines delimit five consecutive motifs. (b) Percentages of active neurons during peri-song (54.3 ± 17.8%, SD, purple) and song (59.9 ± 22.5%, gray) are similar (30 phrases, t = −1.1, p=0.29 paired two-sample t test). Box plots show the median, 25th and 75th percentiles with whiskers showing ±1.5 interquartile range (IQR). (c) Sample neurons with diverse phrase indices ranging from −1 to 1 and their corresponding calcium traces during 6 motifs over three bouts. Dashed lines indicate bout onsets and offsets. Bars above spectrogram indicate the presence of cage noise related to hopping and wing flapping (yellow) or female calling (FC, orange). (d) Histogram of phrase indices for all 223 neurons from six birds. (e) Undirected song from a different male showing periods of cage noise or hopping behavior (yellow) and feeding behavior (green). Blue boxes indicate the male calling. Red dashed lines indicate onsets and offsets of song bouts.
-
Figure 2—source data 1
Raw active neuron numbers for Figure 2B.
- https://doi.org/10.7554/eLife.43732.018
-
Figure 2—source data 2
Raw neuron phrase index values for Figure 2D.
- https://doi.org/10.7554/eLife.43732.019
Figure 2—figure supplement 1
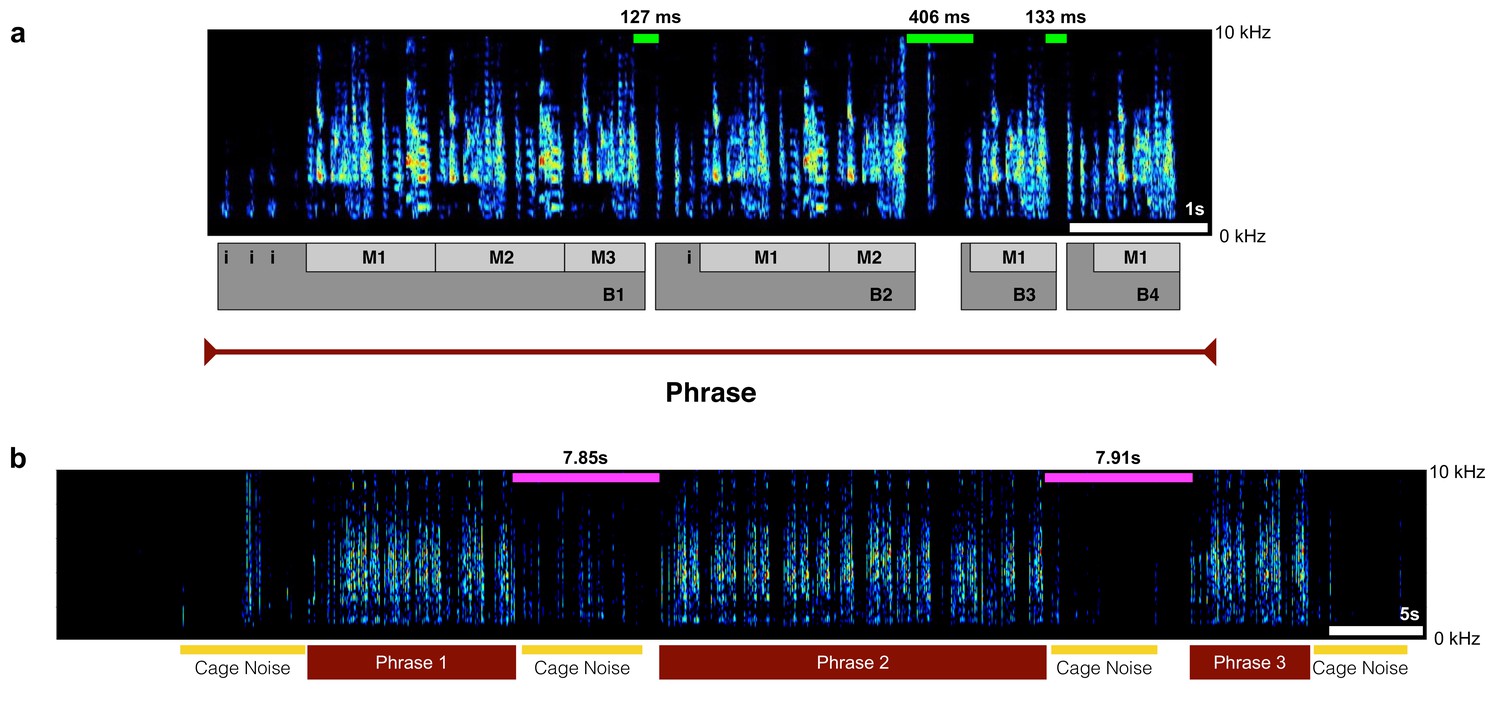
Description of motifs, bouts, and phrases underlying zebra finch courtship song structure.
(a) A spectrogram of a single song phrase composed of 4 bouts and seven motifs (Bout 1: three motifs, Bout 2: two motifs, Bout 3: one motif, Bout 4: one motif). Green bars on top of spectrogram indicate representative silent periods between bouts and numbers above indicate duration in milliseconds. (b) A spectrogram highlighting a trial where the bird sang three different phrases. The magenta bars above the spectrogram indicate silent periods between phrases and the numbers above indicate duration in seconds. Yellow bars below spectrogram indicate cage noise.
Figure 2—figure supplement 2
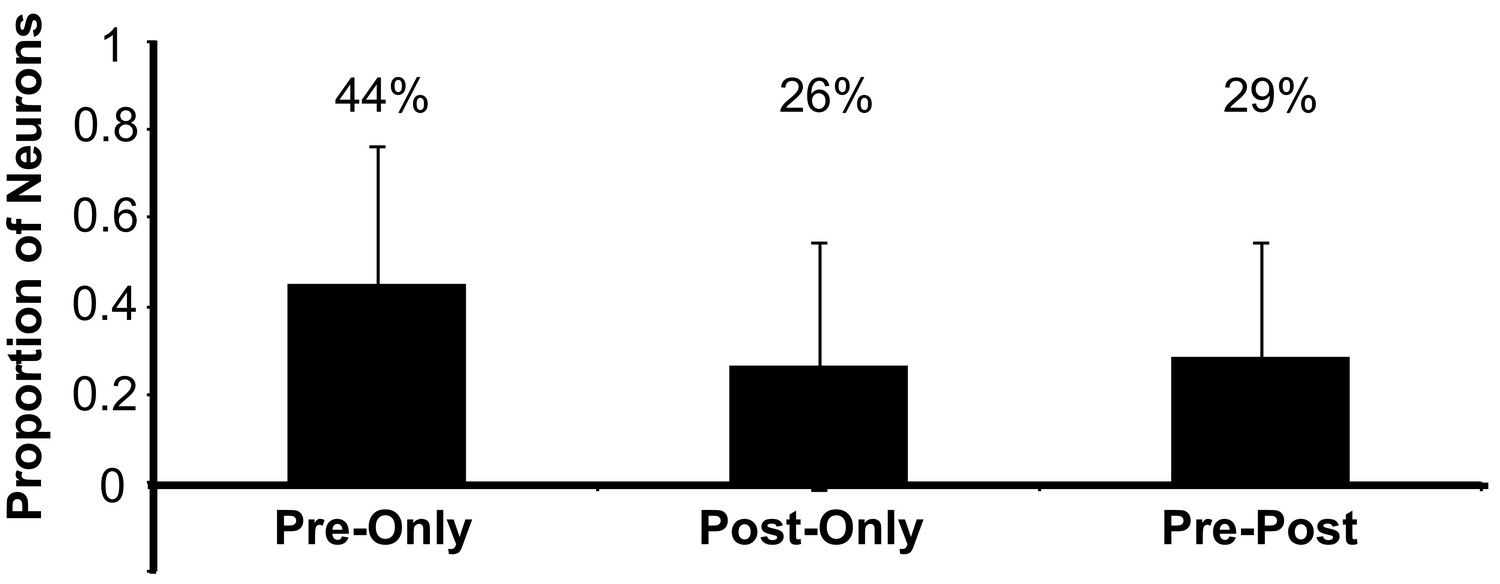
Proportion of imaged neurons by bird (N = 6 birds, 197 neurons) that exhibited calcium events only before song onset calcium events (Pre-only, 0.44 ± 0.31, SD), only after song offset calcium events (Post-only, 0.26 ± 0.28), or were active before and after song (Pre-Post, 0.29 ± 0.25).
https://doi.org/10.7554/eLife.43732.008
Figure 2—figure supplement 3
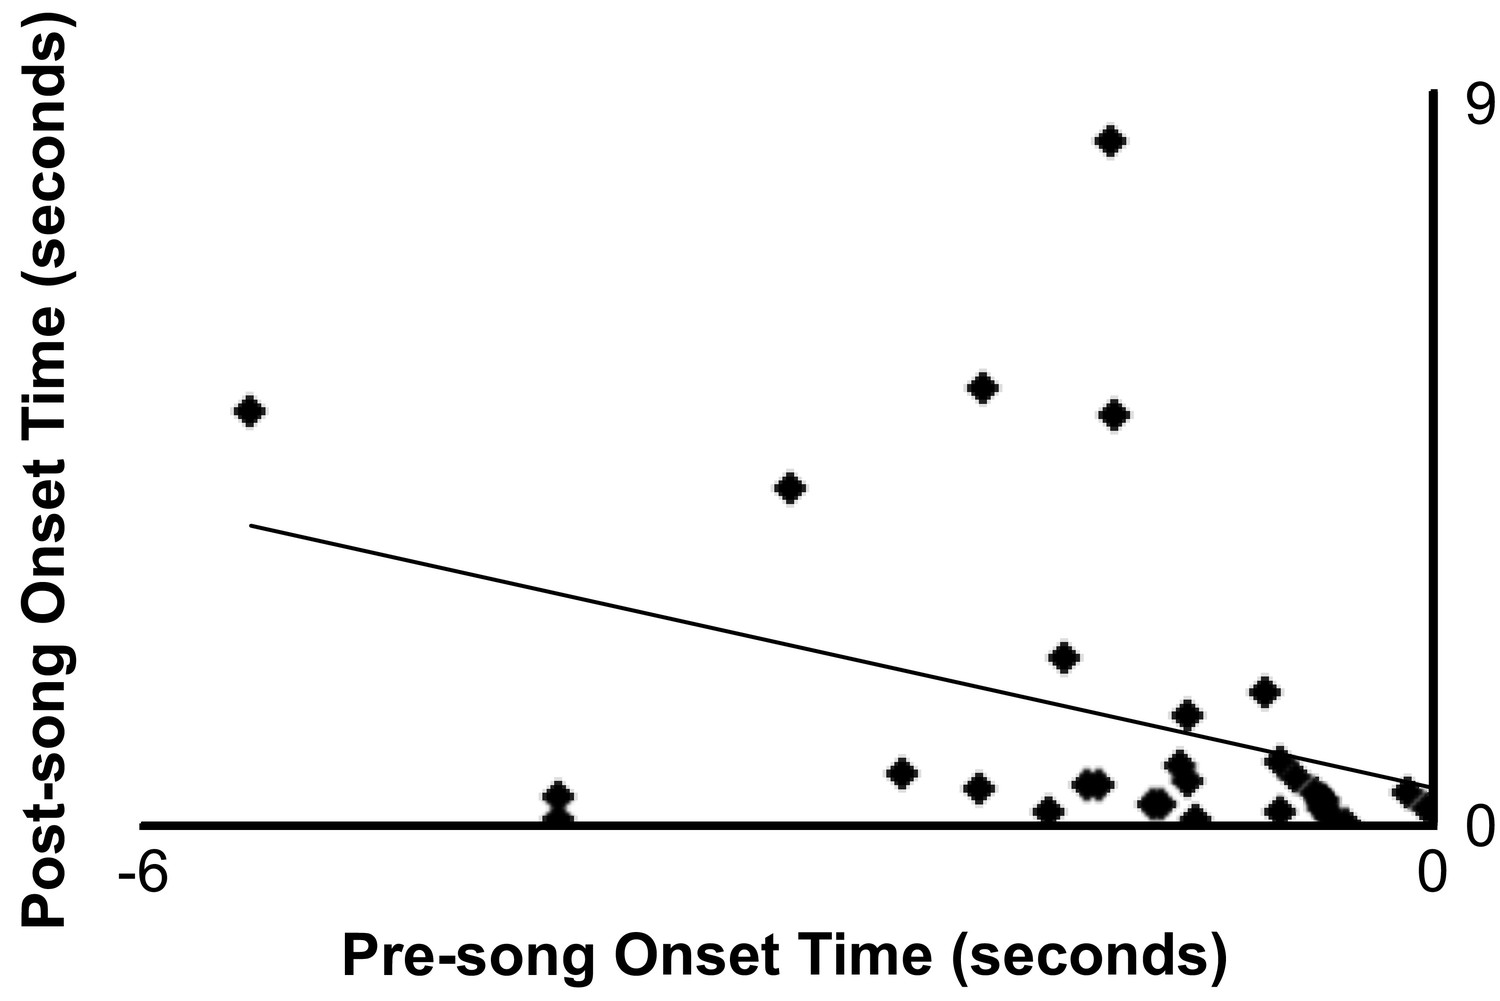
62 events (31 paired pre-song and post-song events) from 31 neurons from six birds.
Showing a small positive correlation (r2 = 0.127) between pre-song onset time to post-song onset time in cases where a neuron was active only once before and after singing.
Figure 2—figure supplement 4
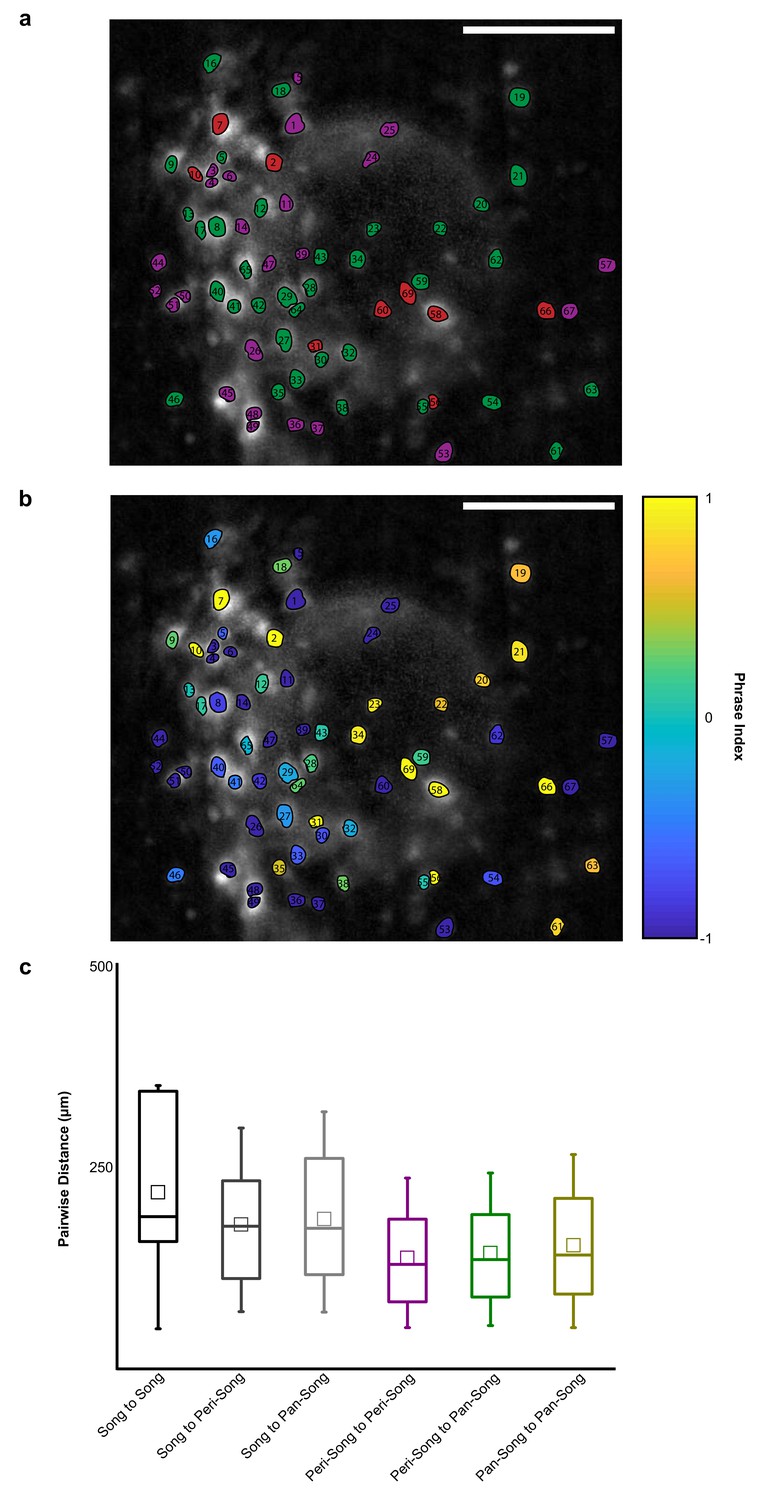
Spatial organization of HVC-RA neuron activity in one exemplary bird.
(a) FOV of ROIs identified in one exemplary bird (O262). Peri-song neurons are shown in purple, pan-song neurons are shown in green, and song neurons are shown in red. Scale bar is 100 micrometers. (b) Same FOV as in a, but neurons are color coded by their phrase index. (c) Euclidean distances between neurons shown in figure (a). Distances (in micrometers) were calculated between the three functional neuron pools mentioned in this paper: peri-song neurons, pan-song neurons, and song neurons. Song-song to peri-peri, p=0.02, song-song to peri-pan, p=0.04, Mann-Whitney U Test. 2278 pairwise distances.
Figure 2—figure supplement 5
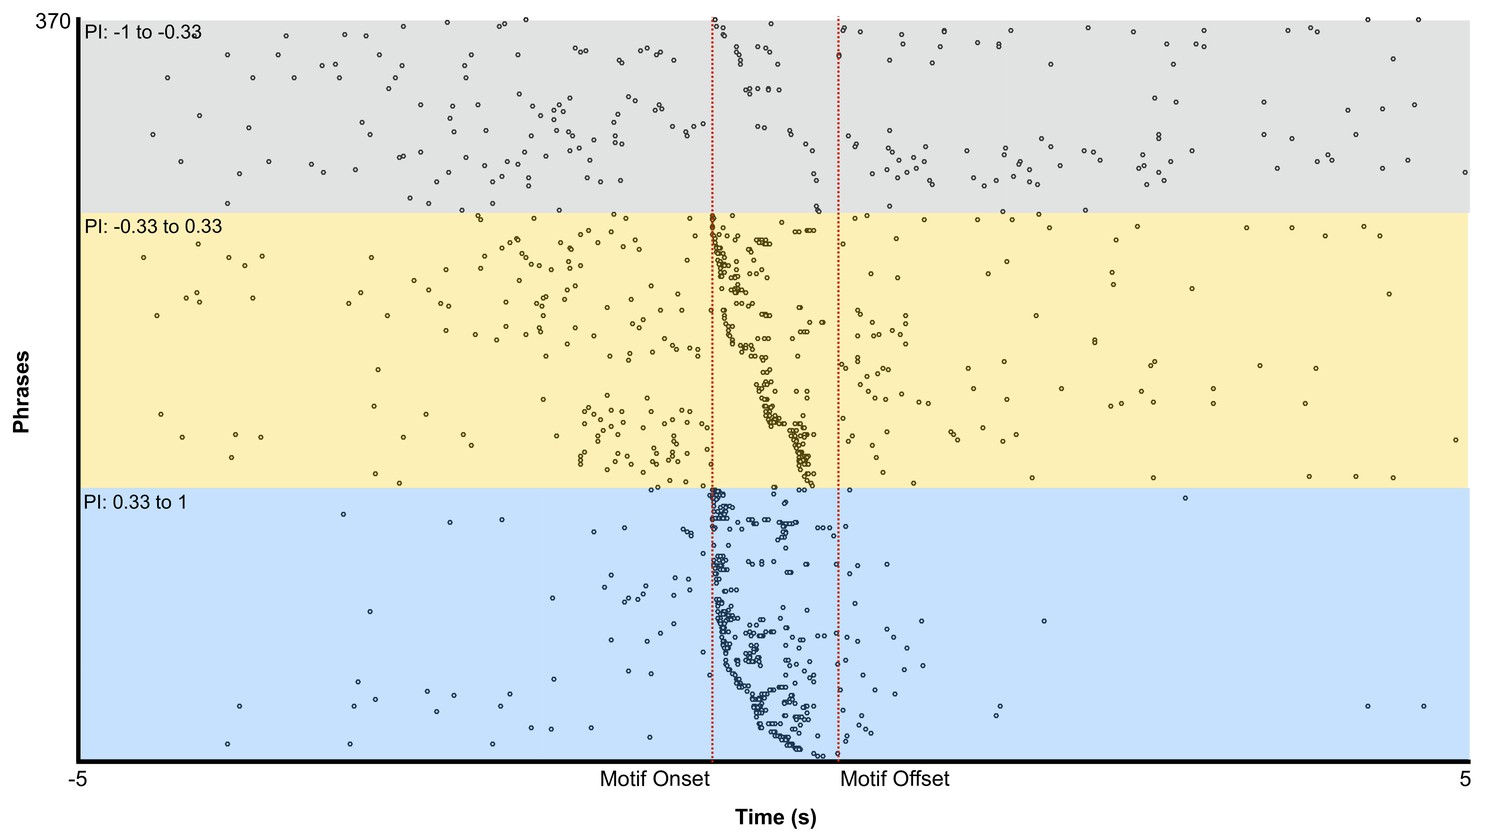
Pan-song neuron events organized in tripartite groups according to phrase index.
Within each subdivision neurons are organized by Motif onset times. 23 neurons are shown between −1 to −0.33. 56 neurons are shown between −0.33 to 0.33. 53 neurons are shown between 0.33 to 1.
Figure 2—figure supplement 6

Synchronized calcium traces for all available trials for one bird (O248) across directed, undirected, and non-singing behaviors.
Bars above spectrograms indicate cage noise (yellow), female calling (blue), and male calling (red). Each trace under the spectrograms correspond to different neurons but they are not necessarily the same neuron across the trials.
Figure 2—figure supplement 7
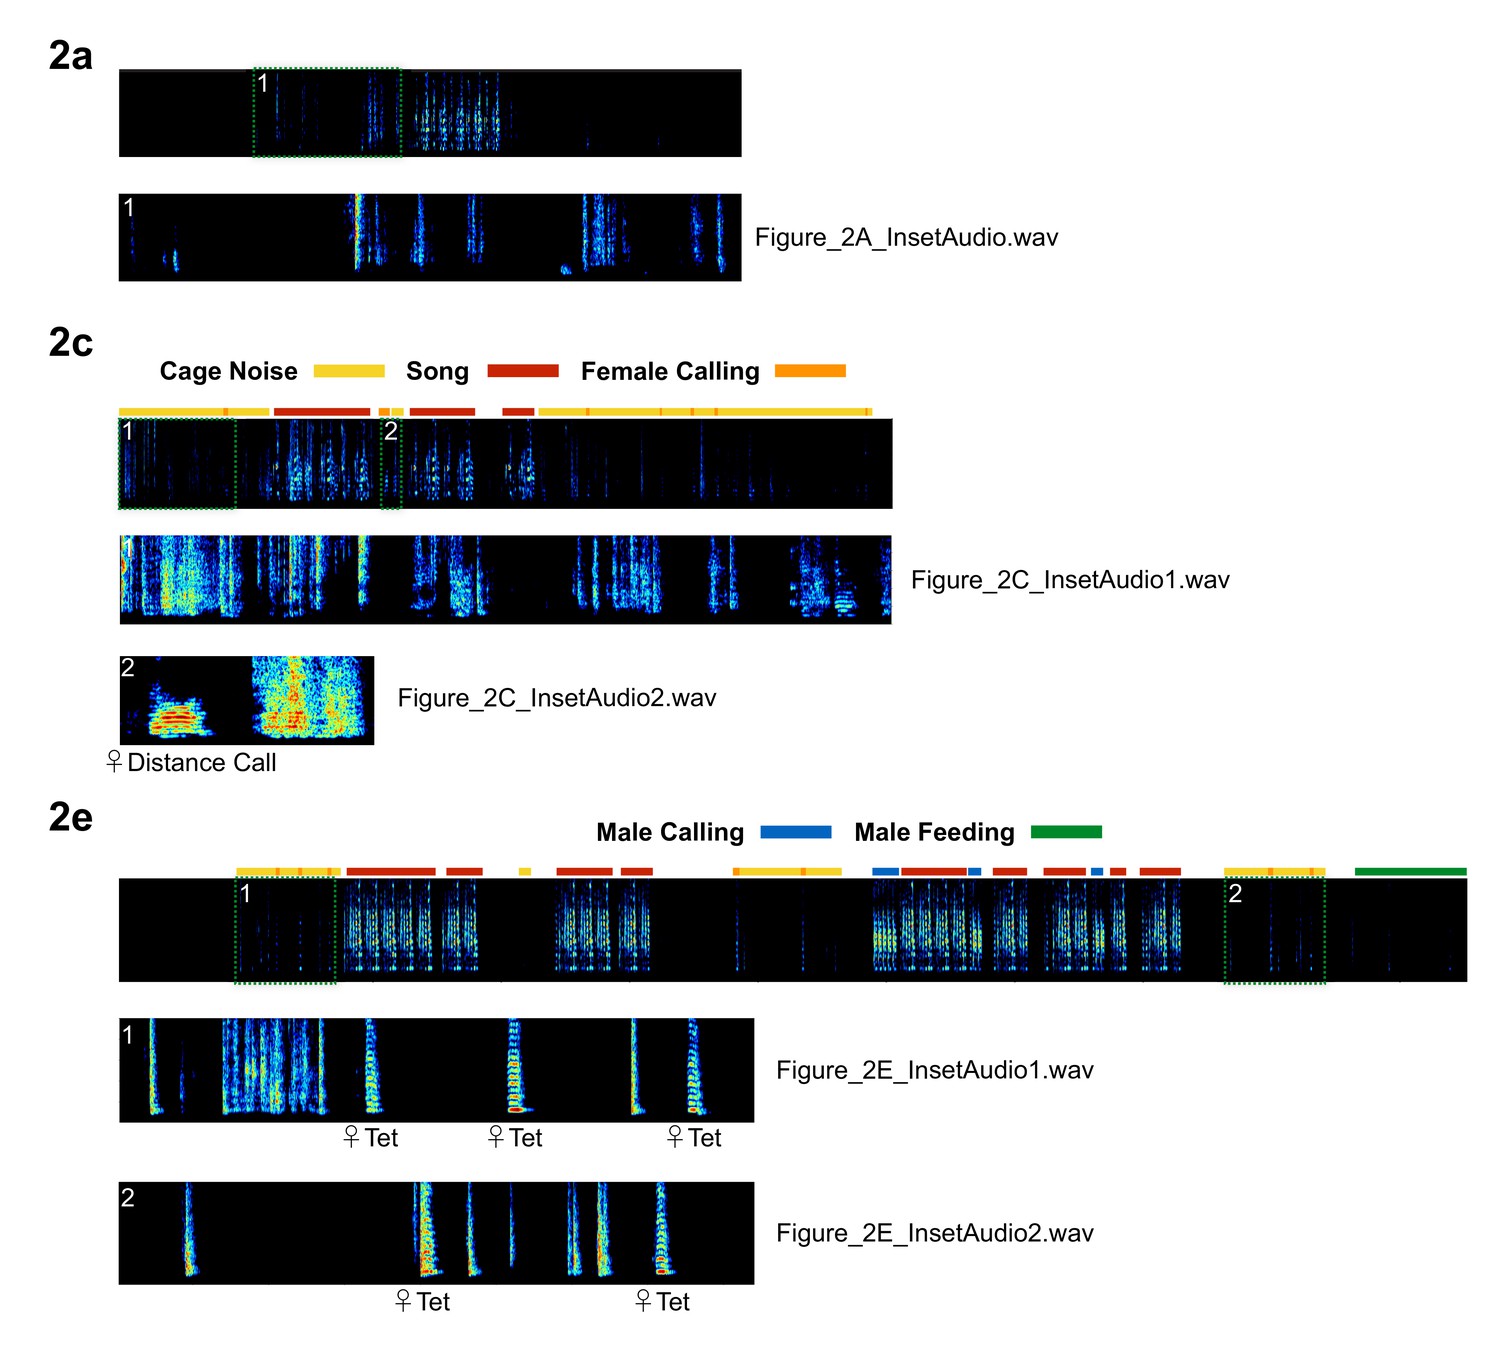
Expanded spectrograms from Figure 2, showing female distance calls and tet calls during pre-song and post-song periods.
The labels next to the high-resoultion spectrograms indicate the corresponding audio file name.
Figure 2—figure supplement 8
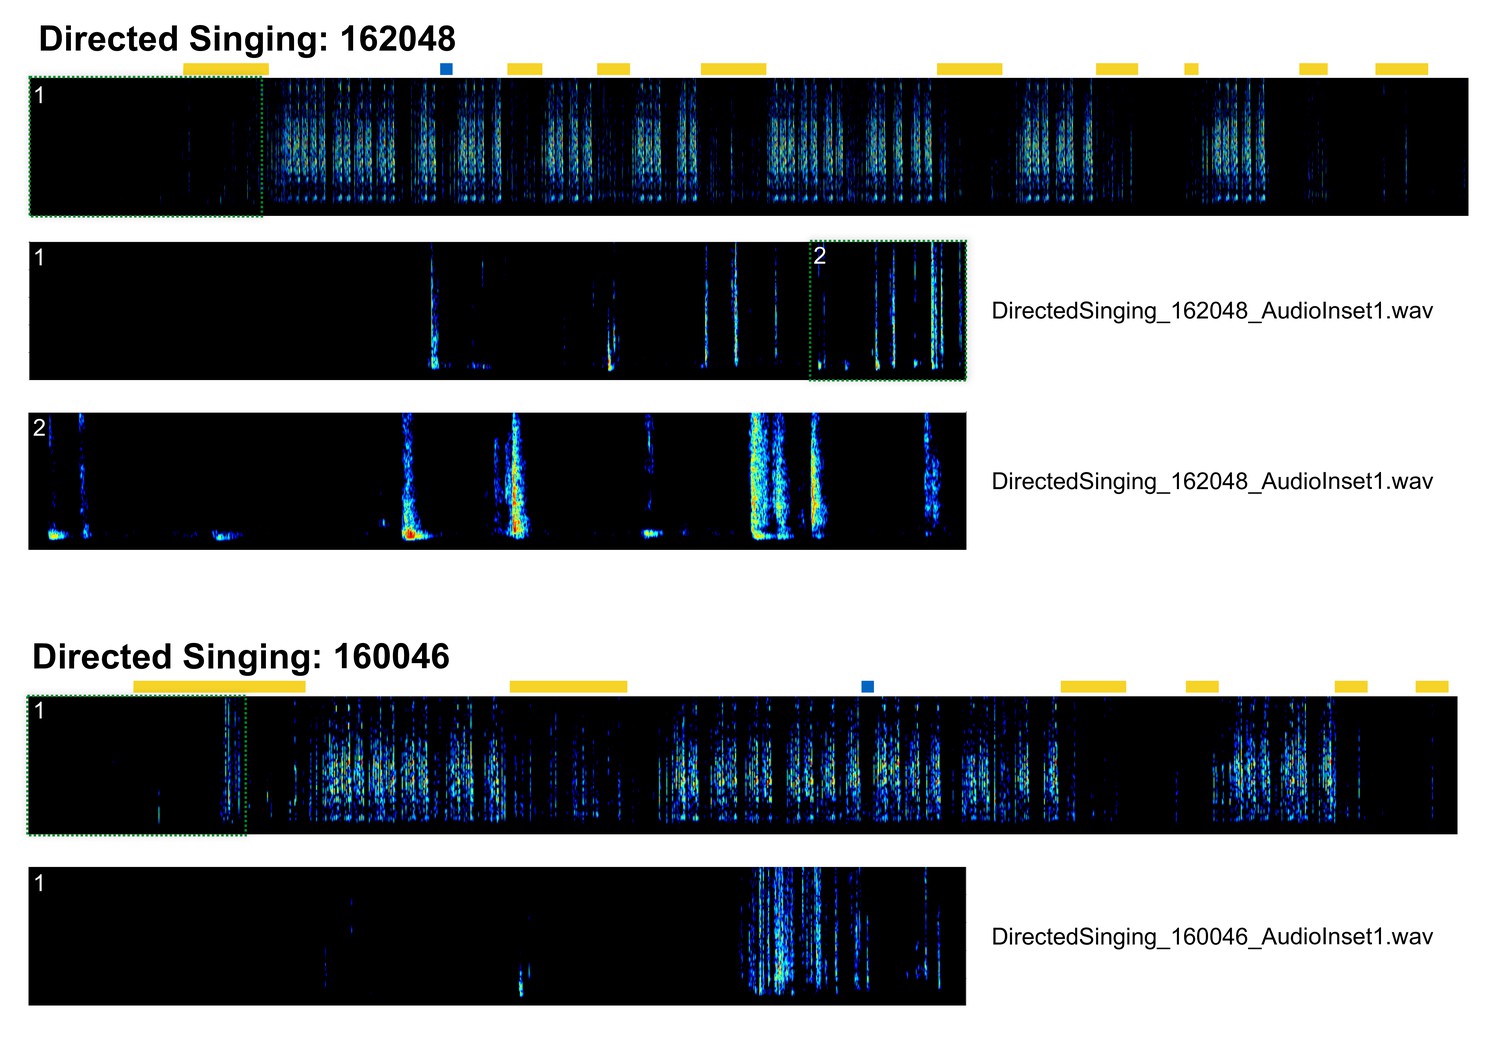
Expanded spectrograms from two examples in Figure 2—figure supplement 6, showing the spectral structure of cage noise during pre-song behavioral epochs.
The labels next to the high-resolution spectrograms indicae the corresponding audio file name.
Figure 2—figure supplement 9
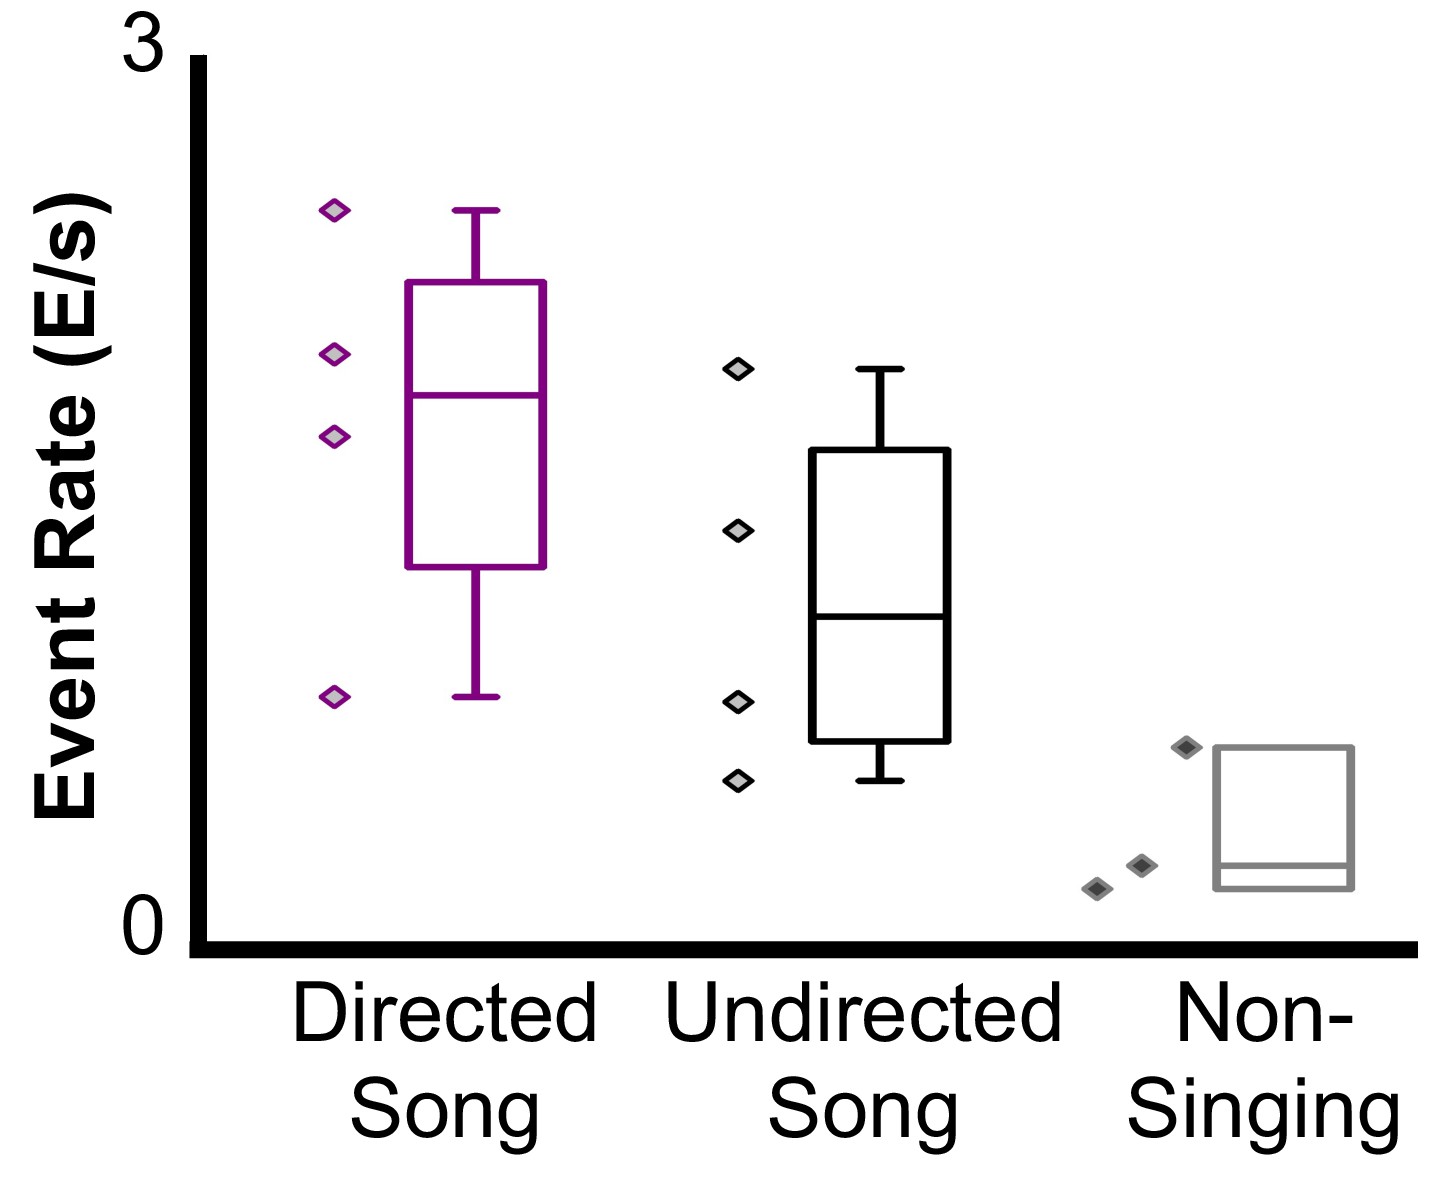
Event rates for a bird during Directed (561 CEs, 1.67 ± 0.74 std), Undirected (252 CEs, 1.06 ± 0.66), and Non-Singing (53 CEs, 0.19 ± 0.27) periods of behavior (Directed song is significantly different from non-singing, F(2,10) = 4.83, p<0.05).
Each marker on the plot corresponds to a different trial. Event rate was calculated as the ratio of the number of events to the duration of the trial.
Figure 2—figure supplement 10
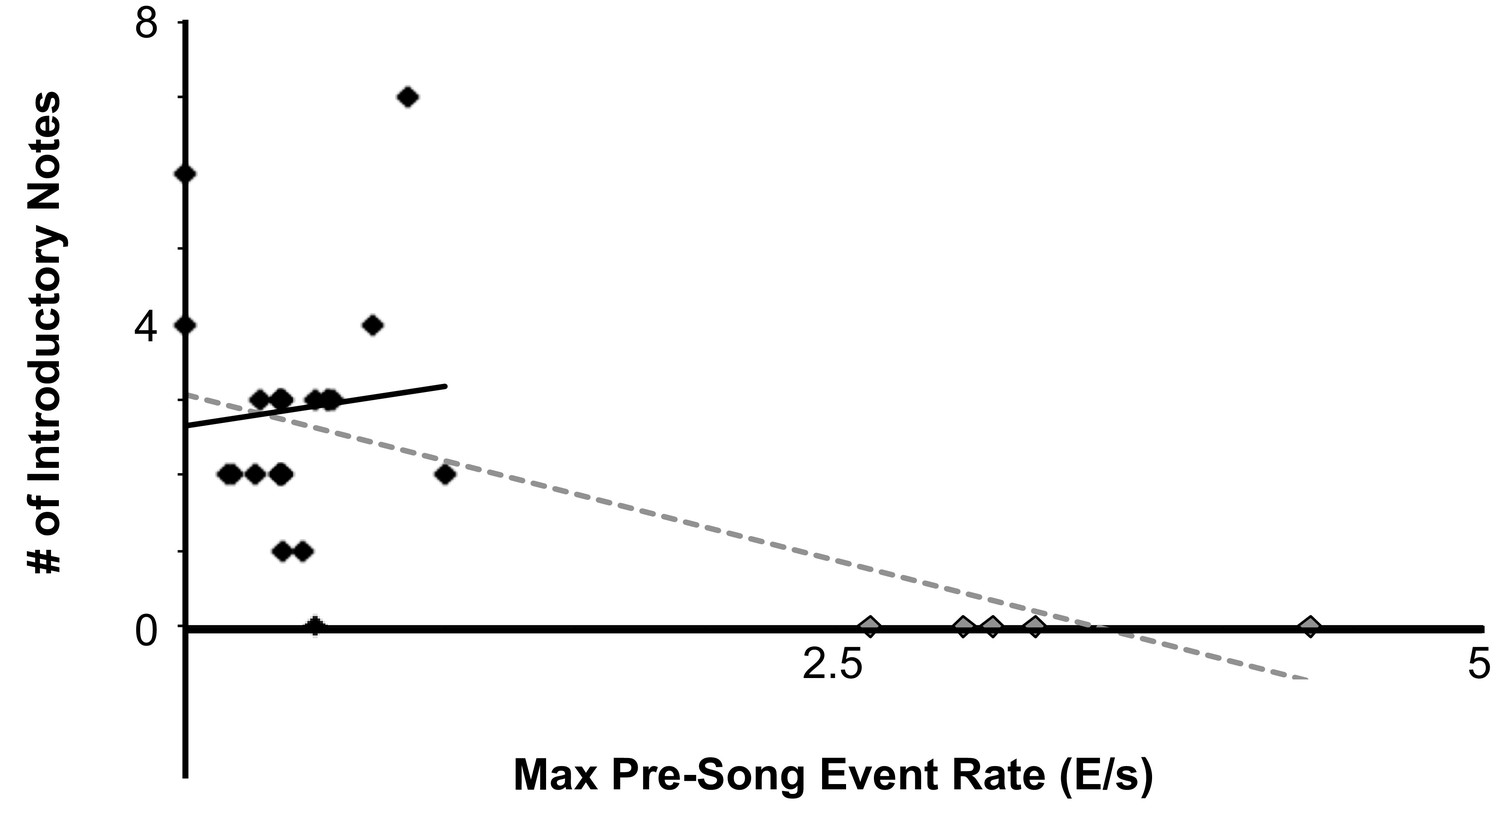
Comparison between maximum pre-song event rate to the number of introductory notes prior to motif onset across five birds (Mean Event Rate = 0.91 E/s, Mean Introductory notes =~2).
one bird did not have any introductory notes during the imaged trials.
Figure 2—figure supplement 11
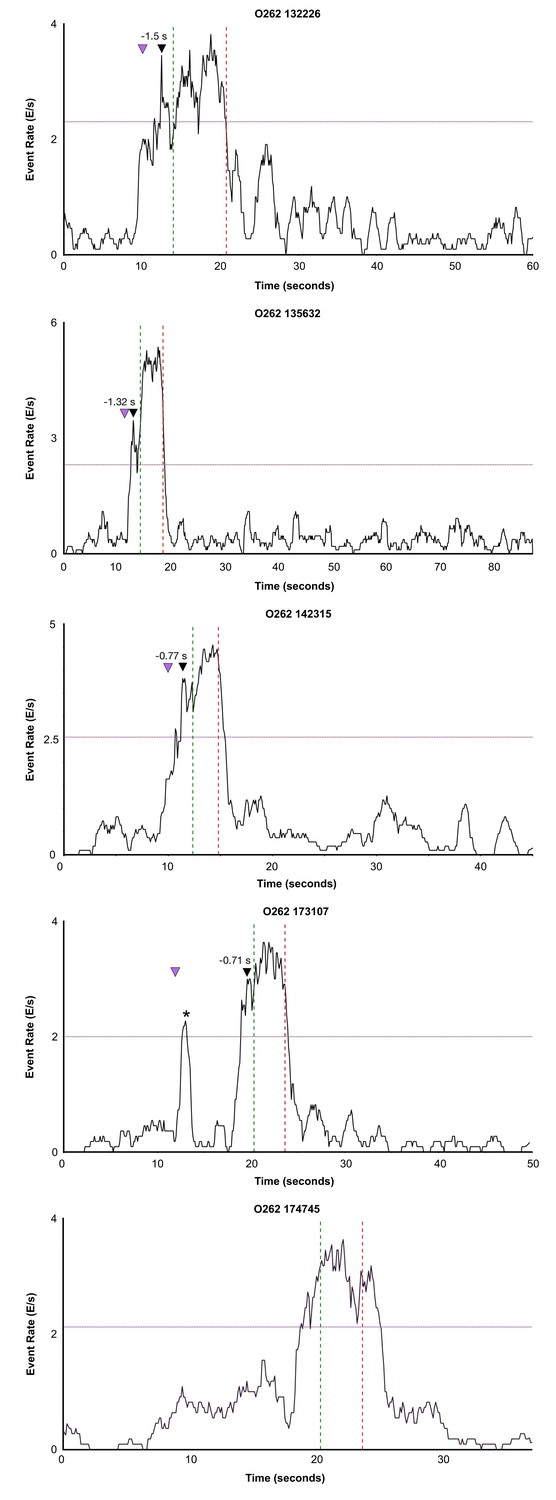
Event rate calculated across the full length of 5 trials for one bird (O262).
Event rate was calculated by first binning calcium onsets in 100 ms bins and smoothing with a 1 s moving window. Green dashed line indicates onset of song phrase and red dashed line indicates offset of song phrase. Purple (horizontal) line indicates 2/3 s of the maximum value during the pre-song period. Black arrow with time marks maximum peak song event rate. Magenta arrow indicates when female was introduced. Asterisk indicates onset of short call.
Figure 3 with 3 supplements
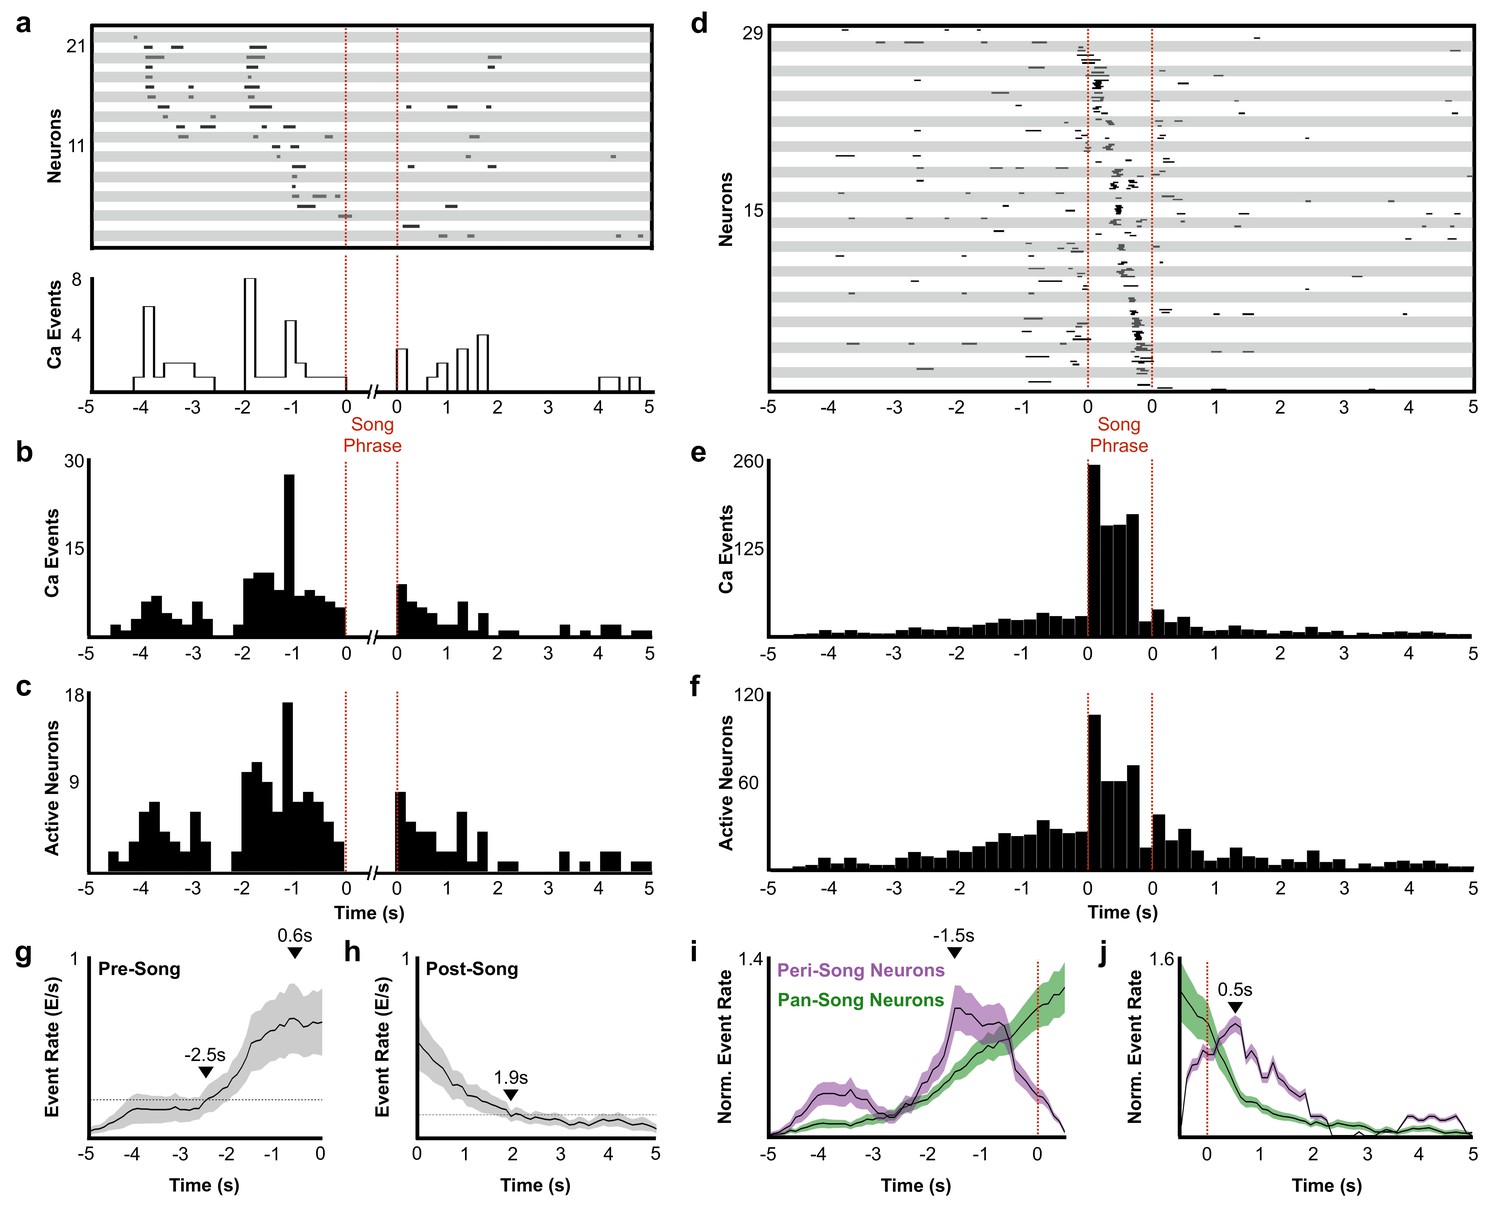
Description of peri-song and pan-song neuron activity.
(a) 21 peri-song neurons from one bird singing 3 bouts containing six motifs (1 st bout: three motifs; 2nd bout: two motifs; 3rd bout: one motif, the dashed red lines indicate the onset and offset of the three bouts). Each row shows song-aligned calcium events (CEs N = 54 CEs; average rise time = 0.18 ± 0.09 s SD). The shaded horizontal bars separate different neurons. One CE is seen to overlap with the beginning of the song phrase. The onset time for this event is 170 ms before song, but the rise time is slow and extends to 100 ms after song onset. Below the CE raster plot is a peri-event histogram with the event rate in 200 ms bins shown for the trial above. (b) Song-aligned CEs in peri-song neurons 5 s before and after phrase onset (41 neurons, 190 CEs). The activity rate peaks ~ 1.2 s before phrase onset. (c) The number of active peri-song neurons in 200 ms bins before and after phrase onset (41 neurons, 169 CEs). (d) Song-aligned activity of pan-song neurons (same trial as shown in panel a), N = 29 neurons, 253 CEs). (e) Peri-event histogram of pan-song neurons (143 neurons, 1,333 CEs). (f) The number of active pan-song neurons in 200 ms bins (143 neurons, 853 CEs). (g) Pre-song event rate for all neurons. The event rate was calculated by counting event onsets in 100 ms bins and then smoothed with a 1 s moving window. 28 trials are shown from five birds; the black line indicates the average event rate. The black triangles mark the peak event rate occurring 0.6 s before song onset and 2.5 s when the event rate reaches 3 SD above the baseline event rate, respectively. Baseline event rate was determined by measuring the average event rate from −5 to −4 s before song onset. Shaded region indicates standard deviation. (h) Post-song event rate for all neurons. 27 trials are shown from five birds. The black triangles mark when the event rate reaches 3 SD above the baseline event rate. Baseline event rate was determined by measuring the average event rate during −5 to −4 s before song onset. (i) Pre-song event rate for peri-song and pan-song neurons calculated as calcium events in moving 1 s windows. The black line indicates average event rate. The black triangle indicates peak event rate occurring 1.5 s before phrase onset. (j) Same as i), but post-song event rates for peri-song and pan-song neurons. The black triangle indicates peak event rate occurring 0.5 s after phrase offset.
-
Figure 3—source data 1
Raw pre-song event rates for Figure 3G.
- https://doi.org/10.7554/eLife.43732.024
-
Figure 3—source data 2
Raw post-song event rates for Figure 3H.
- https://doi.org/10.7554/eLife.43732.025
-
Figure 3—source data 3
Raw pre-song event rates for peri-song and pan-song neurons in Figure 3I.
- https://doi.org/10.7554/eLife.43732.026
-
Figure 3—source data 4
Raw post-song event rates for peri-song and pan-song neurons in Figure 3J.
- https://doi.org/10.7554/eLife.43732.027
Figure 3—figure supplement 1
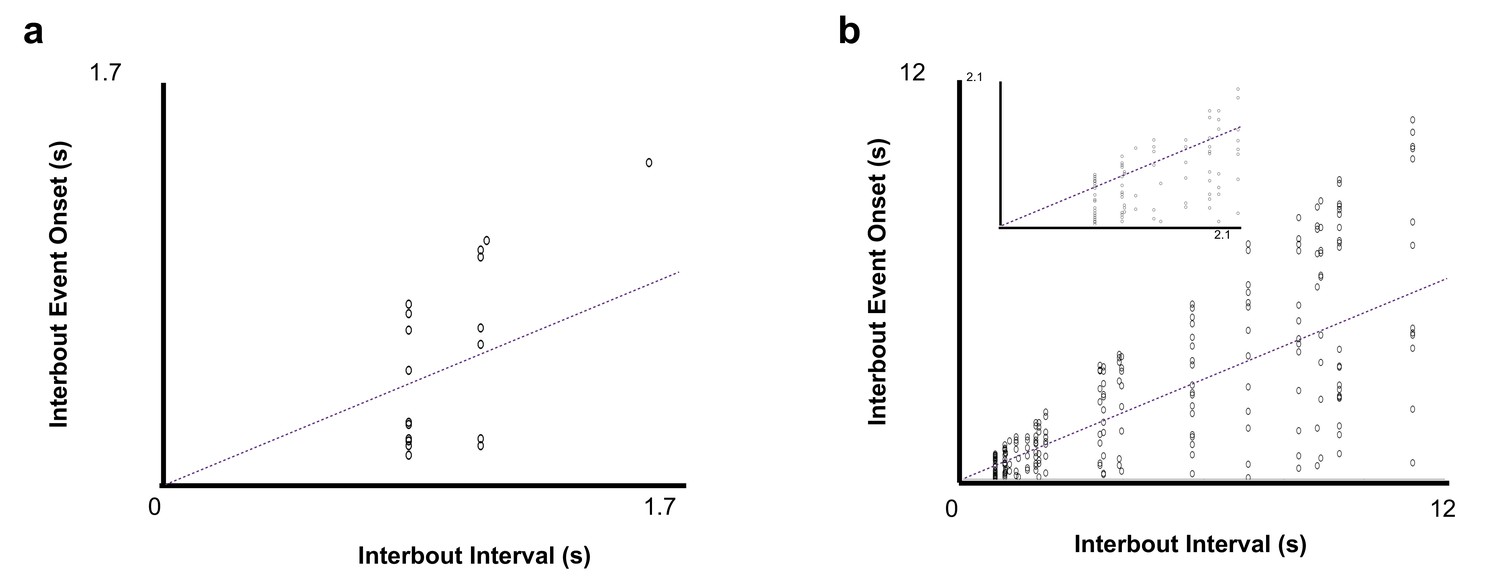
Inter-bout events for peri-song and pan-song neurons.
(a) Inter-bout events for peri-song neurons (N = 27 events, each event was aligned to the end of the previous bout). Dashed line indicates midway point between start of next bout and end of previous bout. These events were excluded from the analysis shown in Figure 3. (b) Same as A but for pan-song neurons (N = 231 events). The inset shows a zoomed in portion of events occurring during Interbout Intervals less than 2 s. These events were excluded from the analysis shown in Figure 3.
Figure 3—figure supplement 2
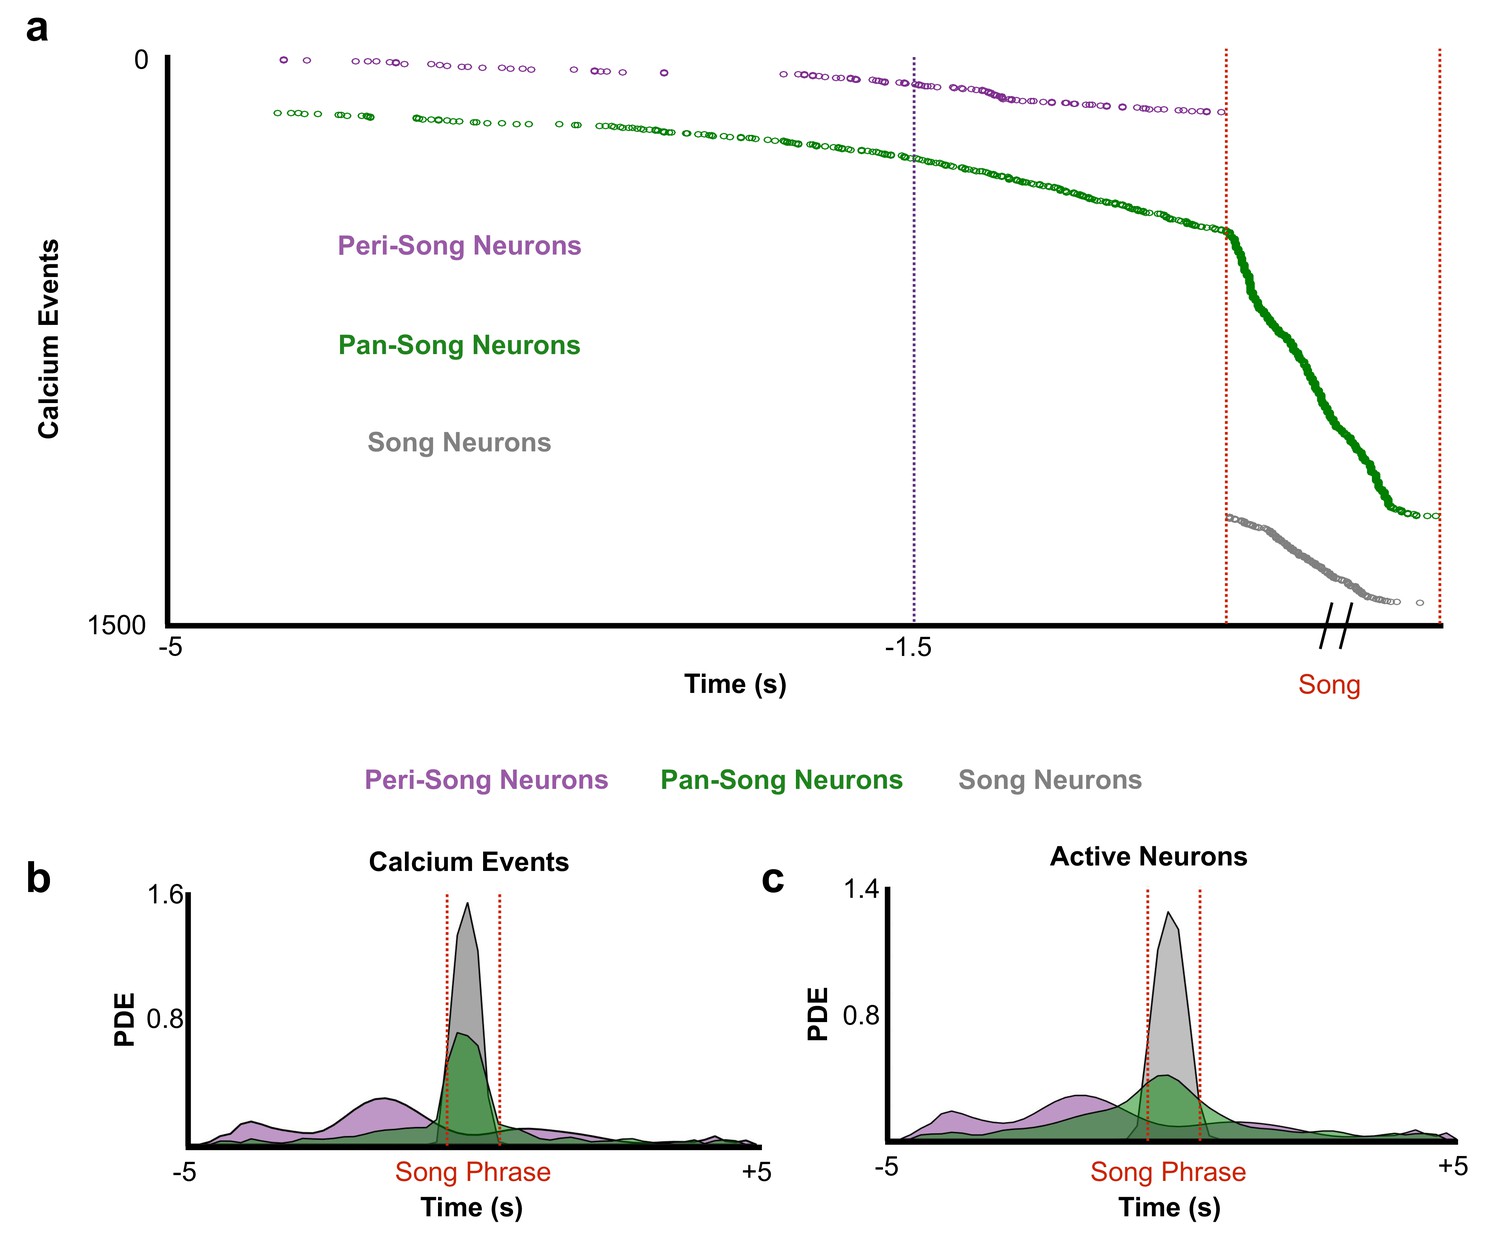
Distribution of calcium events and active neurons based on neuron category.
(a) Cumulative calcium event onset times across all birds and all trials. Time corresponding to peak event rate for peri-song neurons is shown (magenta line, 1.5 s). (b) Probability density estimates of calcium events organized by neuron type. (pan-song neurons: 1,333 CEs, 143 neurons from six birds; peri-song neurons: 190 CEs, 41 neurons from three birds). (c) Same as (b) but for active neurons (pan-song neurons: 853 CEs, 143 neurons, five birds; peri-song neurons: 169 CEs, 41 neurons, three birds).
Figure 3—figure supplement 3

Comparison of the probability of pan-song neuron and song neuron events occurring during a motif (Kolmogorov-Smirnov test, n.s.
, p>0.05; song neurons P(motif)=0.72 ± 0.32, pan-song neurons P(motif)=0.66 ± 0.29). Bouts consisting of a minimum of 2 motifs where the neuron was active during at least one of those motifs were used to calculate the probability (29 bouts had greater than one motif out of a possible 32 bouts; 28 song neurons; 132 pan-song neurons). Probability was calculated at the bout level for each neuron, probabilities across different bouts were treated as independent variables.
Figure 4
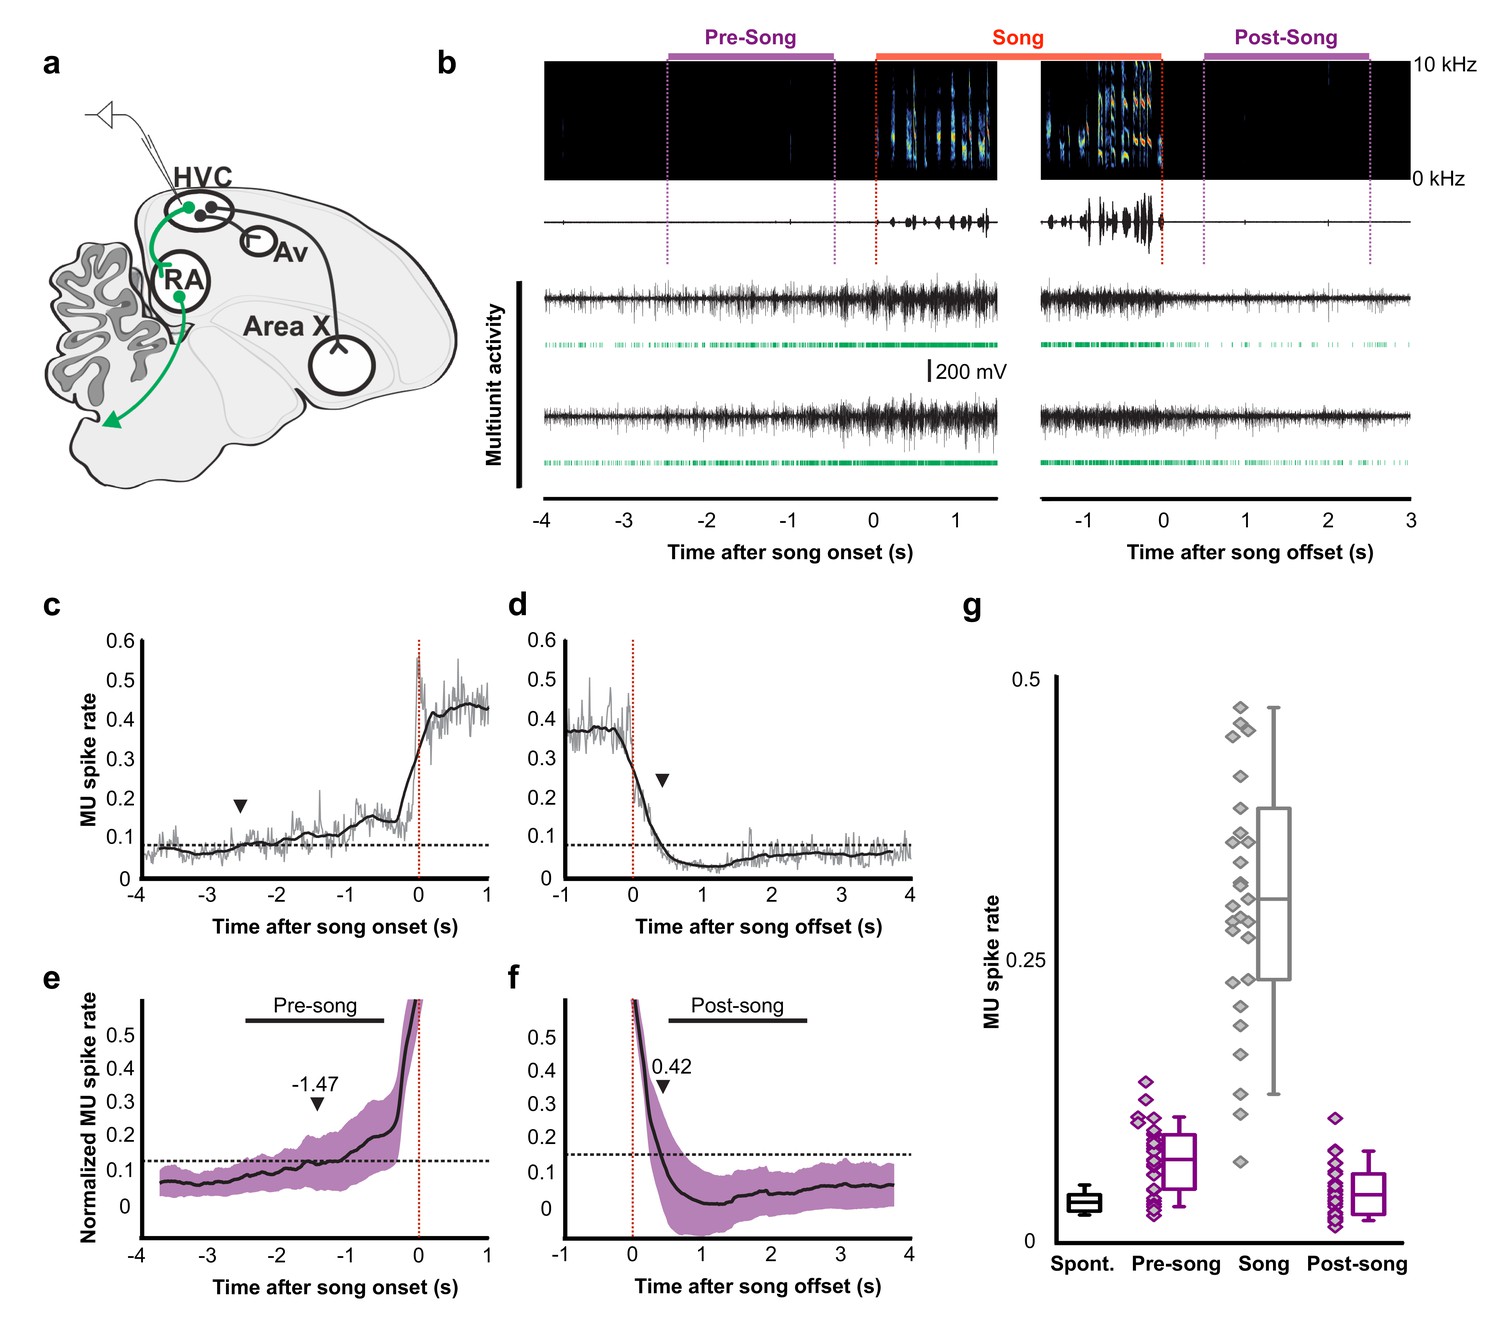
Pre-song and post-song firing in HVC of Bengalese finches.
(a) Schematic of recording site. (b) An example of song initiation and termination (dashed lines indicate phrase onset and offset, pre and post-song period marked in purple and song marked in red) and simultaneously recorded HVC multiunit activity on two electrodes (channels #4 and #15, bird p15o56). Green raster plots represent detected spikes on the two electrodes. (c,d) Phrase onset (c) and offset (d) related average multiunit activity obtained from an example electrode channel (vertical dashed lines indicate phrase onset and offset, respectively). The spike rate was averaged across multiple song onsets or offsets and was first calculated in 10 ms bins (gray thin line) and then smoothed with a 500 ms window (bold line). Upper and lower horizontal dotted lines show mean spike rates during singing and baseline, respectively. Arrowheads indicate onset (c) and offset (d) timings of spike rate, as assessed by crossing of a pre-defined threshold (red line). (e,f) Normalized multiunit activity related to phrase onset (e) and offset (f). Before averaging, the spike rate trace of each electrode channel was normalized such that 0 corresponds to the mean rate during baseline and 1.0 to the mean rate during singing (see Materials and method). The bold line shows an average across all electrodes and birds (n = 29 channels). Purple area indicates ±1.0 SD. Arrowheads show mean onset (e) and offset (f) timing of pre-song and post-song activity, respectively. (g) Mean multiunit spike rates during spontaneous (black), pre-song (purple with diamonds), song (gray with diamonds), and post-song (purple with diamonds) periods. Pre-song and post-song periods are indicated by the horizontal bars in panels e and f. Box plots show the median, 25th and 75th percentiles with whiskers showing ±1.5 IQR.
-
Figure 4—source data 1
Raw multiunit spike rate averages for Figure 4G.
- https://doi.org/10.7554/eLife.43732.029
Figure 5 with 1 supplement
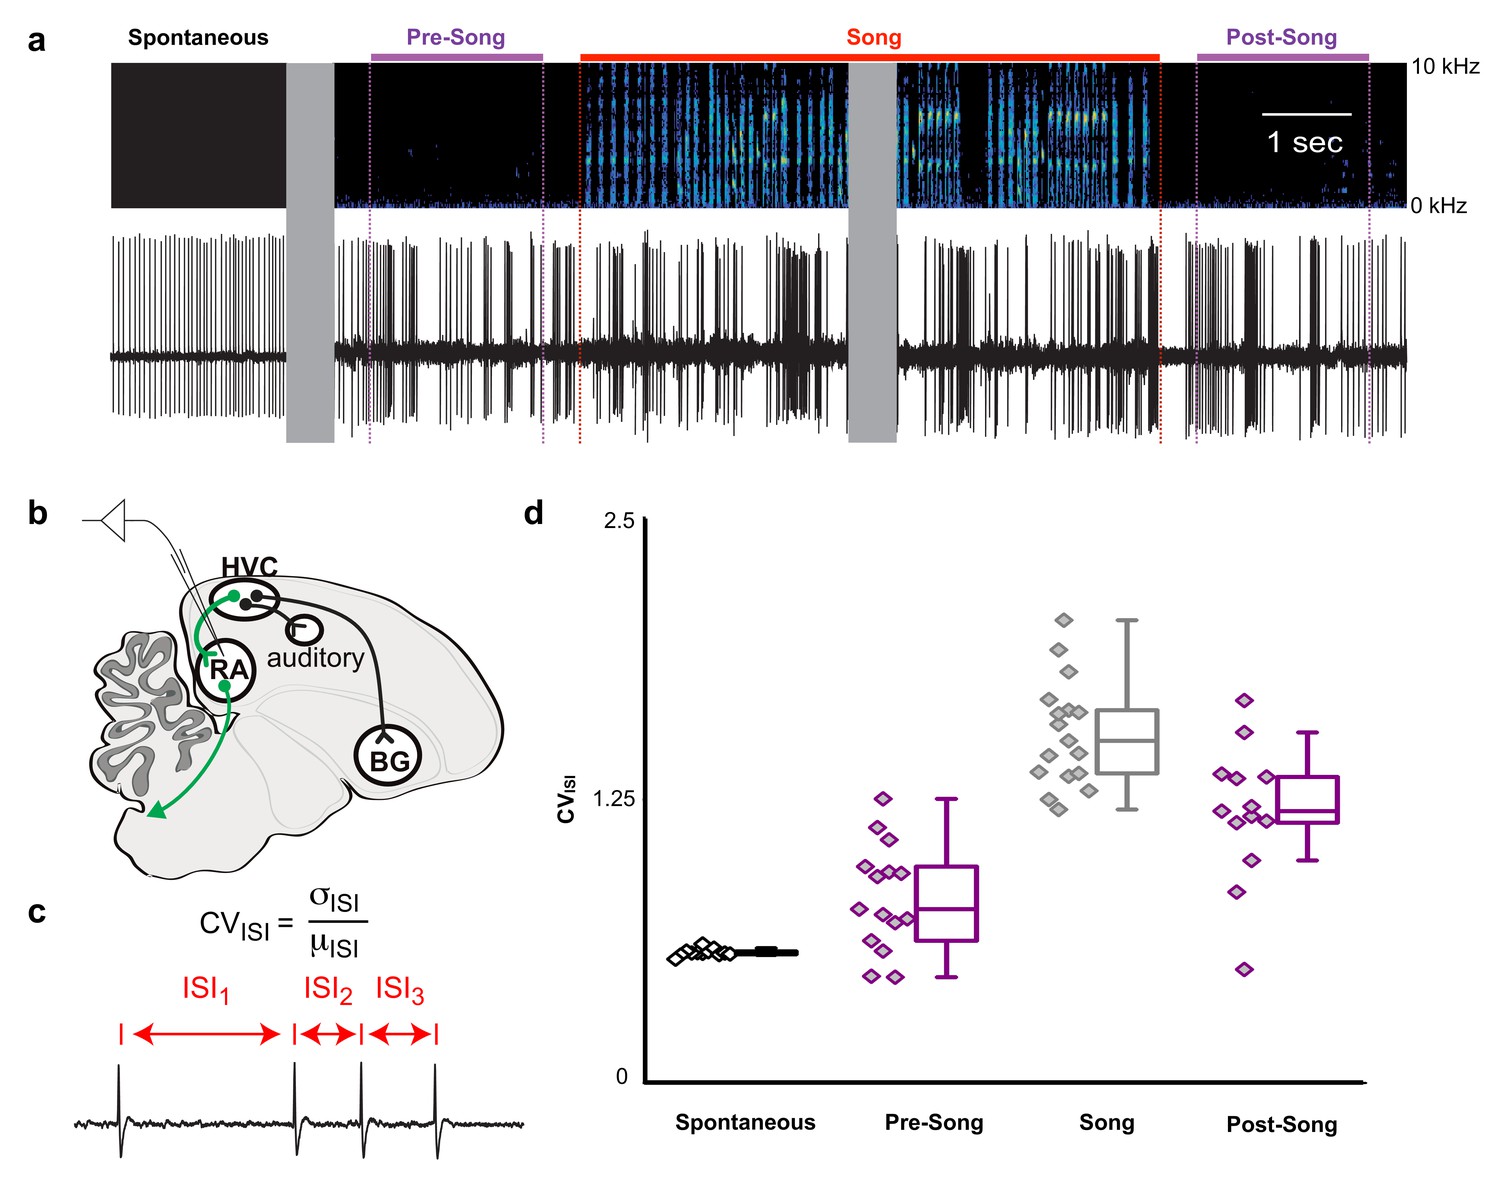
Pre-song and post-song firing in RA of Bengalese finches.
(a) Example extracellular recording from a single RA neuron. Colored lines highlight four epochs (pre-song (purple), song (red), and post-song (purple)) relative to the beginning and ending of a song phrase (see main text). Gray areas indicate discontinuities in time (pauses between ‘spontaneous’ epoch and song initiation and within the middle portion of the song bout). (b) Schematic of recording site. (c) We quantified inter-spike-intervals (ISIs) and computed the coefficient of variation (CV) in each epoch. (d) We found significantly higher ISI variability in the pre-song epoch (purple with diamonds) compared to spontaneous (p<0.005, two-sided K-S test). Box plots show the median, 25th and 75th percentiles with whiskers showing ±1.5 IQR.
-
Figure 5—source data 1
Raw coefficient of variation data for Figure 5D.
- https://doi.org/10.7554/eLife.43732.032
Figure 5—figure supplement 1
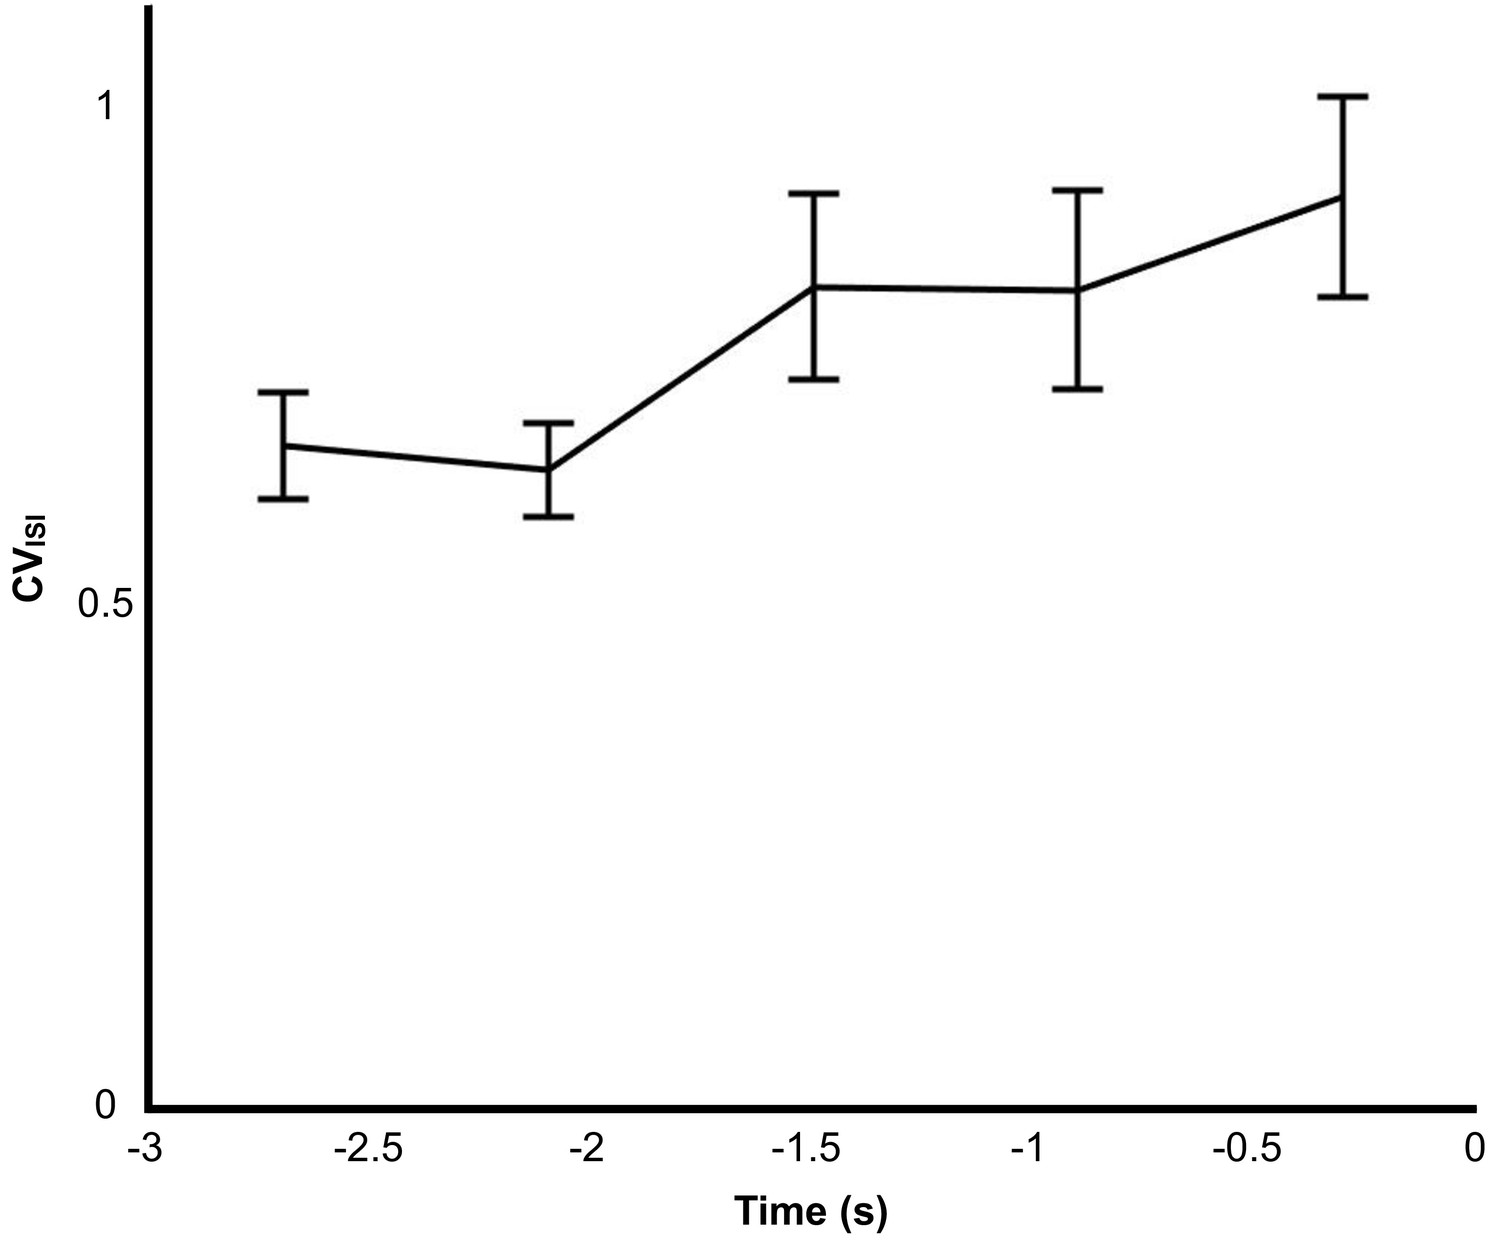
Pre-song changes in CVISI in 600 ms bins from single units in the RA of Bengalese finches singing undirected song.
There is a significant difference in spiking variability when comparing the first bin (−3 to −2.5 s) to the last bin before song onset (−0.5 to 0 s, Kolmogorov-Smirnov test, p=0.023).
Figure 6
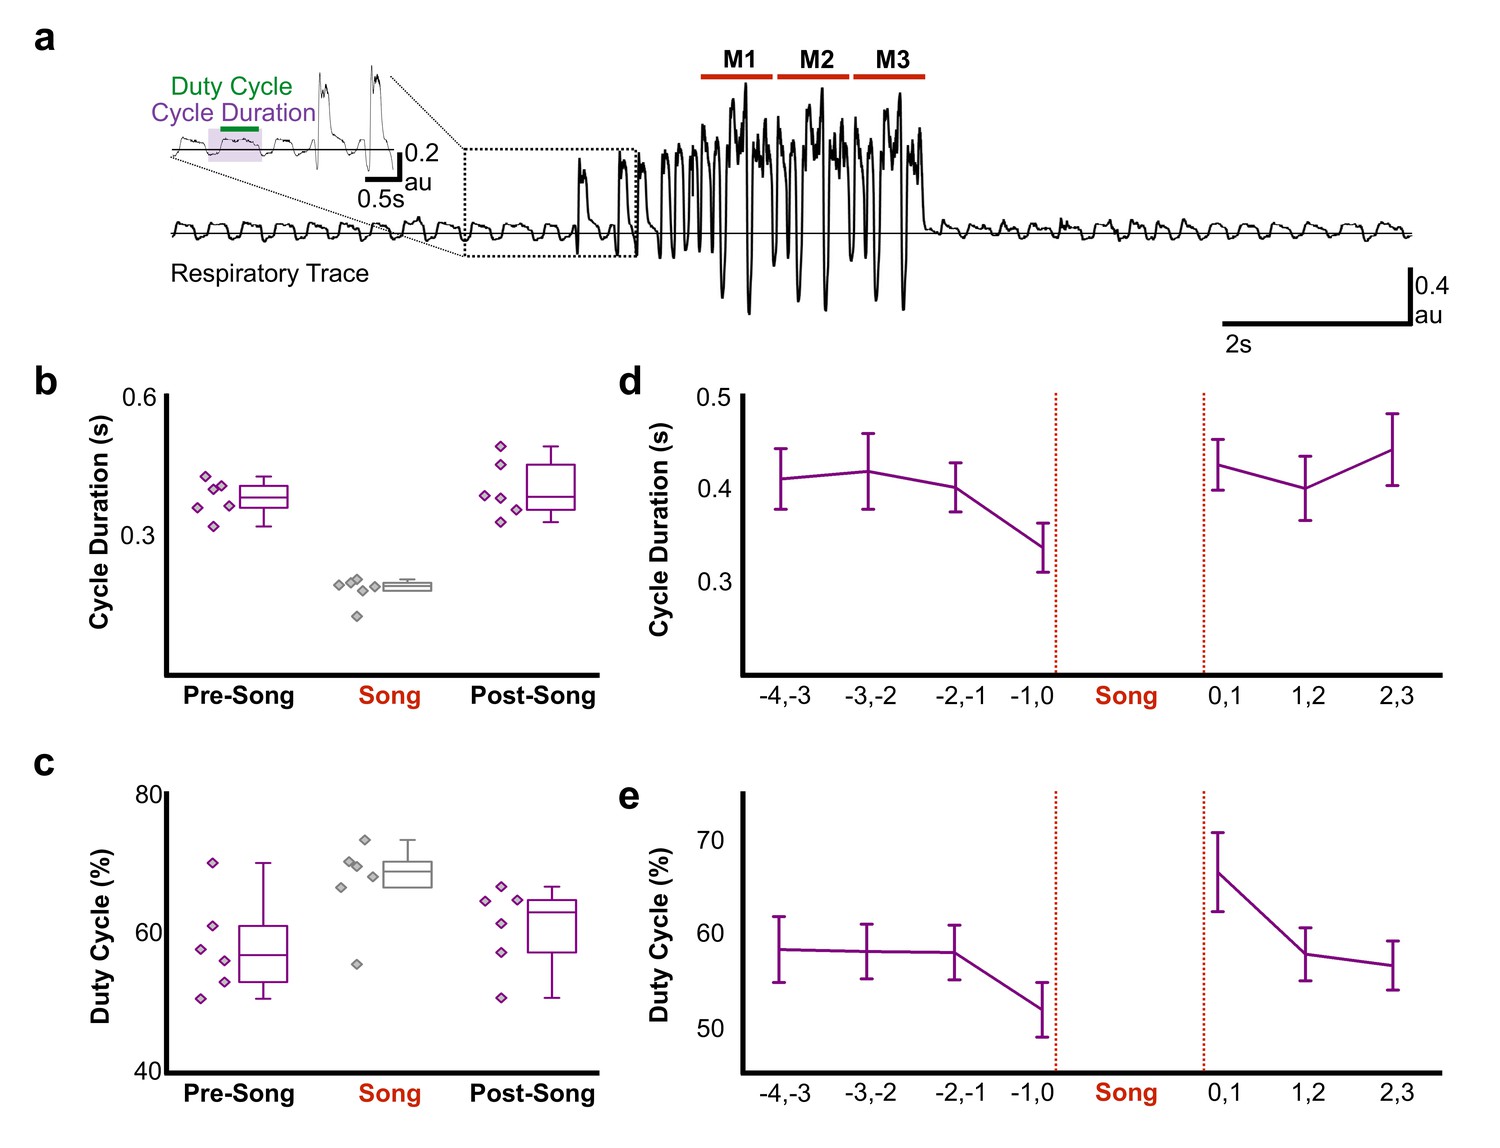
Air sac pressure recording in zebra finches.
(a) Waveform of pressure changes during non-singing and singing periods. Waveforms above the horizontal line (suprambient pressurization) indicate expiration and below the line (subatmospheric pressurization) indicate inhalation. Song start was identified by the presence of introductory notes preceeding the song phrase. M1-3 corresponds to three repetitions of the bird’s motif. Inset illustrates measurements for respiratory cycle duration and duty cycle (% time in expiration) and the first two introductory notes. (b) Respiratory cycle duration and (c) duty cycle of expiratory phase before (Pre), during (Song), and after (Post) song production (N = 6 birds). (d) Plots of average respiratory cycle durations and (e) duty cycles during pre-song and post song periods (N = 6 birds). Longer duty cycles correspond to increased periods of expiration. Data in panels b-e is derived from the same six birds.
-
Figure 6—source data 1
Raw cycle duration and duty cycle values for Figure 6B and 6C.
- https://doi.org/10.7554/eLife.43732.034
-
Figure 6—source data 2
Raw cycle duration and duty cycle values binned by 1s time windows for Figure 6D and 6E.
- https://doi.org/10.7554/eLife.43732.035
Videos
Video 1
Synchronized video of calcium imaging and behavior in a bird singing to a female.
https://doi.org/10.7554/eLife.43732.005Tables
Key resources table
| Reagent type (species) or resource | Designation | Source or reference | Identifiers | Additional information |
|---|---|---|---|---|
| Strain, strain background (adeno-associated virus) | AAV9.CMV.HI.eGFP-Cre.WPRE.SV40 | James M. Wilson | Addgene viral prep # 105545-AAV9; http://n2t.net/addgene:105545; RRID:Addgene_105545 | |
| Strain, strain background (adeno-associated virus) | AAV9.CAG.Flex.GCaMP6s.WPRE.SV40 | Chen et al., 2013 | Addgene viral prep # 100842-AAV9; http://n2t.net/addgene:100842; RRID:Addgene_100842 | |
| Strain, strain background (adeno-associated virus) | AAV9.CAG.GCaMP6s.WPRE.SV40 | Chen et al., 2013 | Addgene viral prep # 100844-AAV9; http://n2t.net/addgene:100844; RRID:Addgene_100844 | |
| Commercial assay or kit | Miniature Microscope | Inscopix | https://www.inscopix.com/nvista | |
| Software, algorithm | Matlab | Mathworks | http://www.mathworks.com/products/matlab/; RRID:SCR_001622 | |
| Software, algorithm | Calcium Analysis | Peters et al., 2014 | ||
| Software, algorithm | CNMF | Pnevmatikakis et al., 2016 | https://github.com/epnev/ca_source_extraction |
Additional files
-
Source code 1
Source code for calcium trace extraction.
- https://doi.org/10.7554/eLife.43732.036
-
Source code 2
Source code for calcium trace baseline estimation.
- https://doi.org/10.7554/eLife.43732.037
-
Source code 3
Source code for creating ROIs in imaging datasets.
- https://doi.org/10.7554/eLife.43732.038
-
Source code 4
Source code containing helper functions for trace extraction.
- https://doi.org/10.7554/eLife.43732.039
-
Supplementary file 1
Summary of behavioral data set for in vivo calcium imaging experiments.
*Male did not sing despite having a female present. **Male was actively calling during this trial. ***Male did not sing despite being in the presence of a female, however, the bird does perform introductory notes.
- https://doi.org/10.7554/eLife.43732.040
-
Supplementary file 2
Table describing categories of neurons and the functional definitions used in this study.
- https://doi.org/10.7554/eLife.43732.041
-
Audio file 1
Figure 2A: Inset audio.
- https://doi.org/10.7554/eLife.43732.042
-
Audio file 2
Figure 2C: Inset audio1.
- https://doi.org/10.7554/eLife.43732.043
-
Audio file 3
Figure 2C: Inset audio 2.
- https://doi.org/10.7554/eLife.43732.044
-
Audio file 4
Figure 2E: Inset audio 1.
- https://doi.org/10.7554/eLife.43732.045
-
Audio file 5
Figure 2E: Inset audio 2.
- https://doi.org/10.7554/eLife.43732.046
-
Audio file 6
Directed singing 160046 audio inset 1.
- https://doi.org/10.7554/eLife.43732.047
-
Audio file 7
Directed singing 162048 audio inset1.
- https://doi.org/10.7554/eLife.43732.048
-
Audio file 8
Directed singing 162048 audio inset 2.
- https://doi.org/10.7554/eLife.43732.049
-
Transparent reporting form
- https://doi.org/10.7554/eLife.43732.050
Download links
A two-part list of links to download the article, or parts of the article, in various formats.
Downloads (link to download the article as PDF)
Open citations (links to open the citations from this article in various online reference manager services)
Cite this article (links to download the citations from this article in formats compatible with various reference manager tools)
Transitioning between preparatory and precisely sequenced neuronal activity in production of a skilled behavior
eLife 8:e43732.
https://doi.org/10.7554/eLife.43732


