A bidirectional network for appetite control in larval zebrafish
- Harvard University, United States
- National Institute of Genetics, Department of Genetics, SOKENDAI (The Graduate University for Advanced Studies), Japan
- Howard Hughes Medical Institute, Janelia Research Campus, United States
Figures
Figure 1 with 5 supplements
Whole brain activity mapping reveals anti-correlated hypothalamic regions.
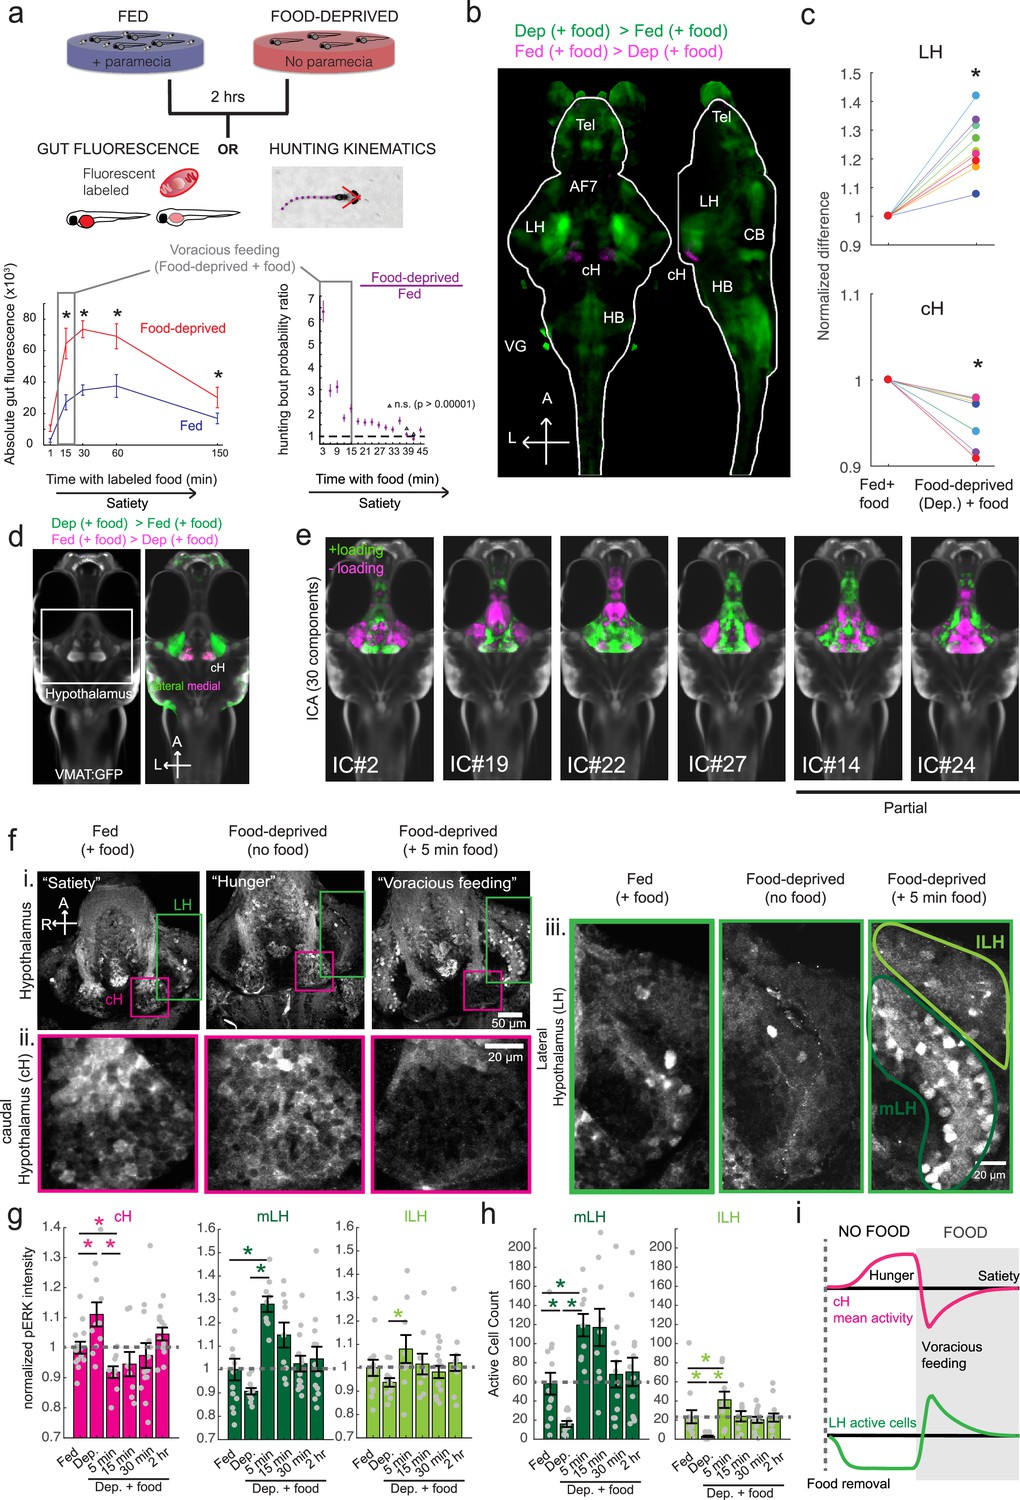
(a) Top: The protocols used to quantify feeding behavior in larval zebrafish. At 7 or 8 dpf, larvae were either food-deprived for 2 hr, or fed with excess paramecia for this duration. After 2 hr (2–4 hr in the case of behavioral imaging), they were subject to a quick wash, followed either by: 1) addition of excess fluorescently-labeled paramecia (left), 2) high-resolution behavioral imaging (right; see Johnson et al., 2019, and Materials and methods). Gut fluorescence is both cumulative and diminished by digestion (Jordi et al., 2015) and so lags the dynamics of hunting behavior. Bottom left: Gut fluorescence measurements of food-deprived (red) or fed (blue) fish as a function of duration of feeding labeled paramecia. Groups of fed or food-deprived larvae were fixed at the indicated time points (fed: n = 7/18/19/17/17 fish, food-deprived: n = 8/23/20/14/15 fish). Food-deprived fish had significantly higher gut fluorescence than fed fish overall (p = 7.5859×10⁻¹⁰, Two-way ANOVA, asterisk indicates corrected p-values<0.05. Bottom right: The probability of performing a hunting-related swim bout across fed and food-deprived fish groups in 3 min time bins over 45 min. Error bars represent 90% confidence intervals. For all bins except those indicated with triangles, the null hypothesis that initial feeding condition has no effect on hunting-bout probability is rejected (p<0.00001, Fisher’s Exact Test comparing binomial probability distributions per bin). Fed: n = 85655 bouts from 73 fish; Food-deprived: n = 75357 bouts from 57 fish. Since the rate of food intake and hunting behavior was highest in the first 15 min (voracious feeding phase, gray boxes), we chose this time point for subsequent MAP-mapping experiments. (b) Brain-wide activity mapping of food-deprived (Dep.) fish exposed to food for 15 min, with subtraction of activity in continuously fed (Fed) fish. Data from nine experiments were combined to generate this difference map based on anti-pERK staining fluorescence. Relative activation from feeding after food deprivation yields activated regions including the telencephalon (Tel), Arborization field 7 (AF7), cerebellum (CB), hindbrain (HB), Vagal ganglion (VG) and lateral lobe of the intermediate hypothalamus (LH). Reduced activity was observed in the caudal hypothalamus (cH) and some areas of the telencephalon. Scale bar = 100 μm. Also see Video 1. (c) ROI-specific pixel intensity analysis of LH and cH regions in nine independent MAP-mapping experiments (20–30 fish per treatment per experiment). The cH or LH ROI intensities of each individual fish was normalized to the mean cH or LH ROI intensity of all fed fish. Food-deprived fish consistently displayed higher LH and lower cH pERK fluorescence after the onset of feeding (p = 0.0019 for both cH and LH, one-tailed Wilcoxon signed-rank test). (d) Z-projection of same MAP-map as described in (b) in planes revealing the hypothalamus (right panel), where lateral regions (e.g. lateral hypothalamus, LH) display strong relative activation and medial regions (e.g. caudal hypothalamus, cH) display reduced activity in when food-deprived animals were fed for 15 min. The map is overlaid onto a stack for the transgenic line Tg(VMAT:GFP) (left panel) to localize the cH region. (e) Six examples of independent component analysis (ICA) maps. Voxels for each recovered independent component (IC) are shown as maximum projections, with intensity proportional to the z-score of the loadings of the ICA signal. These ICs, along with others (22/30) highlight LH and cH regions of opposite loadings, suggesting they may be included in a network that displays anti-correlated activity patterns between the cH and LH. A subset of these ICs (e.g. #14 and #24) only showed partial anti-correlation between the cH and the LH. All ICs are shown in Figure 1—figure supplement 3. Positive (+) loading and Negative (-) loadings (z-score values of IC signals) are reflected in green and magenta, respectively. (f) Confocal micrographs of anti-pERK antibody stained brains from animals that were continuously fed (panel (i), left), food-deprived for 2 hr (panel (i), center) and fed for 5 min after food deprivation (panel (i), right). cH (ii) and LH (iii) insets are shown at higher magnification on the bottom and right side respectively. The lateral hypothalamus is shown with subdivisions lateral lateral hypothalamus (lLH) and medial lateral hypothalamus (mLH). (i) scale bar: 50 μm; (ii) and (iii) scale bar: 20 μm. Fish are mounted ventral side up. (g) Quantification of cH and LH activities by normalized anti-pERK fluorescence intensity averaging. The normalized anti-pERK staining intensity for each region (ROI) was obtained by dividing the anti-pERK fluorescence from each fish (in all experimental groups) by the average anti-pERK fluorescence for the same ROI of continuously fed fish. Quantitative analysis performed on fish in six independent conditions (n = 13/11/9/9/13/12). Normalized anti-pERK fluorescence intensity (cH/mLH/lLH): Fed vs Dep. (p = 0.016/0.12/0.11), Dep. vs Dep. + 5 min food (p = 3.1×10⁻⁴/9.9 × 10−5/0.020), Fed vs Dep. + 5 min food (p = 0.0097/8.5 × 10−4/0.11). Asterisks denote p<0.05, one-tailed Wilcoxon rank-sum test. (h) The active cell count metric (bottom panels) was determined as described in Figure 1—figure supplement 4 by a thresholding protocol to isolate and count individual pERK-positive cells within a z-stack. This approach could be reliably performed for areas of sparse active cells (e.g. mLH and lLH) but not where individually labeled pERK-positive neurons are not well separated (such as the cH). Active cell count (mLH/lLH): Fed vs Dep. (p = 0.001/0.0038), Dep. vs Dep. + 5 min food (p = 9.7×10⁻⁵/1.3 × 10−5), Fed vs Dep. + 5 min food (p = 0.0038/0.048). Asterisks denote p<0.05, one-tailed Wilcoxon rank-sum test. (i) Schematic of inferred cH and LH activity in relation to feeding behavior. Note that, based on data in Figure 2, the LH active cell count appears to decline more rapidly than the rise in cH activity (based on cH average fluorescence intensity). Data plotted in Figure 1 are provided in Figure 1—source data 1.
-
Figure 1—source data 1
Source data for plots displayed in Figure 1a, c, g and h.
- https://cdn.elifesciences.org/articles/43775/elife-43775-fig1-data1-v2.xlsx
Figure 1—figure supplement 1
Anatomical characterization of intermediate hypothalamus expression of appetite related peptides.
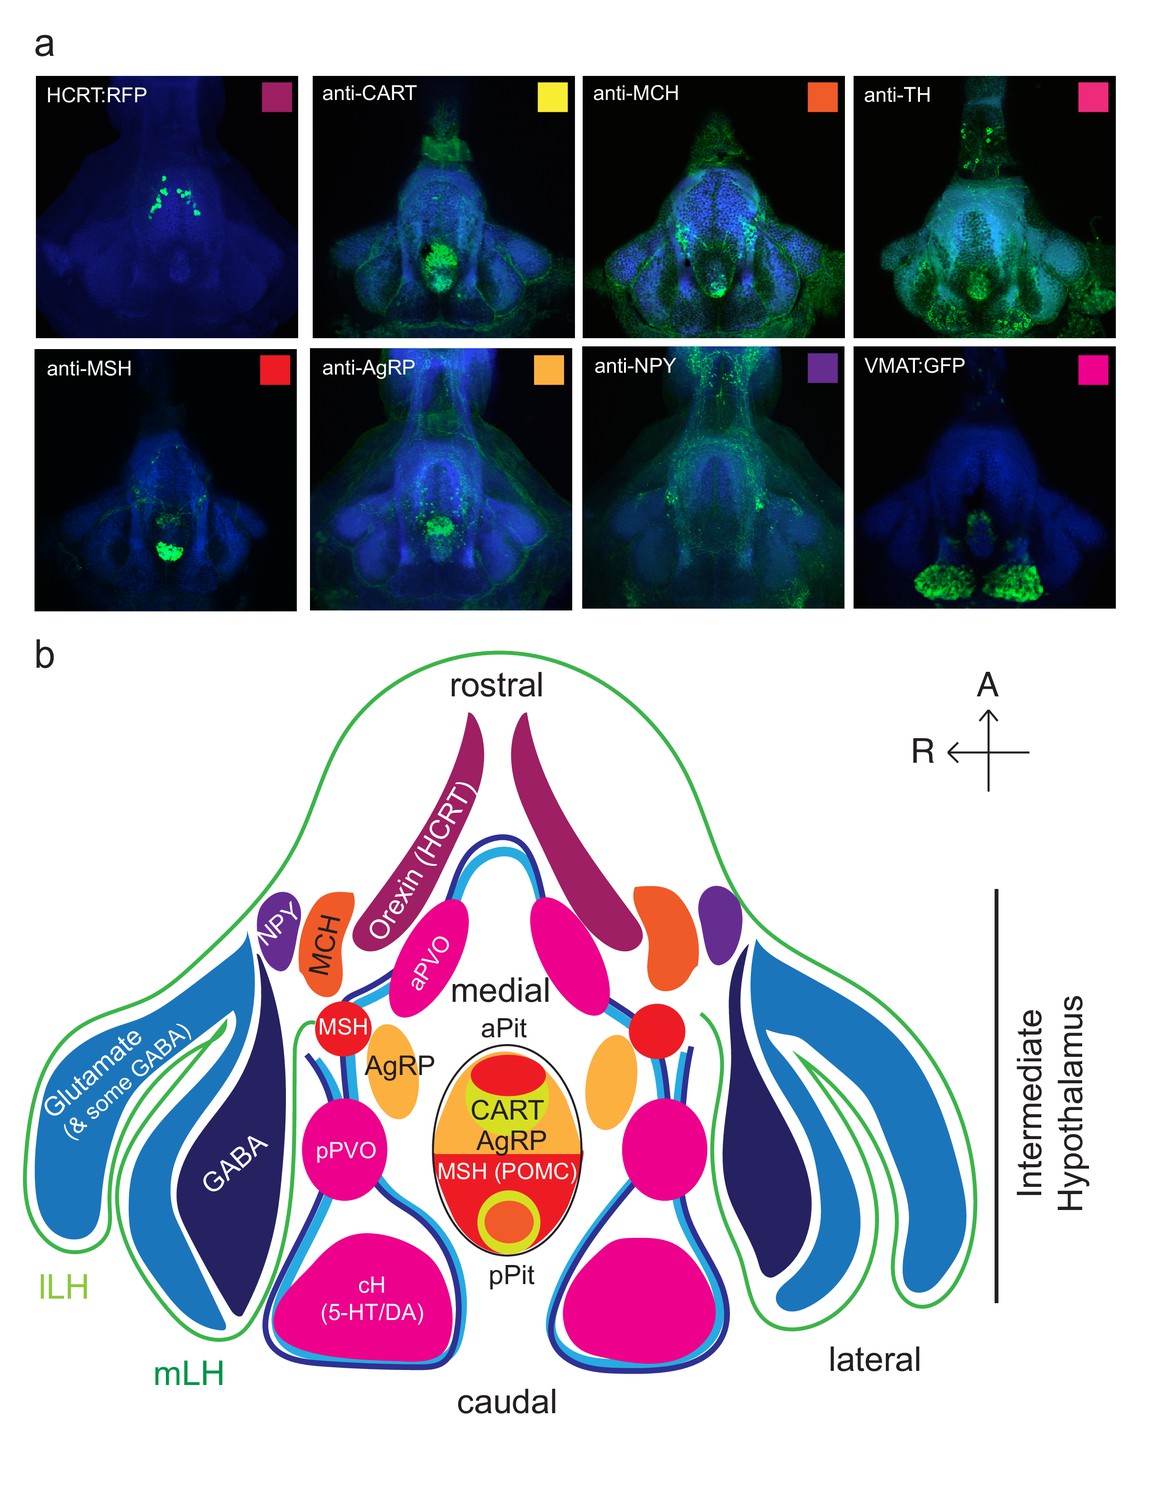
(a) Expression patterns of a number of feeding-related peptides in the zebrafish hypothalamus, based on antibody-staining or transgenic labels (see Materials and methods). HCRT = hypocretin (orexin), CART = cocaine and amphetamine related transcript MCH = melanin concentrating hormone, TH = tyrosine hydroxylase (labels dopaminergic and/or noradrenergic neurons), MSH = alpha melanocyte stimulating hormone, AgRP = Agouti related peptide, NPY = neuropeptide Y, VMAT = vesicular monoamine transporter (labels dopaminergic (DA) and serotonergic neurons (5-HT)). Note that MCH and HCRT staining is absent from the zebrafish LH. Though not apparent from the schematic, HCRT is located more dorsally. The preoptic area, which contains oxytocinergic as well as other peptidergic neurons, is located more dorsally and not reflected in this schematic. (b) Schematic view from the ventral perspective summarizing zebrafish hypothalamic peptide expression. GABA (dark blue) and glutamatergic (blue) neurons are found in the zebrafish LH (see Figure 1—figure supplement 2) and also throughout the medial regions of the hypothalamus. PVO = paraventricular organ, which also contains DA and 5-HT neurons. A number of peptidergic neurons are located within the anterior and posterior pituitary/hypophysis (aPit and pPit). Color code corresponds to images in (a). A = anterior, R = right.
Figure 1—figure supplement 2
Characterization of neuronal transmitter types in the zebrafish lateral hypothalamus.
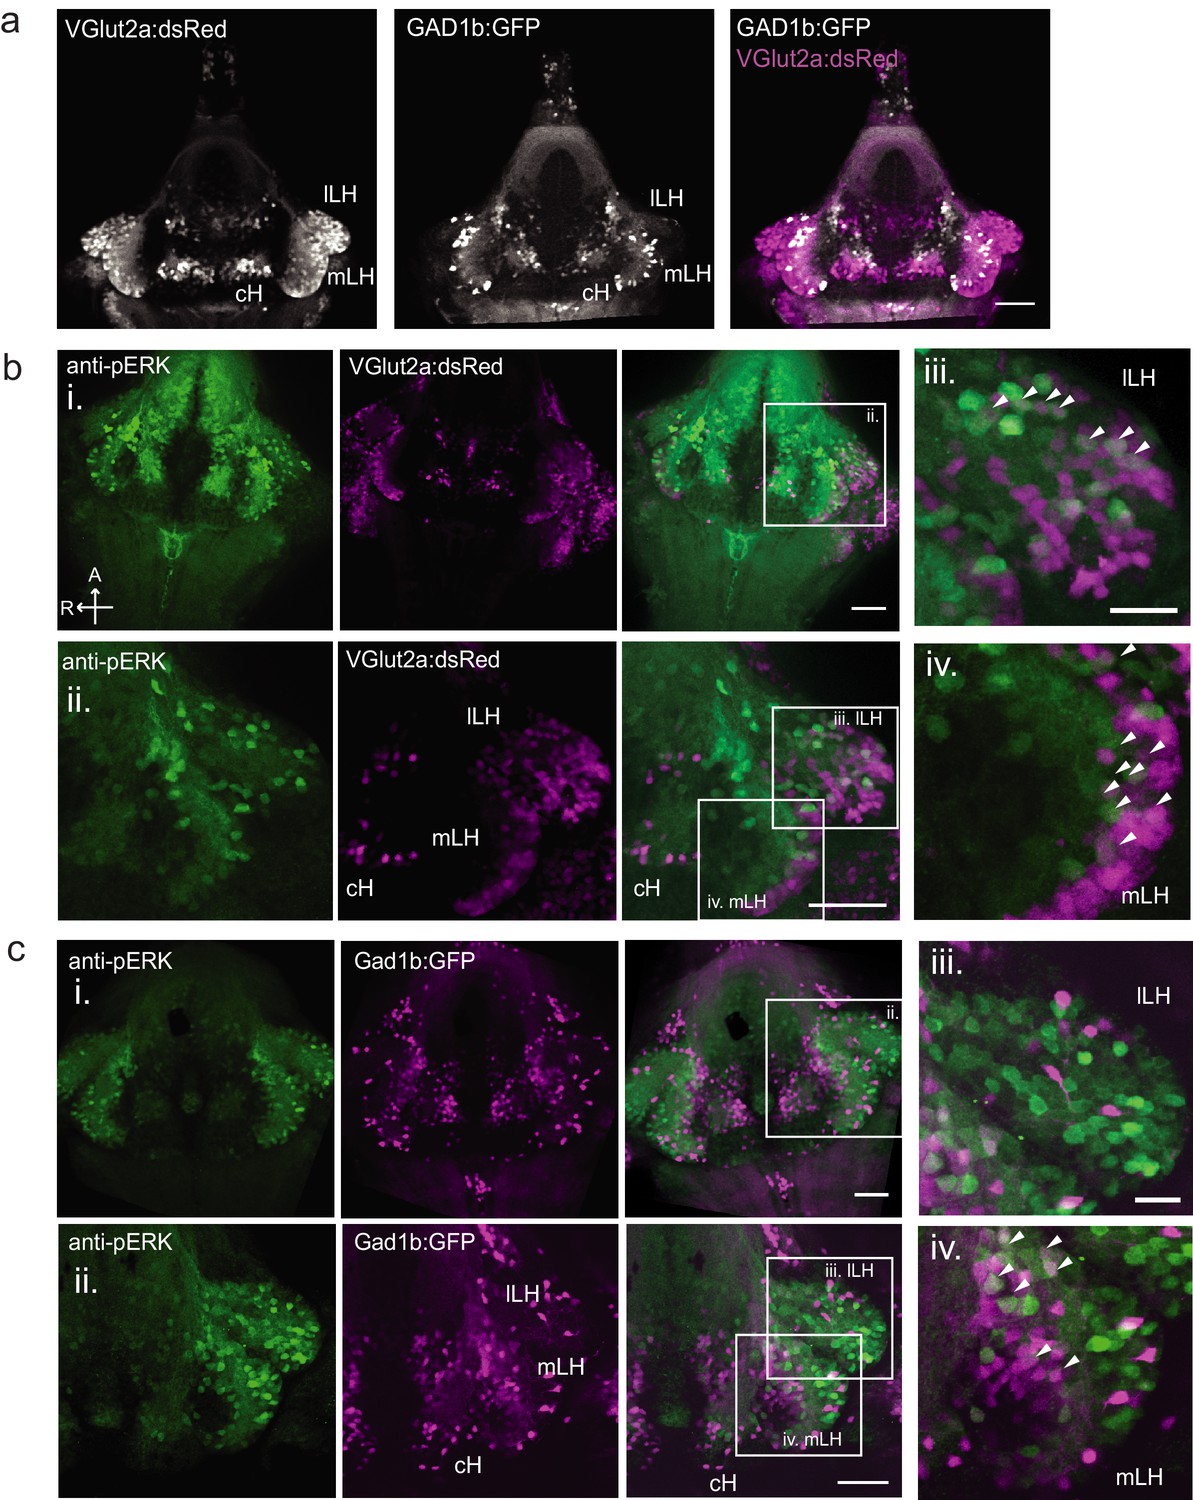
(a) Glutamatergic and GABAergic neuron distribution in the hypothalamus. Tg(VGlut2a:dsRed) and Tg(GAD1b:GFP) transgenic fish were dissected, imaged and registered onto a common reference hypothalamus. All fish in this figure were food-deprived for 2 hr and fixed for analysis after 15 min of feeding. (b) Glutamatergic cells, labeled by Tg(VGlut2a:dsRed), overlap with active (pERK-positive) neurons in both the lLH and outer rim of the mLH. (i) Z-projection of hypothalamus. (ii) Higher magnification images of LH (iii-iv) Inset showing overlap of lLH and outer rim of mLH with glutamatergic cells. (c) GABAergic cells, labeled by Tg(Gad1b:GFP), overlap with active neurons in the inner rim of the mLH but not the lLH. (i) Z-projection of hypothalamus. (ii) Higher magnification images of LH showing a subset of z-planes. (iii-iv) Inset showing overlap of inner rim of mLH with GABAergic cells. White arrows point to examples of overlapping cells. All fish were mounted ventral side up. Scale bar (i and ii) = 50 μm. Inset (iii and iv) scale bar = 20 μm.
Figure 1—figure supplement 3
All 30 independent components extracted from ICA analysis.
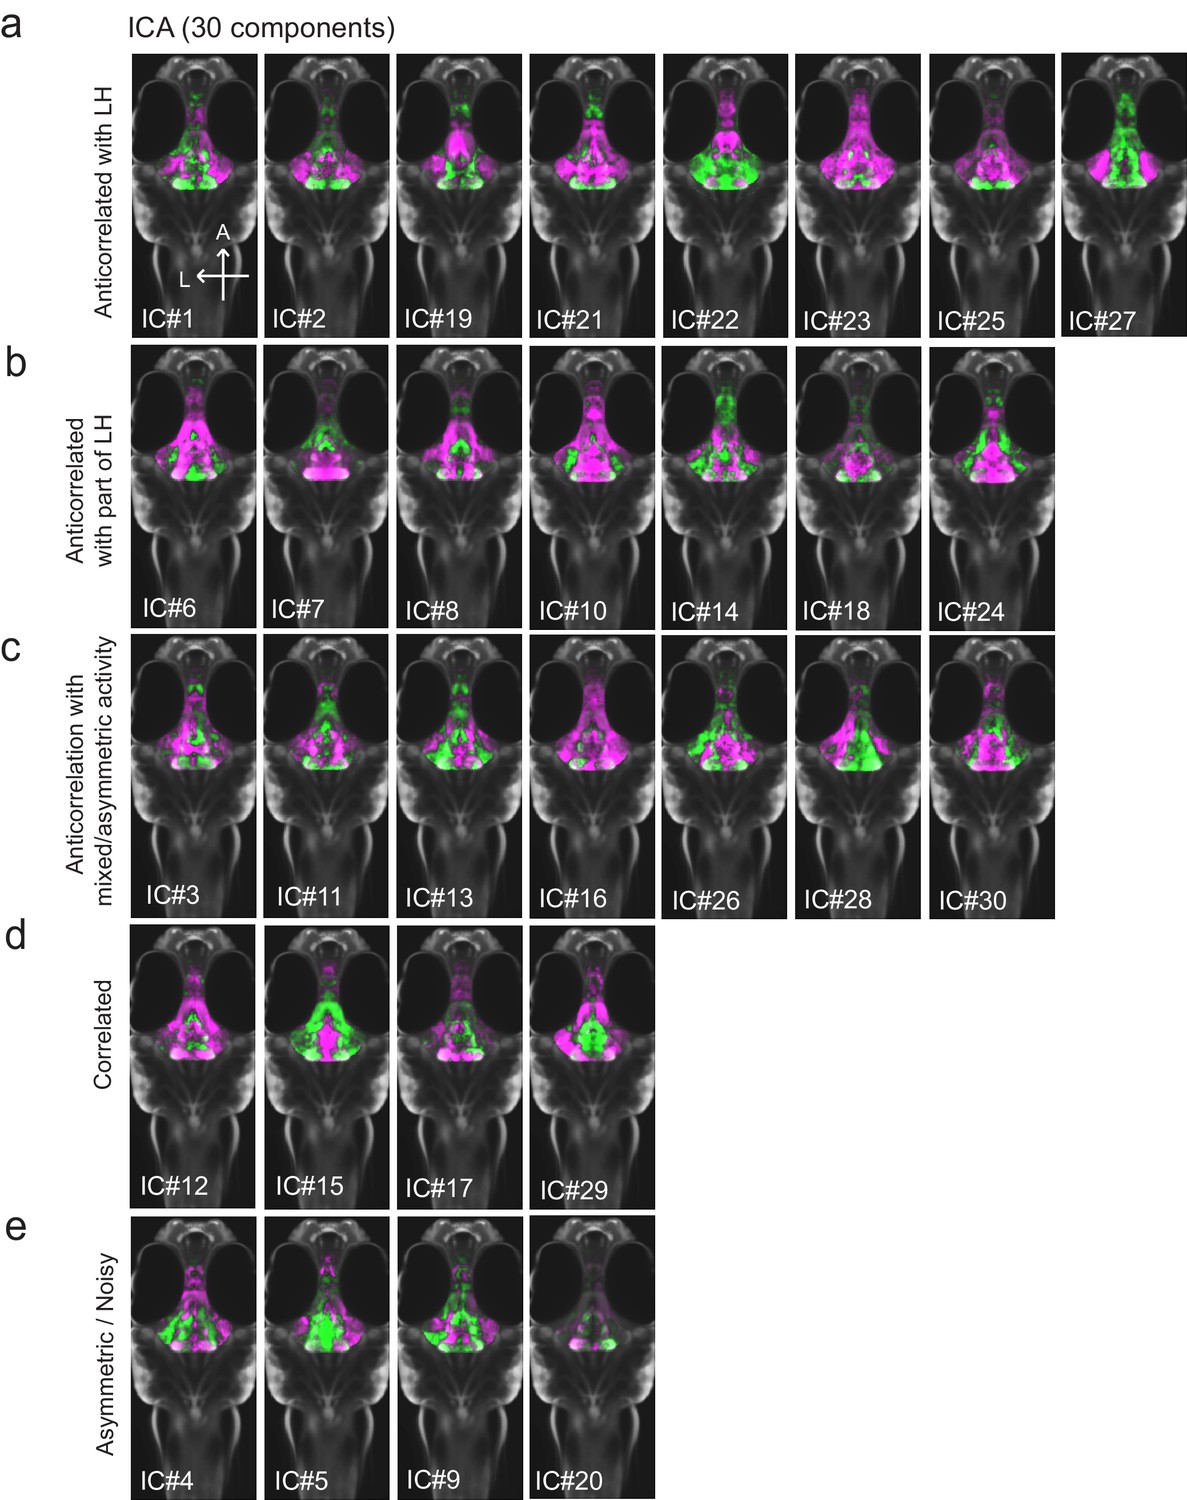
This method separates pERK signals into statistically independent components based on their correlated and anti-correlated activities, thus identifying putative functional connectivity (both positive or negative relationships) between different brain regions (Randlett et al., 2015; see Materials and methods). Fish included in this analysis were either food-deprived (2 hr), food-deprived and then fed for 15 min prior to harvest, or continuously fed (n = 300 fish total). (a-c) From this analysis, multiple independent component networks (ICs) were identified in which at least part of the LH displayed an inverse activity relationship (i.e. opposite loadings) with the cH (22/30). (d) 4/30 ICs had correlated LH and cH activity. However, in these cases lateral loci displayed some anti-correlated activity with medial loci (especially IC #15 and 29). (e) There were 4/30 ICs that displayed asymmetrical or noisy activity patterns that rendered them unclassifiable.
Figure 1—figure supplement 4
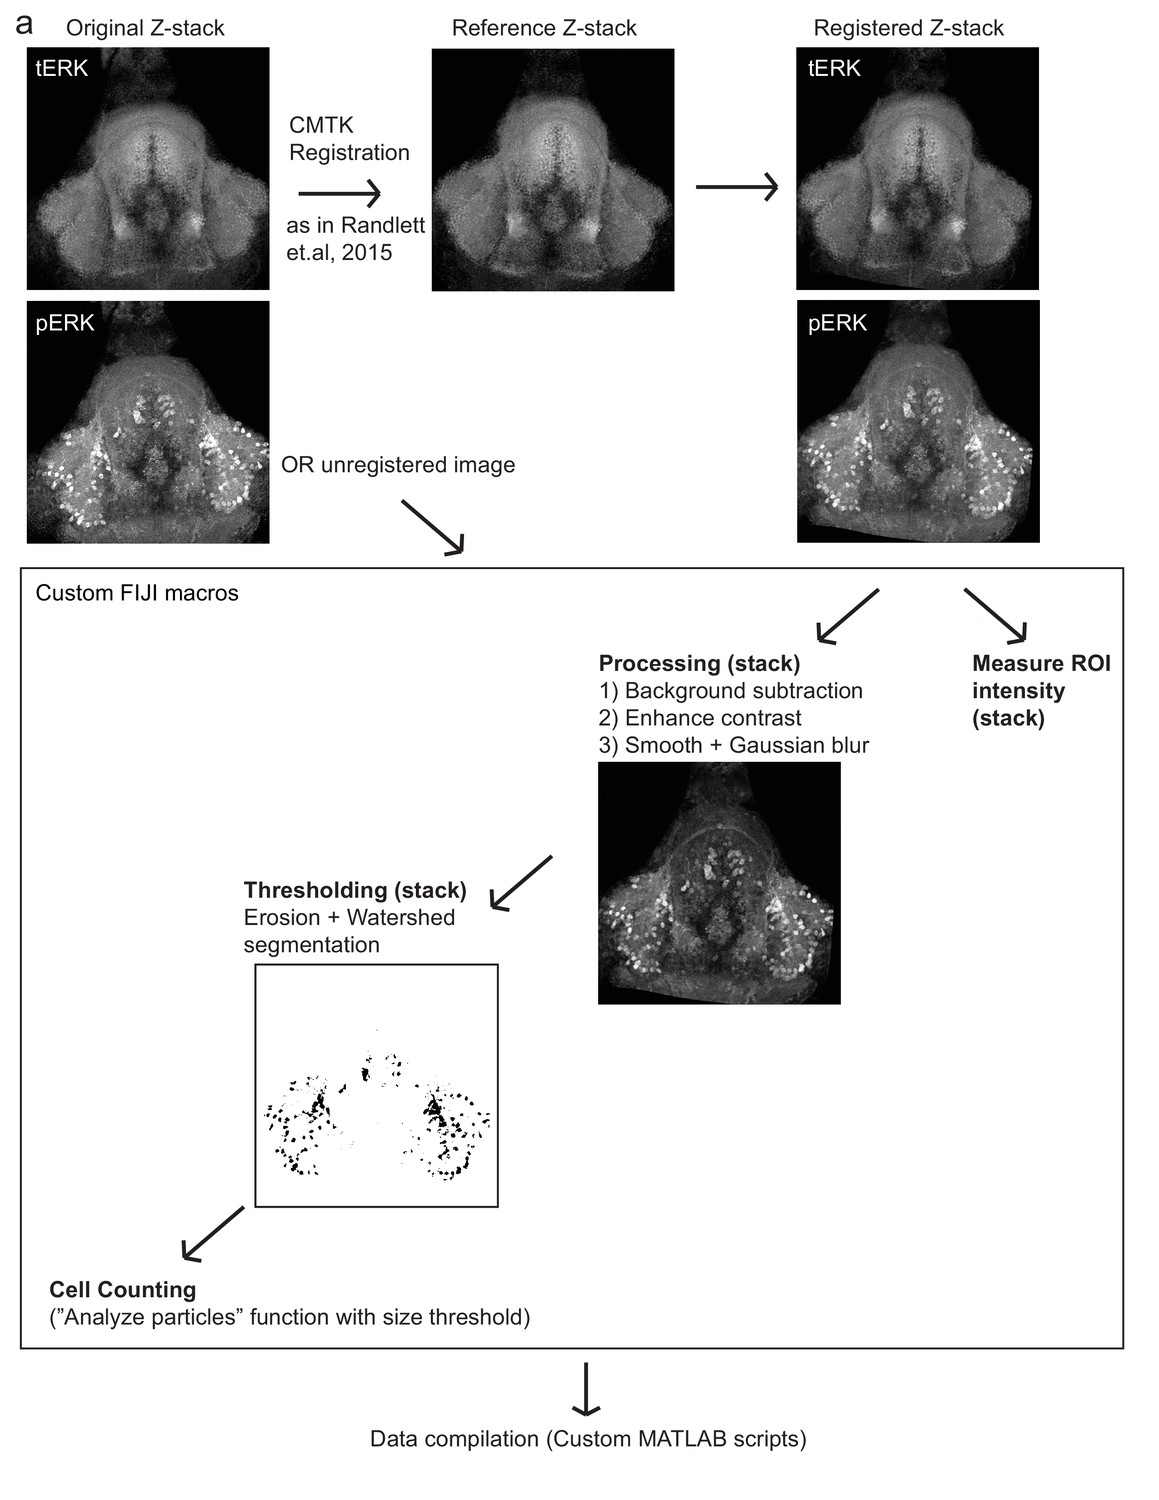
Automated quantification of pERK-positive (active) cells.
(a) Method by which pERK-positive (‘active’) cell count were determined in a high-throughput manner. Brain z-stacks obtained from confocal microscopy are registered with a selected reference brain within the same dataset, using the tERK channel, though in experiments where tERK staining was not performed, unregistered images were used (for which individual ROIs have to be defined for each image). A series of processing steps were uniformly applied to segment pERK-positive cells, which were selected using a manually optimized threshold across the entire dataset. Cell counts were obtained using the Analyze Particles algorithm within the Fiji software.
Figure 1—figure supplement 5
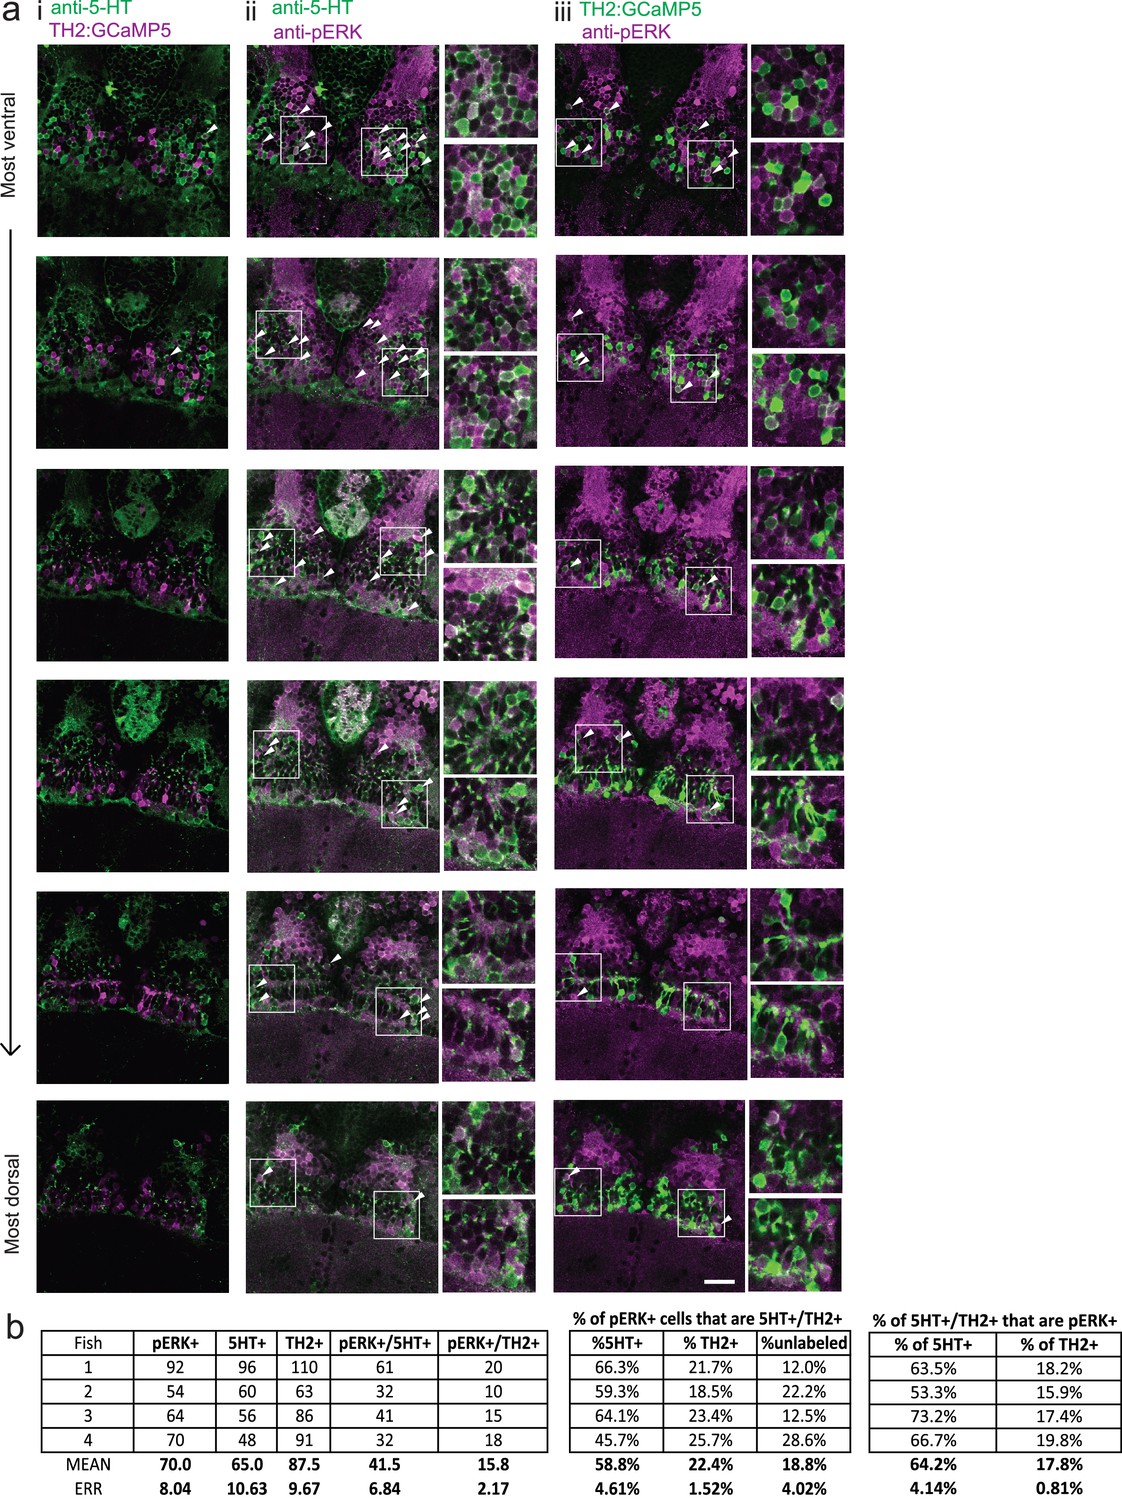
Food deprivation-induced activity in caudal hypothalamus monoaminergic neurons.
(a) Dopaminergic neurons are labeled in Tg(TH2:GCaMP5) fish. These animals were food-deprived for 2 hr and then co-stained with anti-5-HT (to label serotonergic neurons) and anti-pERK antibodies in order to quantify food deprivation-induced activity in both cell types. Each row shows a different z-plane, moving from ventral to dorsal. (i) There is minimal overlap between Tg(TH2:GCaMP5)-positive cells (magenta) and 5-HT labeling (green). There is higher overlap of anti-pERK staining (magenta) with (iii) 5-HT-positive cells (green) as compared to (ii) Tg(TH2:GCaMP5)-positive cells (green). White arrows point to examples of overlapping cells. White boxes indicate region shown in insets. Scale bar = 20 μm. Full z-stacks for (ii) pERK overlap with anti-5-HT staining (Video 2) and (iii) TH2:GCaMP5 expression (Video 3) are also provided. (b) Quantification of overlap between pERK-positive cells and anti-5-HT staining or Tg(TH2:GCaMP5) expression. Other cH cell types, including histaminergic neurons (Chen et al., 2016) are not labeled. Fish one corresponds to the fish shown in (a).
Figure 2 with 1 supplement
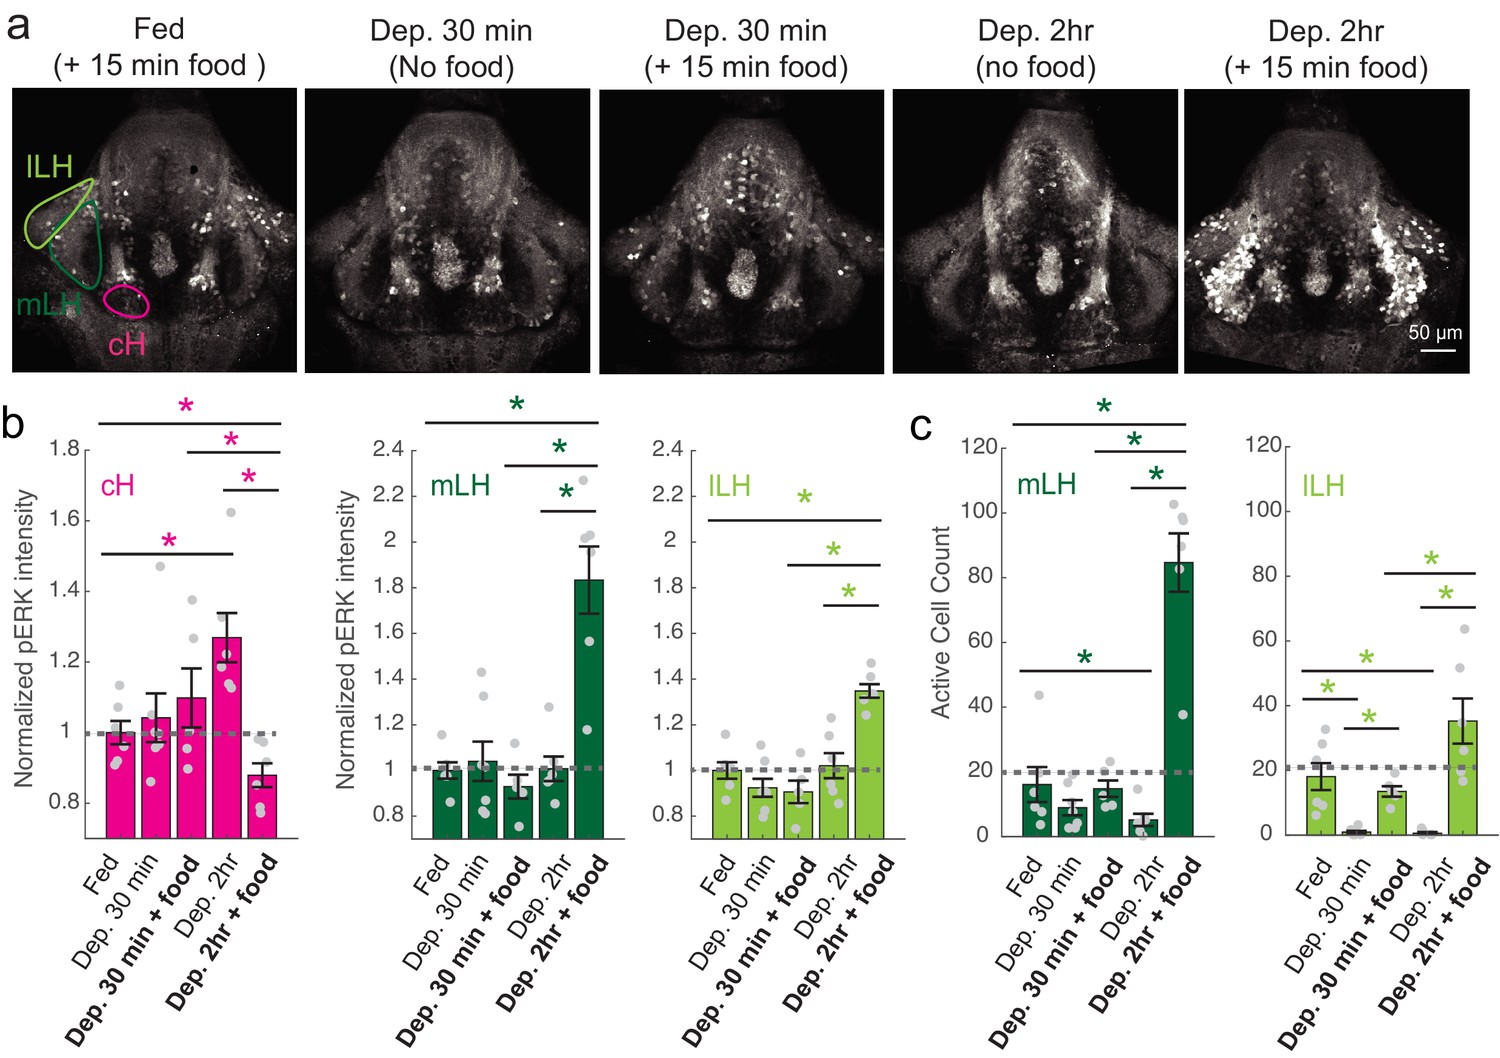
cH and LH activities are modulated by food and satiation state.
(a) Representative images showing that cH, mLH and lLH activities in the presence and absence of food vary with the extent of food deprivation (dataset quantified in b and c). (b) Normalized pERK average fluorescence intensity in cH significantly increases with food deprivation, and is significantly reduced when food is presented to food-deprived fish. Normalized mLH and lLH pERK average fluorescence intensity does not change significantly during food deprivation and strongly increases during voracious feeding (Dep. 2 hr + 15 min food). Asterisks denote p<0.05. Normalized pERK intensity (cH/mLH/lLH): Fed vs Dep. 30 min (p = 0.53/0.47/0.15), Fed vs Dep. 2 hr (p = 0.0022/0.41/0.59), Dep. 30 min + food vs Dep. 2 hr + food (p = 0.041/0.0022/0.0022), Dep. 30 min vs Dep. 30 min + food (p = 0.62/0.73/0.62), Dep. 2 hr vs Dep. 2 hr + food (p = 0.0022/0.0011/0.0022), Fed vs Dep. 2 hr + food (0.047/0.0011/0.0011). Anti-pERK staining fluorescence was averaged over each entire region of interest (i.e. cH, mLH and lLH; see Materials and methods for details). The normalized anti-pERK staining intensity for each region (ROI) was obtained by dividing the anti-pERK fluorescence from each fish (in all experimental groups) by the average anti-pERK fluorescence for the same ROI of continuously fed fish. (c) The number of active mLH and lLH cells declines within 30 min of food deprivation, and is significantly enhanced during feeding, particularly after a longer period of food deprivation. Active cell count (mLH/lLH): Fed vs Dep. 30 min (p = 0.155/5.8 × 10−4), Fed vs Dep. 2 hr (p = 0.047/0.011), Dep. 30 min + food vs Dep. 2 hr + food (p = 0.0022/0.0043), Dep. 30 min vs Dep. 30 min + food (p = 0.07/0.013), Dep. 2 hr vs Dep. 2 hr + food (p = 0.0011/0.0011), Fed vs Dep. 2 hr + food (p = 0.0022/0.07), n = 6/7/5/6/6 fish, one-tailed Wilcoxon rank-sum test. Data plotted in Figure 2 are provided in Figure 2—source data 1.
-
Figure 2—source data 1
Source data for plots displayed in Figure 2b-c.
- https://cdn.elifesciences.org/articles/43775/elife-43775-fig2-data1-v2.xlsx
Figure 2—figure supplement 1
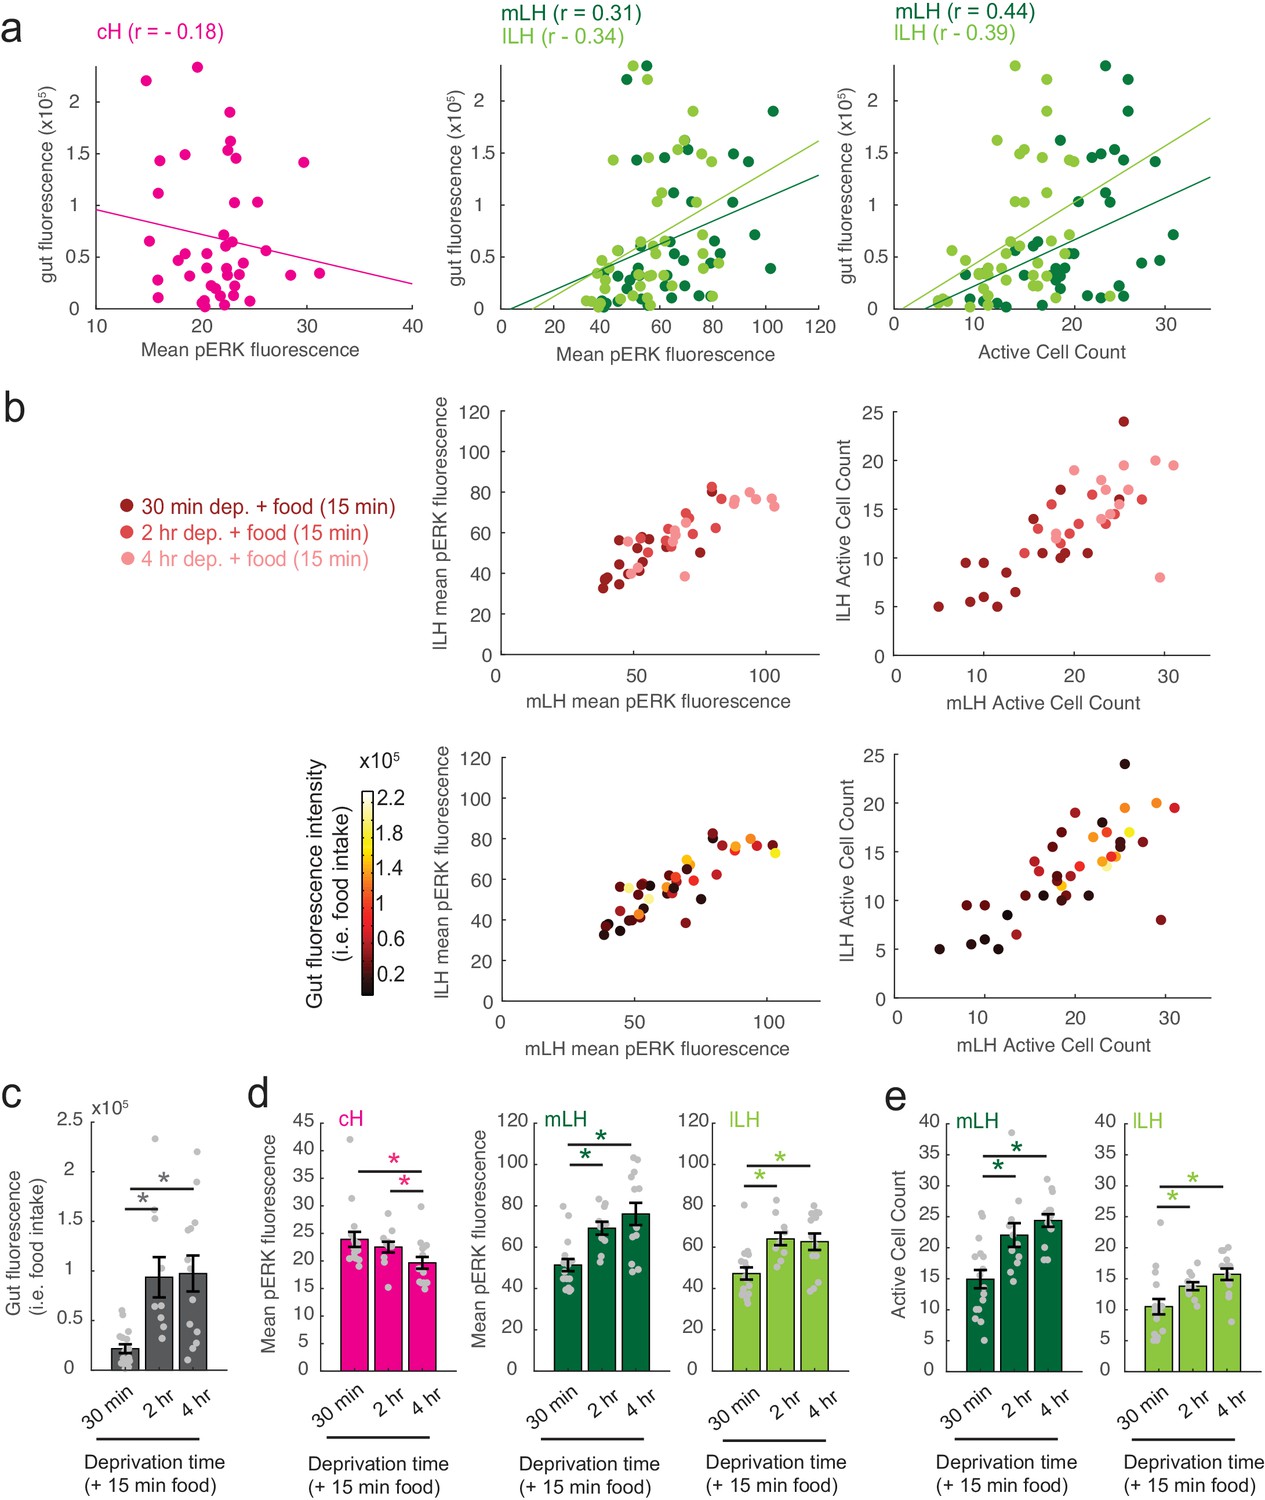
Modulation of cH, mLH and lLH activity in relation to feeding.
The dataset (n = 41 fish) includes animals food-deprived for 30 min (n = 16), 2 hr (n = 11), or 4 hr (n = 14), and subsequently fed labeled paramecia for 15 min. Brains from these animals were individually-stained with anti-pERK antibody in multi-well plates in order to correlate each fish's food intake with cH, mLH and lLH neural activity. (a) Gut fluorescence (i.e. food intake) of all fish as a function of mean cH pERK fluorescence, mean LH (mLH and lLH) anti-pERK staining average fluorescence and active cell count. Mean pERK fluorescence reflects the average fluorescence within the cH, mLH or lLH regions of interest. This dataset was not normalized. Each datapoint represents an individual fish. (b) Top: mLH and lLH mean pERK fluorescence (left), and active cell count (right) of all fish (n = 41) plotted as a function of food deprivation time (denoted by color intensity). Bottom: mLH and lLH mean fluorescence (left) and cell count (right) of all fish (n = 41) plotted as a function of gut fluorescence (i.e. food intake) after 15 min of feeding (denoted by color intensity). (c-e) Quantification of gut fluorescence, cH and LH mean pERK fluorescence and LH active cell count across the different food deprivation times (30 min, 2 hr, and 4 hr). Note that in this dataset, because anti-pERK was conducted on each brain individually, there is higher variance between specimens and reduced statistical significance in cH quantification data (compare with Figure 2b, left panel). Asterisks denote p<0.05. (c) Food intake: After 30 min vs 2 hr dep. (p = 2.8×10⁻⁴), 30 min vs 4 hr dep. (p = 4.0×10⁻⁴), 2 hr vs 4 hr dep. (p = 0.56). Asterisk denotes p<0.05, n = 16/11/14 fish (30 min/2 hr/4 hr dep. + 15 min food), one-tailed Wilcoxon rank-sum test. (d) Mean pERK fluorescence (cH/mLH/lLH): After 30 min vs 2 hr dep. (p = 0.55/0.001/5.9 × 10−4), 30 min vs 4 hr dep. (p = 0.0084/8.6 × 10−4/0.0058), 2 hr vs 4 hr dep. (p = 0.02/0.24/0.54). Sample sizes as in (c). (e) Active cell count (mLH/lLH): After 30 min vs 2 hr dep. (p = 0.0073/0.0094), 30 min vs 4 hr dep. (p = 1.6×10⁻⁴/0.0017), 2 hr vs 4 hr dep. (p = 0.056/0.053). Sample sizes as in (c).
Figure 3 with 3 supplements
Caudal and lateral hypothalamic responses to prey sensory cues are anti-correlated over short timescales.
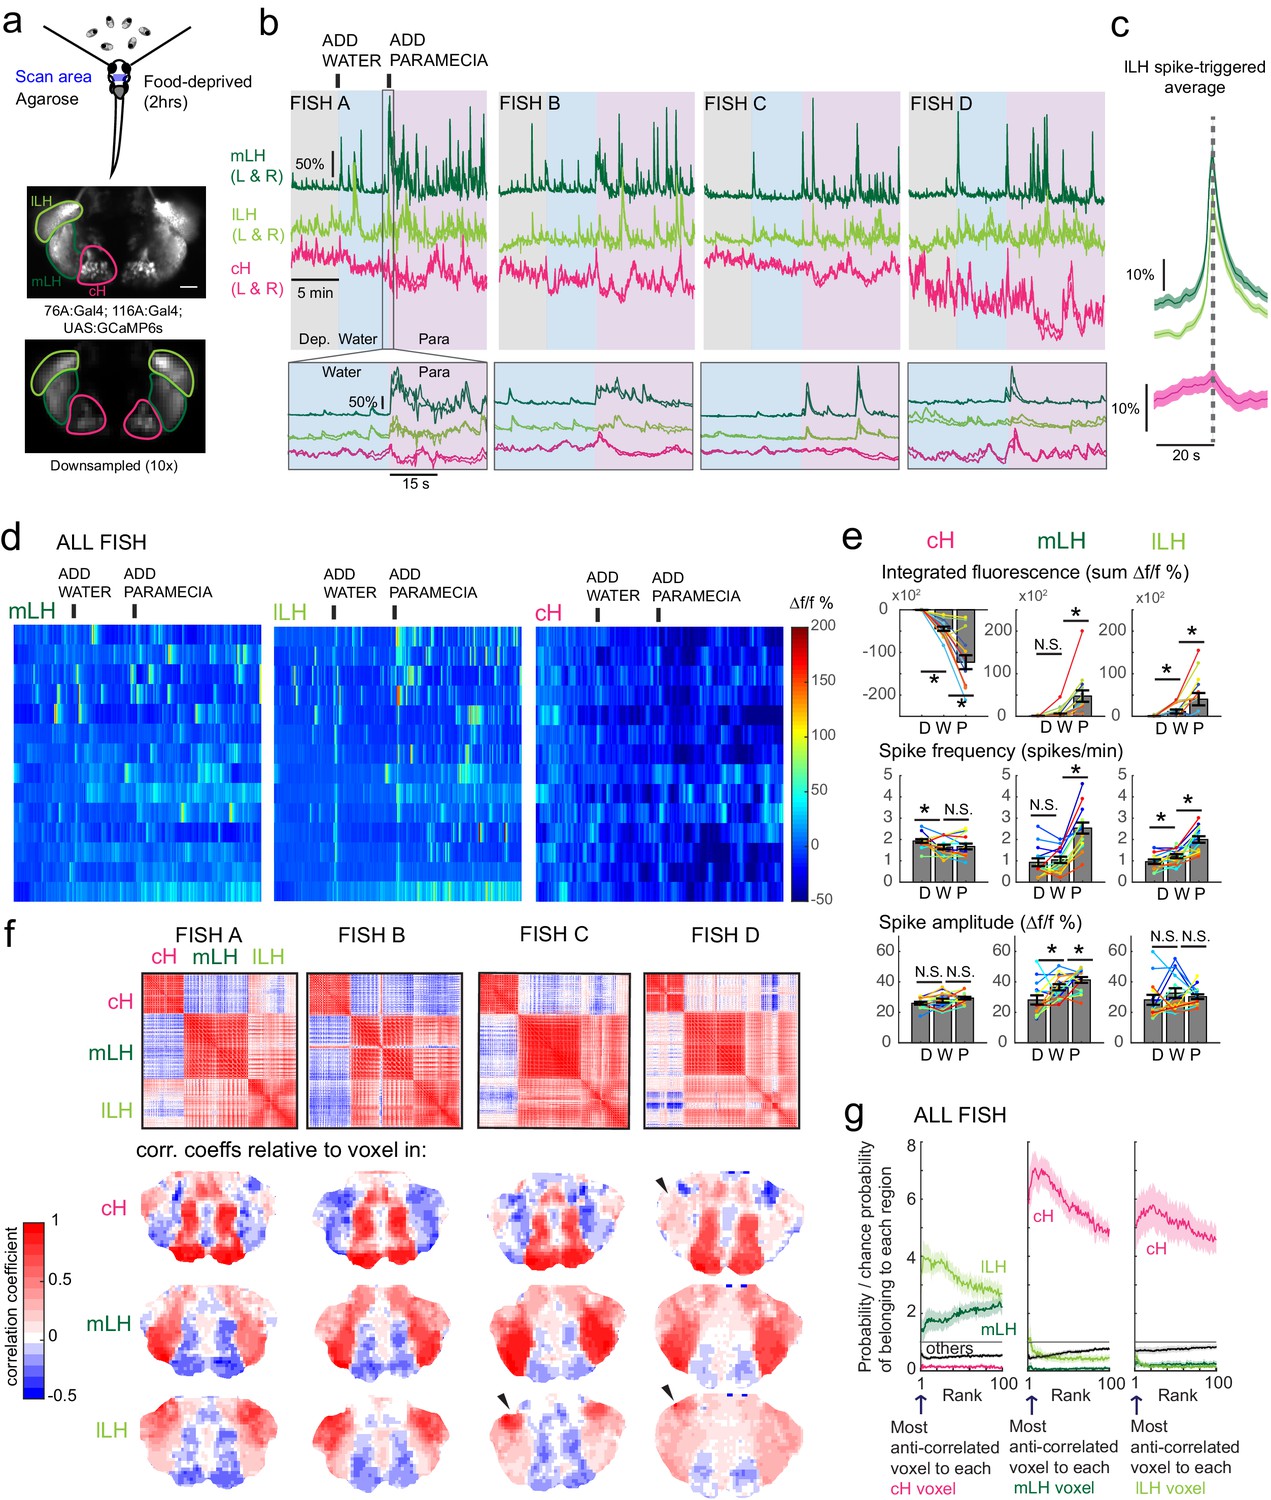
(a) Top: Transgenic fish (2 hr food-deprived) with GCaMP6s expressed in cH and LH neurons were paralyzed, tethered in agarose with their eyes and nostrils freed and exposed to live paramecia (prey), as described in Materials and methods. Top image: GCaMP expression in the cH and LH driven by two transgenic lines, Tg(116A:Gal4) and Tg(76A:Gal4) respectively. Bottom image: Downsampled image stack used for analysis in (f). (b) Top: Mean calcium activity (Δf/f) from respective hypothalamic ROIs (shown in (a)) from four individual fish during a baseline food-deprived period (Dep.), exposure to water alone (Water), and a dense water drop of paramecia (Para). Traces from left and right hypothalamic lobes of the same animal are overlain, revealing a high degree of correlated activity on opposite sides of the midline. Paramecia presentation increases activity in the LH and reduces activity in the cH, revealing opposing activity on short timescales. Bottom: Δf/f traces within area marked by gray box (top), displayed at higher magnification. An increase in LH activity and corresponding reduction in cH activity is observable within seconds of paramecia presentation, except for fish D in which maximal responses only occur after a few minutes (beyond the displayed time window). (c) Average Δf/f triggered on lLH calcium spikes (left and right lobes averaged) shows a mean corresponding reduction in cH activity (n = 159 lLH spikes extracted from mean Δf/f traces from 14 fish across the entire duration of the experiment). (d) Raster plots showing mean calcium activity from the hypothalamic lobes (left and right lobes averaged) of 14 fish before and after presentation of water alone and water with paramecia. (e) Quantification of integrated fluorescence (sum Δf/f %), calcium spike frequency (spikes/min) and calcium spike amplitude (Δf/f %) per fish across experimental epochs (300 s food-deprived baseline (D), 300 s after water (W) delivery or 600 s after paramecia delivery (P)). Each colored line represents data from an individual fish (left and right lobes averaged). Water alone was sufficient to significantly reduce cH integrated fluorescence (p = 6.1×10⁻⁵) and spike frequency (p = 0.0127) but not spike amplitude (p = 0.9324). Water alone was similarly sufficient to increase lLH integrated fluorescence (p = 0.029) and spike frequency (p = 0.0098) but not spike amplitude (p = 0.13). Conversely, water alone was not sufficient to significantly modulate mLH integrated fluorescence (p = 0.48) or spike frequency (p = 0.20), but was sufficient to increase spike amplitude (p = 0.039). Paramecia delivery significantly increased mLH and lLH integrated fluorescence (mLH, p = 1.2×10⁻⁴; lLH, p = 0.045) and spike frequency (mLH, p = 6.1×10⁻⁵; lLH, 6.1 × 10⁻⁴), while only significantly increasing mLH spike amplitude (mLH, p = 0.045; lLH, p = 0.43), relative to water delivery. In contrast, paramecia delivery significantly reduced cH integrated fluorescence relative to water delivery alone (p = 3.1×10⁻⁴), but not spike frequency (p = 0.52) nor spike amplitude (p = 0.85). Asterisks denote p<0.05, one-tailed Wilcoxon signed-rank test. (f) Top: Cross-correlogram of hypothalamic cell-sized voxels (cells and/or neuropil from downsampled image stacks, see (a)) from four fish. The cH and LH voxels were mostly anti-correlated, whereas voxels within each cluster displayed correlated activity. Black arrowheads indicate region of lLH that appears to be most anti-correlated with the cH. Bottom: Correlation coefficients of other hypothalamic voxels relative to a selected voxel with the cH, mLH or lLH. See color key for numerical translation of color maps. (g) Summary of data from 14 fish, showing the probability of the nth most anti-correlated voxel belonging to each of the other regions (cH, mLH or lLH), normalized to chance probability (gray line) of belonging to each region (i.e. the fraction of all voxels occupied by each region). For example, if we consider all the voxels within the cH, there is a four-fold probability relative to chance of their most anti-correlated voxels (Rank = 1) being part of the lLH.
Figure 3—figure supplement 1
Characterization of the 116A:Gal4 line.
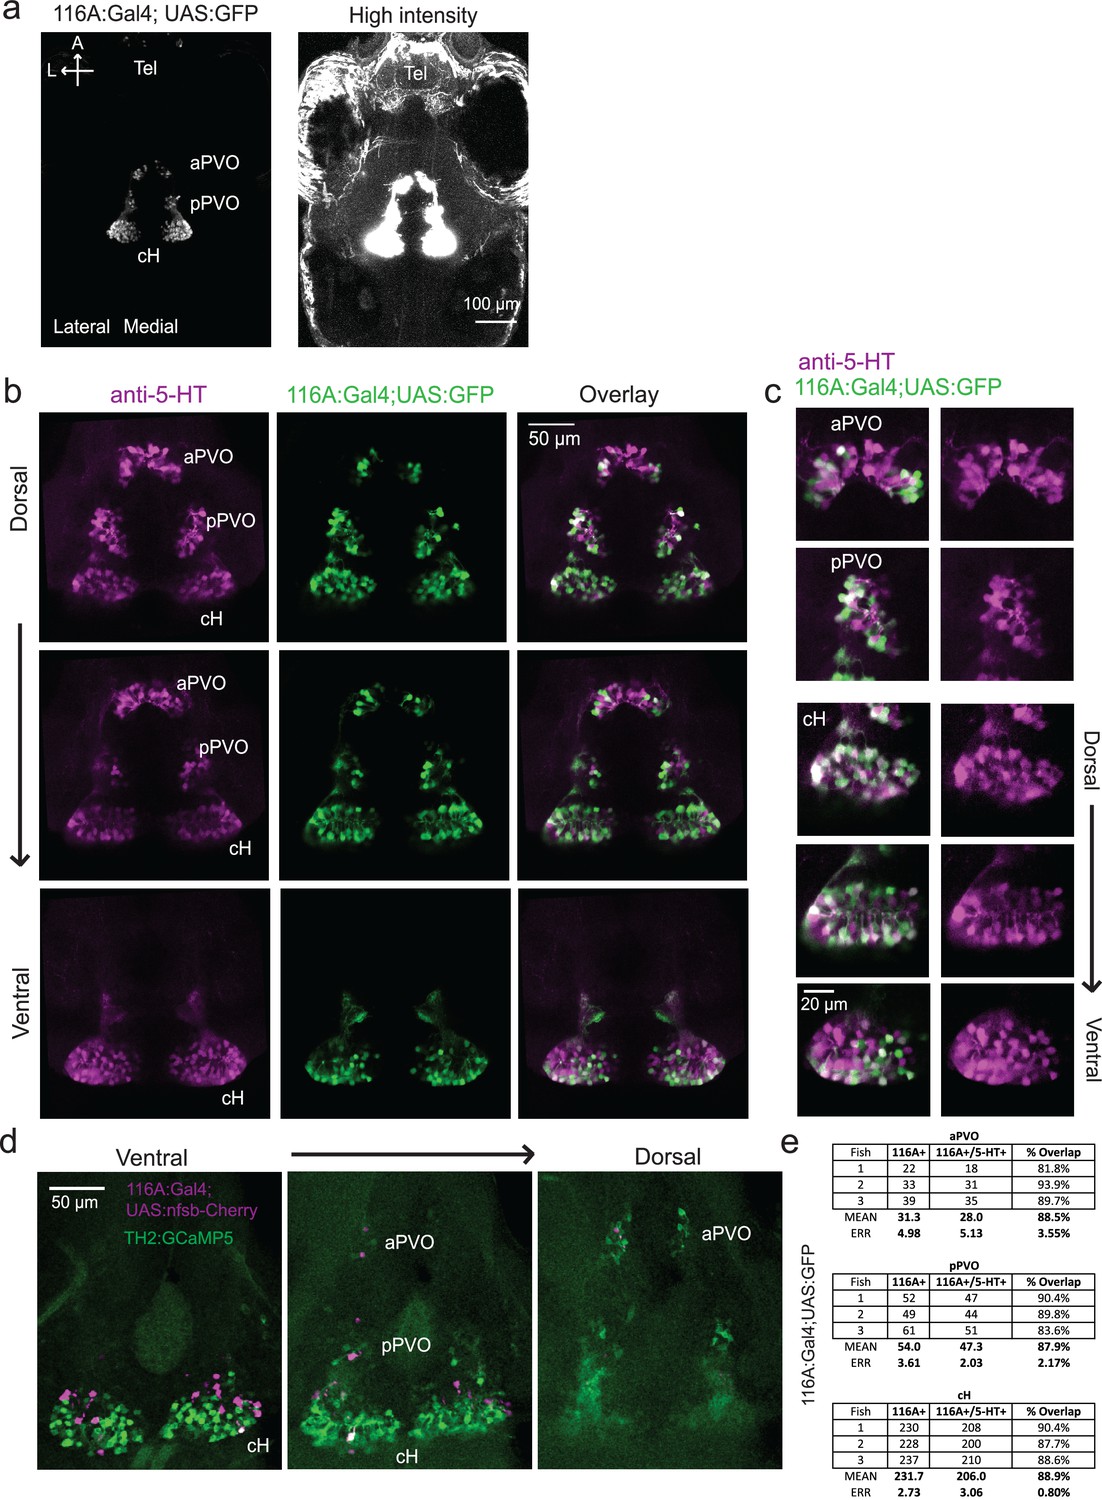
(a) Z-projection images of whole mount Tg(116A:Gal4;UAS:GFP) fish at low (left) and high (right) intensities. Scale bar = 100 μm. (b) Overlap of Tg(116A:Gal4;UAS:GFP) (green) with anti-5-HT (magenta) immunostaining is seen in all layers of the caudal hypothalamus, as well as the anterior and posterior paraventricular organ (aPVO and pPVO). Each row shows a different z-plane, moving from dorsal to ventral. Scale bar = 50 μm. (c) Higher magnification images of the cH, aPVO and pPVO from left side of image in (c). (d) Minimal overlap of Tg(116A:Gal4;UAS:nfsb-mCherry) (magenta) with dopaminergic neurons labeled by Tg(TH2:GCaMP5) (green). Note that the Tg(116A:Gal4;UAS:nfsb-mCherry) transgenic, which is used in ablation experiments, shows sparser labeling than with Tg(UAS:GFP). In this fish, 2 out of 17 (11.8%) of Tg(116A:Gal4;UAS:nfsb-mCherry) cells overlapped with Tg(TH2:GCaMP5) expression. Scale bar = 50 μm. (e) Quantification of 5-HT overlap with Tg(116A:Gal4;UAS:GFP) in the cH, aPVO and pPVO.
Figure 3—figure supplement 2
Overlap of 116A:Gal4 and 76A:Gal4 driven reporter expression with hypothalamic activity under conditions of food deprivation and feeding.
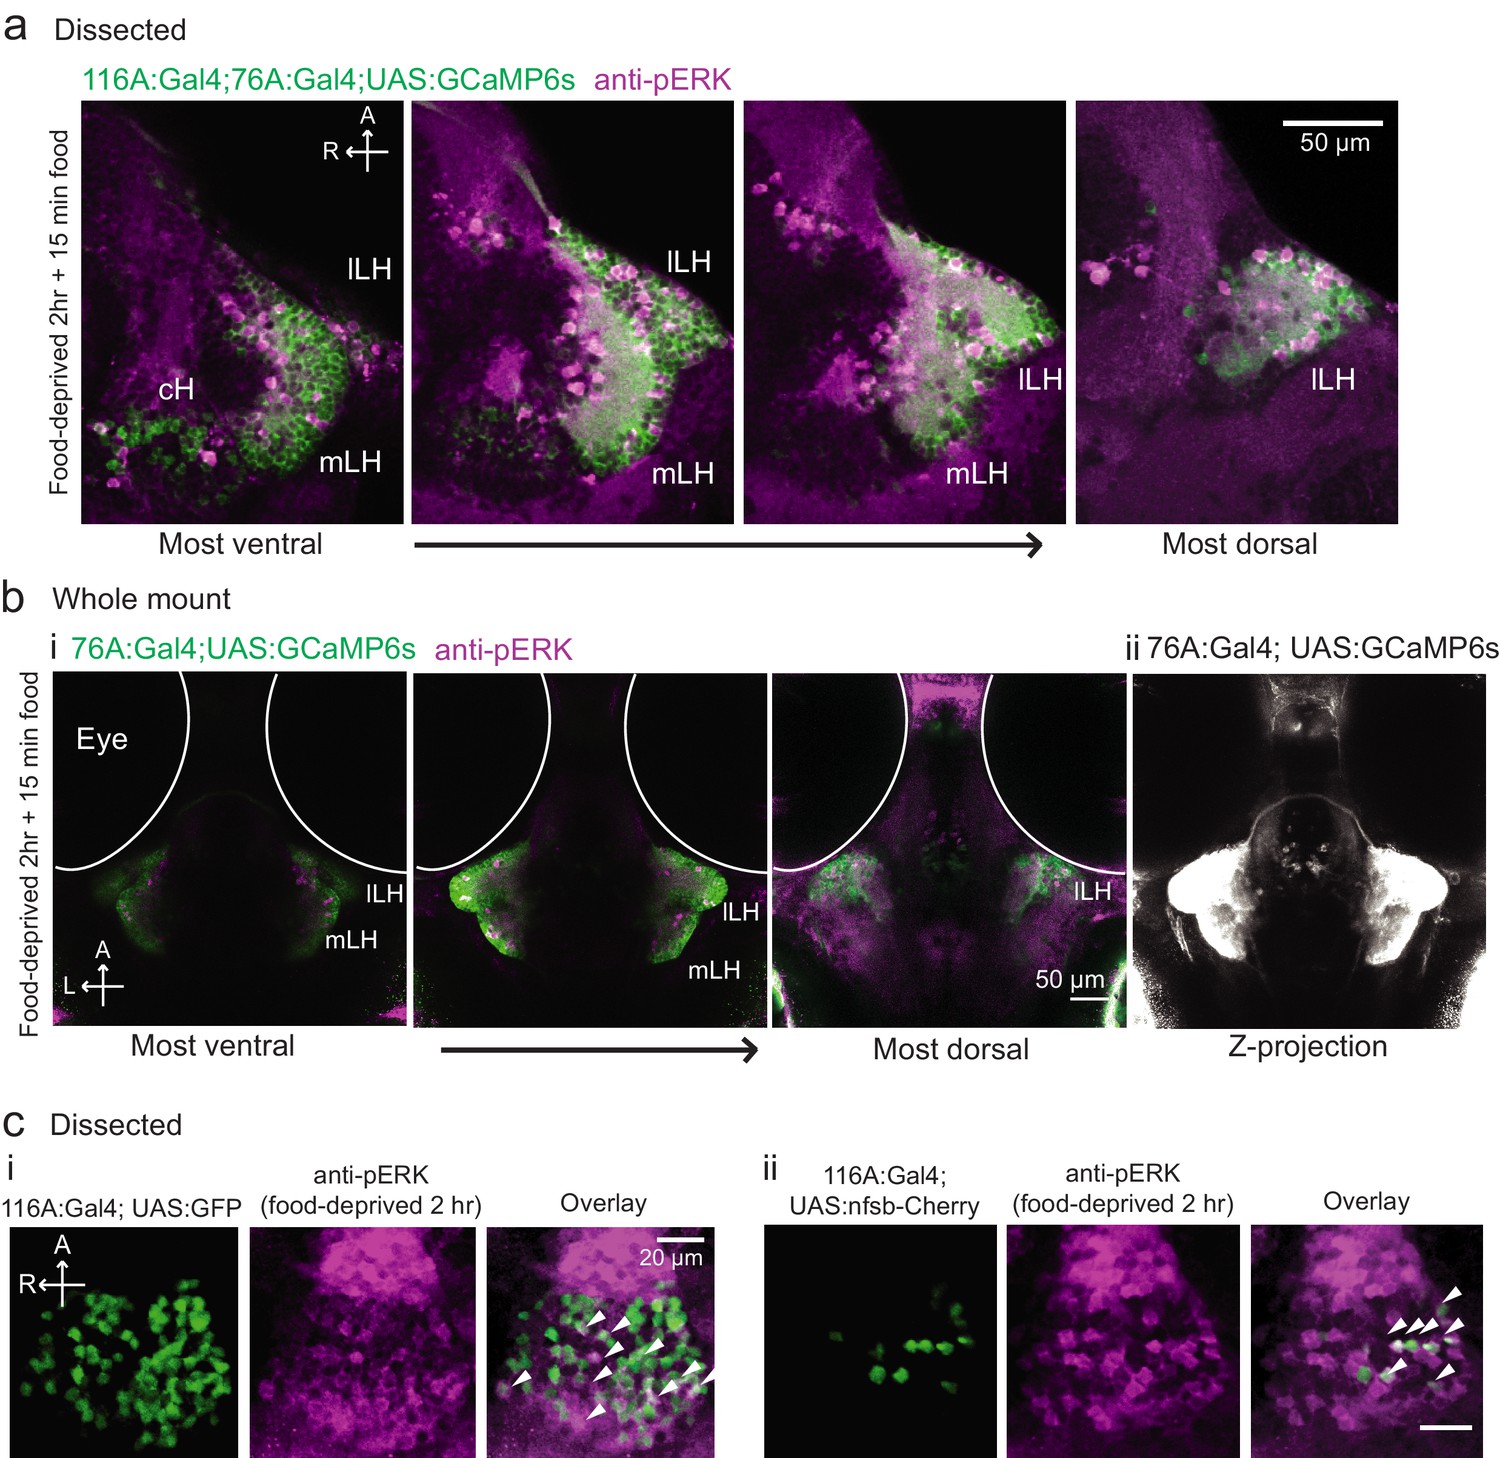
(a) mLH and lLH activity in voraciously-feeding (food-deprived 2 hr + 15 min paramecia) fish overlaps with Tg(76A:Gal4;UAS:GCaMP6s) expression (green, dissected brains). All visible pERK-positive neurons (magenta) were also co-labeled with GCaMP6s. Tg(116A:Gal4) is also expressed (green). Scale bar = 50 μm. (b) mLH and lLH activity in voraciously-feeding fish overlaps with Tg(76A:Gal4;UAS:GCaMP6s) expression (whole-mount). All visible pERK-positive neurons were also co-labeled with GFP. Note that more dorsally and anteriorly (as visible in the third panel of (i), and the z-projection in (ii)) other neurons beyond the LH are labeled by Tg(76A:Gal4;UAS:GCaMP6s). Scale bar = 50 μm. (c) pERK-positive cells (magenta) in 2 hr food-deprived fish overlap partially with Tg(116A:Gal4) expression (green, dissected brains). (i) Overlap with Tg(116A:Gal4;UAS:GFP) (ii) Overlap with Tg(116A:Gal4;UAS:nfsb-mCherry). Scale bar = 20 μm.
Figure 3—figure supplement 3
Calcium imaging of the cH and LH over food deprivation.
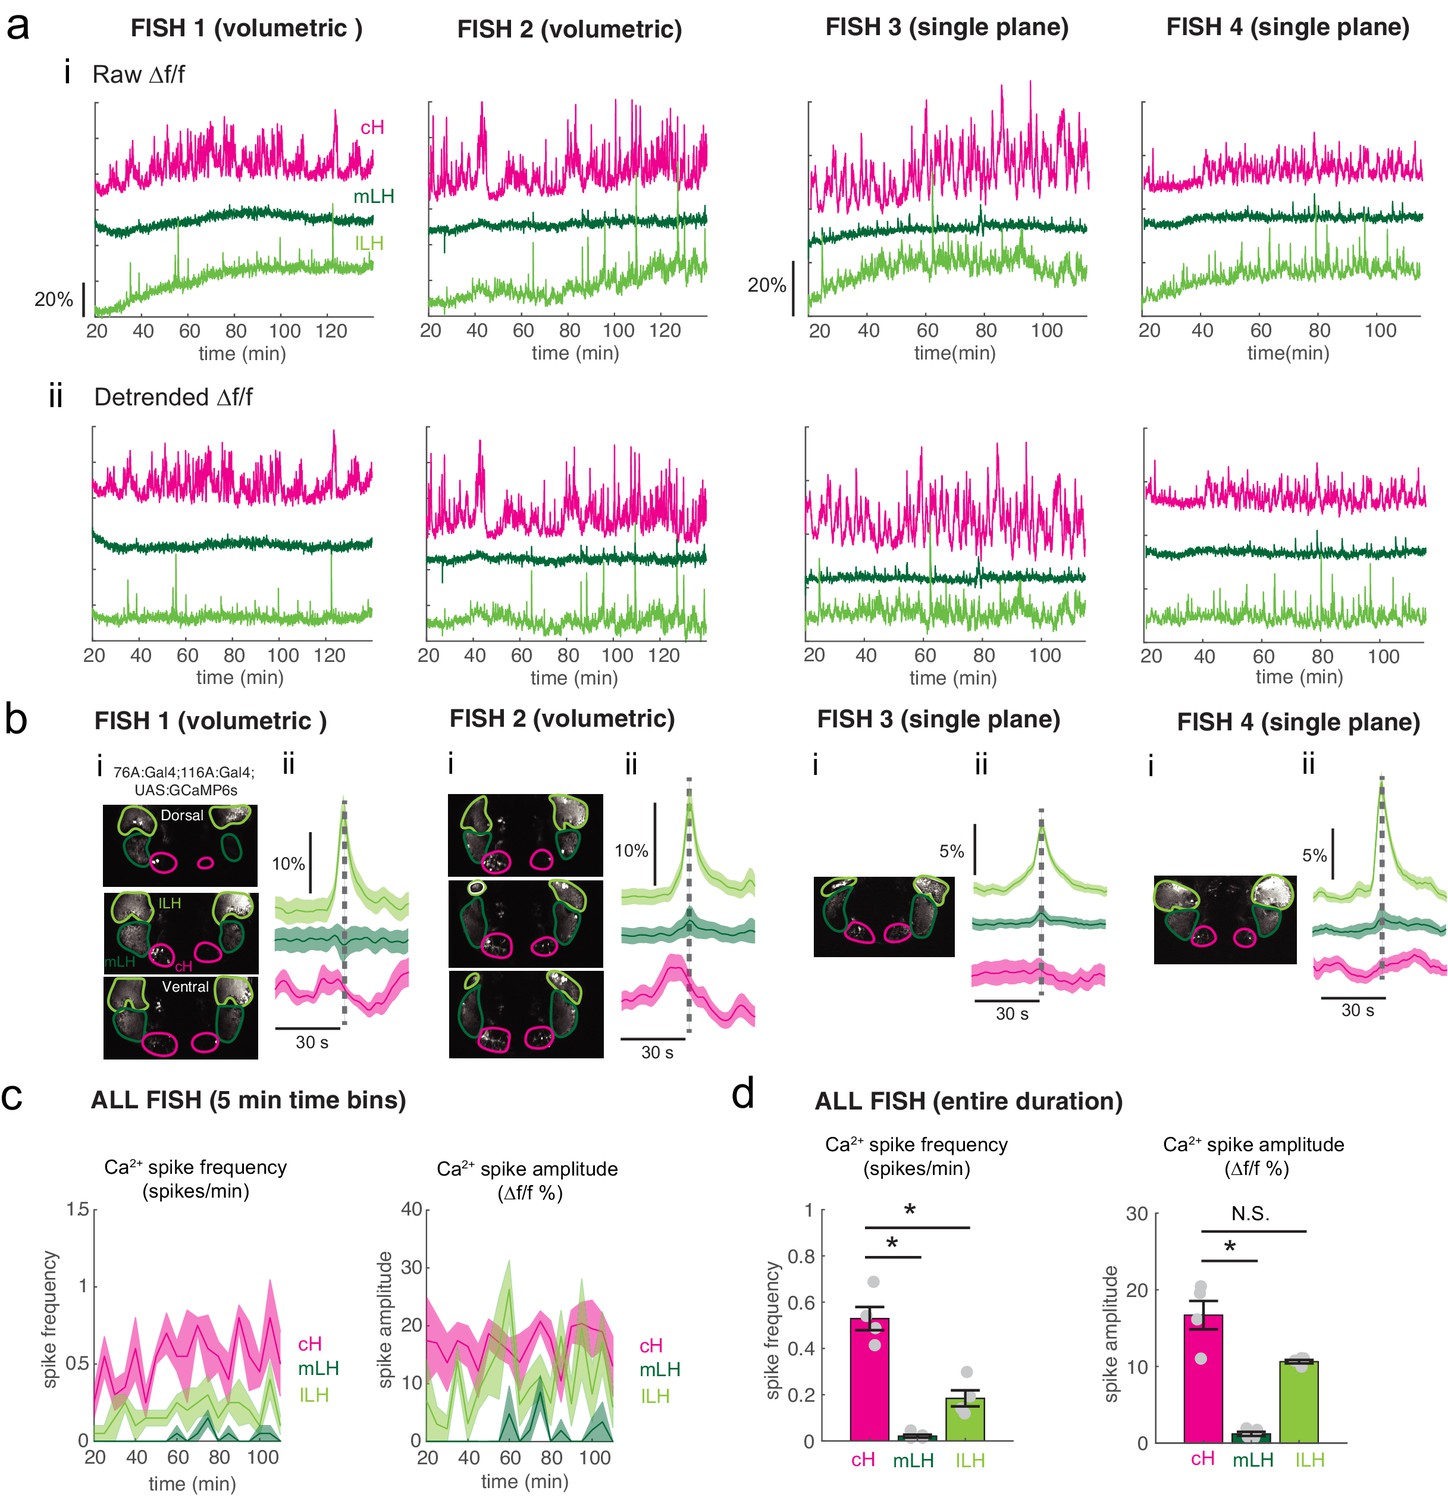
Note that fish were imaged ~20 min after embedding, thus initial food deprivation time is already 20 min. Hence, the initial reduction in LH active cell count, which occurs within 30 min (Figure 2) may not be observable using this imaging method. (a) Fish 1 and 2 were imaged using volumetric imaging for 115 min, whereas fish 3 and 4 were imaged only at a single plane, and for a slightly shorter time period of 90 min (see images in (b)) (i): Mean Δf/f across the entire (both lobes) of the cH, mLH and lLH (i.e. raw) show increases in baseline fluorescence over time. (ii) Mean Δf/f with baseline subtracted (i.e. detrended). Since a rising baseline over long imaging periods is difficult to interpret (see text for discussion), we also display detrended traces. (b) (i): Average intensity projection images showing imaged regions with ROIs outlined. (ii) Spike-triggered averages based on extracted lLH calcium spikes (from detrended traces) usually reveal an accompanying reduction in cH calcium fluorescence (Δf/f). (c) Calcium spike frequency (spikes/min, left) and calcium spike amplitude (Δf/f %, right) for each ROI averaged over 5 min bins throughout the imaging session for the above four fish. Colored lines are the means, shaded areas reflects SEM. (d) Over the entire imaging period, calcium spike frequency (left) was significantly higher in the cH as compared to the mLH (p = 0.014) and lLH (p = 0.014). Calcium spike amplitude (right) was also significantly higher in the cH as compared to the mLH (p = 0.014), but not the lLH (p = 0.057), asterisks denote p<0.05, one-tailed Wilcoxon rank-sum test.
Figure 4
Sensory cues and prey ingestion differentially regulate cH and LH neural activity.
(a) Representative images of activity induced by exposure of 7–8 dpf larval zebrafish to paramecia or artemia larvae, as examined by anti-pERK antibody staining. Hatched artemia are actively hunted but are too large to consume, allowing for the dissociation of sensory cues and hunting behavior from prey consumption. Scale bar = 50 μm. Rightmost two panels (top and bottom): Larval zebrafish hunt live artemia, performing J-turns and pursuits with eyes converged (see Video 4; Bianco et al., 2011). (b) cH activity (normalized pERK fluorescence intensity) is significantly reduced by exposure to paramecia but not by exposure to artemia (p = 0.016 (paramecia), 0.648 (artemia)). Asterisks denote p<0.05. (c) LH activity can be induced by artemia, and more strongly by paramecia. Both normalized pERK intensity (mLH: p = 2.06×10⁻⁵ (paramecia vs control), p = 7.09×10⁻⁴ (artemia vs control), p = 5.43×10⁻⁵ (artemia vs paramecia); lLH: p = 2.06×10⁻⁵ (paramecia vs control), p = 0.020 (artemia vs control), p = 0.0019 (artemia vs paramecia)) and active cell count (mLH: p = 2.06×10⁻⁵ (paramecia vs control), p = 9.58×10⁻⁵ (artemia vs control), p = 1.77×10⁻⁴ (artemia vs paramecia); lLH: p = 2.06×10⁻⁵ (paramecia vs control), p = 9.75×10⁻⁵ (artemia vs control), p = 9.86×10⁻⁵ (artemia vs paramecia)) are shown, with n = 9/9/11 fish, one-tailed Wilcoxon rank-sum test. Anti-pERK staining fluorescence was averaged over each entire region of interest (cH, mLH and lLH; see Materials and methods for details). The normalized anti-pERK staining intensity for each region (ROI) was obtained by dividing the anti-pERK fluorescence from each fish (in all experimental groups) by the average anti-pERK fluorescence for the same ROI of food-deprived (i.e. control) fish. We also compared the artemia-induced activity change (θA) to the paramecia-induced activity change (θP) for each lobe (see main text). (d) Differential neural activation of the cH and LH regions in response to prey sensation and hunting as compared to prey ingestion. Data plotted in Figure 4 are provided in Figure 4—source data 1.
-
Figure 4—source data 1
Source data for plots displayed in Figure 4b-c.
- https://cdn.elifesciences.org/articles/43775/elife-43775-fig4-data1-v2.xlsx
Figure 5 with 2 supplements
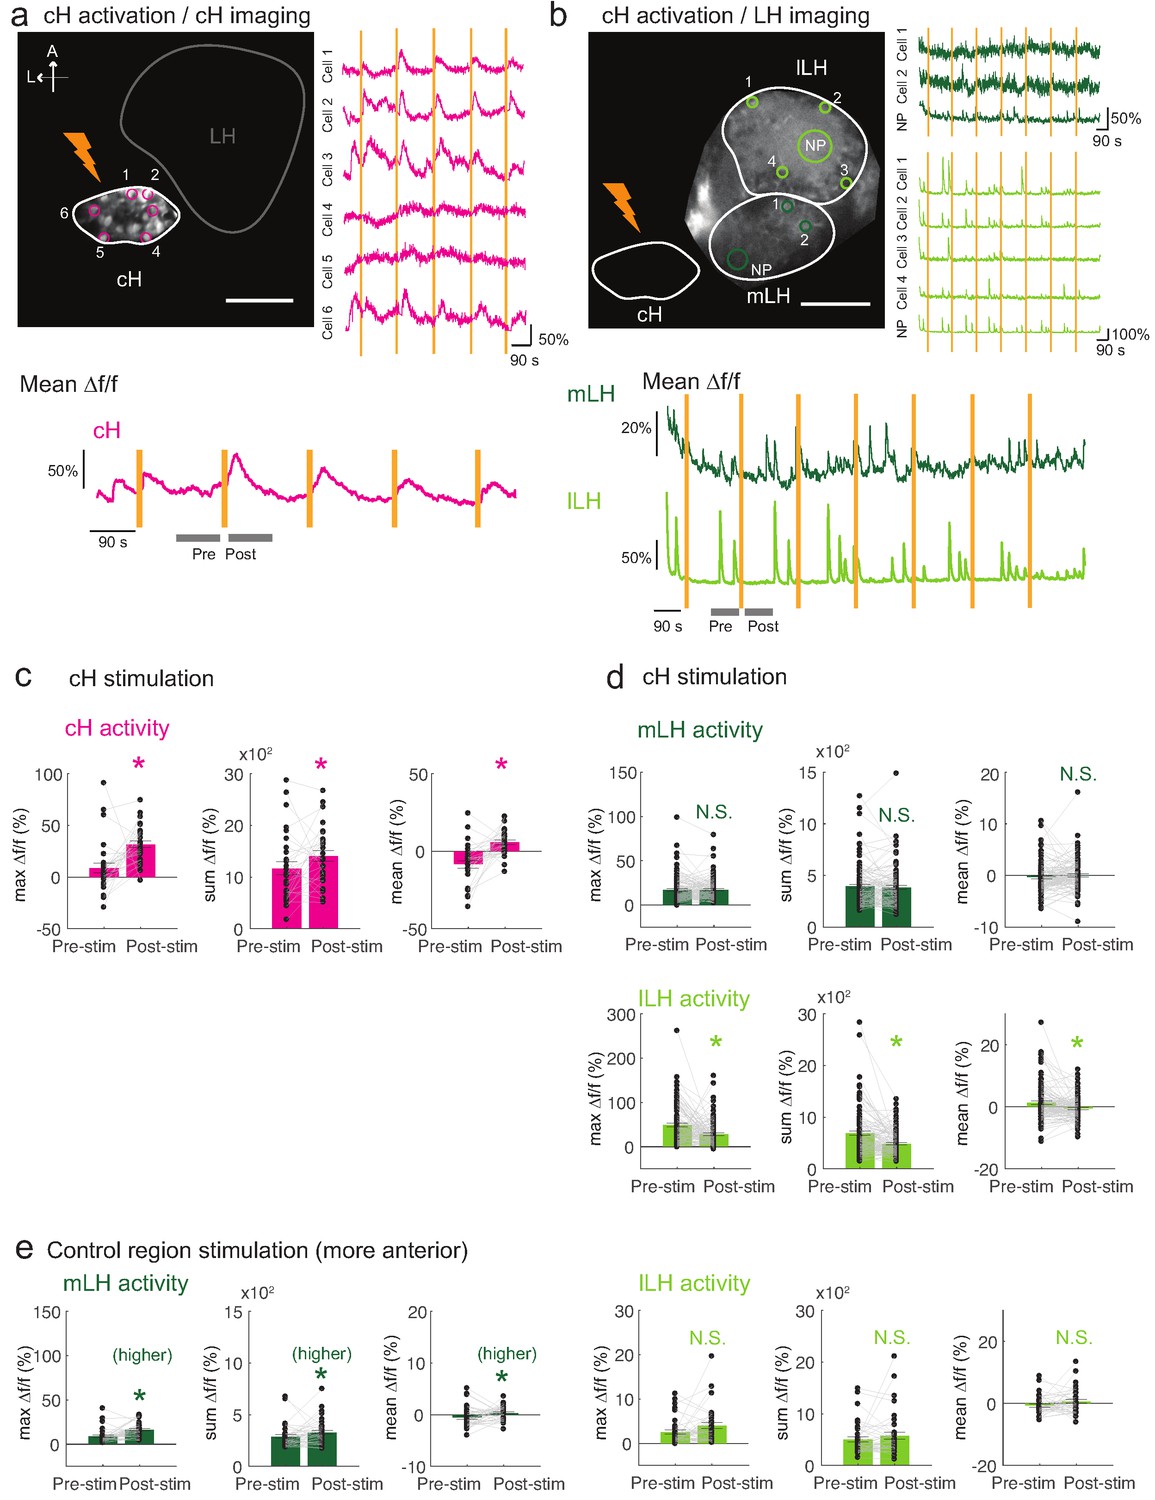
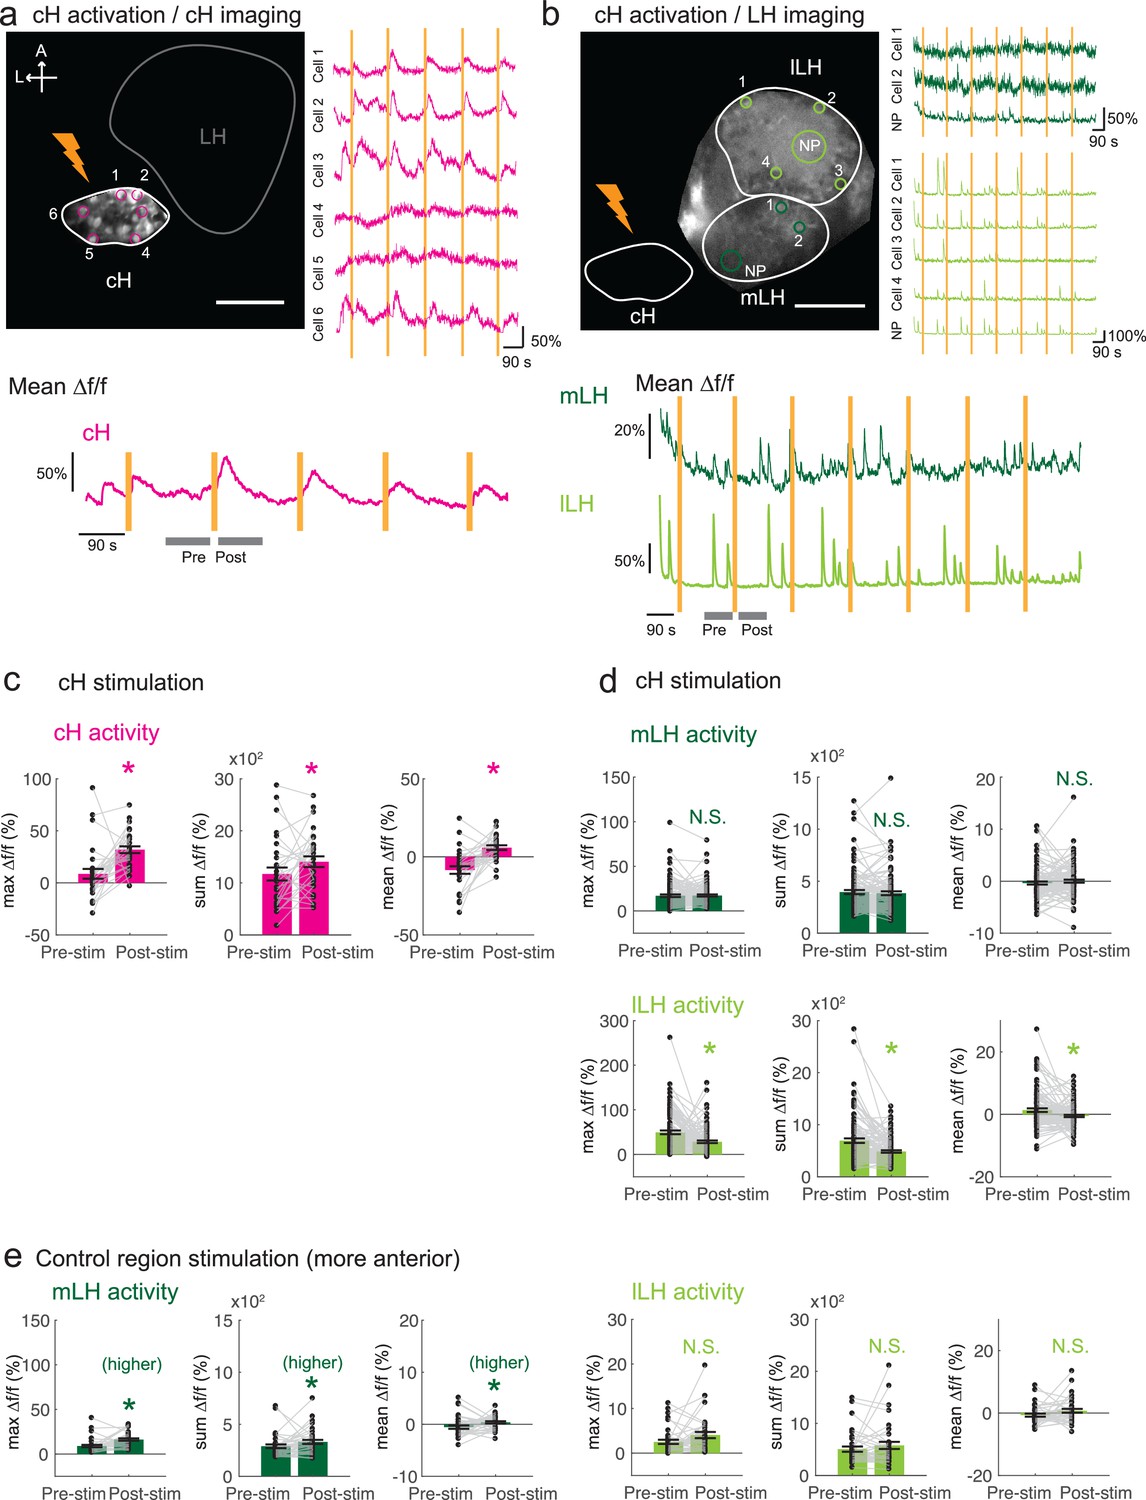
Optogenetic cH stimulation reduces lLH activity in tethered fish.
(a) ReaChR activation of neurons. Top Panels: Targeted 633 nm laser illumination (see Materials and methods) of a defined cH area (imaged area) in Tg(y333:Gal4;UAS:ReaChR-RFP; UAS:GCaMP6s) fish. These animals express a Tg(UAS:GCaMP6s) reporter in the cH under Tg(y333:Gal4) control. The animals were subjected to repetitive 10 s laser illumination, with a periodicity of 120 s. Following the 633 nm laser pulses, there is widespread induction of cH activity, as indicated by GCaMP fluorescence (Δf/f) in most regions of interest plotted to the right of the image panel. Scale bar = 50 μm. Bottom Panel: Mean Δf/f across the entire outlined cH region versus time. Laser illumination pulses are indicated by orange bars. Gray bars indicate pre- and post-stimulation periods for which metrics shown in (c–e) were determined. (b) Inhibition of LH activity by activation of cH neurons in Tg(y333:Gal4;UAS:ReaChR-RFP; HuC:GCaMP6s) fish. The animals were subjected to repetitive 10 s laser illumination, with a periodicity of 180 s. Laser pulses were delivered to the cH (orange lightning symbol) as in a, and calcium imaging was recorded from the indicated LH areas (white outlines). Region of interest traces are shown to the right of the image panel for the indicated areas (cells and neuropil (NP)). There is an apparent reduction of spontaneous lLH GCaMP fluorescence spikes in the post-stimulation period. Scale bar = 50 μm. Bottom: Mean Δf/f across mLH and lLH ROIs over time. (c–e) Comparison of mean, summed and maximum Δf/f metrics for a 90 s window before and after ReaChR stimulation (gray bars in bottom panels in a and b). Each data point represents a single stimulation event, like those shown in a and b. Asterisks denote p<0.05. (c) cH activity increases after illumination of Tg(y333:Gal4; UAS:ReaChR-RFP)-positive cH neurons, n = 29 stimulations across eight fish, p = 0.0002 (max Δf/f) / 0.036 (sum Δf/f) / 9.2×10⁻⁵ (mean Δf/f), one-tailed Wilcoxon signed-rank test. (d) lLH activity is inhibited (p = 0.0003 (max Δf/f) / 1.8×10⁻⁶ (sum Δf/f) / 0.049 (mean Δf/f)), whereas mLH activity appears unchanged after after illumination of Tg(y333:Gal4; UAS:ReaChR-RFP)-positive cH neurons (p = 0.74 (max Δf/f) / 0.85 (sum Δf/f) / 0.13 (mean Δf/f)), n = 108 stimulations across nine fish, two-tailed Wilcoxon signed-rank test. (e) Illumination of a control preoptic region (outside of the area labeled by Tg(y333:Gal4; ReaChR-RFP) expression) resulted in a small increase in mLH activity (p = 0.0003 (max Δf/f) / 0.039 (sum Δf/f) / 0.039 (mean Δf/f)) and no change lLH activity (p = 0.099 (max Δf/f) / 0.65 (sum Δf/f) / 0.096 (mean Δf/f)), n = 37 stimulations across five fish, two-tailed Wilcoxon signed-rank test. Data plotted in Figure 5 are provided in Figure 5—source data 1.
-
Figure 5—source data 1
Source data for plots displayed in Figure 5c-e.
- https://cdn.elifesciences.org/articles/43775/elife-43775-fig5-data1-v2.xlsx
Figure 5—figure supplement 1
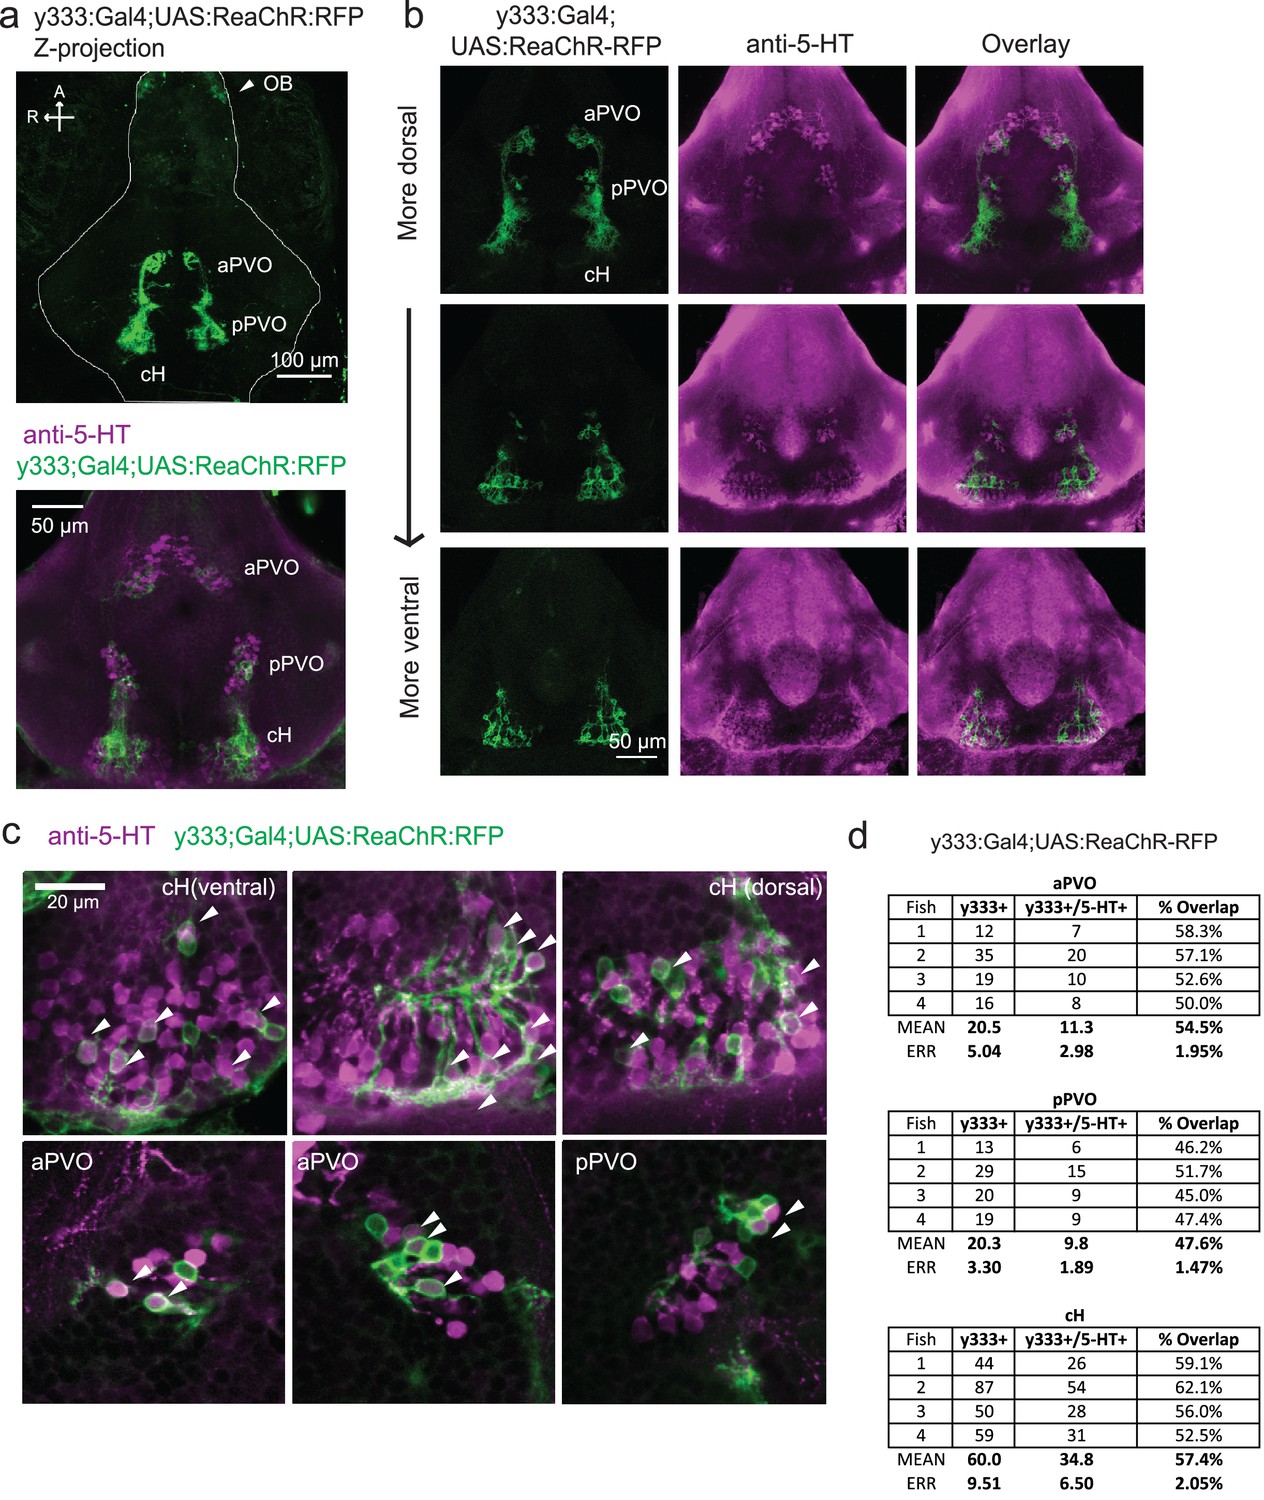
Characterization of the serotonergic identity of the y333:Gal4 line.
(a) We used an alternative cH-labeling Gal4 line, Tg(y333:Gal4) (Marquart et al., 2015) to drive Tg(UAS:ReaChR-RFP) expression, as we were unable to detect any Tg(116A:Gal4)-driven ReaChR expression on the basis of its Red Fluorescent Protein tag. Top: Whole mount confocal z-stack of a Tg(y333:Gal4;UAS:ReaChR-RFP) (green) shows relatively specific expression in the caudal hypothalamus, as well as some labeling in the olfactory bulb (white arrow) and other scattered cells. Scale bar = 100 μm. A = anterior, R = right. Bottom: Z-projection image of an isolated anti-5-HT (magenta) stained brain mounted ventral side up. Scale bar = 50 μm. (b) Overlap of Tg(y333:Gal4;UAS:ReaChR-RFP) (green) with anti-5-HT immunostaining (magenta) visible in all layers of the caudal hypothalamus. There is also a lower amount of overlapping expression in the paraventricular organ (PVO). Each row displays a different z-plane, from dorsal (top) to ventral. Brains are mounted ventral side up. Scale bar = 50 μm. (c) Higher magnification view showing moderate overlap of Tg(y333:Gal4;UAS:ReaChR-RFP) with anti-5-HT staining in the cH and PVO. Arrows indicate cells with overlapping RFP and 5-HT expression. Scale bar = 20 μm. (d) Quantification of overlap between 5-HT and Tg(y333:Gal4;UAS:ReaChR-RFP) expression in the cH and PVO.
Figure 5—figure supplement 2
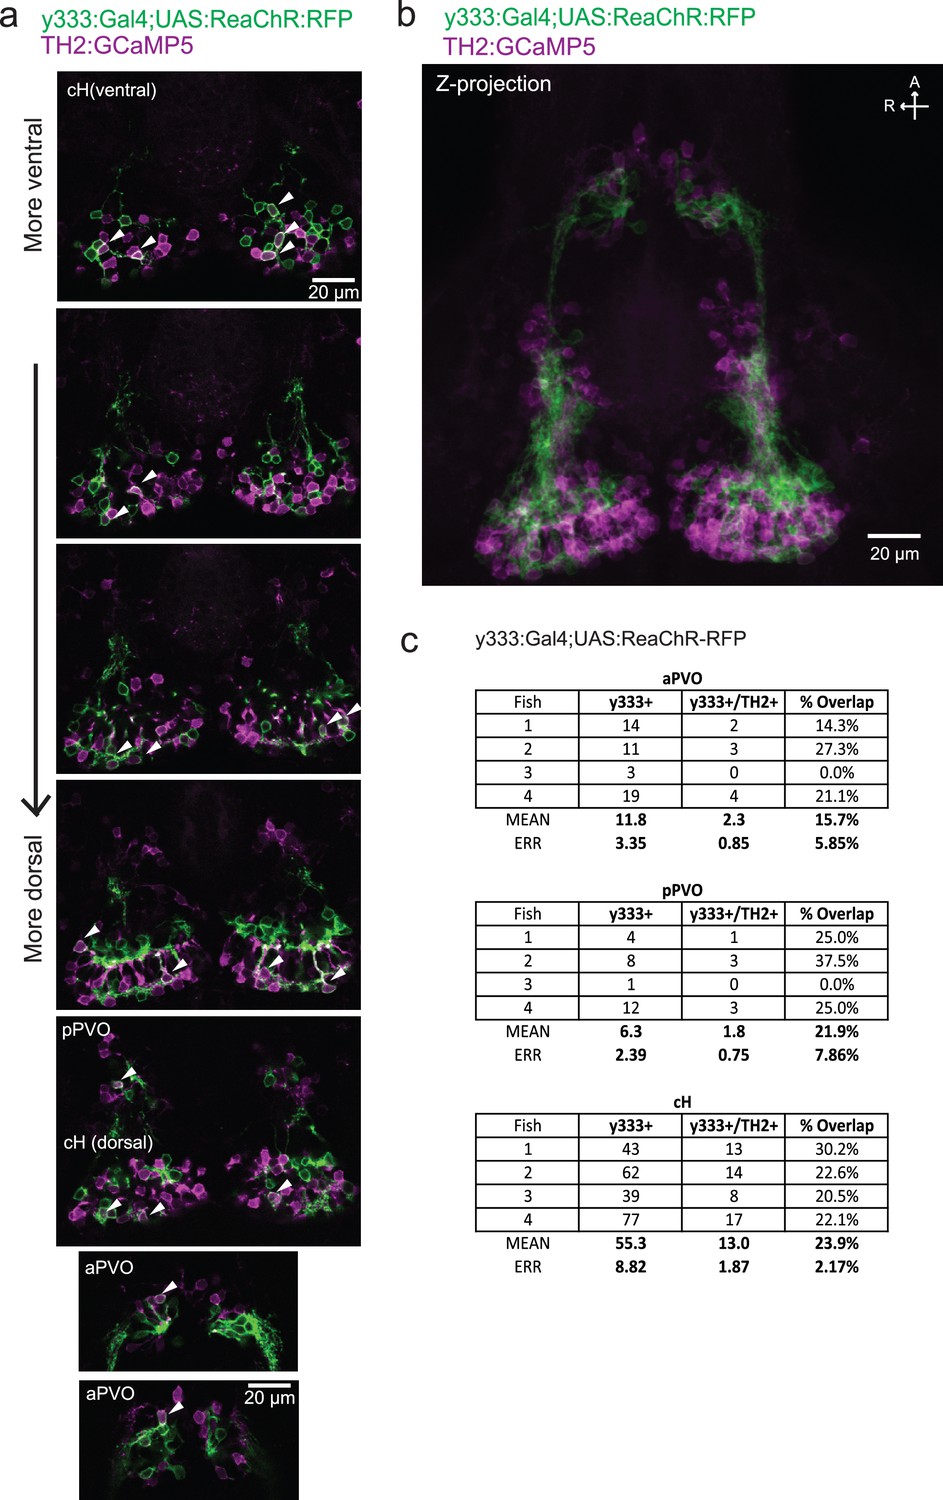
Characterization of the dopaminergic identity of the y333:Gal4 line.
The Tg(y333:Gal4; UAS:ReaChR-RFP) line (green) was crossed to Tg(TH2:GCaMP5) (magenta) to quantify the overlap of Tg(y333:Gal4) with dopaminergic (TH2-positive) cells. (a) High magnification image showing moderate overlap of Tg(y333:Gal4;UAS:ReaChR-RFP) (green) with TH2-expressing cells (magenta) in the cH and PVO. Arrows indicate cells with overlapping RFP and TH2 expression. Scale bar = 20 μm. A = anterior, R = right. (b) Z-projection image of the same brain shown in (a), with Tg(TH2:GCaMP5) expression shown in magenta. Scale bar = 20 μm. (c) Quantification of overlap between Tg(TH2:GCaMP5) and Tg(y333:Gal4;UAS:ReaChR-RFP) expression in the cH and PVO.
Figure 6 with 2 supplements
Role of the cH in behavioral control.
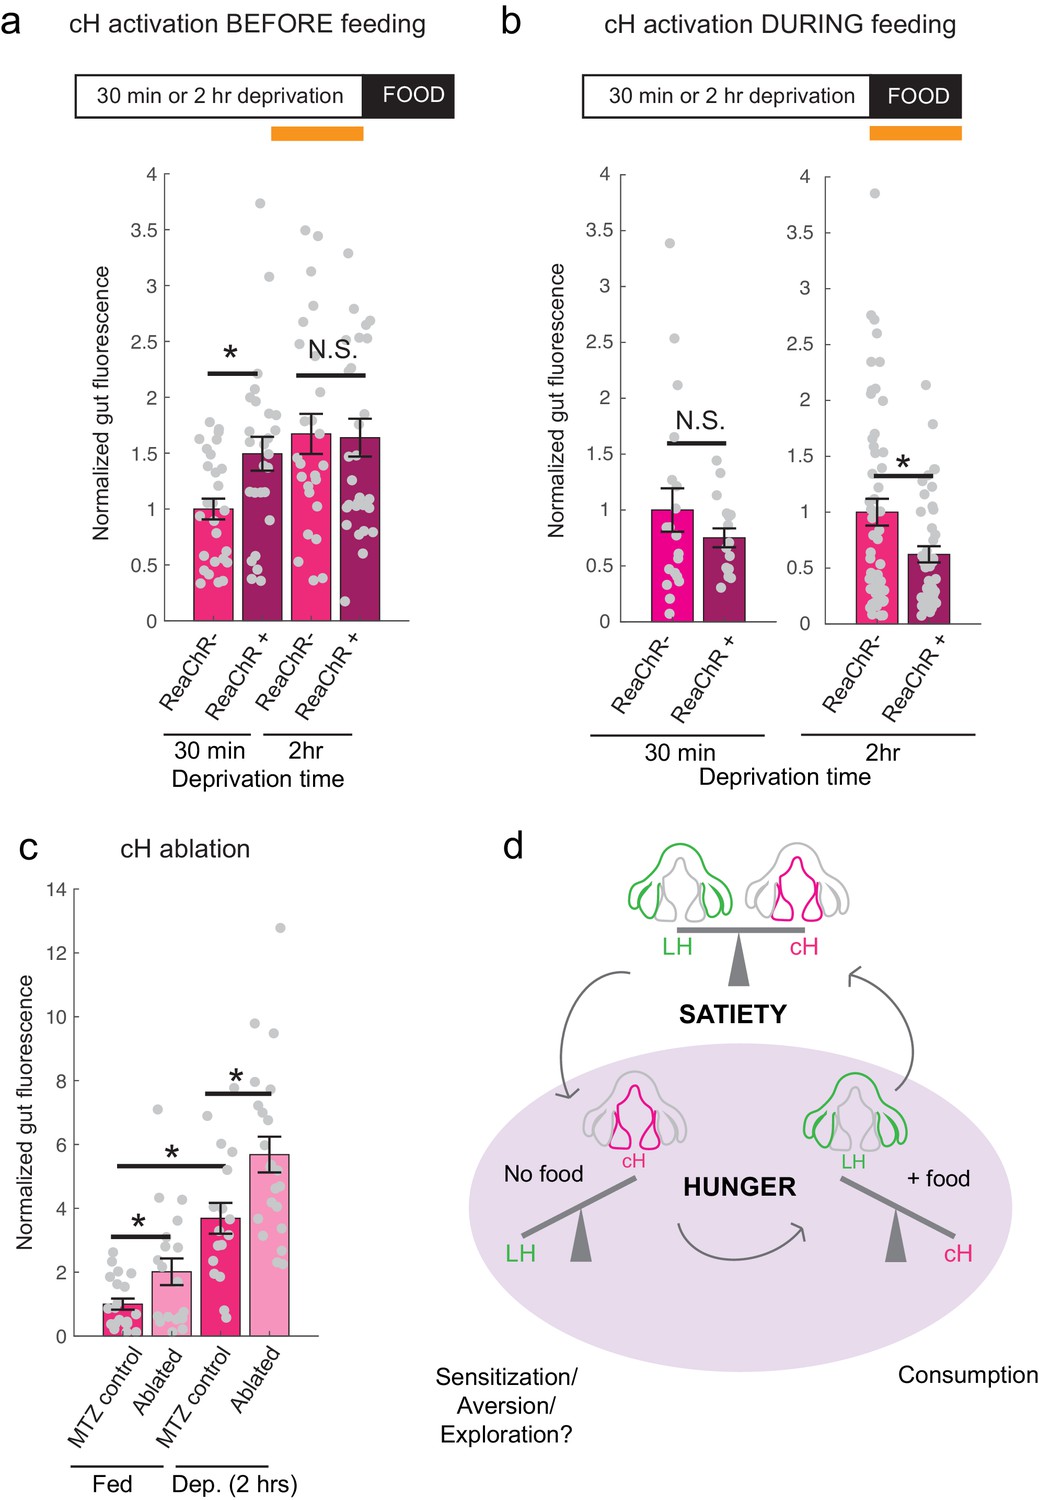
(a) Animals expressing the ReaChR transgene Tg(UAS:ReaChR-RFP) under control of the Tg(y333:Gal4) driver were exposed to 630 nm illumination (orange bar in schematic) for 10 min prior to feeding and assessed for subsequent ingestion of fluorescently labeled paramecia. Tg(y333:Gal4; UAS:ReaChR-RFP) stimulation increased food intake in 30 min food-deprived but not 2 hr food-deprived fish, during subsequent food presentation. Dep. (30 min): n = 27/26 (ReaChR-/ReaChR+), p = 0.005. Dep. (2 hr): n = 25/29 (ReaChR-/ReaChR+), p = 0.36, one-tailed Wilcoxon rank-sum test. Asterisks denote p<0.05. Since ReaChR expression via Tg(116A:Gal4) was negligible, we used another Gal4 (Tg(y333:Gal4)) line that is also specific to the cH when ReaChR is expressed. Fed and food-deprived fish were assayed simultaneously, thus all results were normalized to fed controls. ReaChR- controls do not have visible Tg(y333:Gal4;UAS:ReaChR-RFP) expression, and thus are a mixture of siblings expressing Tg(y333:Gal4) only, Tg(UAS:ReaChR-RFP) or neither of these transgenes, each with ⅓ probability. (b) Left: Optogenetic activation of Tg(y333:Gal4; UAS:ReaChR-RFP) fish (orange bar in schematic) during feeding in fish that were food-deprived for 30 min does not significantly reduce food intake: n = 19/16 (ReaChR-/ReaChR+), p = 0.44 (N.S.); Right: Optogenetic activation of Tg(y333:Gal4; UAS:ReaChR-RFP) fish during feeding in 2 hr food-deprived fish reduces food intake: n = 53/44 (ReaChR-/ReaChR+), p = 0.042. Since 30 min and 2 hr food-deprived fish were assayed in different experiments, gut fluorescence normalized to their respective controls, one-tailed Wilcoxon rank-sum test. (c) Nitroreductase-mediated ablation of the cH in Tg(116A:Gal4;UAS:nfsb-mCherry)-positive or negative fish treated with metronidazole (MTZ) from 5 to 7 dpf significantly enhances food intake in 8 dpf fish. p = 0.0042/0.041/1.4 × 10−5 (fed control vs fed ablated, 2 hr dep. control vs 2 hr dep. ablated, fed vs 2 hr dep.), n = 29 (fed control)/28 (fed ablated)/22 (dep. control)/29 (dep. ablated), two-tailed Wilcoxon rank-sum test. Controls do not have visible Tg(116A:Gal4;UAS:nfsb-mCherry) expression, and thus are a mixture of siblings expressing Tg(116A:Gal4) only, Tg(UAS:nfsb-mCherry) or neither of these transgenes, each with ⅓ probability. (d) Schematic summarizing our results. We propose distinct roles of the cH during hunger, depending on the presence or absence of food. See Appendix 1 – Conceptual Circuit Model for elaboration. Data plotted in Figure 6 are provided in Figure 6—source data 1.
-
Figure 6—source data 1
Source data for plots displayed in Figure 6a-c.
- https://cdn.elifesciences.org/articles/43775/elife-43775-fig6-data1-v2.xlsx
Figure 6—figure supplement 1
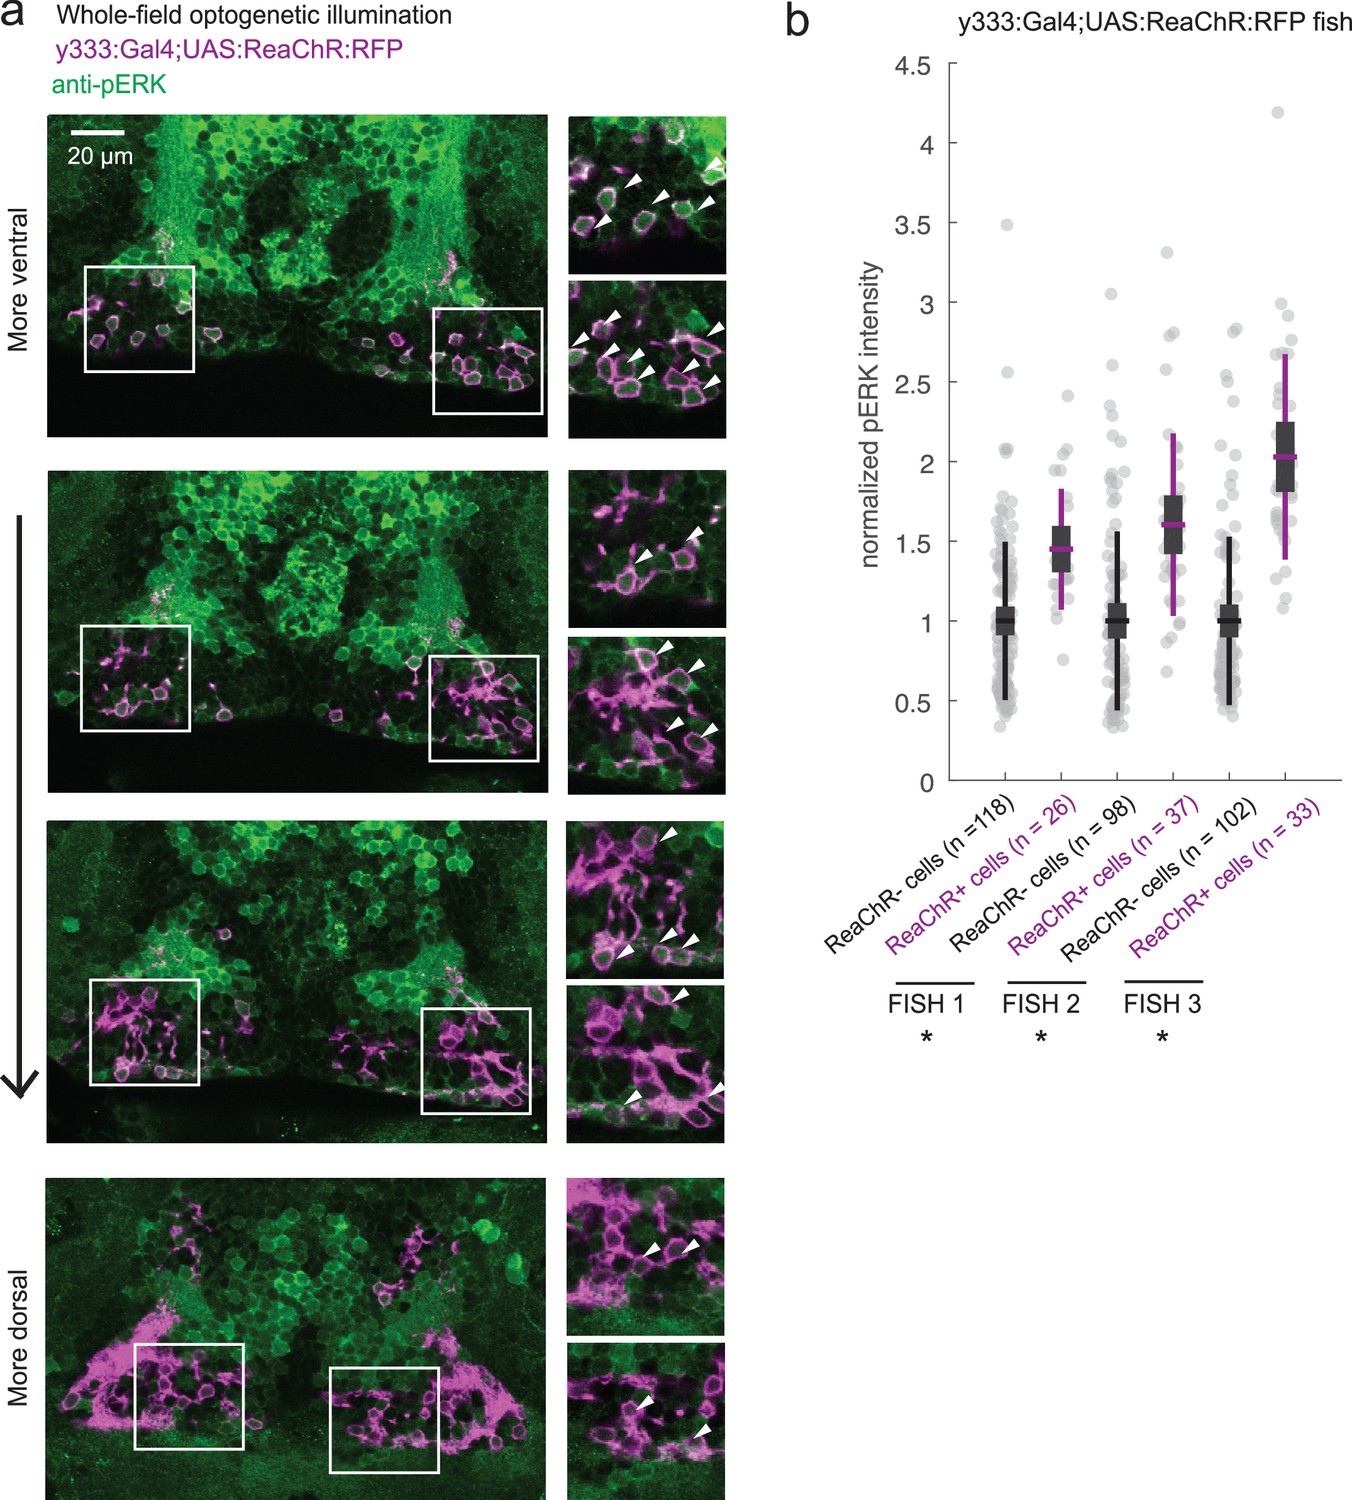
ReaChR activation by whole-field optogenetic illumination.
(a) Tg(y333:Gal4;UAS:ReaChR-RFP) (magenta) optogenetic stimulation during feeding is sufficient to induce pERK activity (green) in many transgene-positive neurons. Fish were food-deprived for 2 hr and then fed in the presence of whole-field 630 nm LED illumination (as in Figure 6). White arrows indicate examples of cells with higher pERK activity. Scale bar = 20 μm. Insets (white boxes) are shown at higher magnification on the right. Width of insets = 40 μm. (b) The pERK intensities of ReaChR-positive and -negative cells (normalized to the mean pERK intensity of ReaChR-negative cells for each fish) are plotted for three individual fish. To sample ReaChR-negative cells, all visible cells lacking red channel expression were selected in every 3rd to 5th z-plane (to minimize oversampling). Fish one corresponds to the fish in (a). Box plot indicates mean value (horizontal line), 1 SD (gray box) and 95% confidence intervals (vertical line). Individual cells are plotted as circles. In Tg(y333:Gal4;UAS:ReaChR-RFP) transgene-positive fish, ReaChR positive cells have significantly higher pERK fluorescence intensity, demonstrating the effectiveness of optogenetic activation (p = 2.7×10⁻⁶/2.7 × 10−8/6.5 × 10−13 for each fish respectively, one-tailed Wilcoxon rank-sum test).
Figure 6—figure supplement 2
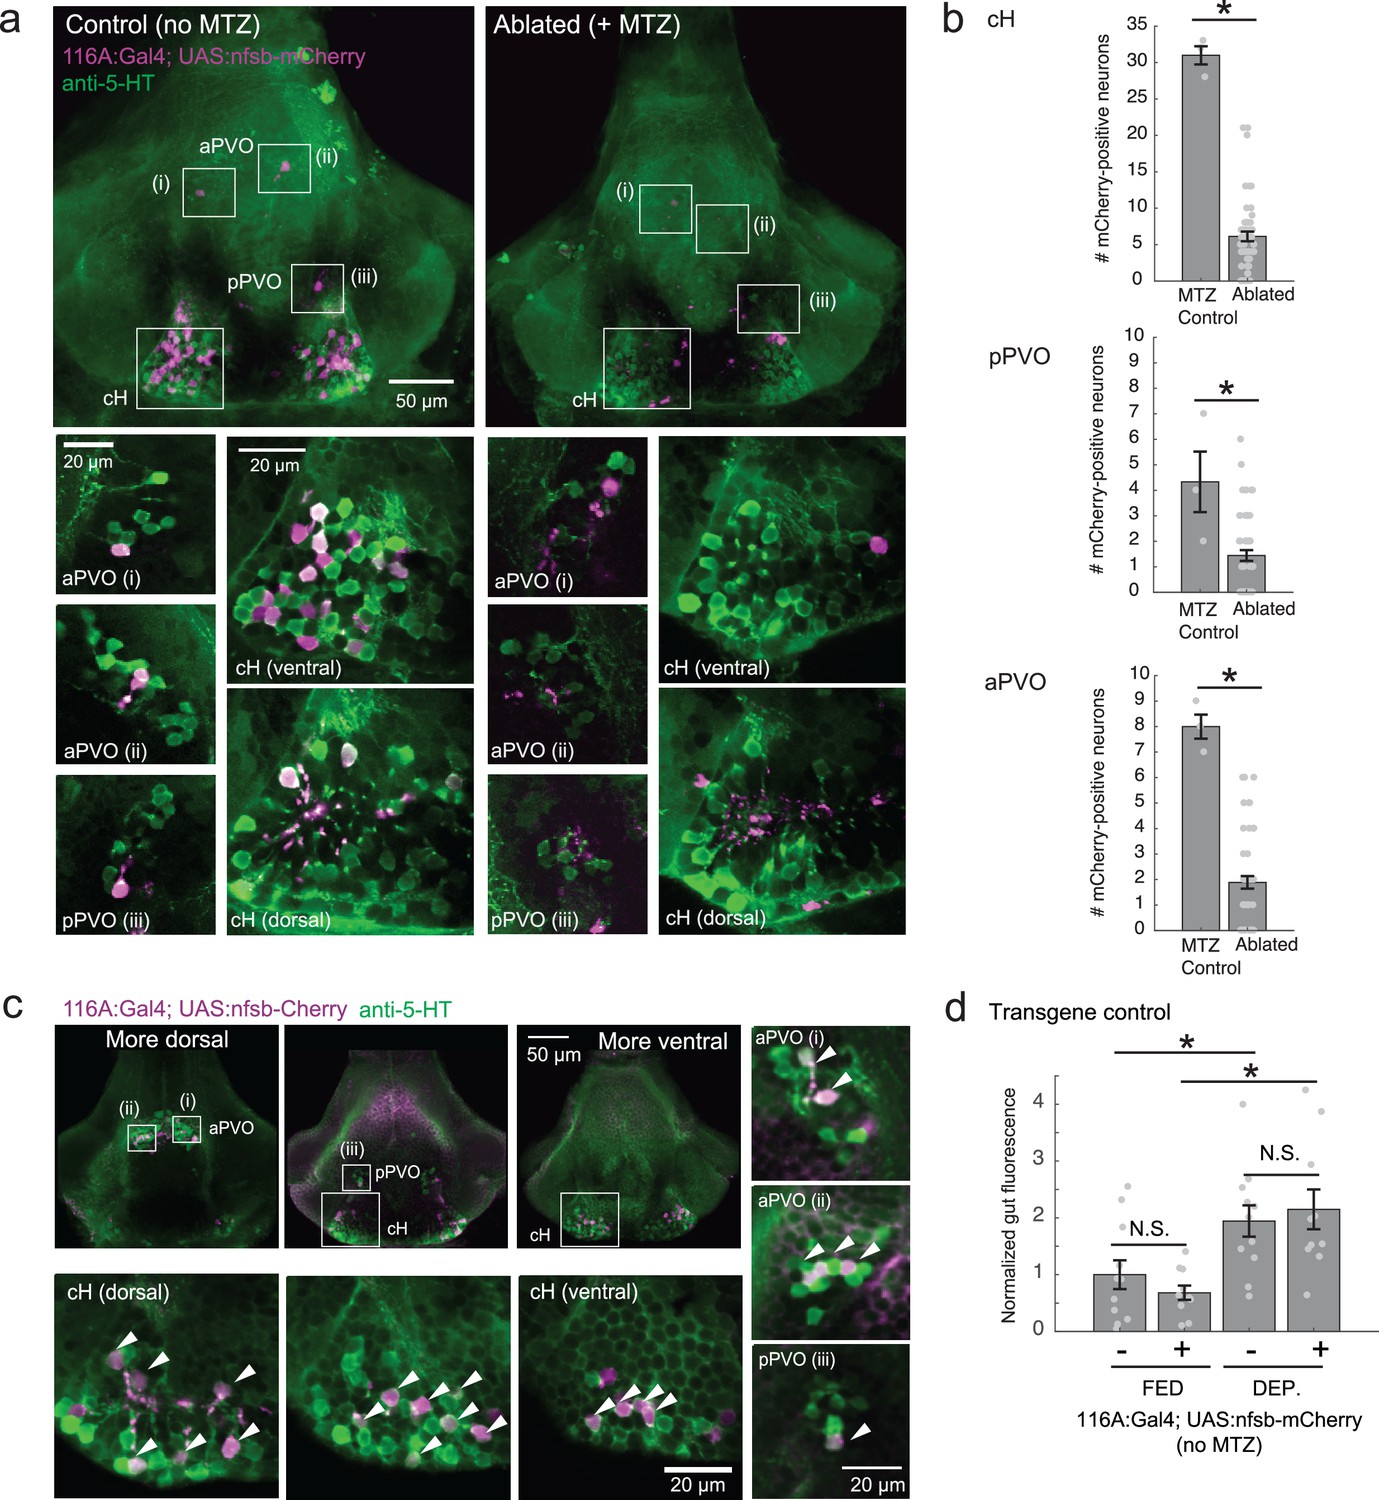
Nitroreductase-mediated ablation of cH serotonergic neurons.
(a) Ablation of Tg(116A:Gal4;UAS:nfsb-mCherry)-labeled neurons. Note that due to sparse expression of the transgenes, ablation of the cH/PVO populations is likely to be partial (<50%). Representative projection images are shown of non-ablated animals (left) and animals following exposure to the chemical MTZ (right, see Materials and methods). Scale bar = 50 μm. Insets (white boxes) show the locations of higher-magnification single-plane images of transgene-labeled cH, aPVO and pPVO areas and neuronal overlap with 5-HT expression (anti-5-HT antibody staining, green color). Scale bar = 20 μm. (b) Quantification of ablation efficiency. When Tg(116A:Gal4;UAS:nfsb-mCherry) fish were incubated with MTZ, we observed 6.1 ± 0.66 (mean ± SEM) mCherry-positive cells (n = 54 fish). When MTZ was omitted, 31 ± 1.5 cells were mCherry-positive (n = 3 fish). The reduction resulting from ablation was thus ~80% (p = 0.0019, one-tailed Wilcoxon rank-sum test). pPVO (4.3 ± 1.5 control vs 1.4 ± 0.2 ablated, p = 0.0162) and aPVO (8.0 ± 0.6 control vs 1.9 ± 0.3 ablated, p = 0.0015) cells were also affected. Some of the remaining mCherry-positive cells were dimly fluorescent and misshapen/deformed, indicating damage that might impair function. (c) Similar to Tg(116A:Gal4;UAS:GFP) (Figure 3—figure supplement 1), there is strong overlap of Tg(116A:Gal4;UAS:nfsb-mCherry) with anti-5-HT immunostaining (green color). Scale bar = 50 μm. Insets (white boxes) show higher-magnification single-plane images of cH, aPVO and pPVO labeling by this transgene and overlap with 5-HT expression. Scale bar = 20 μm. (d) The Tg(116A:Gal4;UAS:nfsb-mCherry) transgene does not affect feeding in the absence of MTZ, relative to siblings lacking transgene expression. Fed: p = 0.64, n = 11(negative)/10(positive); Dep.: p = 0.91, n = 11(negative)/10(positive), Fed vs Dep.: p = 0.035(negative)/7.7 × 10−4(positive), two-tailed Wilcoxon rank-sum test.
Appendix 1—figure 1
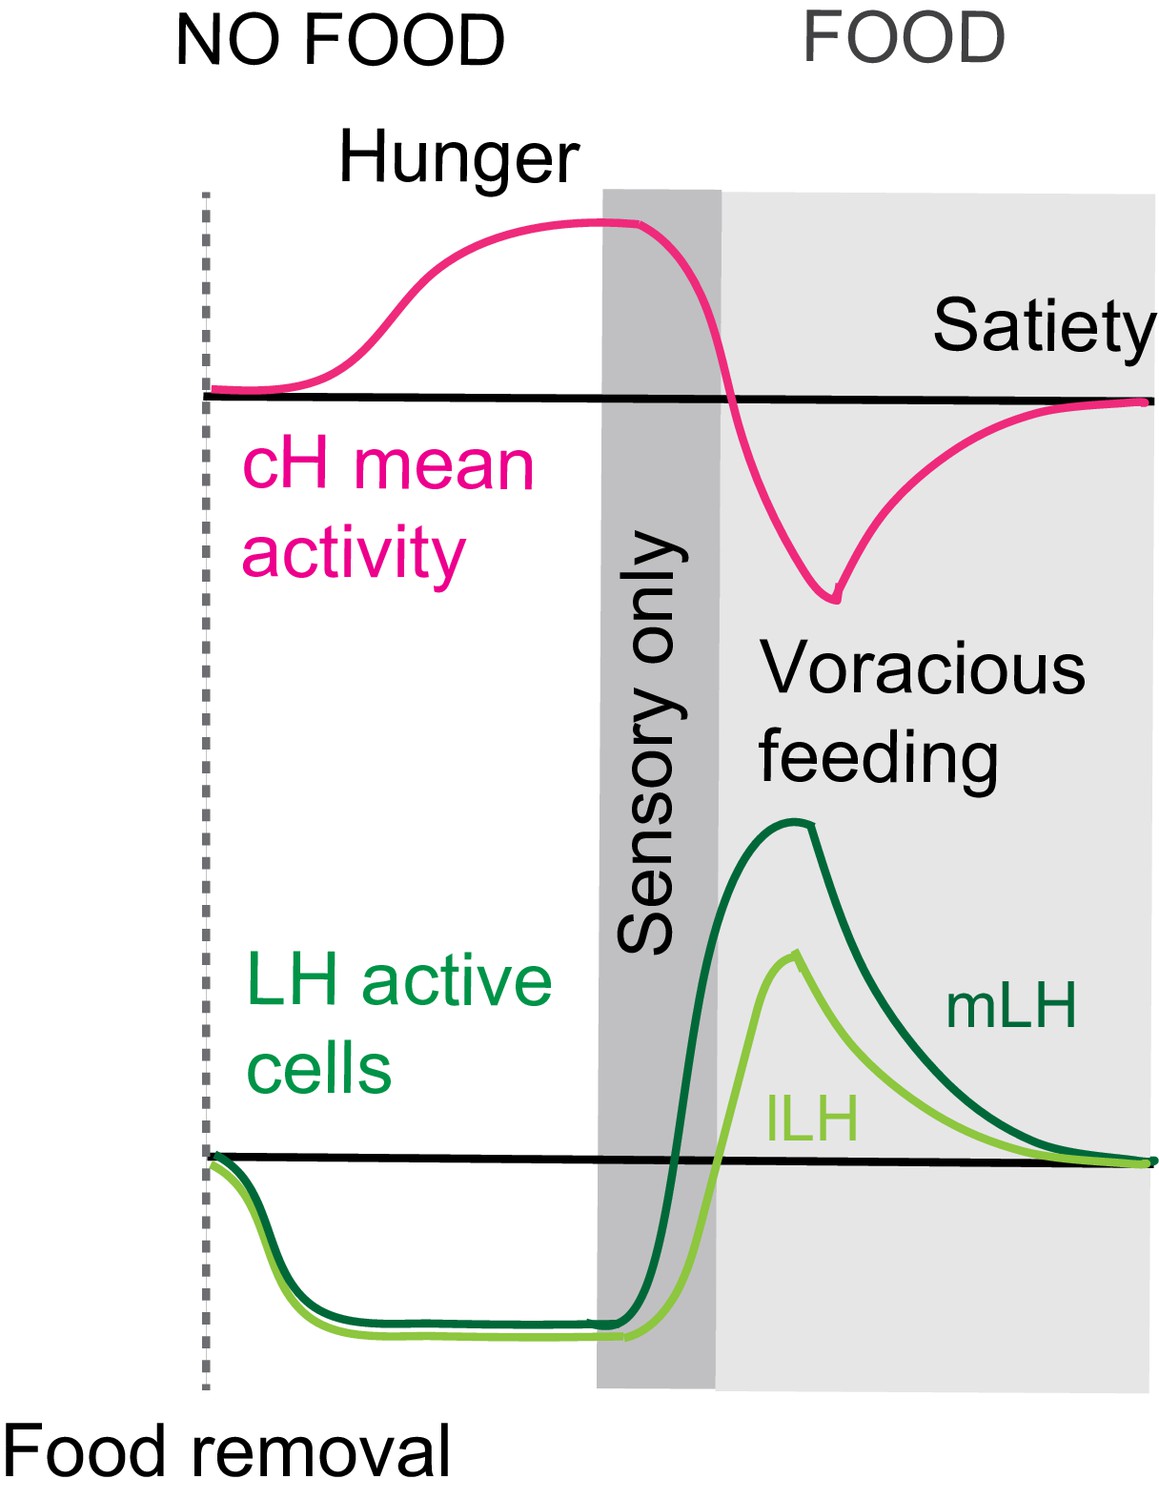
Summary of cH and LH activity over Hunger and Satiety.
This diagram is the same as in Figure 4d. Differential neural activation of the cH and LH regions in response to prey sensation and hunting as compared to prey ingestion.
Appendix 1—figure 2
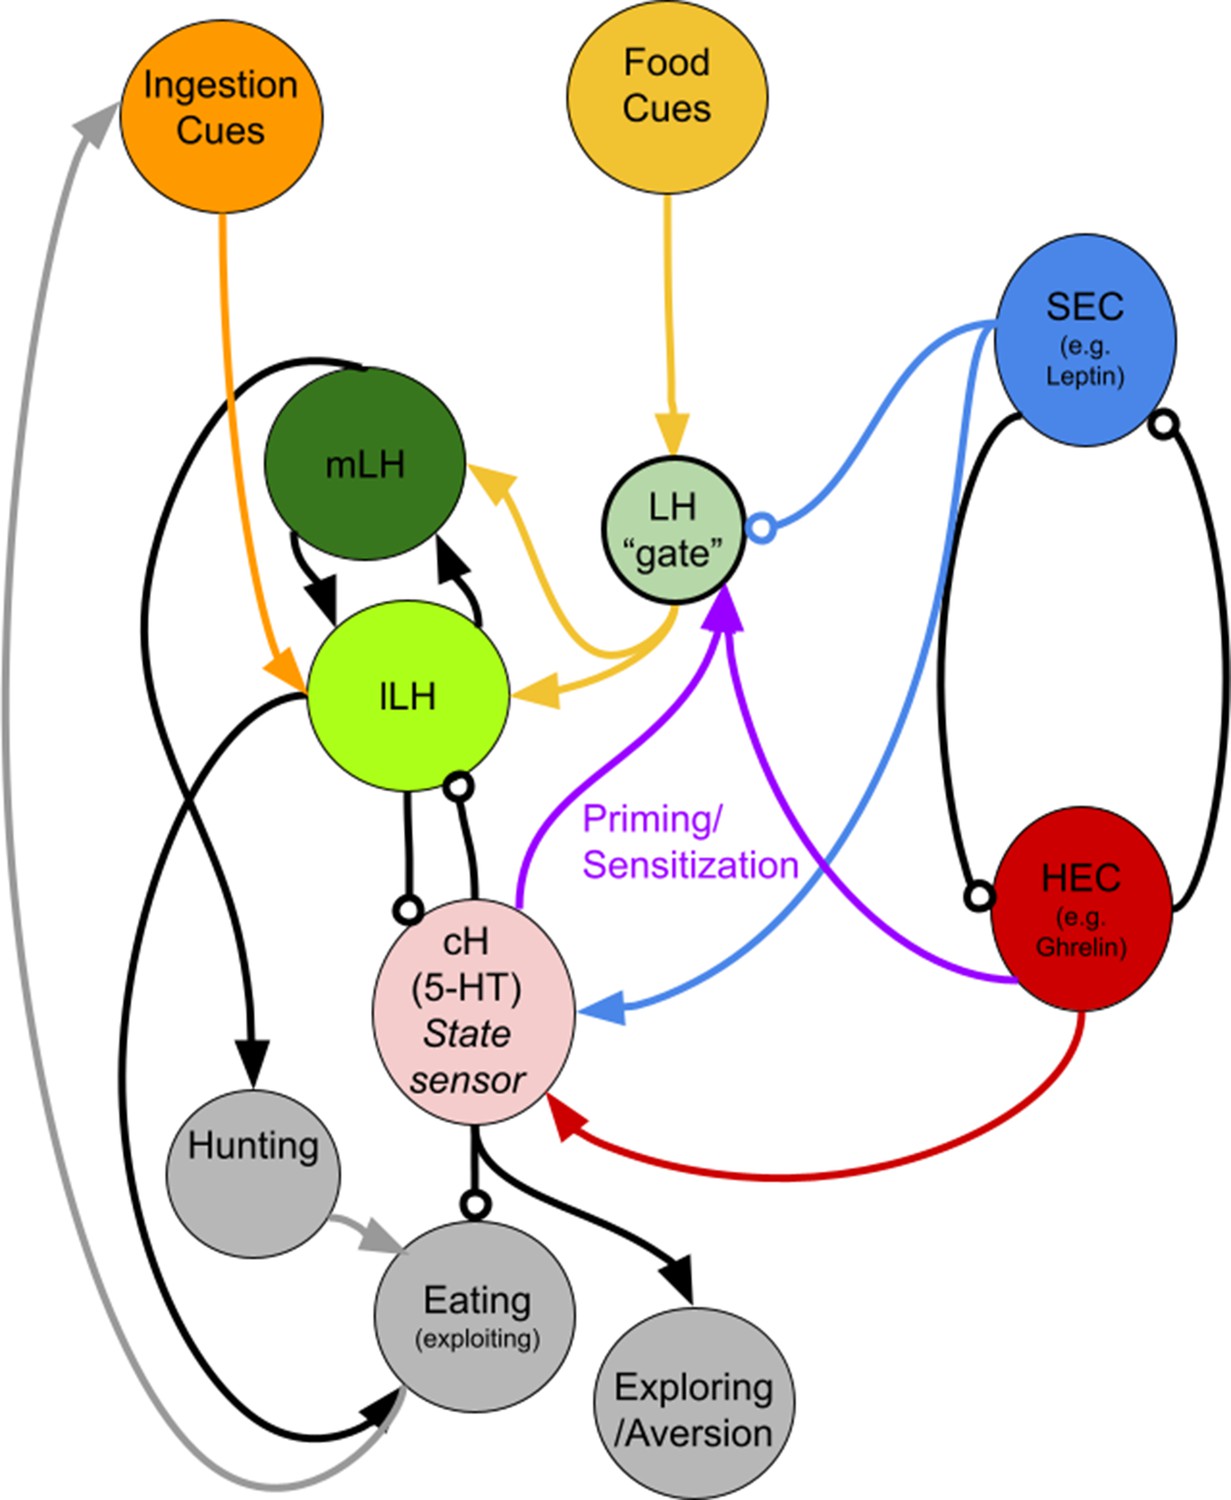
A putative circuit diagram HEC = Hunger Encoding Circuit, SEC = Satiety Encoding Circuit, which should have anti-correlated activities and report the animal's energy/caloric status.
The cH represents both hunger and satiety state and primes the LH during hunger. It may drive other behaviors such as exploration or aversive behavior, but also suppresses feeding. Other HEC components may also be involved in LH priming/sensitization. We propose mutual inhibition between the cH and LH, though we have only demonstrated unidirectional inhibition (cH on lLH) thus far. The mLH, normally responsive to food cues, may promote hunting, though not necessarily coupled with ingestion, whereas the lLH, which is more responsive to ingestive cues, should enhance further ingestion (i.e. eating). The LH ‘gate’ is a conceptual representation of how its sensitivity to food cues could be modulated by other signals (i.e. reduced by the SEC and enhanced by cH-mediated priming). It does not necessarily represent a physical neuronal population.
Appendix 1—figure 3
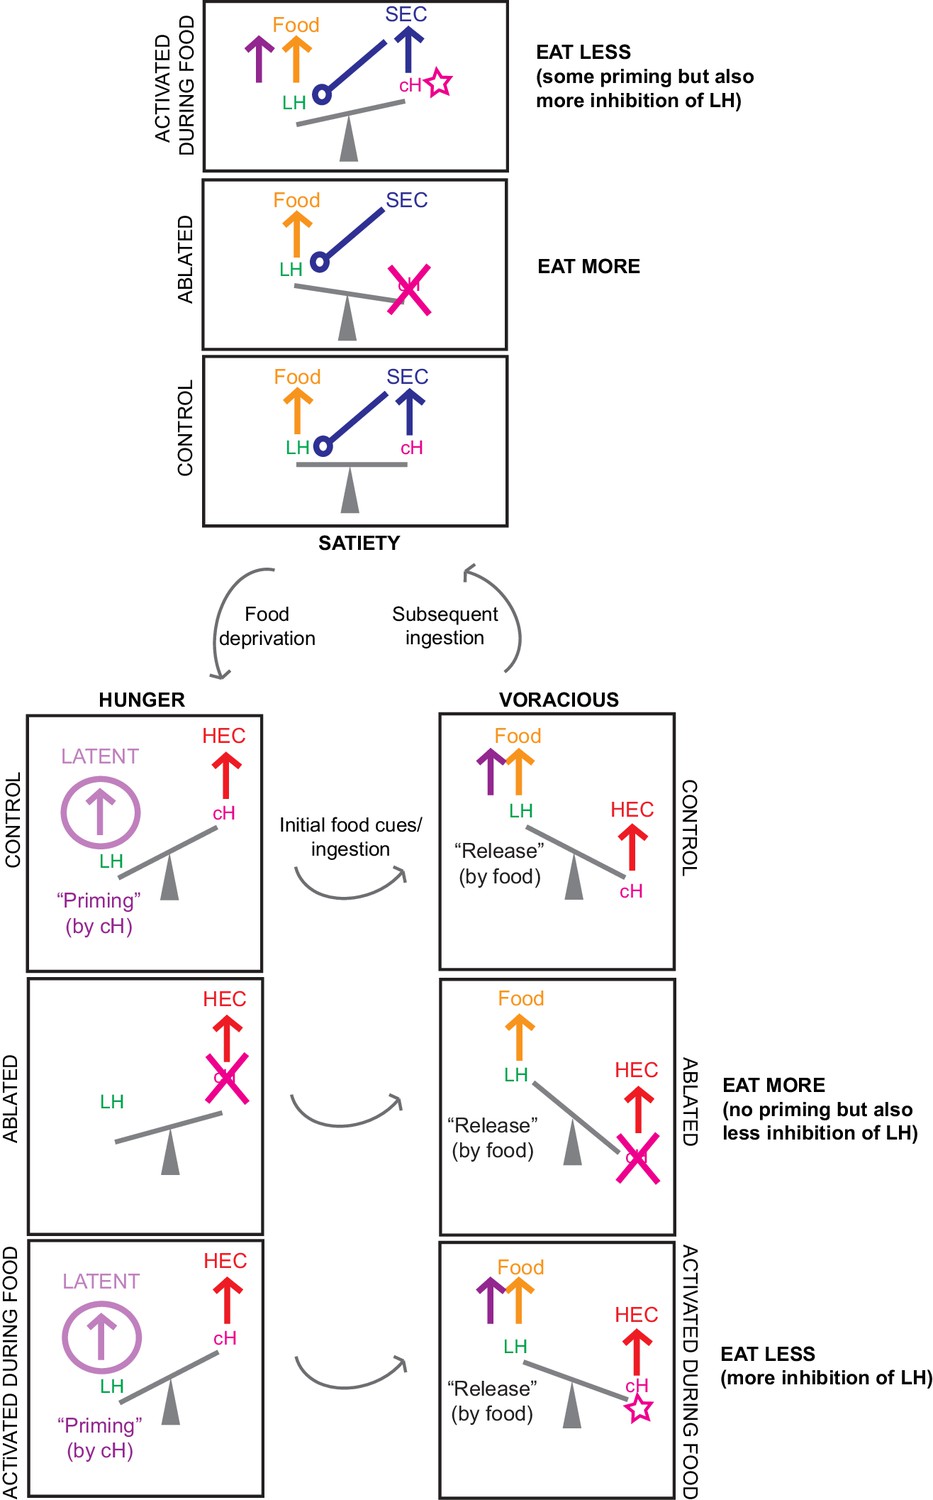
Another schematic summarizing our circuit model, including predictions for cH ablation and activation results.
Here, the proposed mutual inhibition between cH and LH activity is represented by a ‘see-saw’, and relevant inputs/outputs during each phase are represented by ‘forces’. We represent our predictions for what happens when the cH is ablated, as well as when it is activated in the presence of food, for both satiated and hungry fish. We assume that the effects of priming are weaker than the effects of acute mutual inhibition. Color codes are consistent with Figure 2. Note that activation of the cH prior to feeding is not depicted in this diagram: in this scenario we predict that this would cause priming of the LH that increases subsequent feeding, the effect of which may be more obvious in satiated fish where cH activity starts off lower (consistent with our optogenetics results).
Videos
Video 1
Z-stack (dorsal to ventral) of brain activity map shown in Figure 1b.
Video 2
Z-stack (ventral to dorsal) of anti-5-HT (green) and anti-pERK (magenta) staining in food-deprived fish. Scale bar = 20 μm.
Video 3
Z-stack (ventral to dorsal) of TH2:GCaMP5 transgene expression (green) and anti-pERK (magenta) staining in the same food-deprived fish as in Video 2. Scale bar = 20 μm.
Video 4
Video of larval zebrafish hunting artemia larvae.
Prey-capture behavior, such as J-turns and pursuits, but no capture swims, were observed in response to artemia larvae. Recording rate: 30 fps. Playback rate: Real time.
Tables
Key resources table
| Reagent type (species) or resource | Designation | Source or reference | Identifiers | Additional information |
|---|---|---|---|---|
| Genetic reagent (Danio rerio) | Tg(pGal4FF:116A) | Characterized in this manuscript | Dr. Koichi Kawakami (NIG, Japan) | |
| Genetic reagent (Danio rerio) | Tg(pGal4FF:76A) | PMID: 28425439 | Dr. Koichi Kawakami (NIG, Japan) | |
| Genetic reagent (Danio rerio) | Tg(y333:Gal4) | PMID: 26635538 | Dr. Harold Burgess (NIH) | |
| Genetic reagent (Danio rerio) | Tg(HuC:GCaMP6s) | PMID: 28892088 | Dr. Florian Engert (Harvard) | |
| Genetic reagent (Danio rerio) | Tg(UAS:GCaMP6s) | PMID: 28425439 | Dr. Koichi Kawakami (NIG, Japan) | |
| Genetic reagent (Danio rerio) | Tg(UAS:ReaChR-RFP) | Characterized in this manuscript | Dr. Misha Ahrens (Janelia Research Campus) | |
| Genetic reagent (Danio rerio) | Tg(UAS-E1b:NTR-mCherry) | PMID: 17335798 | Available from ZIRC | |
| Genetic reagent (Danio rerio) | Tg(Vglut2a:dsRed) | PMID: 19369545 | ||
| Genetic reagent (Danio rerio) | Tg(Gad1b:loxP-dsRed-loxP-GFP) | PMID: 23946442 | ||
| Genetic reagent (Danio rerio) | Tg(Gad1b:GFP) | PMID: 23946442 | ||
| Genetic reagent (Danio rerio) | Tg(TH2:GCaMP5) | PMID: 26774784 | Dr. Adam Douglass (University of Utah) | |
| Genetic reagent (Danio rerio) | Tg(ETvmat2:GFP) | PMID:18164283 | ||
| Genetic reagent (Danio rerio) | Tg(HCRT:RFP) | PMID: 25725064 | ||
| Antibody | rabbit monoclonal anti-pERK | Cell Signaling | 4370 RRID:AB_2315112 | IHC (1:500) |
| Antibody | mouse monoclonal anti-ERK | Cell Signaling | 4696 RRID:AB_390780 | IHC (1:500) |
| Antibody | rabbit polyclonal anti-5-HT | Sigma-Aldrich | S5545 RRID:AB_477522 | IHC (1:500) |
| Antibody | goat polyclonal anti-5-HT | AbCam | ab66047 RRID:AB_1142794 | IHC (1:500), 2% BSA in PBS, 0.3% Triton blocking solution) |
| Antibody | goat polyclonal anti-MSH | EMD Millipore | AB5087 RRID:AB_91683 | IHC (1:500), 2% BSA in PBS, 0.3% Triton blocking solution) |
| Antibody | rabbit polyclonal anti-AGRP | Phoenix Pharmaceuticals | H-003–53 RRID:AB_2313908 | IHC (1:500) |
| Antibody | rabbit polyclonal anti-MCH | Phoenix Pharmaceuticals | H-070–47 RRID:AB_10013632 | IHC (1:500) |
| Antibody | rabbit polyclonal anti-CART | Phoenix Pharmaceuticals | 55–102 RRID:AB_2313614 | IHC (1:500) |
| Antibody | rabbit polyclonal anti-NPY | Immunostar | 22940 RRID:AB_2307354 | IHC (1:500) |
| Antibody | mouse monoclonal anti-TH | Immunostar | 22941 RRID:AB_1624244 | IHC (1:500) |
| Chemical compound, drug | DiD’ solid (lipid dye) | Thermo Fisher Scientific | D-7757 | Stock solution (10 mg/ml), working solution (2.5 mg/ml), in ethanol |
Additional files
-
Supplementary file 1
Z-brain anatomical regions that are more activated in voraciously feeding (food-deprived + food) fish as compared to fed fish.
- https://cdn.elifesciences.org/articles/43775/elife-43775-supp1-v2.csv
-
Supplementary file 2
Z-brain anatomical regions that are more activated in fed fish as compared to voraciously feeding (food-deprived + food) fish.
- https://cdn.elifesciences.org/articles/43775/elife-43775-supp2-v2.csv
-
Transparent reporting form
- https://cdn.elifesciences.org/articles/43775/elife-43775-transrepform-v2.docx
Download links
A two-part list of links to download the article, or parts of the article, in various formats.
Downloads (link to download the article as PDF)
Open citations (links to open the citations from this article in various online reference manager services)
Cite this article (links to download the citations from this article in formats compatible with various reference manager tools)
A bidirectional network for appetite control in larval zebrafish
eLife 8:e43775.
https://doi.org/10.7554/eLife.43775


