HDAC3 restrains CD8-lineage genes to maintain a bi-potential state in CD4+CD8+ thymocytes for CD4-lineage commitment
- Mayo Clinic, United States
Figures
Figure 1
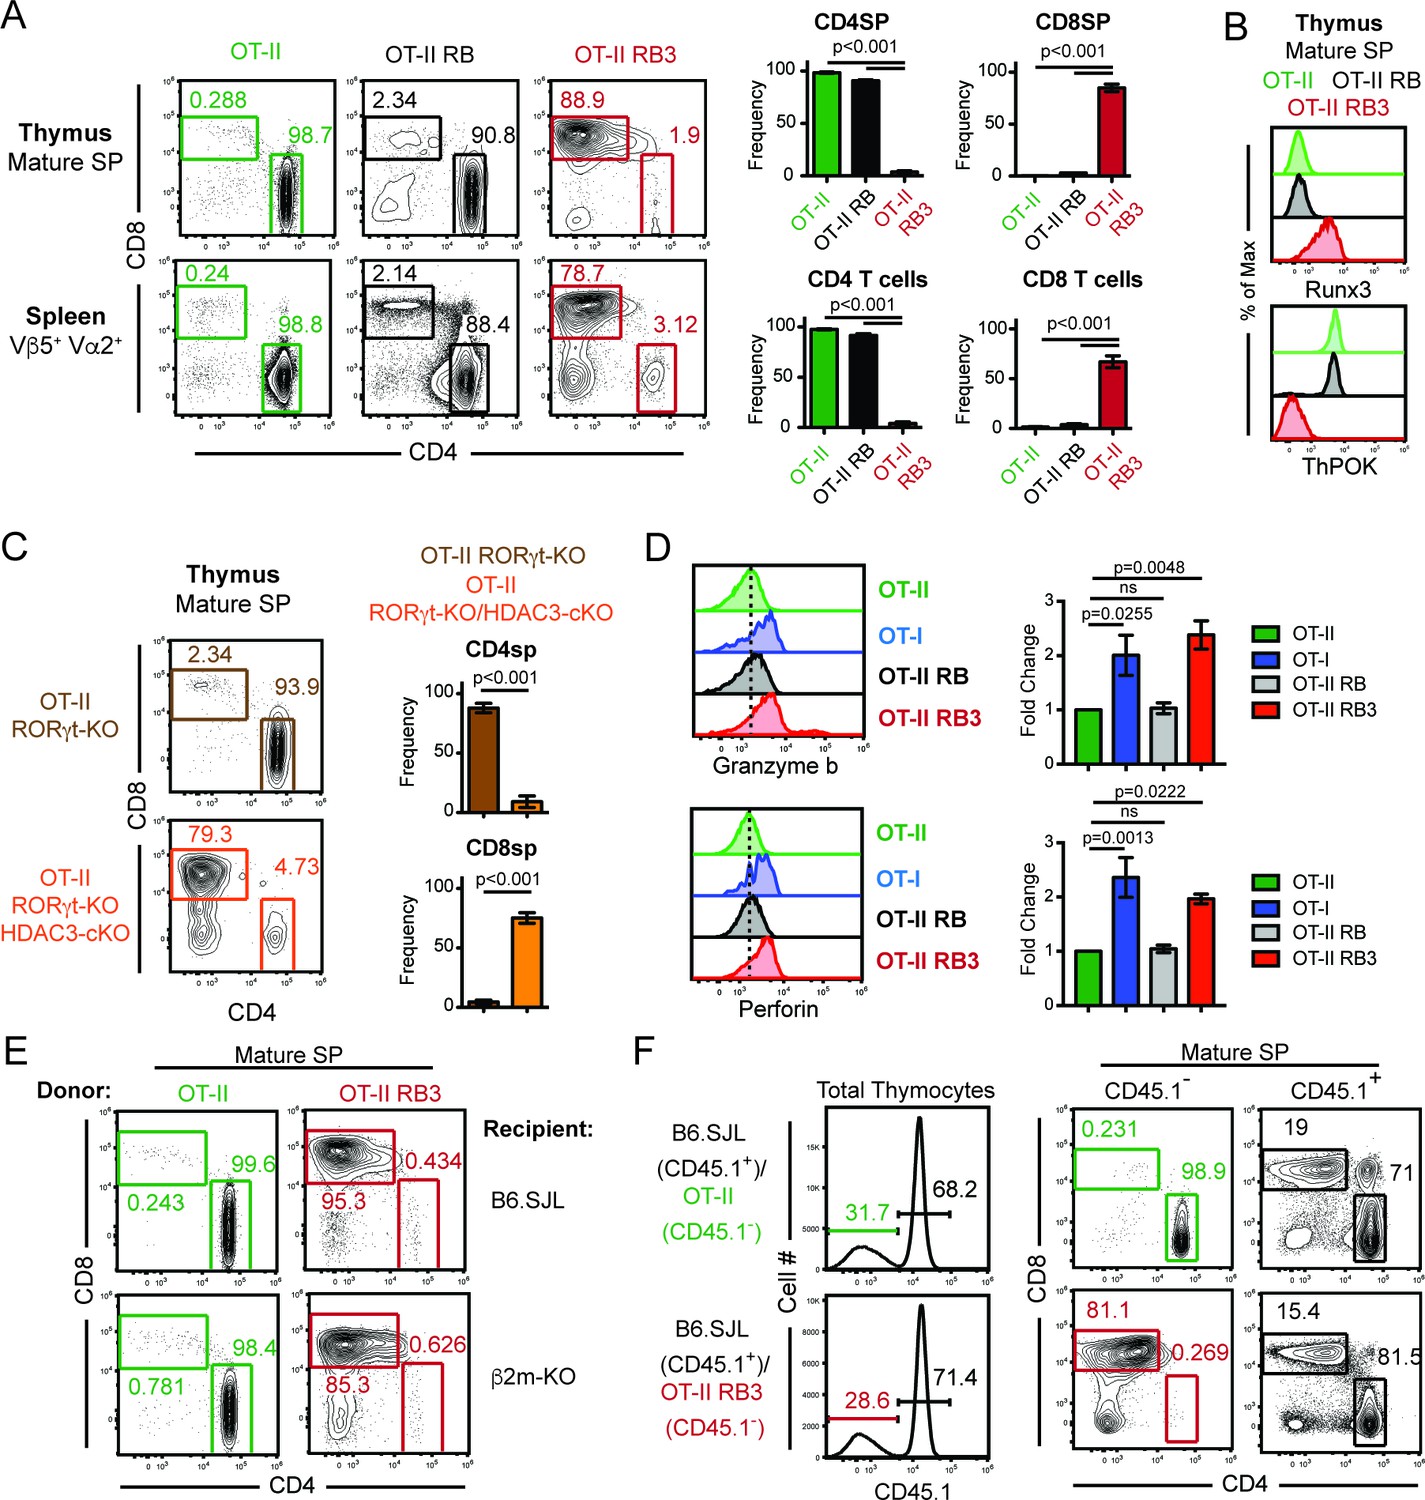
MHC class II restricted thymocytes are redirected to the CD8-lineage when HDAC3 is absent.
(A) CD4/CD8 profile of mature thymic SP (Vβ5+Vα2+H2K+CD24lo) and splenic T cells (Vβ5+Vα2+) from OT-II, OT-II RORγt-KO Bcl-xl tg (RB) and OT-II RB3 mice. Graphs depict frequency of gated cells from at least three independent experiments (n = 3–5/group) (B) Runx3 and ThPOK expression in mature thymic SP cells from OT-II, OT-II RB, and OT-II RB3 mice (n = 4/group from four independent experiments). (C) CD4/CD8 profile of mature thymic SP from OT-II RORγt-KO and OT-II RORγt-KO HDAC3-cKO mice. Graphs depict frequency of gated cells from at least three independent experiments (n = 3–4/group). (D) Granzyme b and perforin expression in SP thymocytes from OT-II, OT-I, OT-II RB and OT-II RB3 mice. FACS plots were gated on CD4SP cells for OT-II and OT-II RB mice and CD8SP cells for OT-I and OT-II RB3 mice. Bar graphs depict mean ± SEM (n = 3/group from three independent experiments) of the fold change in MFI between unstimulated and TCR/CD2 stimulated conditions. (E) Representative FACS plots of the proportion of CD4SP and CD8SP mature thymocytes from straight BMCs, where bone marrow from OT-II or OT-II RB3 mice were transplanted into B6.SJL or β2m-KO recipients. Mature SP thymocytes were gated as Vβ5+Vα2+H2K+CD24lo. Mice (n = 3–5/group from three independent experiments) were analyzed 8–10 weeks after transfer. (F) Representative FACS plots of the proportion of CD4SP and CD8SP mature thymocytes from mixed BMCs from OT-II (CD45.1-)/B6.SJL (CD45.1+) and OT-II RB3 (CD45.1-)/B6.SJL (CD45.1+) mice. Mature SP thymocytes from CD45.1+ cells were gated as H2K+CD24lo; mature SP thymocytes from CD45.1- cells were gated as Vβ5+Vα2+H2K+CD24lo. Mice were analyzed 8–10 weeks after transfer. (n = 5/group from three independent experiments).
Figure 2
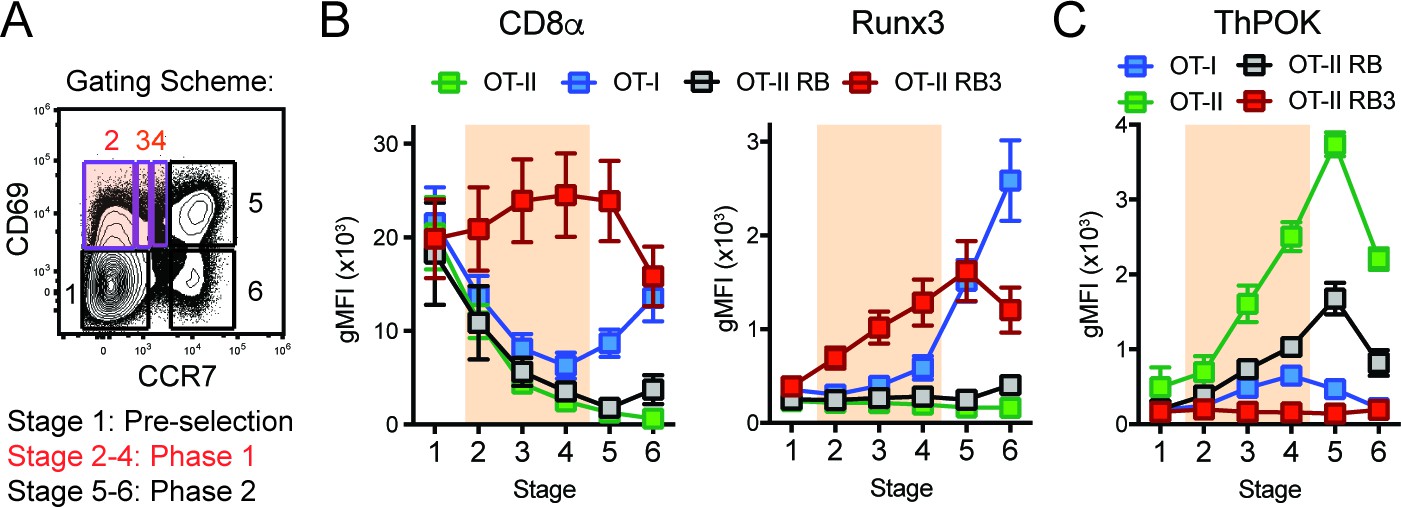
Acceleration of CD8-lineage commitment in HDAC3-deficient thymocytes.
(A) Gating scheme outlining two phases of CD4/CD8-lineage commitment—Phase one includes CD69+ CCR7- cells (Stage 2), CD69+ CCR7lo cells (Stage 3), and CD69+ CCR7int cells (Stage 4); Phase two identifies CD69+ CCR7+ cells (Stage 5) and CD69- CCR7+ cells (Stage 6). Orange shading highlights Phase 1. (B) Expression of Runx3 and CD8α during stages of lineage commitment (Stages 1–6), as outlined in (A) from OT-I, OT-II, OT-II RB and OT-II RB3 mice. CD69-versus-CCR7 plots were gated from DN-removed, CD45.2+ cells. (C) Expression of ThPOK during stages of lineage commitment, gated as in (B). Plots in B and C show mean ±SEM of MFI from 5 to 7 mice per group from five independent experiments.
Figure 3 with 5 supplements
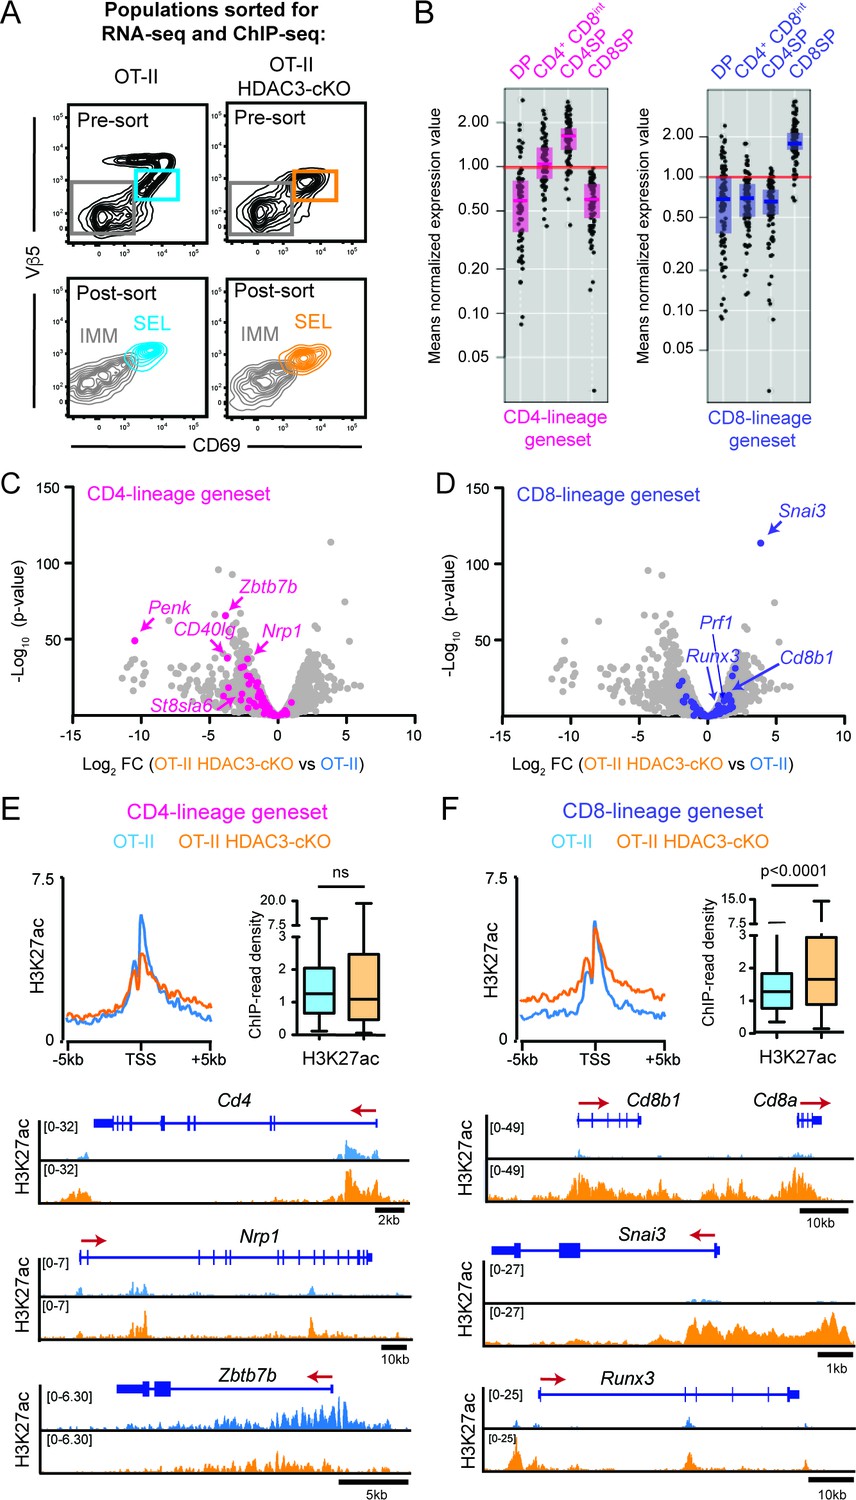
HDAC3-deficient thymocytes fail to induce the CD4-lineage program.
(A) Flow cytometric analysis of populations from OT-II and OT-II HDAC3-cKO mice sorted for RNA-seq and ChIP-seq. Plots show representative pre-sort and post-sort analysis of two FACS sorted populations—Immature thymocytes (Vβ5loCD69- CD4+CD8+) and Selecting thymocytes (Vβ5loCD69+). (B) Expression of CD4-lineage and CD8-lineage gene sets across DP, CD4+CD8lo, CD4SP, and CD8SP ImmGen expression data. (C–D) Volcano plot depicting the Log2fold change (FC) between OT-II HDAC3-cKO and OT-II Selecting (CD69+) cells. Grey dots show all genes; pink dots show CD4-lineage gene set (C); blue dots show CD8-lineage gene set (D). (E–F) Average H3K27ac ChIP-seq signal at the transcription start site (TSS) between OT-II and OT-II HDAC3-cKO Selecting (CD69+) cells for CD4-lineage gene sets (E) and CD8-lineage gene sets (F). Box-and-whisker plots depict H3K27ac signal at the TSS at CD4- or CD8-lineage genes between OT-II and OT-II HDAC3-cKO mice. Snapshots of example ChIP-seq tracks for each gene set are below. See also Figure 3—figure supplements 1–5 and Figure 3—source datas 1–2.
-
Figure 3—source data 1
Gene expression values (RNA-seq) of Immature and Selecting populations from OT-II and OT-II HDAC3-cKO mice.
Numerical data corresponding to the graphs of Figure 3C–D.
- https://doi.org/10.7554/eLife.43821.010
-
Figure 3—source data 2
Gene lists: CD4-lineage, CD8-lineage, silenced genes, housekeeping genes.
CD4-lineage and CD8-lineage gene lists corresponding to graphs of Figure 3B–F. Silenced genes and housekeeping gene lists corresponding to graphs of Figure 3—figure supplement 5.
- https://doi.org/10.7554/eLife.43821.011
Figure 3—figure supplement 1
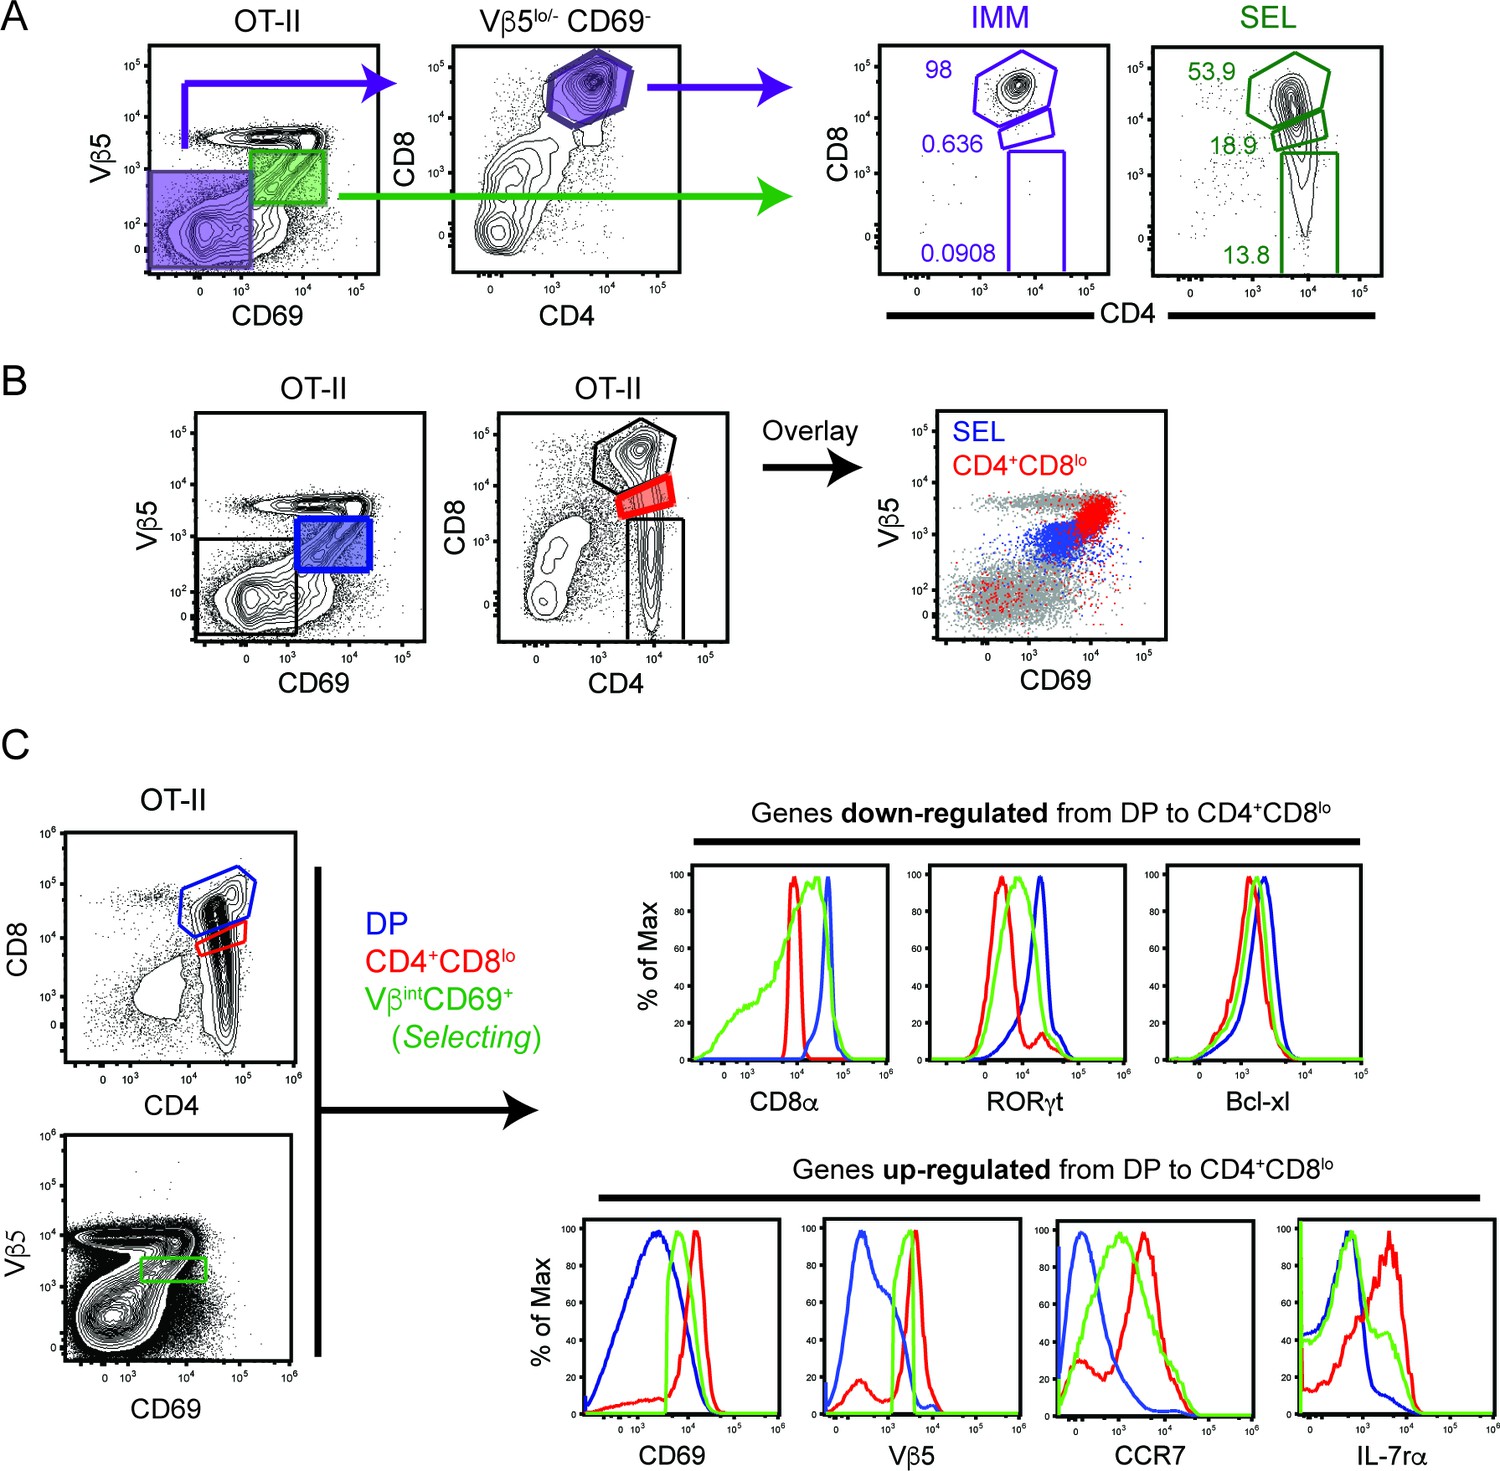
Characterization of Immature and Selecting thymic populations.
(A) CD4-versus-CD8 profile of Immature (purple) and Selecting (green) populations in OT-II mice. Immature thymocytes are gated as Vβ5-/loCD69- CD4+CD8+. Selecting thymocytes are gated as Vβ5intCD69+. (B) Overlay of Selecting (blue) and CD4+CD8lo (red) populations on a Vβ5-versus-CD69 profile in OT-II mice. Grey dots on the Vβ5/CD69 plot depict total thymocytes. Data is representative of 3 mice from three independent experiments. (C) Selecting cells show intermediary marker expression between DP and CD4+CD8lo thymocytes. Expression of ‘down-regulated’ genes (CD8α, RORγt, Bcl-xl) and ‘up-regulated’ genes (CD69, TCR, CCR7, IL-7Rα) on DP, CD4+CD8lo, and Selecting cells from OT-II mice. Data is representative of 3 mice from three independent experiments.
Figure 3—figure supplement 2
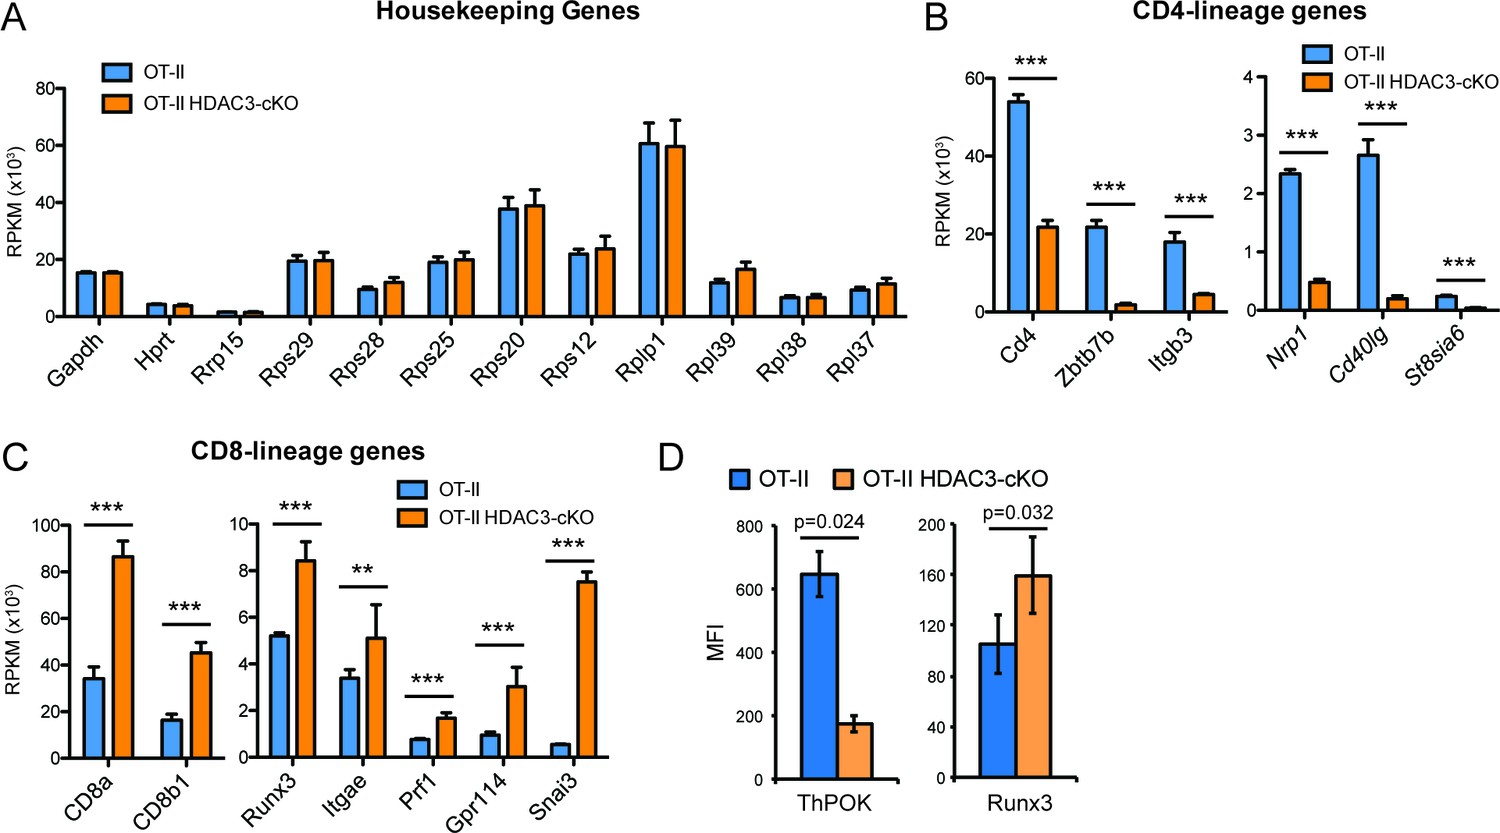
Gene expression of select housekeeping genes, CD4-lineage genes, and CD8-lineage genes.
RPKM values of indicated genes of Selecting cells from OT-II and OT-II HDAC3-cKO mice. (A) Housekeeping genes, (B) CD4-lineage genes, and (C) CD8-lineage genes. Bar graphs depict mean ± SEM of three mice. P values (***, p < 0.001, **, p < 0.01) were calculated using the exactTest with edgeR software. Housekeeping genes did not show a significant difference between mice. (D) Protein expression of ThPOK and Runx3 in Selecting cells from OT-II and OT-II HDAC3-cKO. Bar graphs depict mean ± SEM of 3–6 mice per group from at least three independent experiments. P values were calculated using paired t test.
Figure 3—figure supplement 3
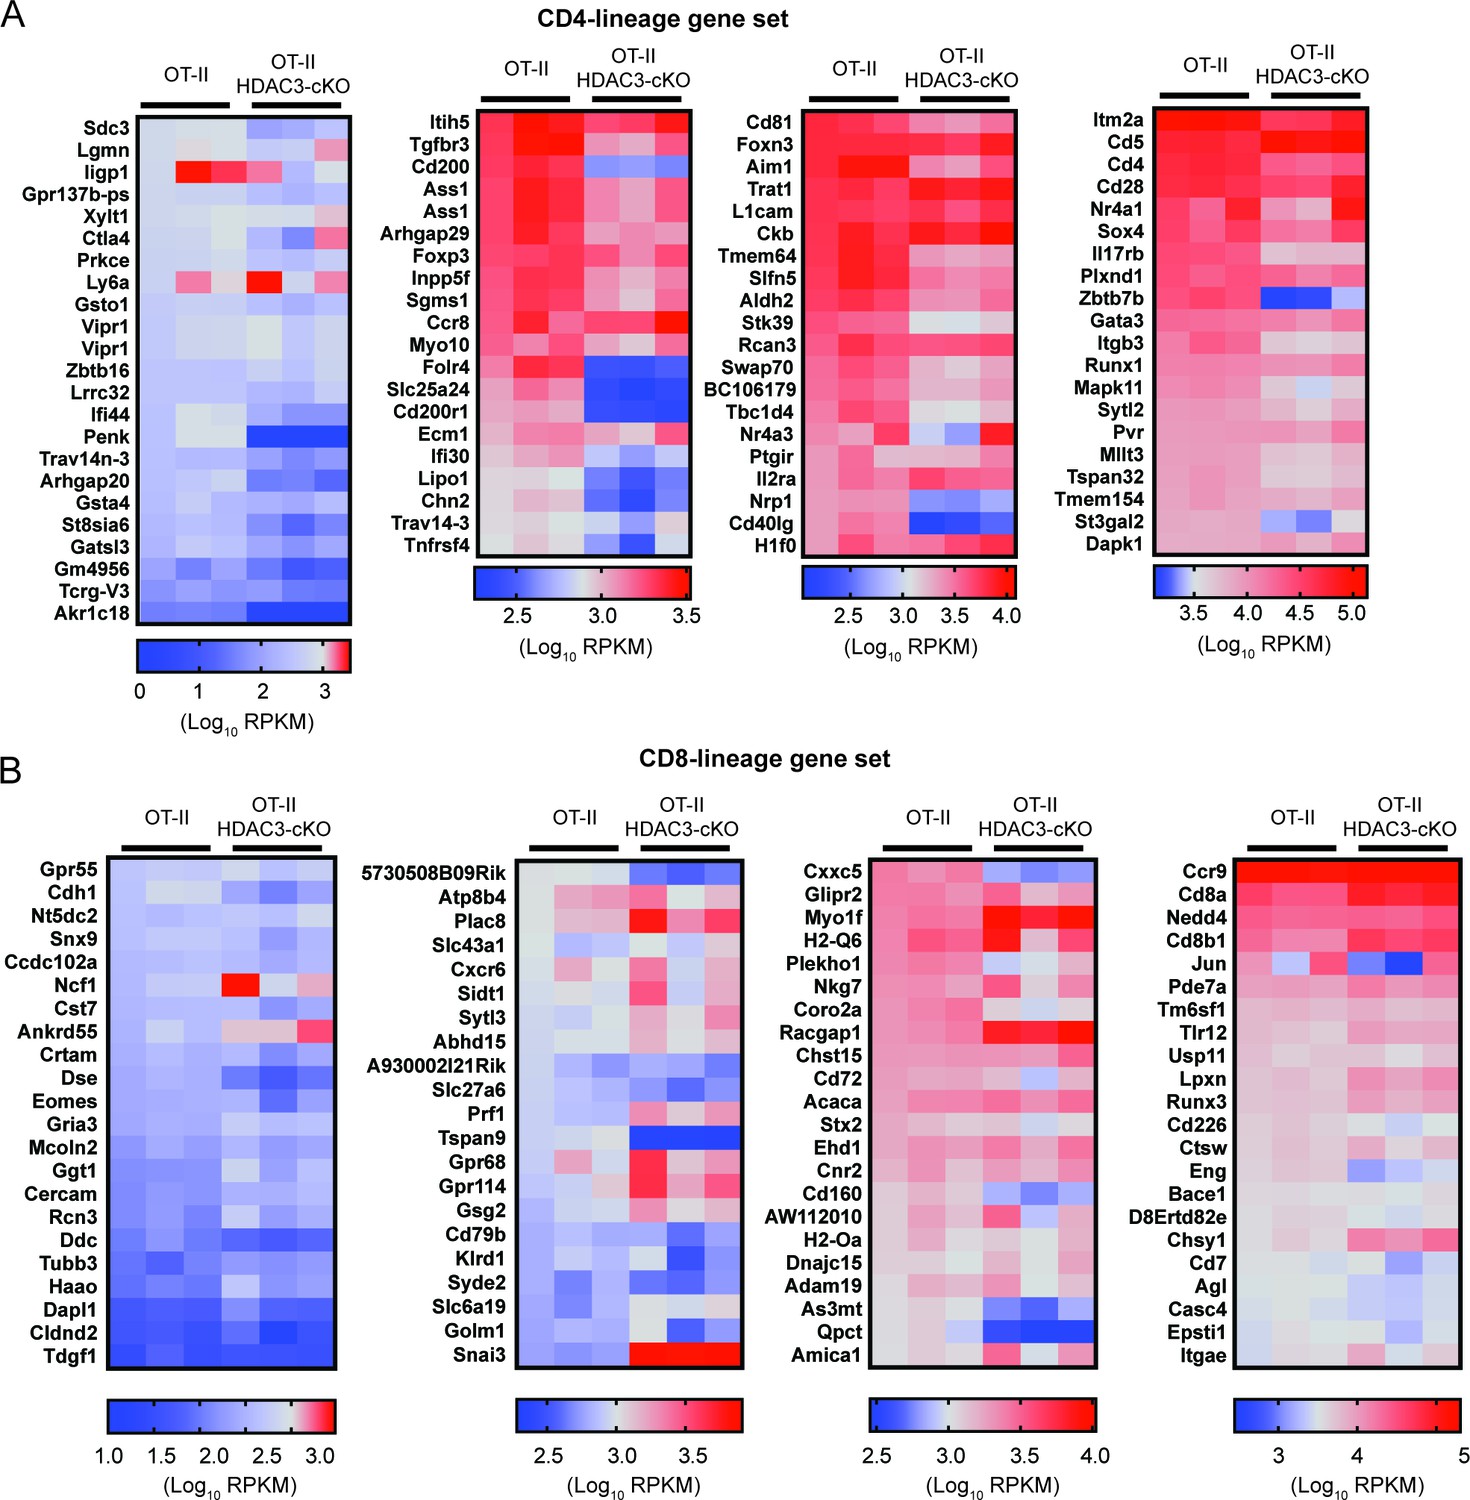
Heatmaps of CD4-lineage and CD8-lineage genes.
Heatmaps depict Log10 RPKM of genes in CD4-lineage (A) and CD8-lineage (B) gene sets in Selecting (CD69+) thymocytes from OT-II and OT-II HDAC3-cKO. Heatmaps show three biological replicates per mouse group. Scale bar is below each heatmap. Refer to Figure 3—source data 1 for Log2fold change between OT-II and OT-II HDAC3-cKO mice.
Figure 3—figure supplement 4
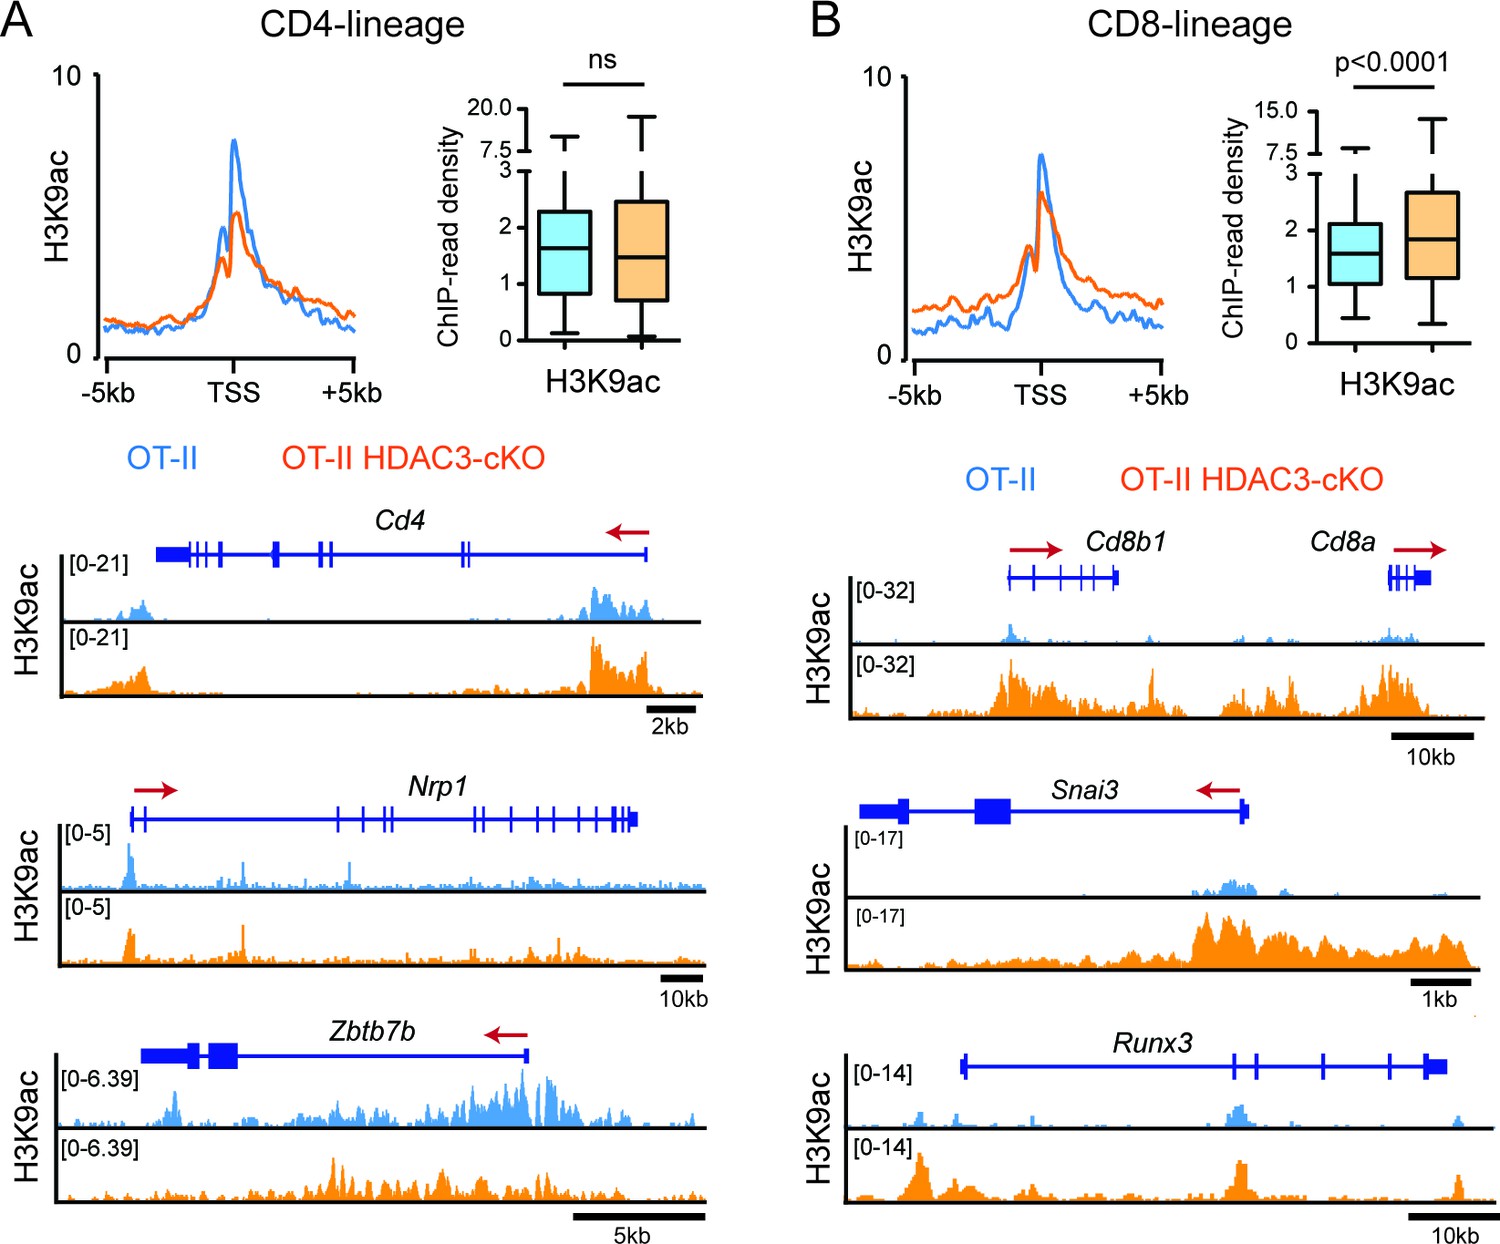
H3K9ac signal at CD4-lineage and CD8-lineage genes.
(A–B) Average H3K9ac ChIP-seq signal at the transcription start site (TSS) between OT-II and OT-II HDAC3-cKO Selecting cells for CD4-lineage gene sets (A) and CD8-lineage gene sets (B). Box-and-whisker plots depict H3K9ac signal at the TSS at each CD4- or CD8-lineage gene between OT-II and OT-II HDAC3-cKO mice. Snapshots of example ChIP-seq tracks for each gene set are below plots depicting the average signal. P values were calculated using Wilcoxon signed rank test.
Figure 3—figure supplement 5
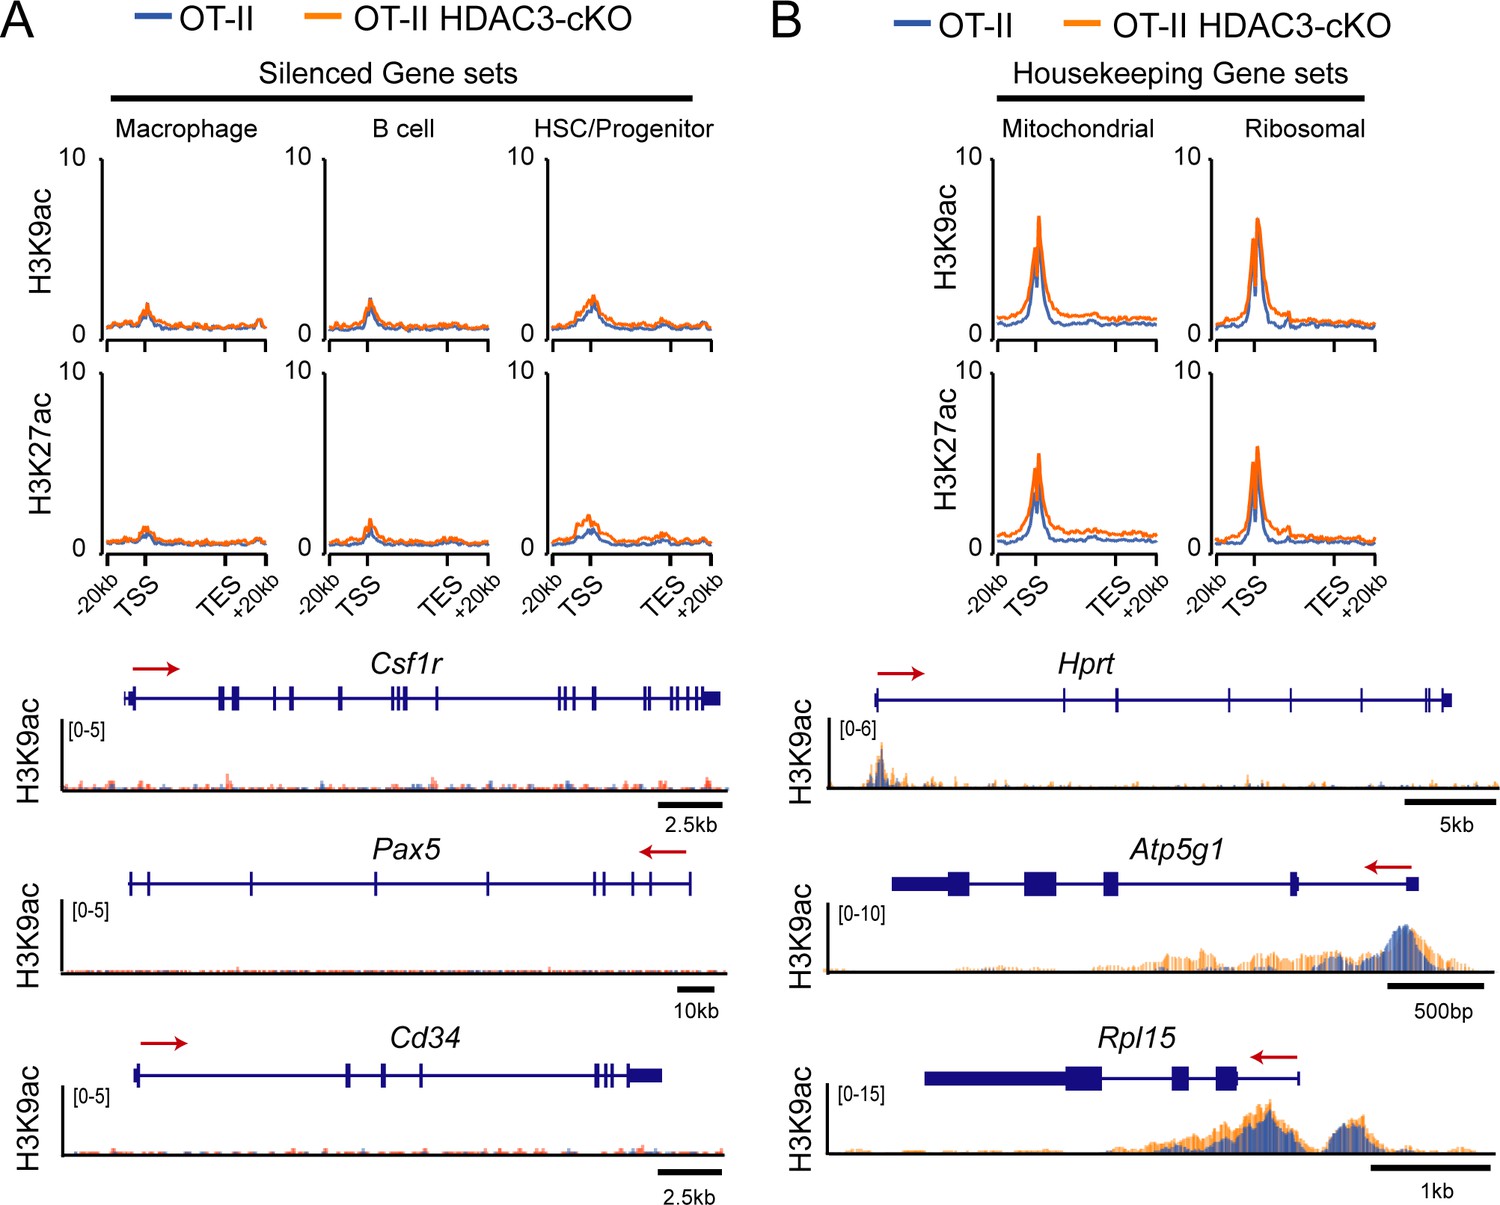
H3K9ac signal and H3K27ac signal at silenced genes and housekeeping genes in thymocytes.
(A–B) Average H3K9ac and H3K27ac signal ±20 kb around the gene body among gene sets that are silenced in thymocytes (A) or housekeeping genes (B). Below are example H3K9ac ChIP-seq snapshots of genes within each of the genesets—Csf1r for macrophage, Pax5 for B cell, Cd34 for HSC/progenitor, Hprt for housekeeping, Atp5g1 for mitochondrial, and Rpl15 for ribosomal. Each image depicts an overlay of ChIP-seq tracks between OT-II (blue) and OT-II HDAC3-cKO (orange) mice. Refer to Figure 3—source data 2 for list of genes in these gene sets (macrophage, B cell, HSC/Progenitor, mitochondrial, ribosomal). TSS represents transcription start site; TES represents transcription end site. Scale bar in kb below ChIP-seq tracks identifies scale of snapshot.
Figure 4
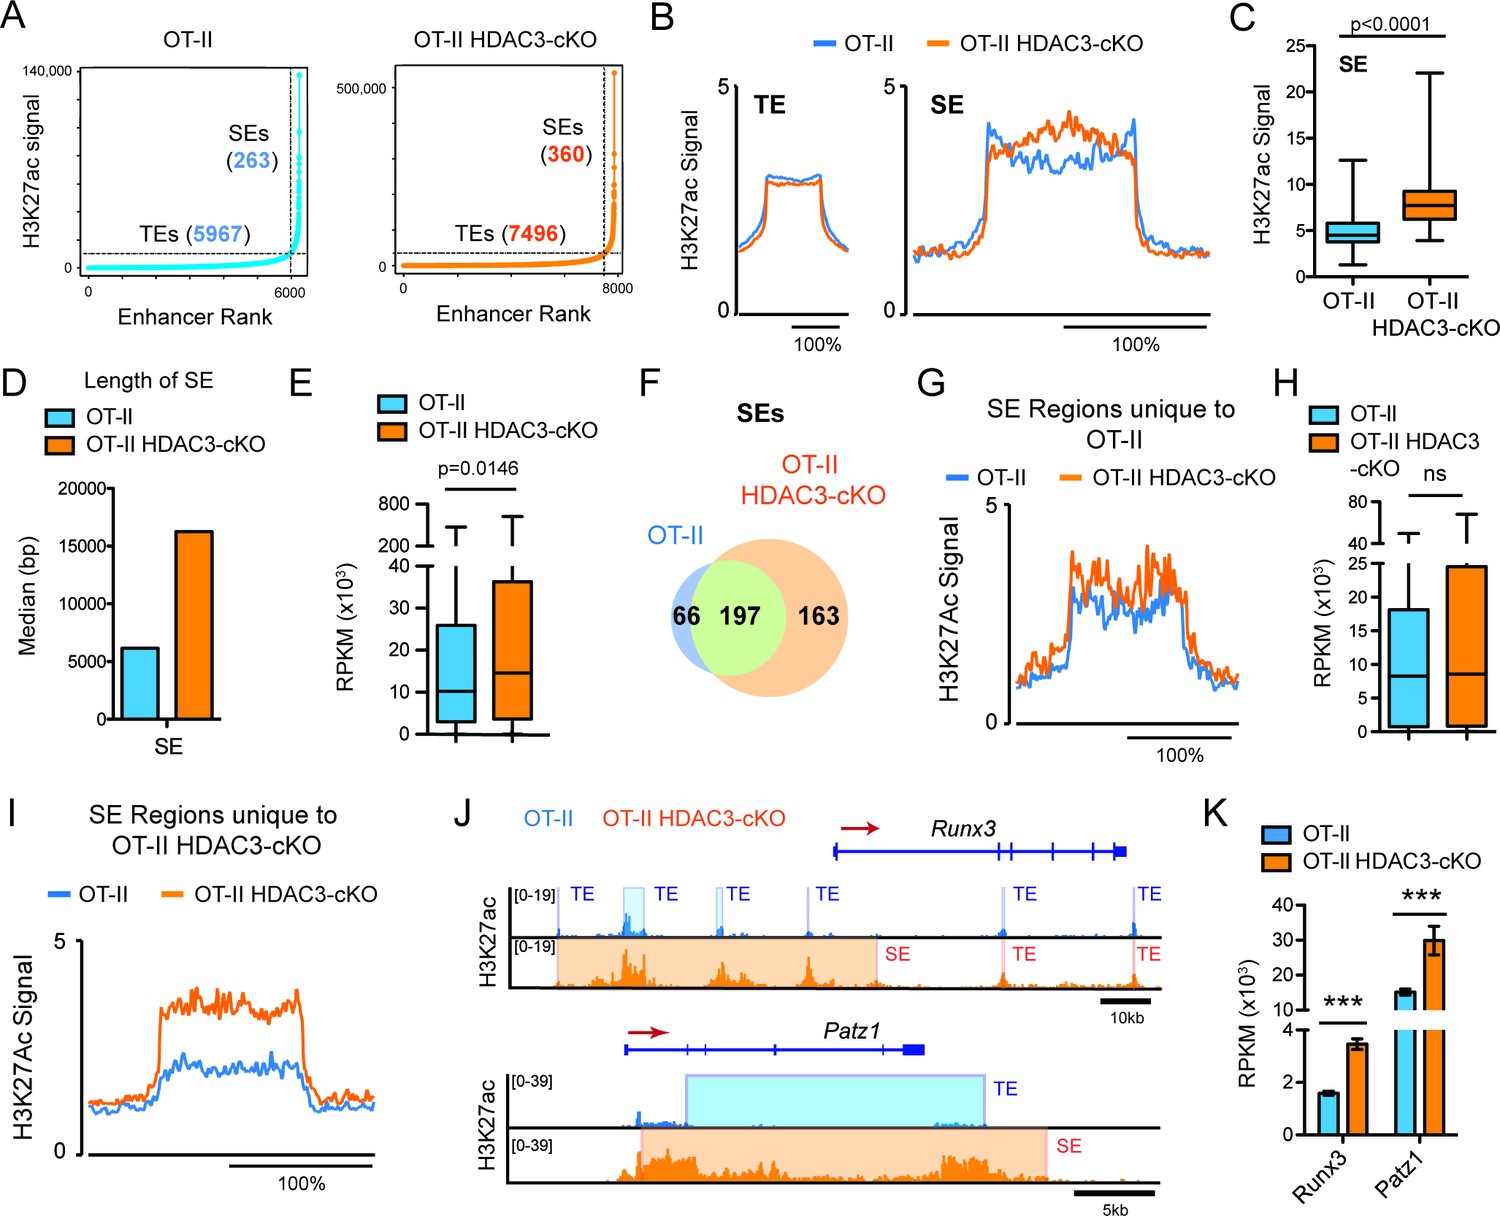
DP thymocytes from HDAC3-cKO mice show a CD8-lineage bias at the chromatin level.
(A) Typical enhancers (TEs) and super enhancers (SEs) in Immature (DP) cells from OT-II and OT-II HDAC3-cKO mice. (B) Average H3K27ac signal (normalized to input) for TE and SE regions from OT-II and OT-II HDAC3-cKO mice. (C) Box-and-whisker plot of H3K27ac signal for each super enhancer in OT-II and OT-II HDAC3-cKO mice. (D) Median length of super-enhancers between OT-II and OT-II HDAC3-cKO mice. (E) Box-and-whisker plots of mRNA expression (reads per kilobase of exon per million mapped reads, RPKM) from super-enhancer-associated genes from OT-II and OT-II HDAC3-cKO mice. (F) Venn Diagram of shared and unique SEs between OT-II and OT-II HDAC3-cKO mice. (G) H3K27ac signal at super-enhancer regions unique to OT-II mice and the corresponding regions in OT-II HDAC3-cKO mice. (H) Box-and-whisker plots of mRNA expression (RPKM) between OT-II and OT-II HDAC3-cKO mice of genes associated with super-enhancers unique to OT-II mice. (I) H3K27ac signal at super-enhancer regions unique to OT-II HDAC3-cKO mice and the corresponding regions in OT-II mice. (J) Snapshot of H3K27ac ChIP-seq tracks at the Runx3 and Patz1 locus from OT-II (blue) and OT-II HDAC3-cKO (orange) mice. Shaded regions depict TEs and SEs. (K) Gene expression (RNA-seq) of Runx3 and Patz1 in Immature (DP) cells from OT-II and OT-II HDAC3-cKO mice. (B, G, I) The x-axis represents a surrounding area that corresponds to 200% of the center of each region. (***, p < 0.001). See also Figure 4—source data 1.
-
Figure 4—source data 1
Super-enhancer list.
Genomic data corresponding to super-enhancers analyzed in Figure 4.
- https://doi.org/10.7554/eLife.43821.013
Figure 5 with 2 supplements
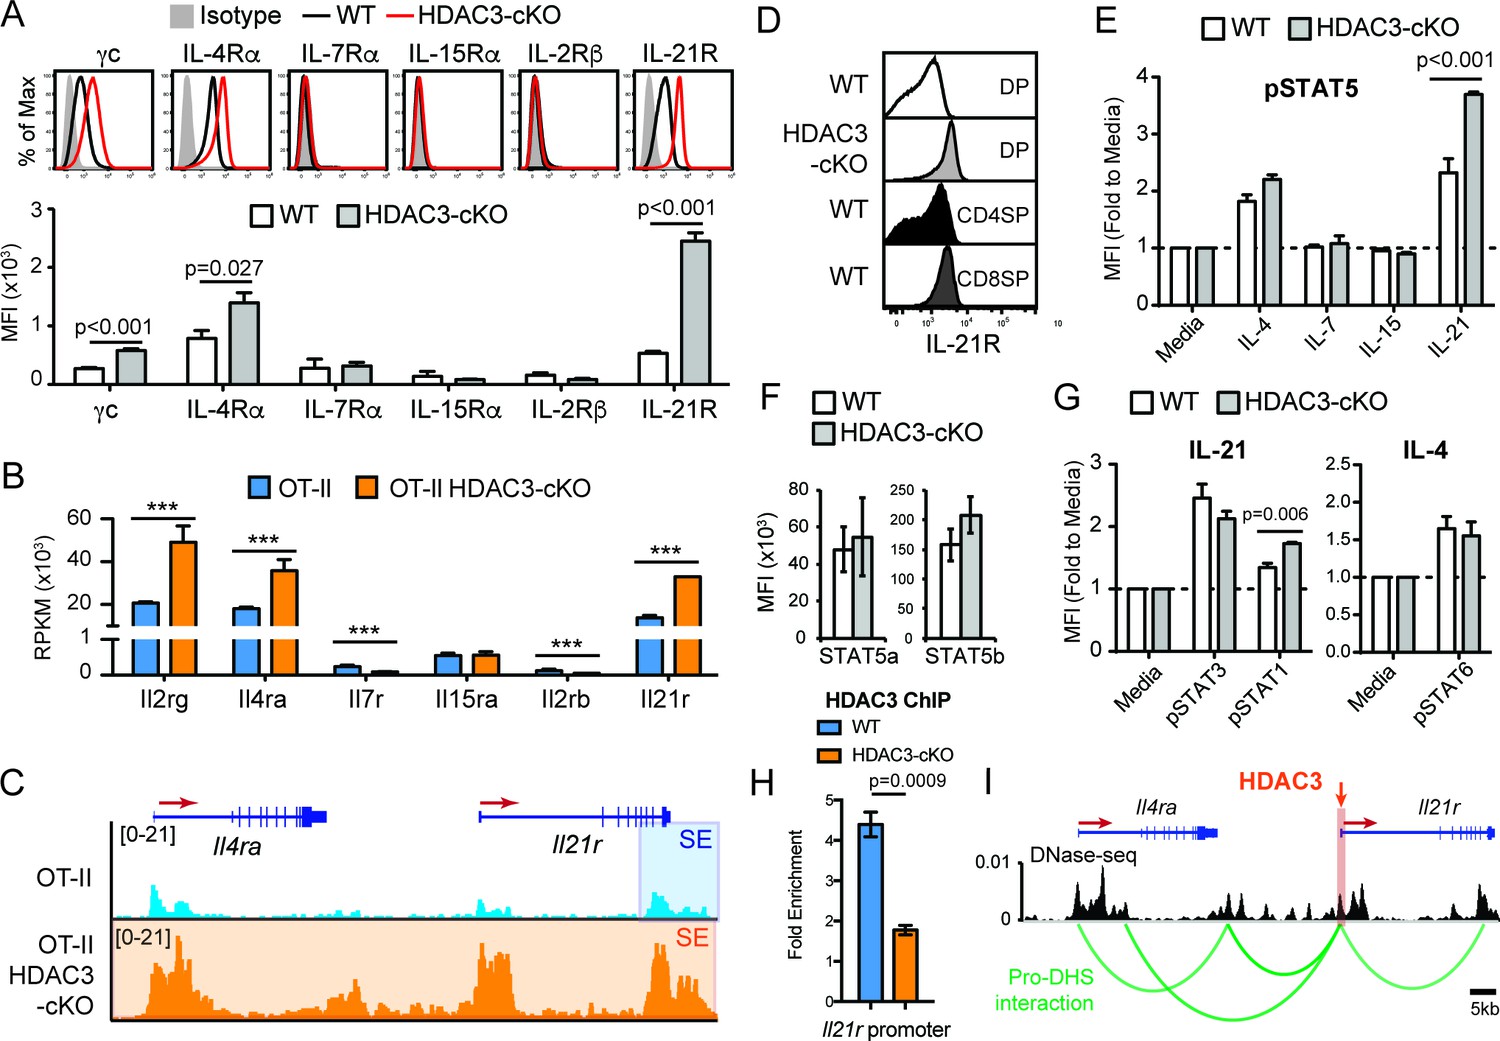
DP thymocytes from HDAC3-cKO mice show increased STAT5 activation in response to IL-21.
(A) Surface expression of cytokine receptor chains γc, IL-4Rα, IL-7Rα, IL-15Rα, IL-2Rβ, and IL-21R on DP thymocytes from WT and HDAC3-cKO mice. Flow cytometric plots have an isotype control to illustrate background level of expression. (B) Gene expression (RNA-seq) of Il2rg, Il4ra, Il7r, Il15ra, Il2rb, and Il21r in Immature (DP) cells from OT-II and OT-II HDAC3-cKO mice. (C) Snapshot of H3K27ac ChIP-seq tracks at the Il4ra and Il21r gene loci in Immature (DP) thymocytes from OT-II and OT-II HDAC3-cKO mice. Shaded regions identify super-enhancers. (D) Protein expression of IL-21R on DP, CD4SP and CD8SP thymocytes from WT mice and DP thymocytes from HDAC3-cKO mice. (E) pSTAT5 levels in DP thymocytes from WT and HDAC3-cKO mice after 10 min ex vivo stimulation with IL-21, IL-15, IL-7, IL4, or media alone. (F) Protein expression of STAT5a and STAT5b in DP thymocytes from WT and HDAC3-cKO mice. (G) pSTAT3 and pSTAT1 levels after a 10 min in vitro IL-21 stimulation, and pSTAT6 levels after IL-4 stimulation of DP thymocytes from WT and HDAC3-cKO mice. (H) Quantitative ChIP (qChIP) of HDAC3 binding at the Il21r promoter in DP thymocytes from WT and HDAC3-cKO mice. Graph depicts fold enrichment over Rpl30 (n = 4 mice/group from four indpendent experiments). (I) DNase-seq and Hi-C arc plots at the Il4ra and Il21r gene loci in DP thymocytes and pooled DN3-to-DP thymocytes, respectively. Shaded region highlights where HDAC3 binds, as shown in Figure 5H. (DHS, DNA hypersensitivity sites). (A, E, G) Bar graph shows mean ± SEM of MFI from 4 to 5 mice from at least three independent experiments. (D, H) Plots are representative of at least three mice from three independent experiments. (F) Bar graph shows mean ± SEM of MFI from three mice from two independent experiments. (***, p < 0.001). See also Figure 5—figure supplements 1–2.
Figure 5—figure supplement 1
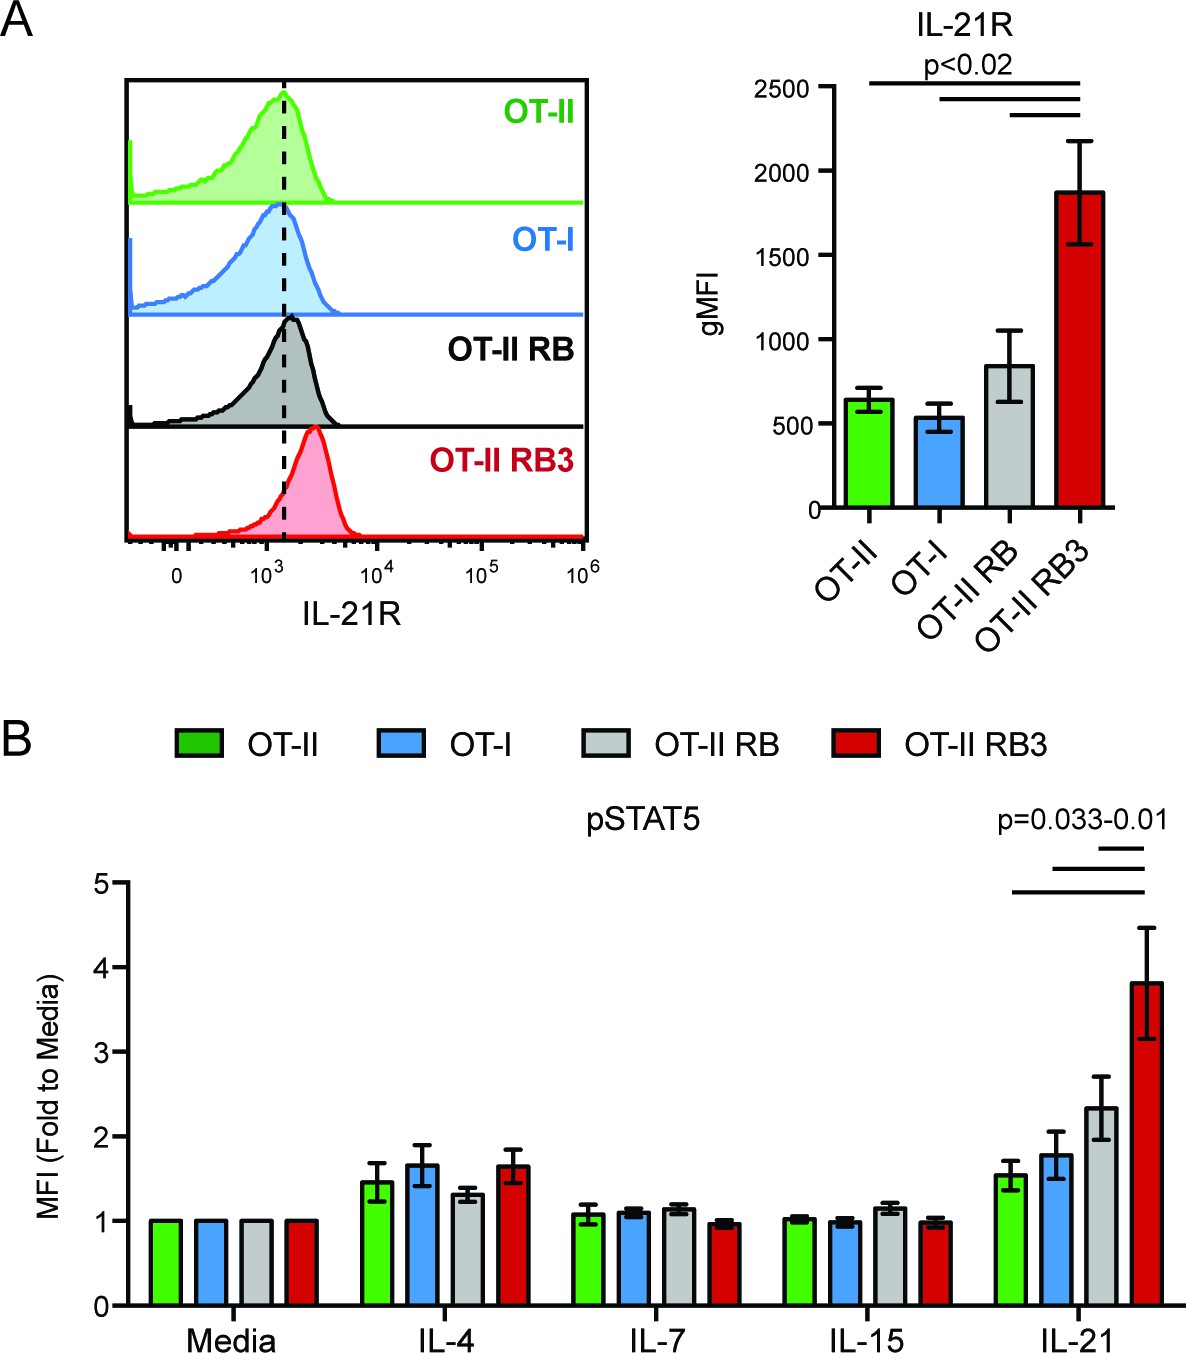
IL-21R expression and signaling in OT-II RB3 mice.
(A) IL-21R expression in DP thymocytes from OT-II, OT-I, OT-II RB, and OT-II RB3 mice. Bar graph is mean ± SEM of MFI. N = 3–7 mice/group. (B) p-STAT5 expression in DP thymocytes from OT-II, OT-I, OT-II RB, and OT-II RB3 mice that were stimulated with the indicated cytokines for 10mins. Experimental conditions are the same as performed in Figure 5E. Bar graph shows mean ± SEM of p-STAT5 MFI fold to unstimulated conditions. N = 3–7 mice/group.
Figure 5—figure supplement 2
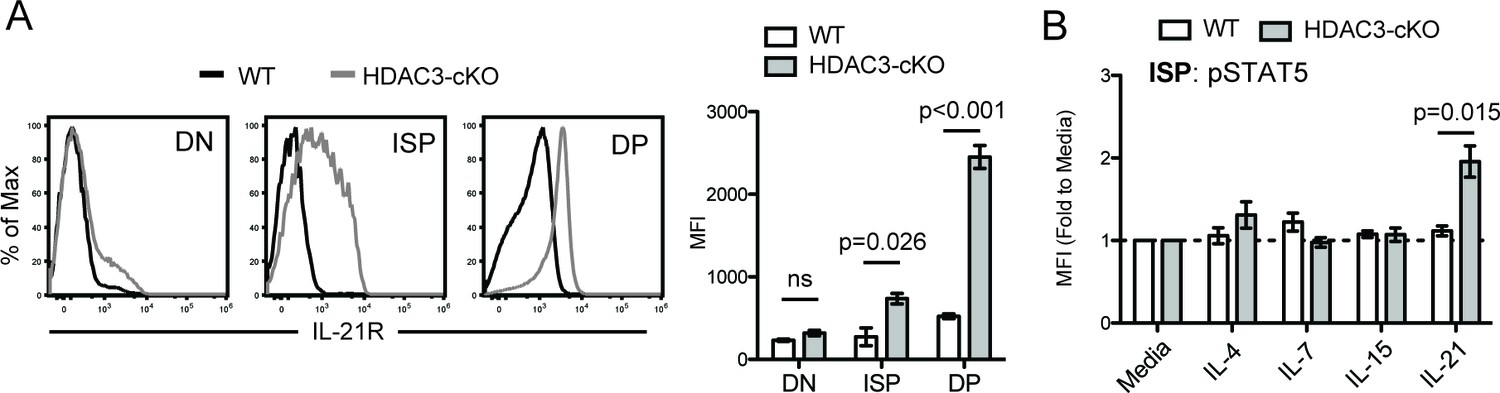
IL-21R expression and signaling in CD2-icre HDAC3-cKO mice.
(A) IL-21R expression in DN (CD4-CD8-), immature SP (ISP; CD4-CD8+TCRβ-), and DP (CD4+CD8+) thymocytes from WT and HDAC3-cKO mice. Bar graph is mean ±SEM of MFI. N = 3 mice/group. (B) p-STAT5 expression in ISPs from WT and CD2-icre HDAC3-cKO mice that were stimulated with the indicated cytokines for 10mins. Experimental conditions are the same as performed in Figure 5E. Bar graph shows mean ±SEM of p-STAT5 MFI fold to unstimulated conditions. N = 4–5 mice/group.
Figure 6 with 1 supplement
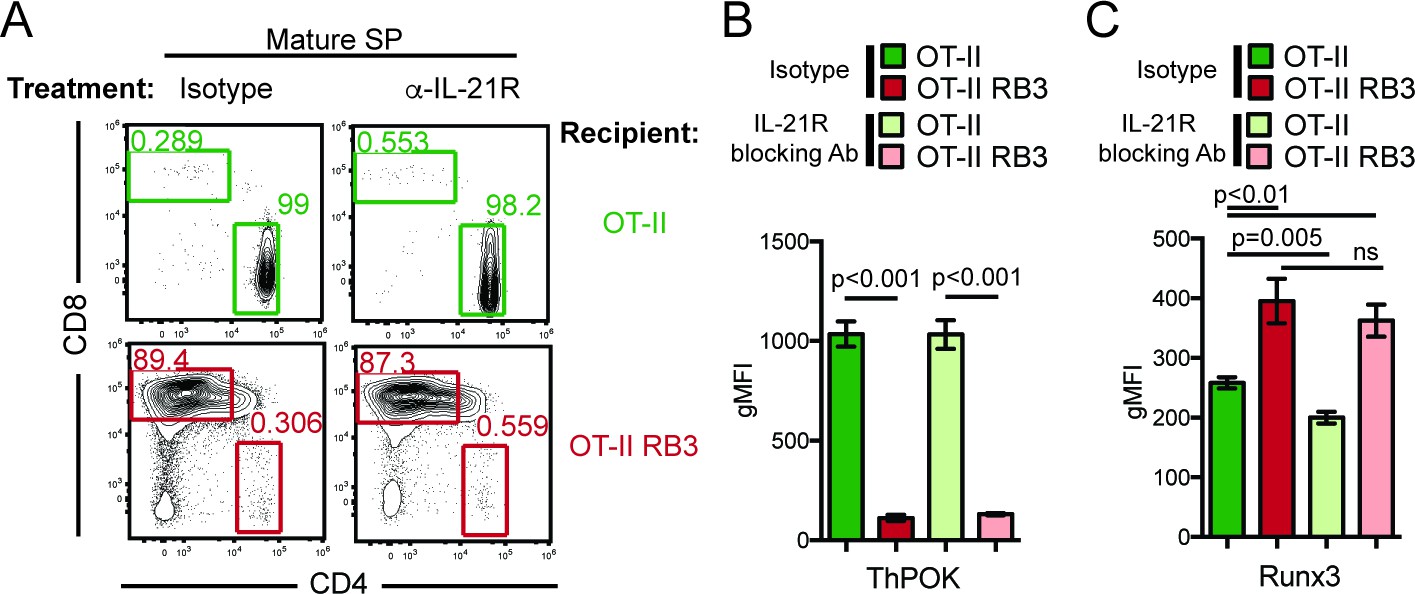
Blocking IL-21R does not restore CD4-lineage commitment in OT-II RB3 mice.
(A) OT-II and OT-II RB3 mice were injected with isotype or anti-IL-21R blocking antibodies retro-orbitally (i.v.) for two weeks every 3–4 days. Flow plots depict CD4/CD8 profile in mature SP thymocytes (Vβ5+Vα2+H2K+CD24lo). Data is representative of 3–4 mice per group from two independent experiments. (B–C) ThPOK (B) and Runx3 (C) expression in Vβ5hiH2K- thymocytes from OT-II and OT-II RB3 mice treated with isotype or anti-IL-21R blocking antibody, as performed in A. Data show mean ± SEM of geometric MFI from 3 to 4 mice from two independent experiments. See also Figure 6—figure supplement 1.
Figure 6—figure supplement 1
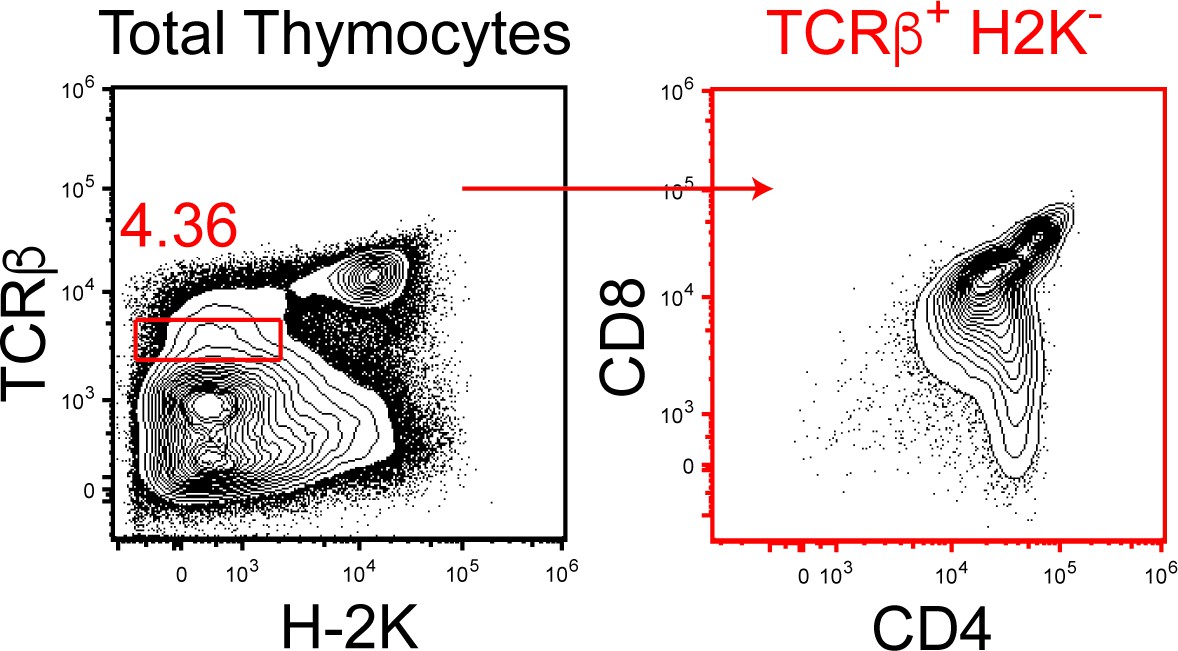
Gating strategy for Figure 6B–C.
To examine thymocytes early in CD4/CD8-lineage choice, thymocytes were gated as TCRβ+H-2K-. As shown here, TCRβ+H-2K- thymocytes are CD4+CD8lo, also known as intermediate thymocytes that undergo CD4/CD8-lineage choice (Singer et al., 2008).
Figure 7 with 2 supplements
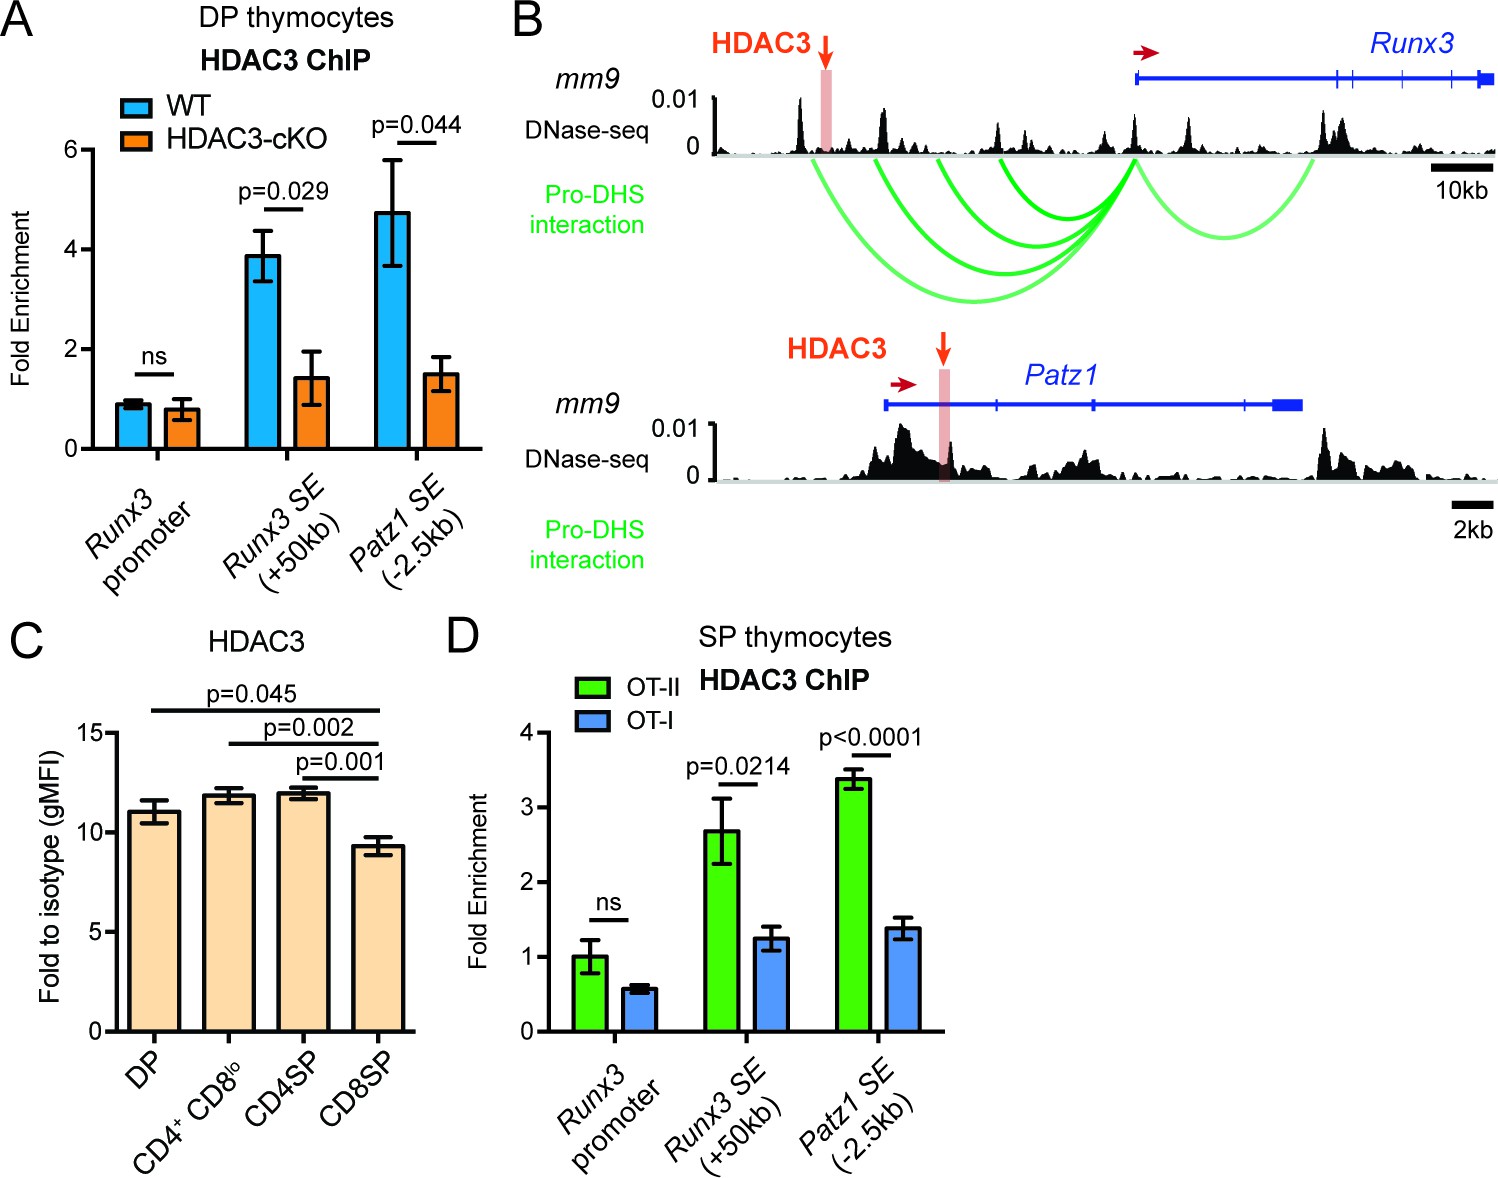
HDAC3 binds to Runx3 and Patz1 regulatory regions in DP and CD4SP thymocytes.
(A) HDAC3 qChIP in DP thymocytes from WT and HDAC3-cKO mice. Plots show mean ± SEM of fold enrichment over Rpl30 (n = 3 mice/group from three independent experiments). (B) DNase-seq and Hi-C arc plots at the Runx3 and Patz1 gene loci in DP thymocytes and pooled DN3-to-DP thymocytes, respectively. Shaded region highlights where HDAC3 binds, as shown in (A). (DHS, DNA hypersensitivity sites). (C) HDAC3 protein expression measured by flow cytometry in DP, CD4+CD8lo, CD4SP, and CD8SP thymocytes from WT mice. Plots show mean ± SEM of fold enrichment over isotype (n = 4 mice/group from three independent experiments). (D) HDAC3 qChIP in SP thymocytes from OT-II and OT-I mice. Plots show mean ± SEM of fold enrichment over Rpl30 (n = 4 mice/group from two independent experiments). See also Figure 7—figure supplements 1–2.
Figure 7—figure supplement 1
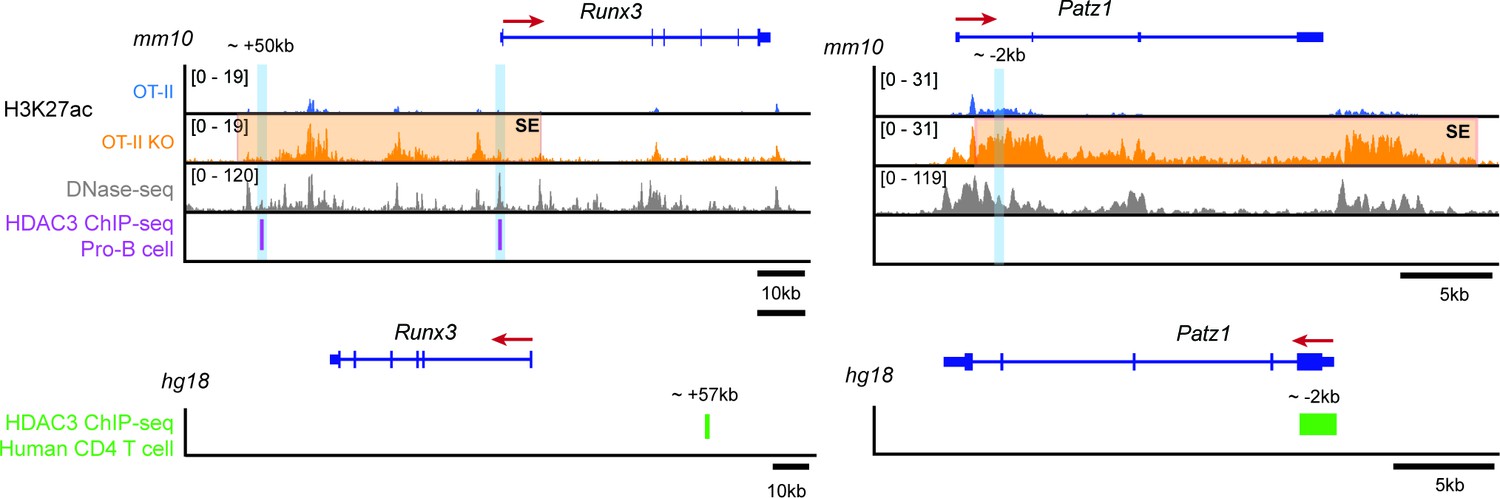
HDAC3 ChIP-seq in pro-B cells and human CD4 T cells.
ChIP-seq snapshots at Runx3 and Patz1 of publicly available HDAC3 ChIP-seq datasets in pro-B cells (GEO: GSM2096648, genome alignment mm10) and human CD4 T cells (GEO: GSM393952, genome alignment hg18). Alongside the HDAC3 ChIP-seq, DNase-seq (GEO: GSM2195840, genome alignment mm10) and H3K27ac ChIP seq from Immature OT-II and OT-II HDAC3-cKO thymocytes (as shown in Figure 4) were provided to visualize where HDAC3 binds in relation to regulatory elements and changes in histone acetylation between WT and HDAC3-cKO mice, respectively. Orange shaded regions demarcate super enhancers (SE) and blue shaded regions highlight where primers were made for qPCR. In pro-B cells, HDAC3 binds 50 kb upstream of Runx3, at the Runx3 promoter, and approximately 2 kb downstream of the Patz1 promoter. Likewise, HDAC3 binds approximately 57 kb upstream of Runx3 and 2 kb downstream of the Patz1 promoter in human CD4 T cells. These three regions were used to make primers for HDAC3 qChIP performed in Figure 7.
Figure 7—figure supplement 2
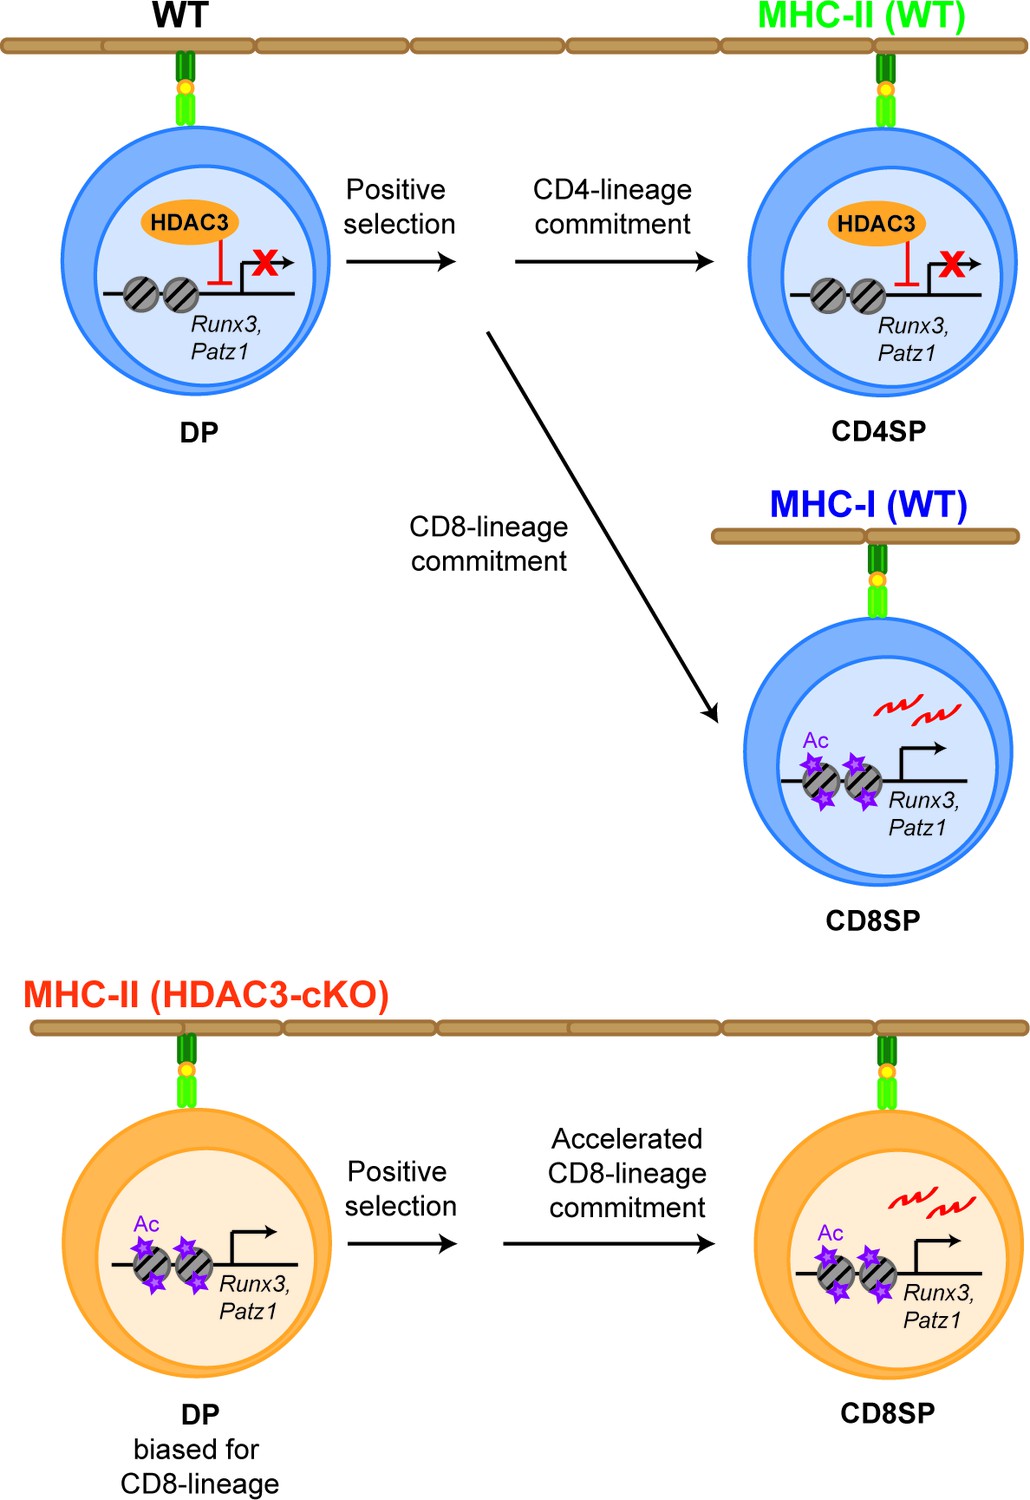
Model.
HDAC3 is required to restrain CD8-lineage genes for CD4-lineage choice. In WT thymocytes (upper panel), HDAC3 associates with Runx3 and Patz1 in DP thymocytes to restrain CD8-lineage gene expression. After positive selection, HDAC3 stays bound to these regions in CD4SP thymocytes for CD4-lineage commitment, while in CD8SP thymocytes HDAC3 no longer binds to these regions for expression of CD8-lineage genes and CD8-lineage commitment. However, deletion of HDAC3 (lower panel) results in an increase in histone acetylation at CD8-lineage genes (Runx3, Patz1) and priming DP thymocytes for the CD8-lineage. As a result, Runx3 is pre-maturely expressing during CD4/CD8-lineage choice and cells commit to the CD8-lineage, which is accelerated.
Author response image 1
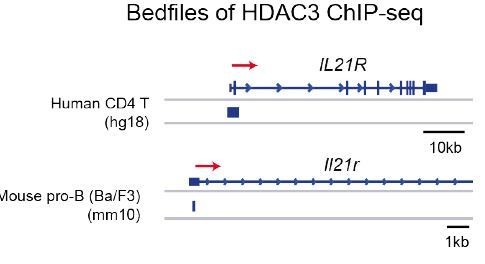
HDAC3 binding at the Il21r promoter in human CD4 T cells and mouse pro-B cells.
Accession numbers for publicly accessible HDAC3 ChIP-seq: human CD4 T cells (GSM393952) and mouse pro-B cells (GSM2096648).
Author response image 2
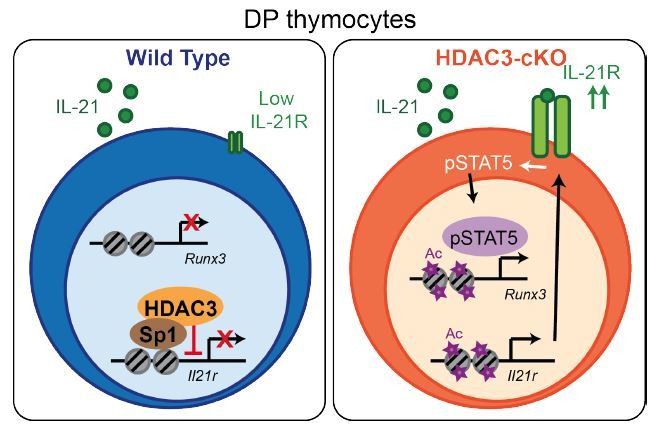
Model.
HDAC3 functions to block expression of IL-21R in DP thymocytes to prevent IL-21R expression, STAT5 activation, and expression of CD8-lineage promoting genes, such as Runx3
Author response image 3
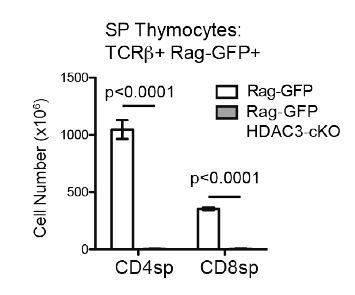
Very few SP thymocytes are generated in CD2-icre HDAC3-cKO mice.
Cell count of CD4SP and CD8SP thymocytes from Rag-GFP and Rag-GFP CD2-icre HDAC3-cKO mice. SP thymocytes were gated on Rag-GFP+ to remove recirculating (GFP-) T cells in the thymus. Graph shows mean +/- SEM of 5 mice/group.
Author response image 4
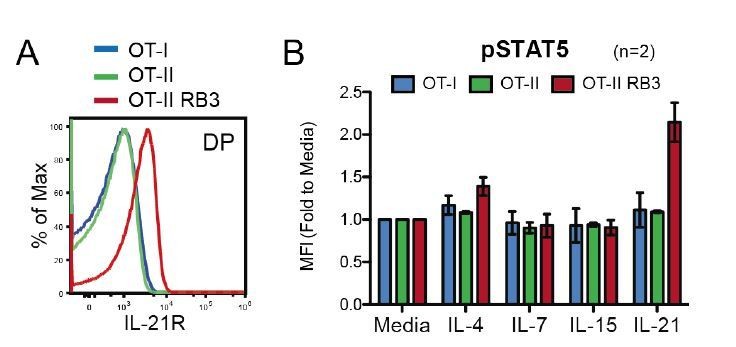
OT-II RB3 mice show increased IL-21R expression and IL-21-induced STAT5 activation.
(A) IL-21R expression on DP thymocytes from OT-I, OT-II, and OT-II RB3 mice. (B) p-STAT5 expression in DP cells from OT-I, OT-II, and OT-II RB3 mice that were stimulated with the indicated cytokines for 10mins. Experimental conditions are the same as performed in Figure 5E. Bar graph shows mean +/- SEM. N=2 mice/group.
Author response image 5
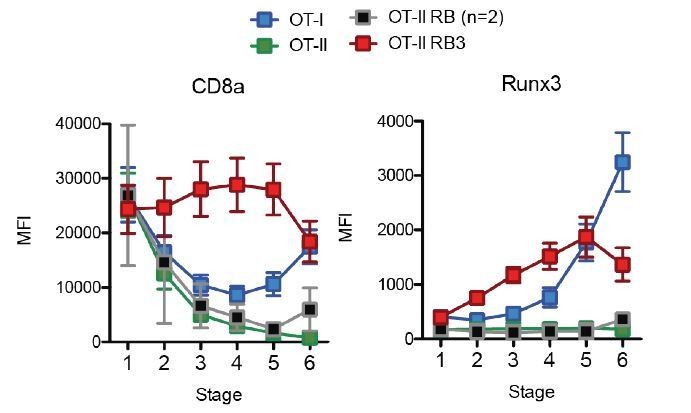
Acceleration of CD8-lineage commitment in HDAC3-deficient thymocytes.
Expression of Runx3 and CD8α during stages of lineage commitment (Stages 1-6), from OT-I, OT-II, and OT-II RB3 straight bone marrow chimeras. CD69-versus-CCR7 plots were gated from DN-removed, CD45.2+ cells. Plots show mean ± SEM of MFI from 4-5 mice per group from three independent experiments, except N=2 mice for OT-II RB.
Additional files
-
Supplementary file 1
Primers used for ChIP-seq and qChIP.
- https://doi.org/10.7554/eLife.43821.022
-
Transparent reporting form
- https://doi.org/10.7554/eLife.43821.023
Download links
A two-part list of links to download the article, or parts of the article, in various formats.
Downloads (link to download the article as PDF)
Open citations (links to open the citations from this article in various online reference manager services)
Cite this article (links to download the citations from this article in formats compatible with various reference manager tools)
HDAC3 restrains CD8-lineage genes to maintain a bi-potential state in CD4+CD8+ thymocytes for CD4-lineage commitment
eLife 8:e43821.
https://doi.org/10.7554/eLife.43821


