Detailed analysis of chick optic fissure closure reveals Netrin-1 as an essential mediator of epithelial fusion
- University of Edinburgh, United Kingdom
- UCL Great Ormond Street Institute of Child Health, United Kingdom
- National Eye Institute, National Institutes of Health, United States
- Harvard Medical School, United States
Figures
Figure 1 with 2 supplements
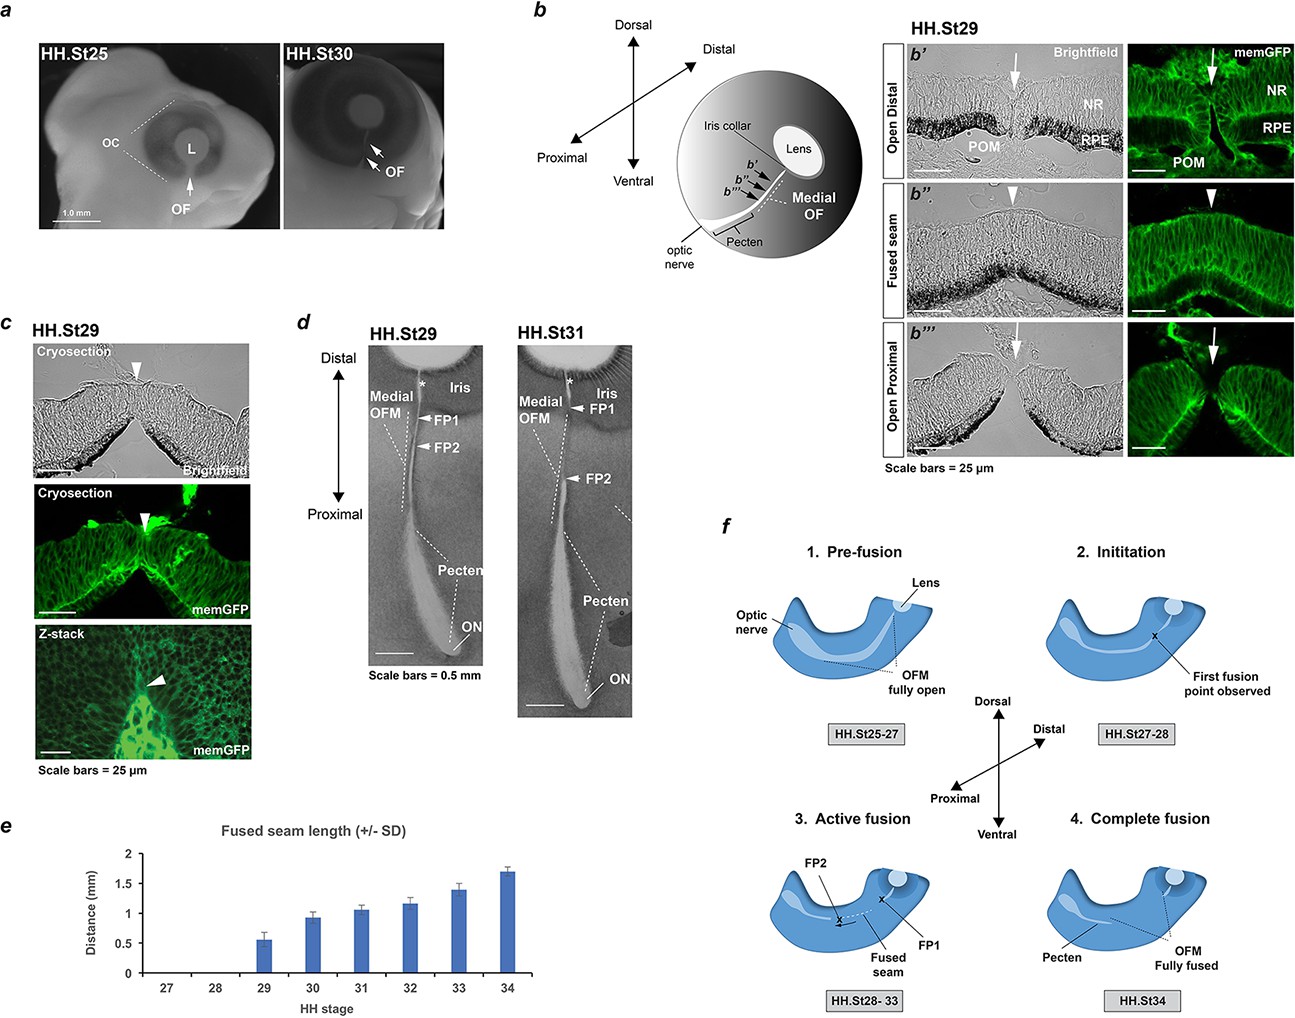
Analysis of chick optic fissure closure.
(a) Chicken embryos at HH.St25 and HH.St30 illustrated the optic fissure (OF; arrows) as a non-pigmented region in the ventral aspect of the developing eye. (b) Left: Schematic showing orientation of the developing chick optic fissure with respect to the whole embryonic eye. Dorsal-ventral and proximal-distal axes are indicated. This study focused on the medial optic fissure (marked by white hatching) distal to the developing pecten and optic nerve. Right: brightfield and fluorescent confocal microscopy using memGFP cryosections illustrated the open (arrow) and fused seam (arrowhead) regions in chick OFM. The location and planes of the cut sections along the D-P axis are indicated in the accompanying schematic. (c) Brightfield and fluorescent confocal microscopy of memGFP OFM sections unambiguously defined the location of fusion plates (arrowheads, top and middle panels) at all stages throughout OFC, combined with flat-mounted memGFPs. Bottom panel: representative single plane confocal z-stack projection image clearly indicated FP2. (d) Brightfield microscopy of flat-mounted ventral eyes revealed the tissue dynamics during closure and coinciding with location of fusion plates (FPs). At HH.St29 the medial OFM had narrowed markedly along the P-D axis between the iris and the proximal region, with FP1 and FP2 (arrowheads) closely positioned in the distal OF. At HH.St31 the medial OFM had become fully pigmented in the fused seam, and the distance between FP1 and FP2 (arrowheads) had lengthened in the P-D axis. An opening remained in the OFM at the iris region (asterisk). (e) Histogram to illustrate fused seam length at each HH stage (error bars = s.d.). Quantitative data of OFM progression obtained from flat mounts and cryosections are provided in Table 1. (f) Schematic representation of chick OFC progression in the distal and medial retina. 1. Pre-fusion: A fully open OFM is evident in the ventral retina at stages HH.St25-27; 2. Initiation: At HH.St27-28 the first fused region is observed in the distal-medial OFM; 3. Active fusion: fusion extends briefly in the distal direction but then stops in the presumptive iris to leave an open region throughout development. Fusion proceeds markedly proximally with FP2 extending towards the pecten. 4. Complete fusion: Fusion stops proximally when FP2 meets the fused pecten region. The fusion seam is complete with a complete continuum of both NR and RPE layers in the ventral eye. Abbreviations: L, lens; OC, optic cup, OF, optic fissure; ON, optic nerve; FP, fusion plate; HH, Hamburger Hamilton staging; RPE, retinal pigmented epithelia; NR, neural retina; POM, periocular mesenchyme.
Figure 1—figure supplement 1
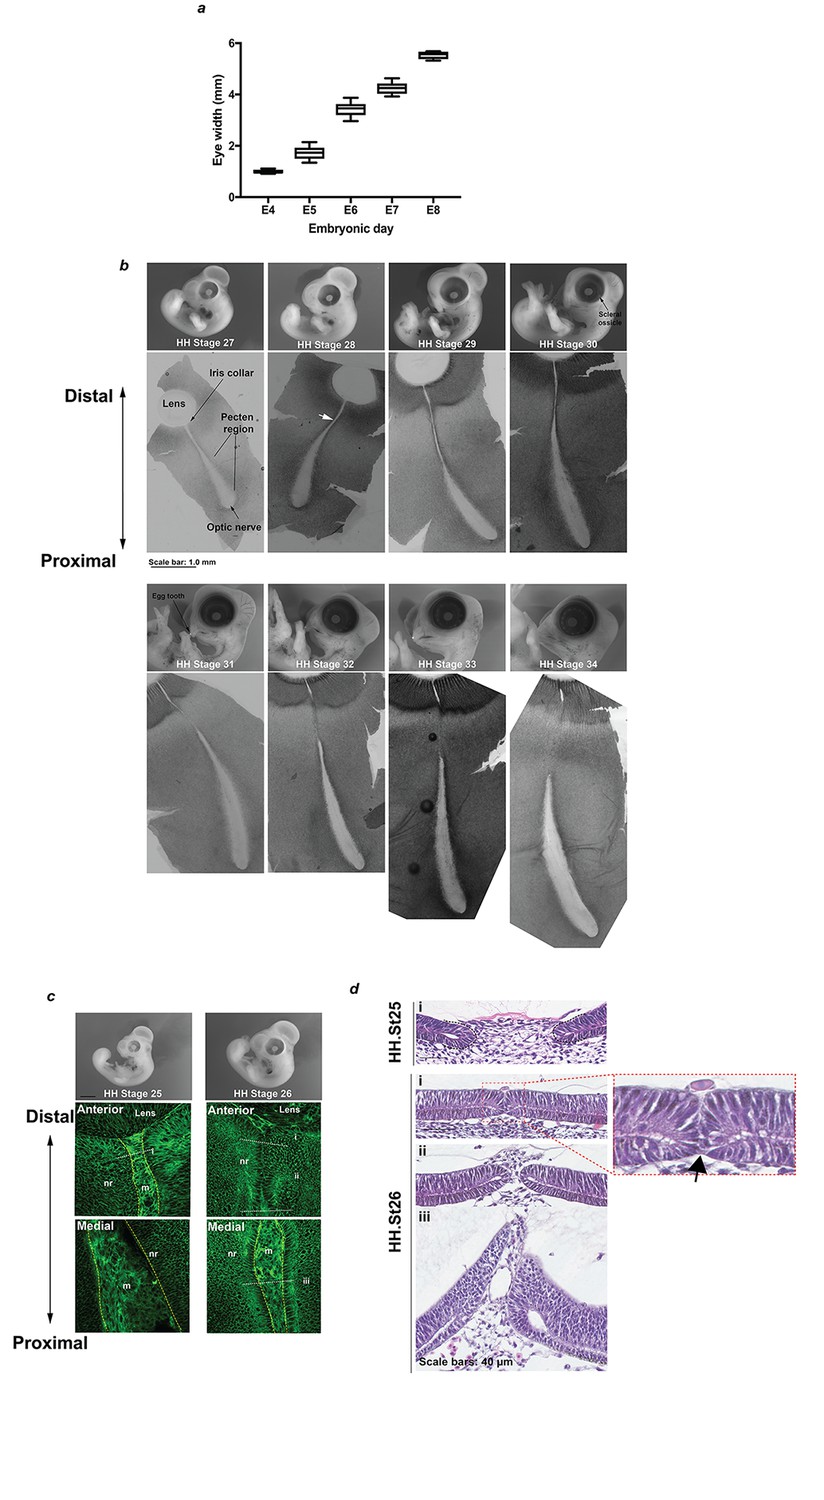
Anatomical and histological survey of chick OFC.
(a) Mean eye diameter measurements for chick at embryonic days E4-E8 (n ≥ 5 eyes per stage). (b) Representative images of whole embryos and corresponding flat-mounted fissures from fusion-relevant Hamburger Hamilton (Hamburger and Hamilton, 1992; Hamburger and Hamilton, 1951) embryonic stages. The approximate point of the initiating fusion plate is indicated for a HH.St28 fissure (white arrow). A minimum of 3 fissures were examined by confocal light-microscopy to identify fusion points and then additional samples were processed by serial cryo-sectioning to confirm fusion plates and fused seams. (c) Whole embryo (Top panels) and memGPF confocal Z-stack images (Lower panels) at HH.St25 and HH.St26 positioned at the distal and medial OFM in the P-D axis illustrated lack of fusion throughout the iris and fissure margin. (d) Representative H and E sections from fissures at HH.St25 and HH.St26 confirming lack of fusion at these stages. Note the OFM in close apposition but un-fused (arrow) at the iris region in HH.St25 OFM (enlarged panel). Panel labels i-iii correspond to positions indicated in c).
Figure 1—figure supplement 2
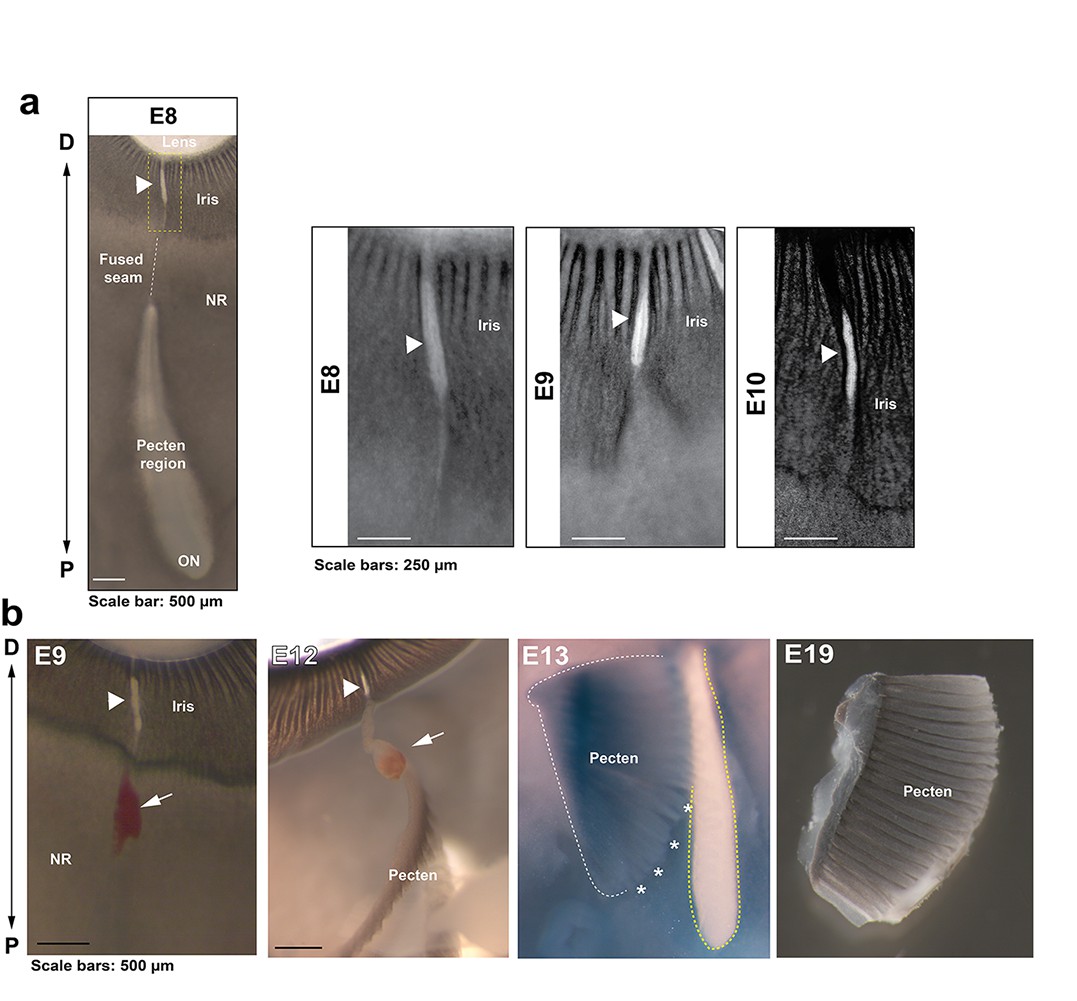
Anatomical features of iris and pecten in relation to OFC in the chick eye.
(a) Iris development in flat mounted OFMs from E8-E10. Note the OFM at the iris remains open and is non-pigmented throughout all stages analysed (arrowheads). (b) Location and orientation of the developing pecten oculi and associated blood vessel (arrows) entering at the open iris region (arrowheads) shown in eyes taken from embryos at E9-19. The pecten was partially dissected from the underlying tissue (asterisks) to indicate its location relevant to the proximal optic fissure (yellow hatching). The P-D axes are shown.
Figure 2 with 2 supplements
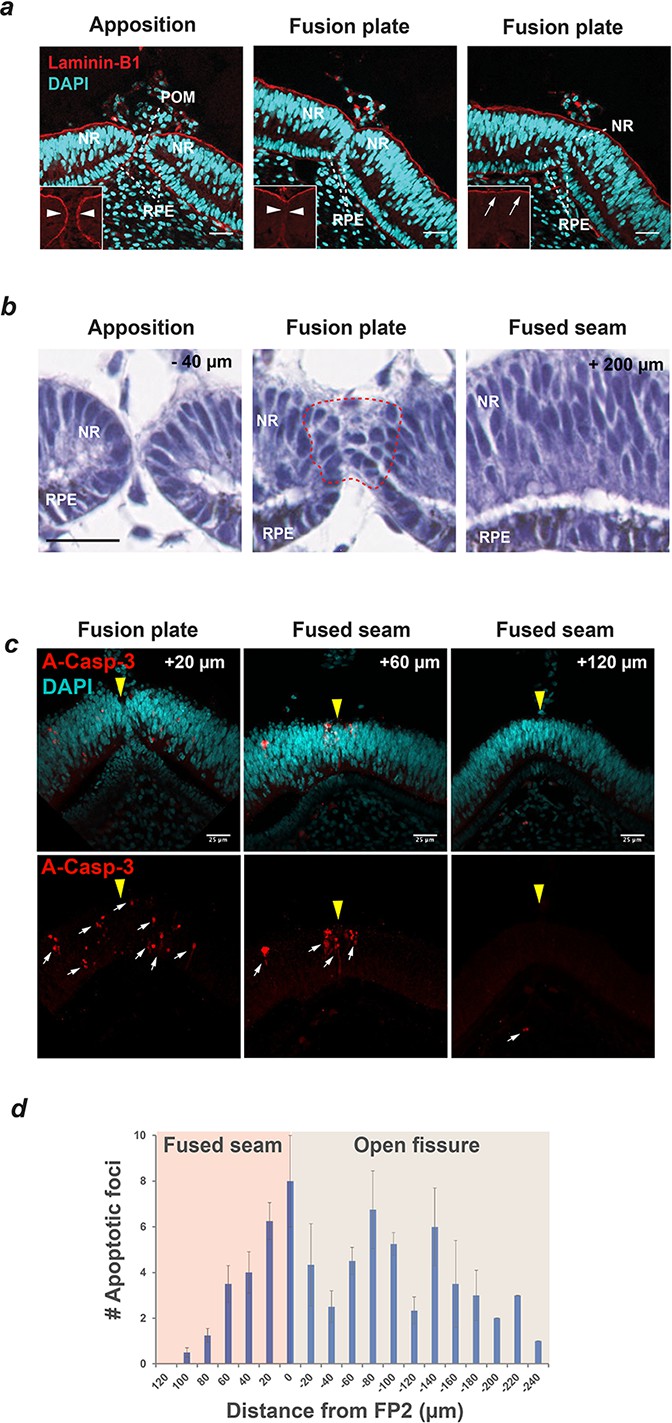
Basement membrane remodelling, loss of epithelial characteristics and apoptosis are defining features of Chick OFC.
(a) Immunostaining for the basement membrane (BM) component Laminin-B1 and nuclear staining (DAPI) using confocal microscopy illustrated that fusion was preceded by the dissolution of BM (compare arrowheads in boxes) as the fissure margins came into contact at the fusion plate, and that fusion was characterised by the generation of a BM continuum at the basal aspect of the neural retina (arrows). Nuclear staining indicated that cells of the retinal pigmented epithelium (RPE) and neural retina (NR) contributed to the fusion plate and that periocular mesenchymal cells were removed from the region between the apposed margins. Images are from a single OFM and are representative of n ≥ 3 samples. (b) H and E staining on paraffin sections at FP2 showed apposed fissure margins with well organised epithelia in NR and RPE (−40 µm from FP2); subsequent sections at the fusion plate showed loss of epithelial organisation in both cell types (within hatching); at the fused seam (+200 µm from FP2) continuous organised layers were observed in both NR and RPE epithelia. Note that fusion occurred from contributions of both NR and RPE. (c) Immunostaining for the apoptosis marker activated Caspase-3 (A-Casp3) on serial cryo-sectioned OFMs (HH.St30) using confocal microscopy (z-stack projections) indicated that A-Casp3 positive foci (arrows) were enriched in epithelia at the OFM and in the nascently fused seam. The midline OFM, including the fusion points, is indicated by yellow arrowheads in all panels. OFMs were counterstained with DAPI. (d) Quantitation of A-Casp3 foci from serially-sectioned OFMs confirmed significant enrichment at FP2, with a graded reduction in apoptotic cells in both directions away from the fusion plate. Data shown are the mean of all measurements (n = 4); error bars = 95% Confidence intervals. Scale bars = 25 µm in a and c, =20 µm in b.
Figure 2—figure supplement 1

Analysis of proliferation in the OF margin.
(a) Schema for quantifying Phospho-Histone H3A foci within confocal Z-stacks taken of whole mounted fissures using a region of interest grid system. (b) Representative image showing positive nuclei (red). ROI grids used were 200 × 200 μm; all positive foci were recorded. P-D axis is shown for (a) and (b). (c) Quantified Phospho-Histone H3A immunostaining of whole-mounted fissures. Fewer proliferating cells (p=0.1093) were observed at HH.St29 within the seam (mean = 66.0, SD = 20.30) compared to outside the seam (mean = 90.8, SD = 32.6), and at HH.St30 (p=0.0063; mean fused seam = 86.8, SD = 32.3; within seam mean = 60.2, SD = 21.8); Student’s t-test used to compare within and outside seam. Data shown are the mean of three fissures per stage with standard deviations indicated. Note: Central seam length was too small to quantify in HH.St29 fissures (<200 μm), however phospho-Histone H3A foci were fewer at the fusion points compared to non-seam regions. (d) Representative phospho-Histone H3A immunostaining of serially-sectioned fissures at HH.St29 revealed the presence of mitotic cells within the apical neural retina throughout the ventral eye. Phospho-Histone H3A was not enriched in the fused seam (HH.St30; n = 3).
Figure 2—figure supplement 2

Analysis of axonal processes and apoptosis during chick OFC.
(a) Anti-Neurofilament immunostaining (NF145, Neurofilament medium; Top panels) in the OFM during active fusion. NF145 immunoreactivity (green) was absent from the distal and medial OFM but was observed in the proximal region at the developing pecten and optic nerve. Immunostaining on sections (middle panels) taken at the fused seam, the apposed OFM, and at the central retina confirmed the absence of axons in epithelial tissues at the open OFM and the nascently-fused OFM. Panel labels correspond to positions indicated in the HH.St30 flat-mount brightfield image (Bottom). (b) Top: Combined bright-field and fluorescence confocal imaging (Z-stack projections) of whole mount anti-activated Caspase-3 immunostaining in a HH.St30 fissure showed positive foci in the fused seam at a ~ 100 μm from the static FP1, and multiple positive foci within the fused seam >100 μm FP2. Below: Enlarged images of FP1 and FP2 from (b) counterstained with DAPI highlighted the enrichment for A-Casp3 foci at FP2 (open margin is indicated by hatching).
Figure 3 with 1 supplement
Transcriptional profiling in chick optic fissure closure.
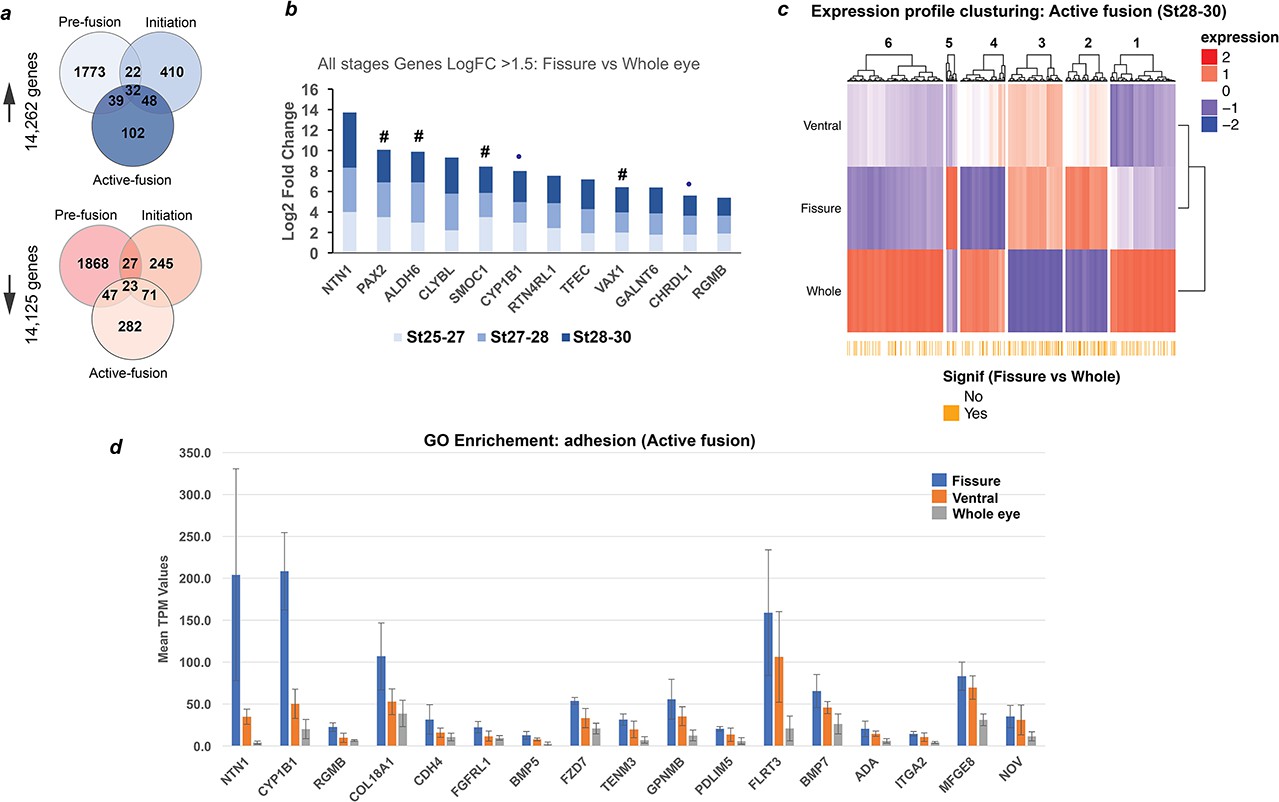
(a) Transcriptional profiling using microdissected regions of the developing chick eye at E5 (HH.St25-27; pre-fusion), E6 (HH.St27-28; initiation), and E7 (HH.St28-30; during active fusion) revealed multiple DEGs at each stage. (b) NTN1 was the highest expressing gene of 12 fissure-specific DEGs (fissure vs whole eye) throughout all stages of chick OFC (Log2 FC >1.5; FDR < 0.05). These included the known human coloboma associated genes (indicated by #): SMOC1, PAX2, VAX1 and ALDH6, in addition to the coloboma candidates from other animal studies CHRDL1 and CYP1B1 (indicated by •). (c) Clustering for relative expression levels at active fusion stages (HH.St28-30) revealed three independent clusters (2, 3, and 5) where expression levels trended with Fissure >ventral > whole eye. (d) Analysis of normalised mean expression values (TPM, n = 3 technical replicates; error bars = 1 x standard deviation) from clusters 2, 3, five at HH.St28-30 for the Gene Ontology enriched pathways (p<0.0001; Biological fusion [GO:0022610], and Epithelial fusion [GO:0022610]) revealed significant fissure-specific expression for highly expressed (TPM >100) genes - NTN1, FLRT3, CYP1B1 and COL18A1 - in addition to other potential candidate genes for roles in OFC. NTN1 (TPM >200) was the highest expressed fissure-specific DEG identified during active fusion.
-
Figure 3—source data 1
Kallisto analysis of RNAseq data from segmentally dissected HH.St25-26/E5 chick eyes.
- https://doi.org/10.7554/eLife.43877.013
-
Figure 3—source data 2
Limma analysis of RNAseq data from segmentally dissected chick eyes at all stages.
- https://doi.org/10.7554/eLife.43877.014
Figure 3—figure supplement 1
Schema and validation data for transcriptional profiling during OFC.
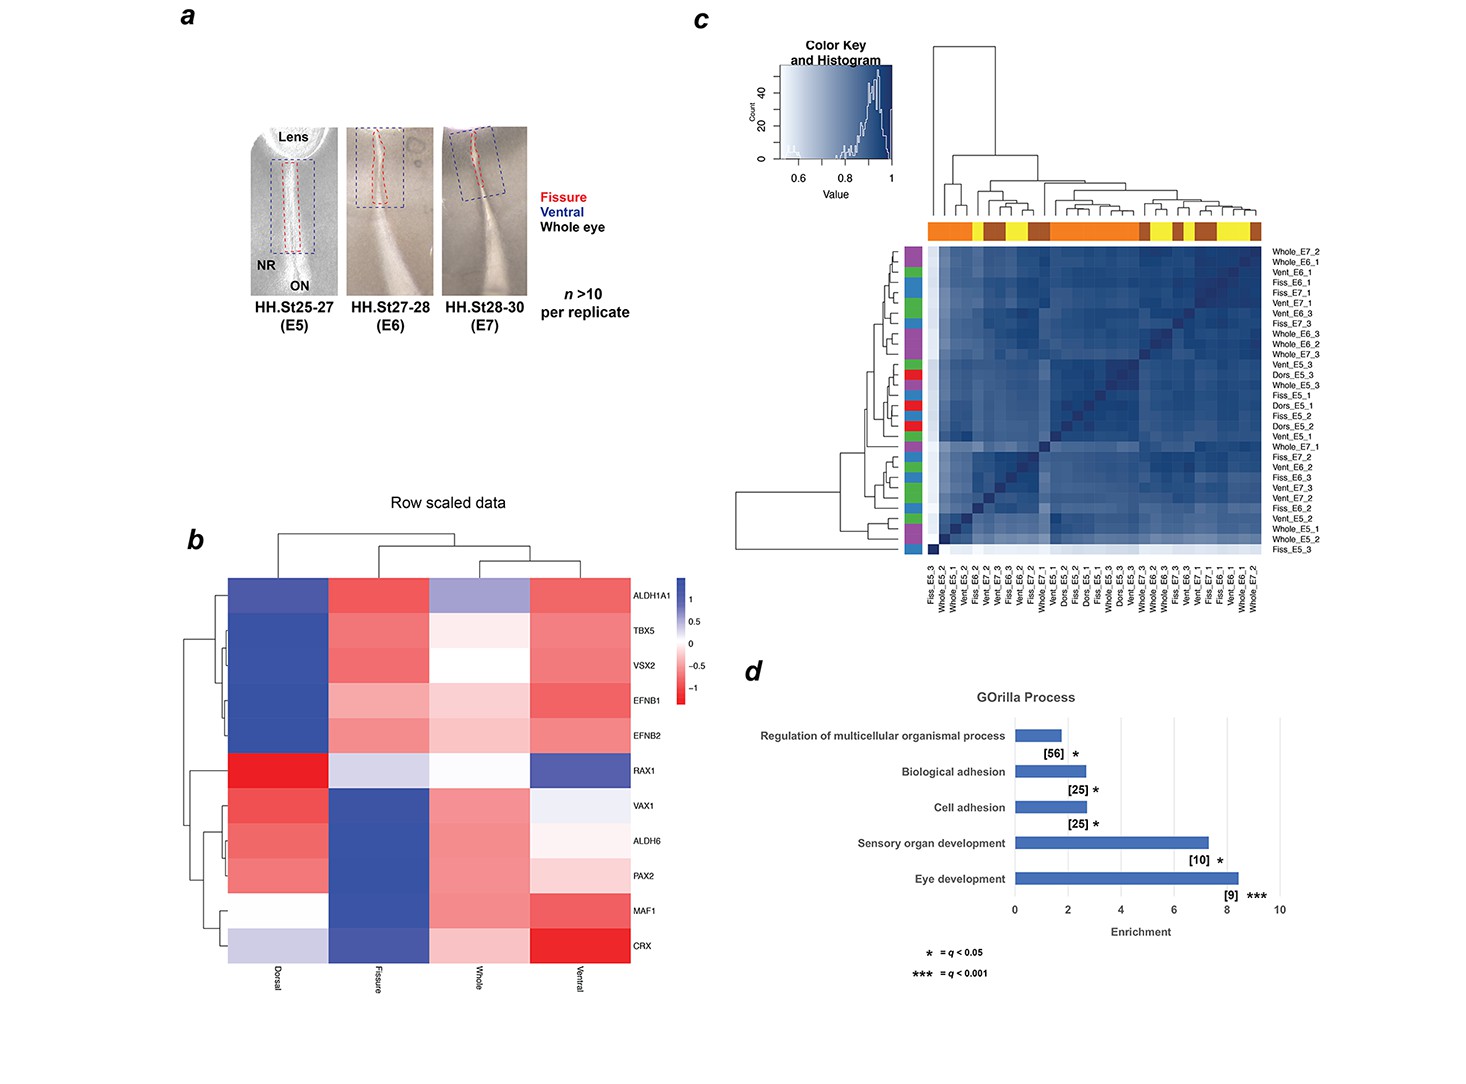
(a) Schema for segmental microdissection of OFM samples prior to RNA extraction and processing for RNAseq. At least 10 fissures from independent chick embryos were used per sample, per stage. Care was taken to exclude capture of the proximal/pecten OFM region. Lenses were included for whole eye samples, for which four whole-eyes from independent embryos were used. (b) Heat map for E5 (HH.St25-27) RNAseq data shows strict domain specificity for genes with previously known spatial restriction (Cho and Cepko, 2006). (c) Heatmap showing a correlation coefficient of >0.9 (Spearman’s rank correlation) for genome-wide expression levels for all RNAseq samples. Note that sample Fiss_E5_3 is an outlier. (d) GOrilla Gene Ontology analysis for upregulated DEGs at all-stages using ‘Processes’ revealed significant enrichment for five processes. Number of genes in intersection is given in brackets, FDR q values are given for each ontology. GO terms and descriptions: GO:0007423, sensory organ development; GO:0001654, eye development; GO:0007155, cell adhesion; GO:0022610, biological adhesion, GO:0051239, regulation of multicellular organismal process.
Figure 4 with 4 supplements
A conserved fusion-specific requirement for NTN1 in OFC and palate development.
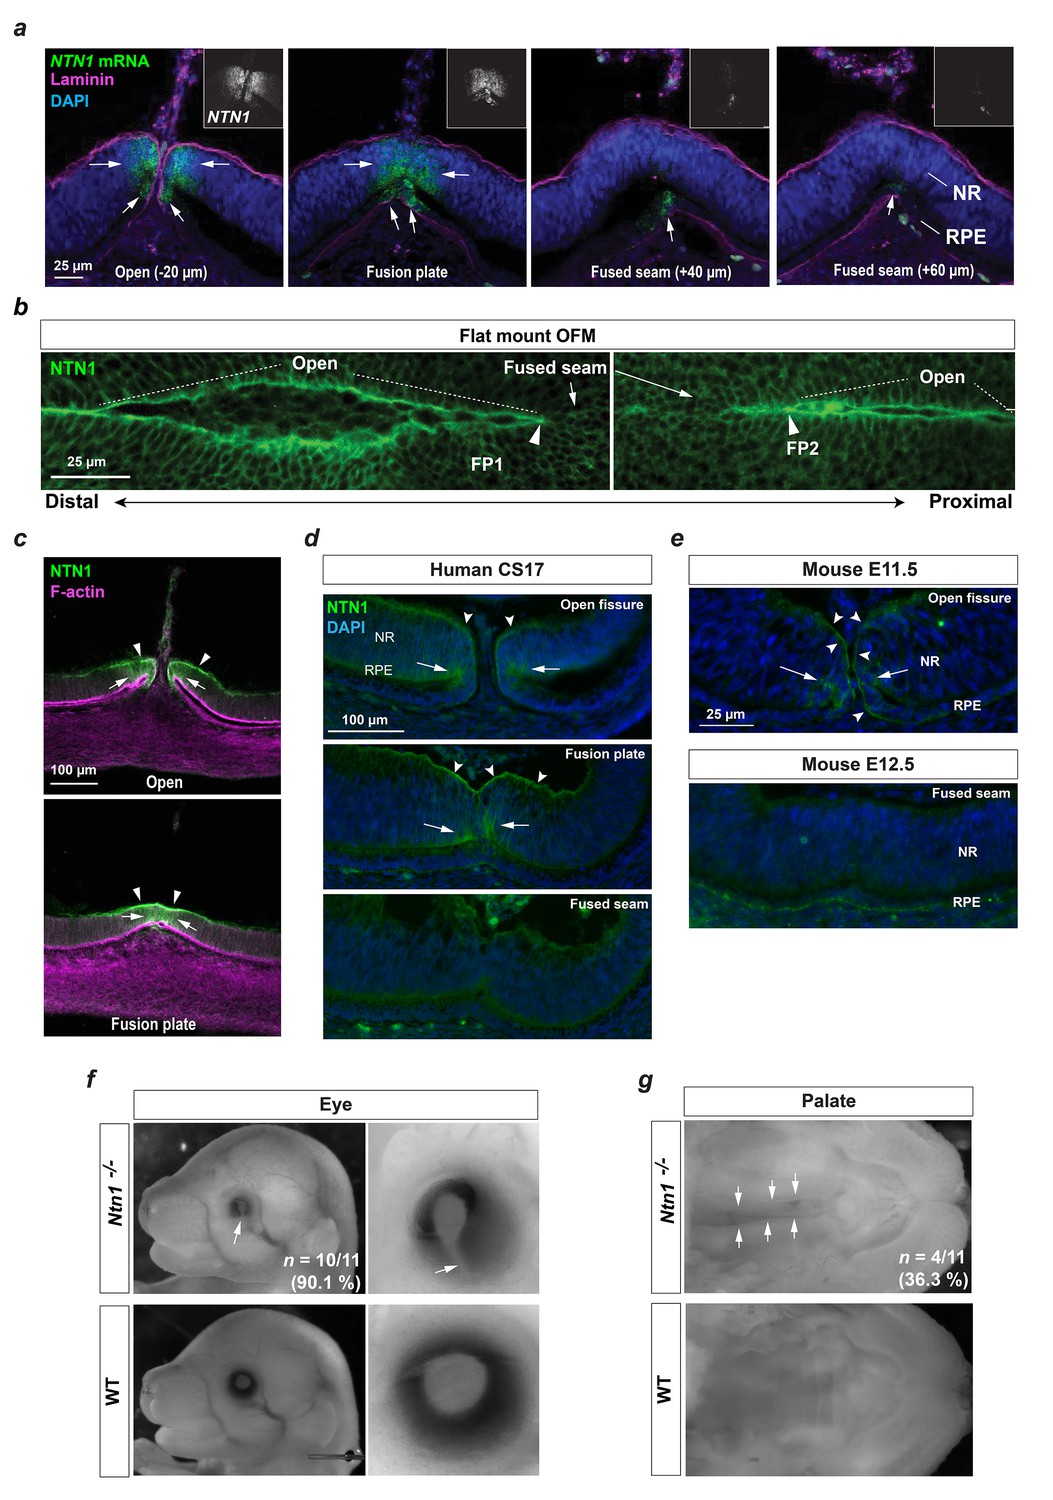
(a) RNAscope analysis of NTN1 mRNA (green, and grey in insets) in HH.St29 OFMs revealed fissure-specific NTN1 expression (arrows) with strongest signal observed at open regions and in the fusion plate, and reduced expression in the adjacently fused seam. NTN1 expression was localised to cells of both the NR and RPE. Fusion progression was indicated using anti-laminin co-immunofluorescence (magenta). Images shown are maximum intensity projections of confocal Z-stacks. (b) Single-plane confocal images of immunofluorescence analysis for NTN1 on flat-mounted distal (FP1) and proximal (FP2) OFM revealed enriched protein localisation at the edges of the open fissure margins and reduced in the fused seam. (c) Immunostaining on cryosectioned OFM at the open and fusion plate at HH.St29 revealed NTN1 was specifically localised to the basal lamina (arrowheads) and to the epithelia of the neural retina and RPE (arrows) at the OFM. (d) Immunostaining on CS17 human foetal eye sections revealed human Netrin-1 (hNTN1) was localised to NR epithelia (arrows) and at the overlying basal lamina (dented arrowheads) at the fissure margins. hNTN1 was absent from the fused seam epithelia. (e) Immunostaining for mouse Netrin-1 (mNtn1) in during active fusion stages (E11.5) showed mNtn1 was localised at the open fissure margins (arrow) in the basal lamina and to cells at the NR-RPE junction. mNtn1 was absent from this region in fused OFM seam at E12.5. (f) Ntn1-/- mice exhibited highly penetrant (~90%) bilateral coloboma (arrows; n = 10/11 homozygous E15.5-E16.5 animals analysed). (g) Cleft secondary palate (arrows) was observed in ~36% of Ntn1-/- embryos at E15.5-E16.5 (4/11 homozygous animals).
Figure 4—figure supplement 1
Developmental NTN1 expression profiling in chick eye and OF.
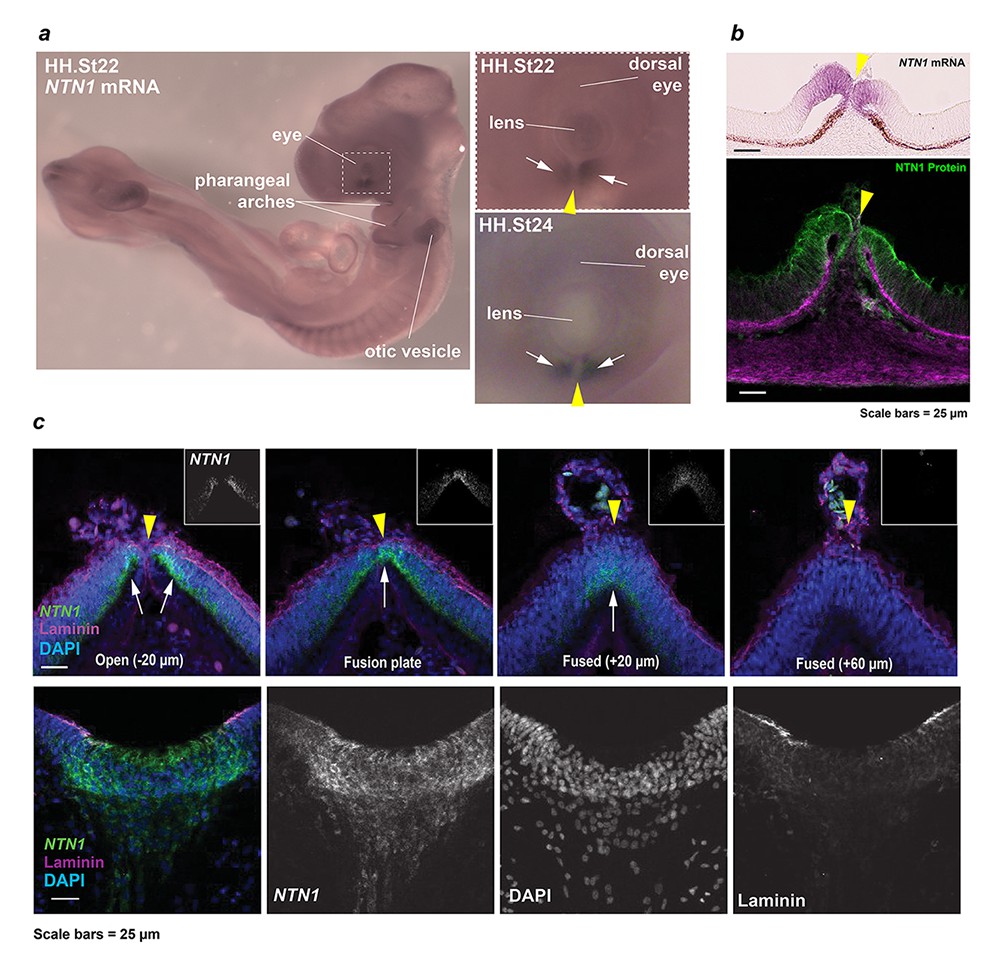
(a) Whole-mount in situ hybridisation revealed NTN1 expression in the ventral eye, developing pharyngeal arches, and otic vesicles at HH.St22. Enlarged panels showed regionally-restricted NTN1 expression in the developing fissure margins (arrows) at HH.St22 (Top) and HH.St24 (Bottom). (b) Section colourimetric in situ hybridisation and NTN1 immunofluorescence analyses at HH.St28 showed NTN1 expression was specific to the edges of the early medial OFM immediately prior to fusion. (c) (Top panels) RNAscope analyses at FP1/distal iris-region OFM at HH.St29 showed NTN1 mRNA specificity (arrows) in the fissure margin and a graded reduction in the fused seam. (Bottom) Positive control analyses for RNAscope showed strong NTN1 mRNA signals in the basal floorplate of the neural tube at HH.St29. The OFM midline is shown by a yellow arrowhead in all panels.
Figure 4—figure supplement 2
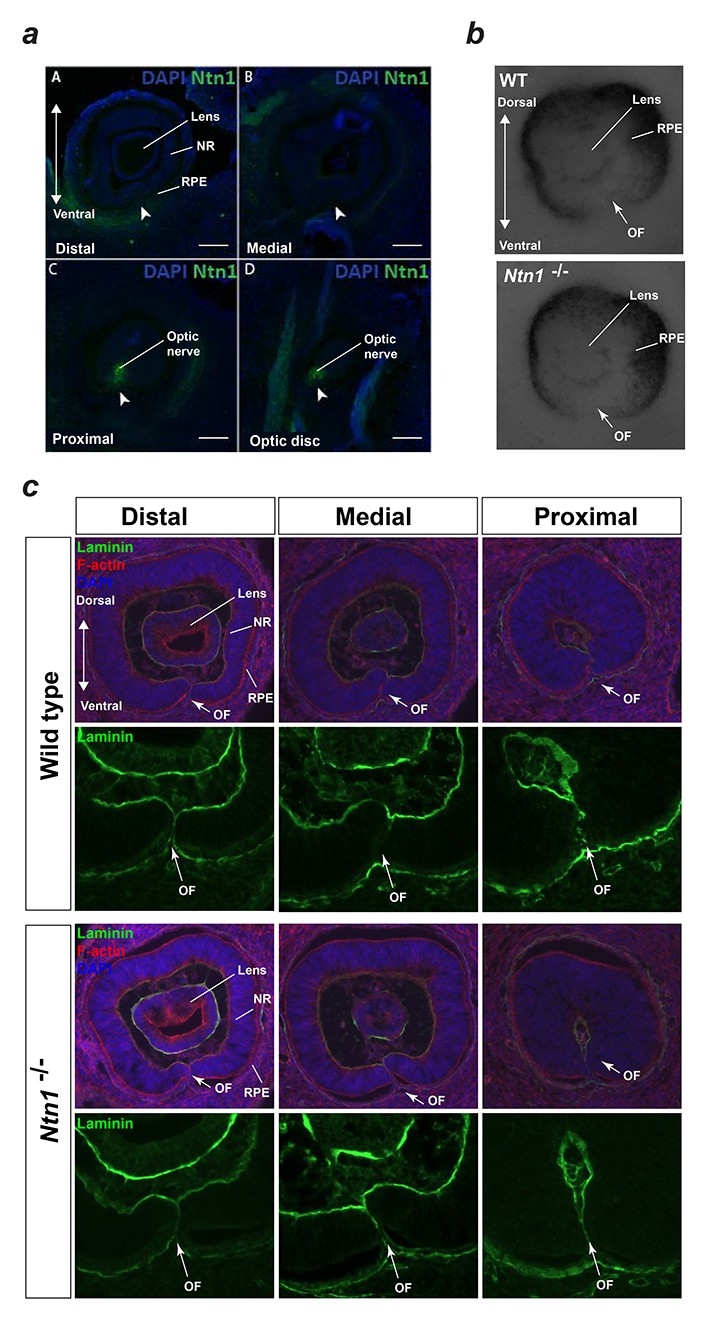
Analyses of mouse Ntn1 knockout fissures during fusion.
(a) Immunofluorescence staining for mouse Ntn1 in wild-type E12.5 eyes post-fusion showed absence of Ntn1 signal (arrowheads) in the distal (A) and medially fused OFM (B), but presence of Ntn1 (arrowheads) in the proximal (C) and optic disc (D) regions. (b) E11.5 Ntn1-/- embryos did not show any obvious size or gross structural differences during active fusion stages (n = 4 Ntn1-/- embryos analysed, total = 8 eyes). Ventral tissue at the optic fissures (OF, arrows) appeared to be normally apposed. (c) Sections from Wild-type and Ntn1-/- optic fissures immmunostained with anti-laminin antibody (green) and counterstained with DAPI and Phalloidin (red) showed mutant OFMs aligned correctly at E11.5 with no clear structural differences observed between the genotypes. Representative sections from distal, medial, and proximal OFMs are shown. OF, optic fissure; NR, neural retina; RPE, retinal pigmented epithelium.
Figure 4—figure supplement 3

Gross ocular phenotype analyses of ntn1-deficient zebrafish.
(a) Gene-editing strategy using a single sgRNA targeting the first exon of zebrafish ntn1a. CRISPR/Cas9 was used to generate heterozygous (ntn1+/-; G0) founders. These were crossed to generate homozygous G1 embryos (ntn1-/-). (b) Panels showing the coloboma microphthalmia and coloboma (arrow) phenotypes in gene-edited ntn1-/- embryos compared to wild-type. (c) Sanger sequencing confirmed the homozygous gene-edited ntn1a allele in 100% of phenotypic G1 embryos. (d) In silico translation of encoded mutant allele aligned to wild-type (first 153 amino acids shown of 603 aa ntn1a protein are shown). The gene edited mutation encodes a frame-shift in the first exon resulting in a truncated ntn1a of 105 amino acids (p.Cys90Ala.fs15). (e) Morpholino experiments produced bilateral coloboma in 100% of embryos injected with ntn1a translation-blocking MO, with no ocular phenotypes observed in control MO injected embryos. The optic fissures are indicated by arrows. (f) Tables with penetrance of colobomas in gene-edited embryos and MO embryos compared to controls.
Figure 4—figure supplement 4
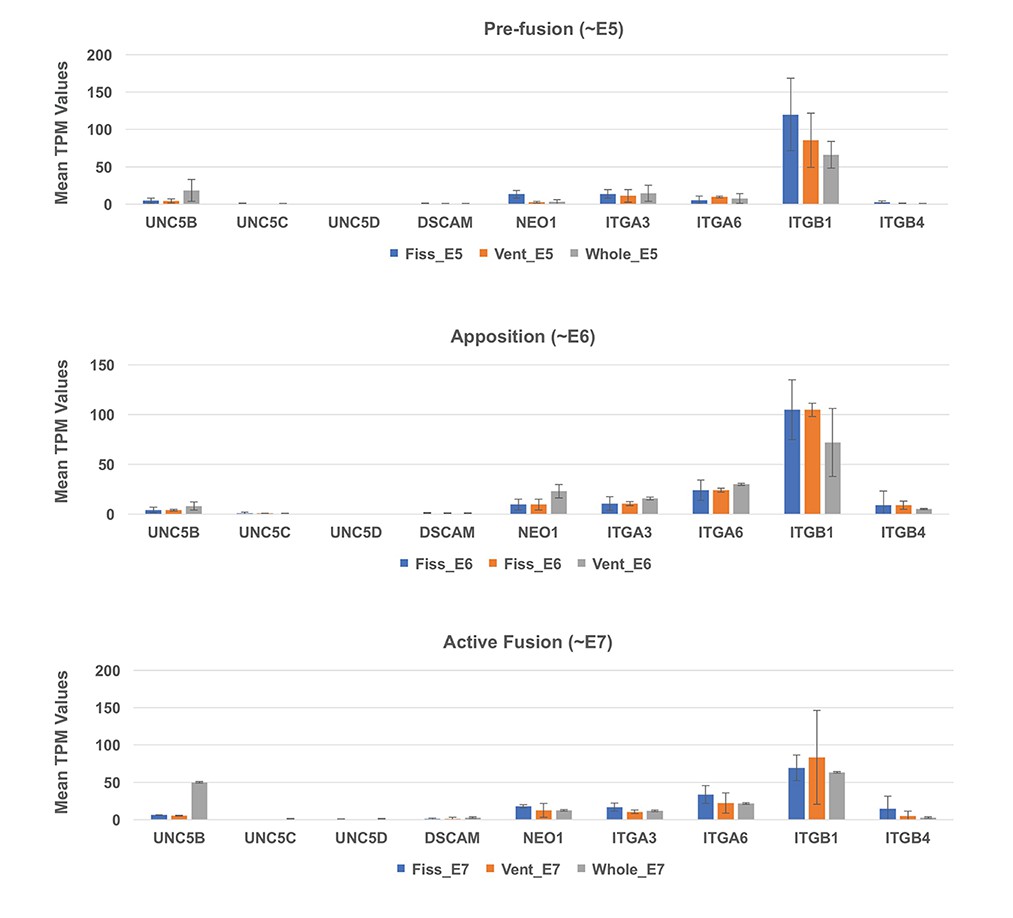
Expression profiling for known interactors of NTN1.
Analysis of TPM values from RNAseq data at all three stages did not detect significant levels of expression for canonical NTN1 receptors in the ventral eye or fissures during OFC stages.
ITGB1 showed the highest expression values throughout all stages, but was not specific to the fissure margin or ventral eye tissues.
Tables
Table 1
Qualitative analysis of fusion plates observed per developmental stage by cryosections and H and E.
https://doi.org/10.7554/eLife.43877.006| Fusion plates identified | |||
|---|---|---|---|
| HH stage | 1x FP only | Both FP1 and FP2 | N per stage |
| 25 | 0 | 0 | 4 |
| 26 | 0 | 0 | 4 |
| 27 | 1 | 0 | 3 |
| 28 | 3 | 1 | 4 |
| 29 | 1 | 4 | 5 |
| 30 | 0 | 4 | 4 |
| 31 | 0 | 3 | 3 |
| 32 | 0 | 5 | 5 |
| 33 | 1 | 2 | 3 |
| 34 | 3 | 0 | 3 |
Table 2
Quantitative measurements of key features during OFC progression using flat mounted WT and mem-GFP fissures.
Total OFM length includes optic nerve and pecten. * Fused fissures observed were too small to measure accurately (<0.1 mm).
| HH stage | Mean total OFM length (mm) | ± SD | Mean length of fused seam (mm) | ± SD |
|---|---|---|---|---|
| 27 | 2.20 | 0.15 | - | - |
| 28 | 2.92 | 0.33 | * | * |
| 29 | 3.58 | 0.28 | 0.56 | 0.12 |
| 30 | 4.38 | 0.17 | 0.93 | 0.09 |
| 31 | 4.50 | 0.25 | 1.09 | 0.13 |
| 32 | 4.77 | 0.16 | 1.15 | 0.10 |
| 33 | 5.31 | 0.23 | 1.39 | 0.10 |
| 34 | 5.67 | 0.16 | 1.70 | 0.07 |
Table 3
Fissure-Specific Differentially expressed genes (q < 0.05; LogFC:≥1.5 and ≤−1) at all stages analysed.
Genes with increased expression are depicted in grey.
| ENSEMBL ID | HGNC ID | LogFC: Fissure vs whole (HH.St25-27)~E5 | FDR adjusted P value | LogFC: Fissure vs whole (HH.St27-28)~E6 | FDR adjusted P value | LogFC: Fissure vs whole (HH.St28-30)~E7 | FDR adjusted P value |
|---|---|---|---|---|---|---|---|
| ENSGALG00000023626 | NTN1 | 3.98 | 5.11E-05 | 4.34 | 8.16E-05 | 5.41 | 3.06E-07 |
| ENSGALG00000005689 | PAX2 | 3.48 | 9.36E-06 | 3.41 | 2.11E-05 | 3.18 | 4.14E-06 |
| ENSGALG00000033365 | ALDH6 | 2.97 | 1.00E-05 | 3.94 | 1.75E-04 | 3.00 | 4.91E-05 |
| ENSGALG00000016875 | novel gene | 2.21 | 4.57E-05 | 3.56 | 8.72E-07 | 3.55 | 2.62E-08 |
| ENSGALG00000009415 | SMOC1 | 3.49 | 1.46E-05 | 2.36 | 3.92E-03 | 2.60 | 8.93E-05 |
| ENSGALG00000025822 | CYP1B1 | 2.95 | 1.11E-05 | 2.03 | 1.34E-02 | 3.02 | 1.55E-05 |
| ENSGALG00000021589 | RTN4RL1 | 2.41 | 5.79E-03 | 2.43 | 8.00E-03 | 2.69 | 4.22E-04 |
| ENSGALG00000040557 | TFEC | 1.93 | 8.70E-03 | 2.35 | 5.01E-03 | 2.90 | 9.86E-04 |
| ENSGALG00000009261 | VAX1 | 1.99 | 6.95E-04 | 1.96 | 3.15E-03 | 2.49 | 1.55E-05 |
| ENSGALG00000041101 | GALNT6 | 1.78 | 3.45E-04 | 2.07 | 6.97E-04 | 2.55 | 6.85E-06 |
| ENSGALG00000008072 | CHRDL1 | 1.79 | 3.85E-05 | 1.86 | 1.03E-03 | 1.94 | 2.49E-05 |
| ENSGALG00000015284 | RGMB | 1.89 | 1.37E-02 | 1.73 | 2.43E-02 | 1.76 | 7.63E-03 |
| ENSGALG00000011413 | novel gene | −1.53 | 1.13E-02 | −1.34 | 3.34E-02 | −1.69 | 1.60E-02 |
| ENSGALG00000004270 | ALDH1A2 | −1.20 | 4.06E-02 | −1.80 | 9.46E-03 | −1.76 | 2.74E-03 |
| ENSGALG00000010801 | TMEM61 | −2.07 | 8.63E-03 | −1.49 | 3.77E-02 | −1.93 | 5.90E-03 |
| ENSGALG00000003842 | GHRH | −1.33 | 4.58E-02 | −2.60 | 1.48E-02 | −2.62 | 5.28E-03 |
| ENSGALG00000012712 | RBM24 | −2.57 | 9.39E-04 | −2.00 | 1.69E-02 | −2.35 | 2.80E-03 |
| ENSGALG00000012644 | novel gene | −1.85 | 4.91E-03 | −2.58 | 1.38E-02 | −3.18 | 9.33E-04 |
| ENSGALG00000003324 | PRRX1 | −1.52 | 4.65E-02 | −2.77 | 2.21E-02 | −3.42 | 1.32E-03 |
| ENSGALG00000007706 | FGF8 | −2.20 | 2.94E-03 | −3.10 | 8.72E-04 | −2.64 | 9.86E-04 |
| ENSGALG00000010929 | SPARCL1 | −3.16 | 3.03E-03 | −1.77 | 4.19E-02 | −3.17 | 6.48E-04 |
| ENSGALG00000034585 | CP49 | −3.65 | 6.32E-06 | −1.93 | 1.55E-02 | −2.59 | 3.60E-04 |
| ENSGALG00000038848 | MSX2 | −2.19 | 4.15E-03 | −3.35 | 1.15E-02 | −2.92 | 5.01E-03 |
| ENSGALG00000004279 | GRIFIN | −3.97 | 7.94E-04 | −2.71 | 2.55E-02 | −1.92 | 4.89E-02 |
| ENSGALG00000004569 | UNC5B | −1.41 | 4.81E-03 | −4.14 | 4.56E-08 | −3.21 | 2.62E-08 |
| ENSGALG00000019802 | novel gene | −2.24 | 1.56E-02 | −3.43 | 4.36E-02 | −3.59 | 9.52E-03 |
| ENSGALG00000043175 | novel gene | −3.59 | 7.36E-03 | −2.99 | 3.27E-02 | −2.91 | 2.59E-02 |
| ENSGALG00000005613 | novel gene | −2.96 | 6.50E-04 | −2.21 | 1.99E-02 | −4.40 | 2.06E-04 |
| ENSGALG00000015015 | CYTL1 | −2.43 | 3.39E-02 | −3.13 | 4.74E-02 | −5.14 | 5.01E-03 |
| ENSGALG00000004035 | CRYBA1 | −5.04 | 1.21E-04 | −2.56 | 1.95E-02 | −3.33 | 2.00E-03 |
| ENSGALG00000006189 | CRYGN | −4.66 | 6.22E-04 | −4.25 | 1.82E-02 | −4.97 | 9.33E-04 |
| ENSGALG00000012470 | LYPD6 | −2.49 | 1.20E-02 | −4.64 | 6.97E-04 | −7.13 | 5.09E-06 |
| ENSGALG00000008253 | TBX5 | −3.50 | 3.48E-04 | −6.73 | 5.98E-04 | −4.39 | 6.02E-05 |
| ENSGALG00000015147 | ALDH1A1 | −5.06 | 1.46E-05 | −4.96 | 1.22E-04 | −4.79 | 1.55E-05 |
| ENSGALG00000042119 | MIP | −4.47 | 2.10E-03 | −5.43 | 3.97E-02 | −6.15 | 3.54E-03 |
| ENSGALG00000005634 | CRYBA4 | −5.47 | 2.65E-04 | −4.94 | 1.61E-02 | −7.17 | 6.56E-04 |
| ENSGALG00000005630 | CRYBB1 | −5.36 | 1.72E-04 | −6.97 | 4.56E-03 | −6.24 | 1.37E-04 |
| ENSGALG00000008735 | BFSP1 | −6.48 | 5.53E-04 | −6.23 | 1.76E-02 | −8.63 | 1.97E-03 |
Key resources table
| Reagent type (species) or resource | Designation | Source or reference | Identifiers | Additional information |
|---|---|---|---|---|
| Genetic reagent (M. musculus) | Ntn1-/- | PMID 26395479 | MGI:5888900 | Lisa Goodrich (Harvard Medical School, Boston MA). |
| Biological sample (G. gallus) | memGFP | PMID 25812521 | Rozbicki et al., 2015 | Maintained at The Greenwood Building, Roslin Institute, UK. |
| Biological sample (G. gallus) | Chicken eye and OFM dissections | This paper | Hy-Line Brown | Maintained at The Greenwood Building, Roslin Institute, UK. |
| Antibody | NTN1 (Mouse monoclonal) | R and D Systems | MAB128 | one in 100 dilution for whole mount IF |
| Antibody | NTN1 (Rabbit polyclonal) | Abcam | ab126729 | one in 300 dilution for human and mouse IF; 1 in 500 dilution for chick cryosection IF |
| Antibody | Laminin-B1 (Mouse monoclonal) | DSHB | 3H11 | one in 20 dilution for all IF |
| Antibody | NF145 (Rabbit polyclonal) | Merk | AB1987 | one in 100 dilution for all IF |
| Antibody | Phospho-Histone H3A (Rabbit monoclonal) | Cell Signalling Technologies | #3377 | one in 200 for cryosections, 1 in 1000 for flat-mount |
| Antibody | Activated Caspase-3 (Rabbit polyclonal) | BD Pharminagen | #559565 | one in 400 dilution for all IF |
| Commercial assay or kit | Alexa Fluor Phalloidin (488 nm) | Thermo-Fisher | #A12379 | one in 40 dilution for all IF |
| Software, algorithm | Kallisto | PMID 27043002 | NA | NA |
| Software, algorithm | Limma | PMID 25605792 | NA | NA |
Additional files
-
Transparent reporting form
- https://doi.org/10.7554/eLife.43877.021
Download links
A two-part list of links to download the article, or parts of the article, in various formats.
Downloads (link to download the article as PDF)
Open citations (links to open the citations from this article in various online reference manager services)
Cite this article (links to download the citations from this article in formats compatible with various reference manager tools)
Detailed analysis of chick optic fissure closure reveals Netrin-1 as an essential mediator of epithelial fusion
eLife 8:e43877.
https://doi.org/10.7554/eLife.43877


