Mechanical instability and interfacial energy drive biofilm morphogenesis
- Princeton University, United States
- The Howard Hughes Medical Institute, United States
Figures
Figure 1 with 2 supplements
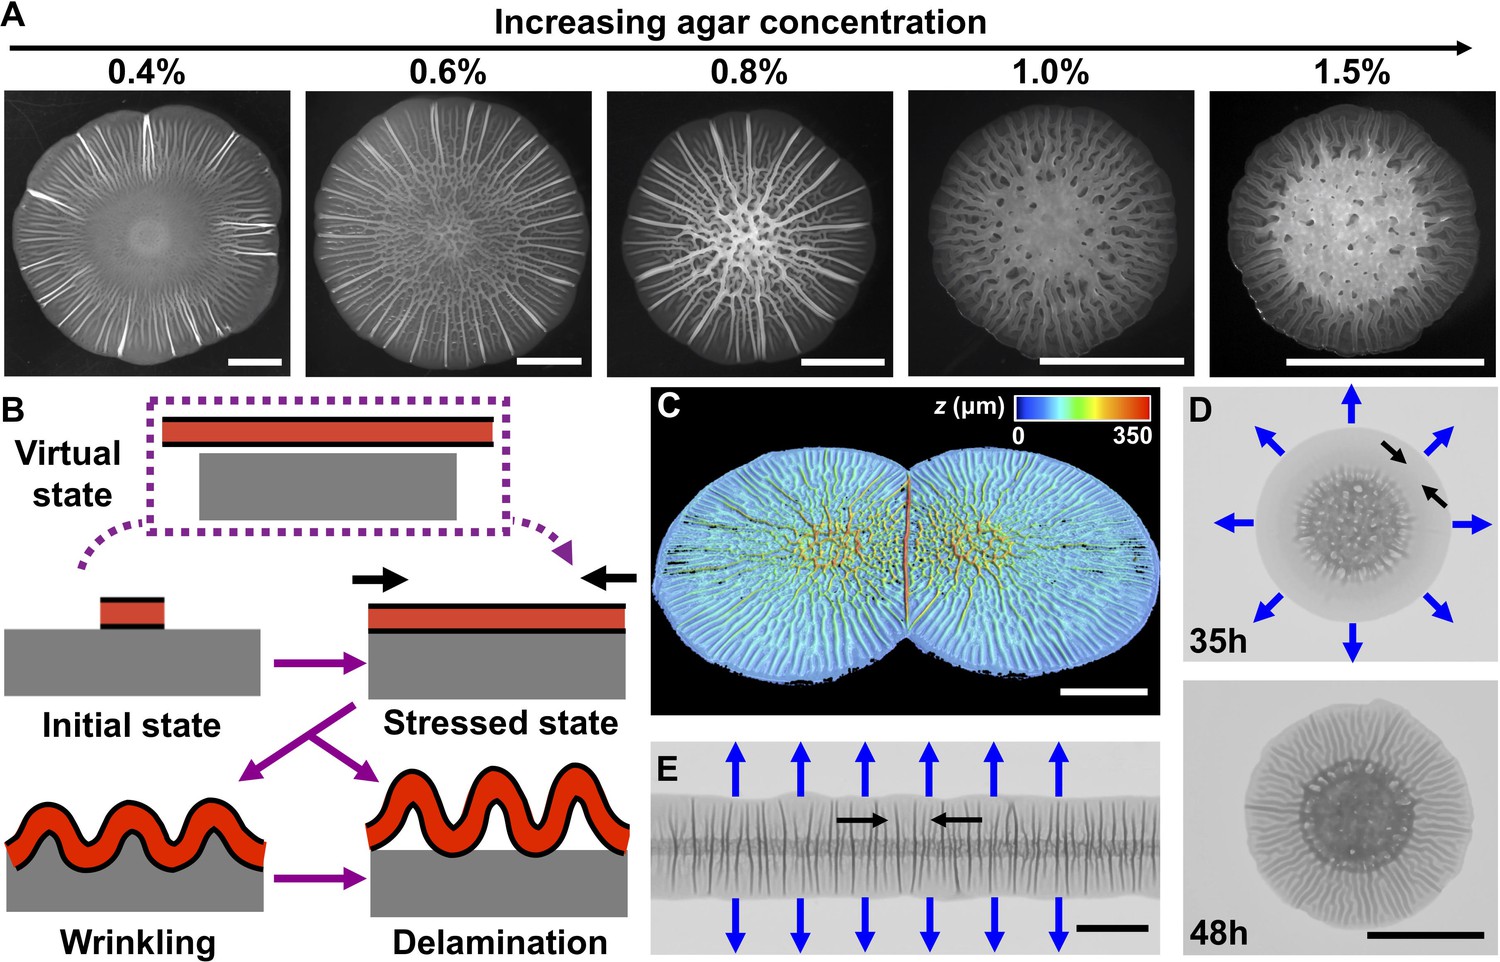
Mechanical instability drives V. cholerae biofilm morphogenesis.
(A) Bright-field images of biofilms grown for 2 days on the designated percentages of agar. (B) Schematic of the wrinkling and delamination processes that occur during biofilm expansion. Red with a black outline denotes the biofilm. Gray denotes the substrate, agar in this case. (C) Three-dimensional (3D) profile of two colliding biofilms, initially inoculated 9 mm apart, grown on a 0.6% agar plate for 36 hr. (D) Transmission image of a V. cholerae biofilm grown for 35 hr (top) and 48 hr (bottom) on a 1.0% agar plate. (E) Transmission image of a V. cholerae biofilm inoculated as a line and grown for 30 hr on a 0.5% agar plate. In panels (D) and (E), blue arrows denote the expansion directions, and black arrows denote the tangential directions along which compressive stress accumulates. All scale bars are 5 mm.
Figure 1—figure supplement 1
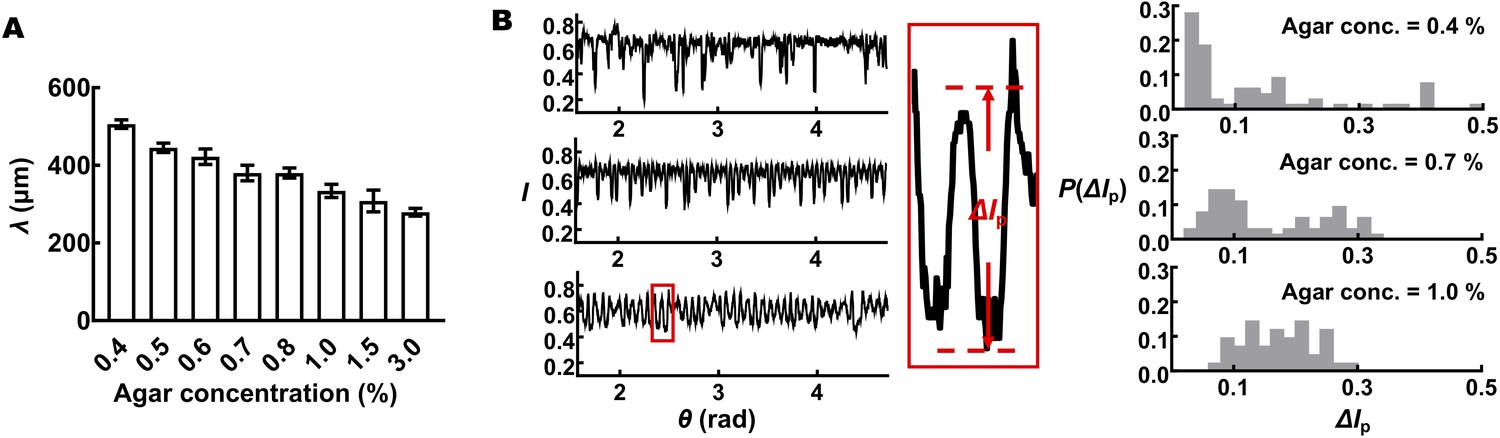
Quantification of V. cholerae biofilm surface morphologies.
(A) The characteristic wavelength of the radial morphological features, λ, decreases with increasing agar concentration. (B) Transmitted light intensity profiles measured close to the outer edges of biofilms, I, show that the amplitudes of the radial features become more regular with increasing agar concentration. Left: typical profiles of transmitted light intensity, I, along the rims of 2-day-old biofilms for the designated agar concentrations. Middle: a closeup view of the extracted intensity profile from the bottom trace. The prominence of each peak, ΔIp, is used as a proxy for the height/amplitude of the corresponding radial feature. Right: probability distribution of ΔIp for the designated agar concentrations.
-
Figure 1—figure supplement 1—source data 1
Quantitation of V. cholerae biofilm surface morphologies.
- https://doi.org/10.7554/eLife.43920.005
Figure 1—figure supplement 2
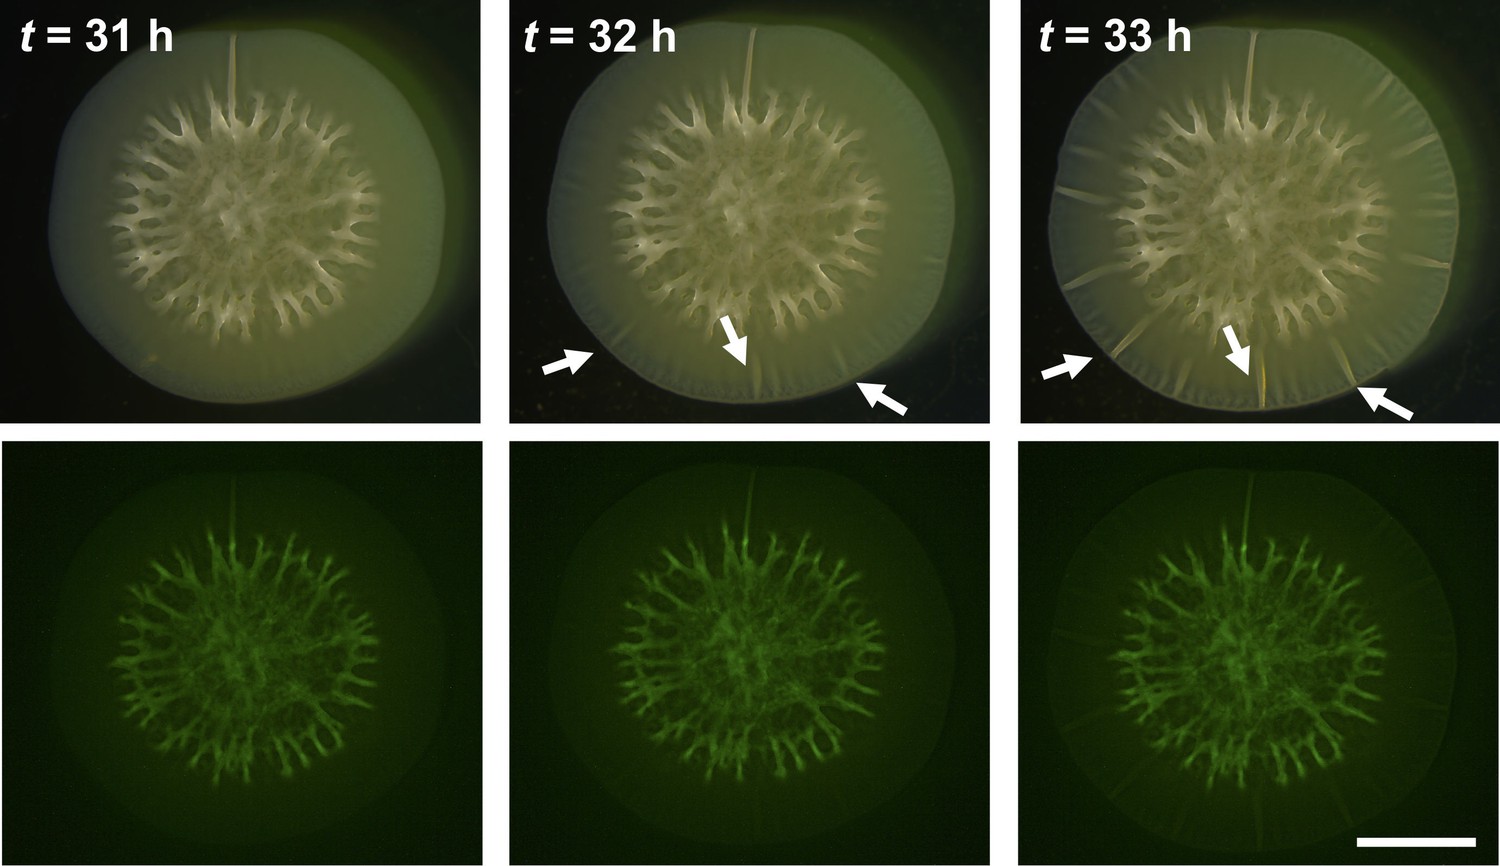
Wrinkling and delamination transitions are rapid.
A biofilm grown on a 0.5% agar substrate was imaged at the designated times. Top: bright-field images. Bottom: fluorescent signal from the SytoX Green stain marking dead cells. White arrows indicate emerging morphological features. The wrinkling and delamination instabilities occur within a 2-hr window. No localized cell death was observed to precede the formation of wrinkles or blisters. Scale bar: 5 mm.
Figure 2 with 4 supplements
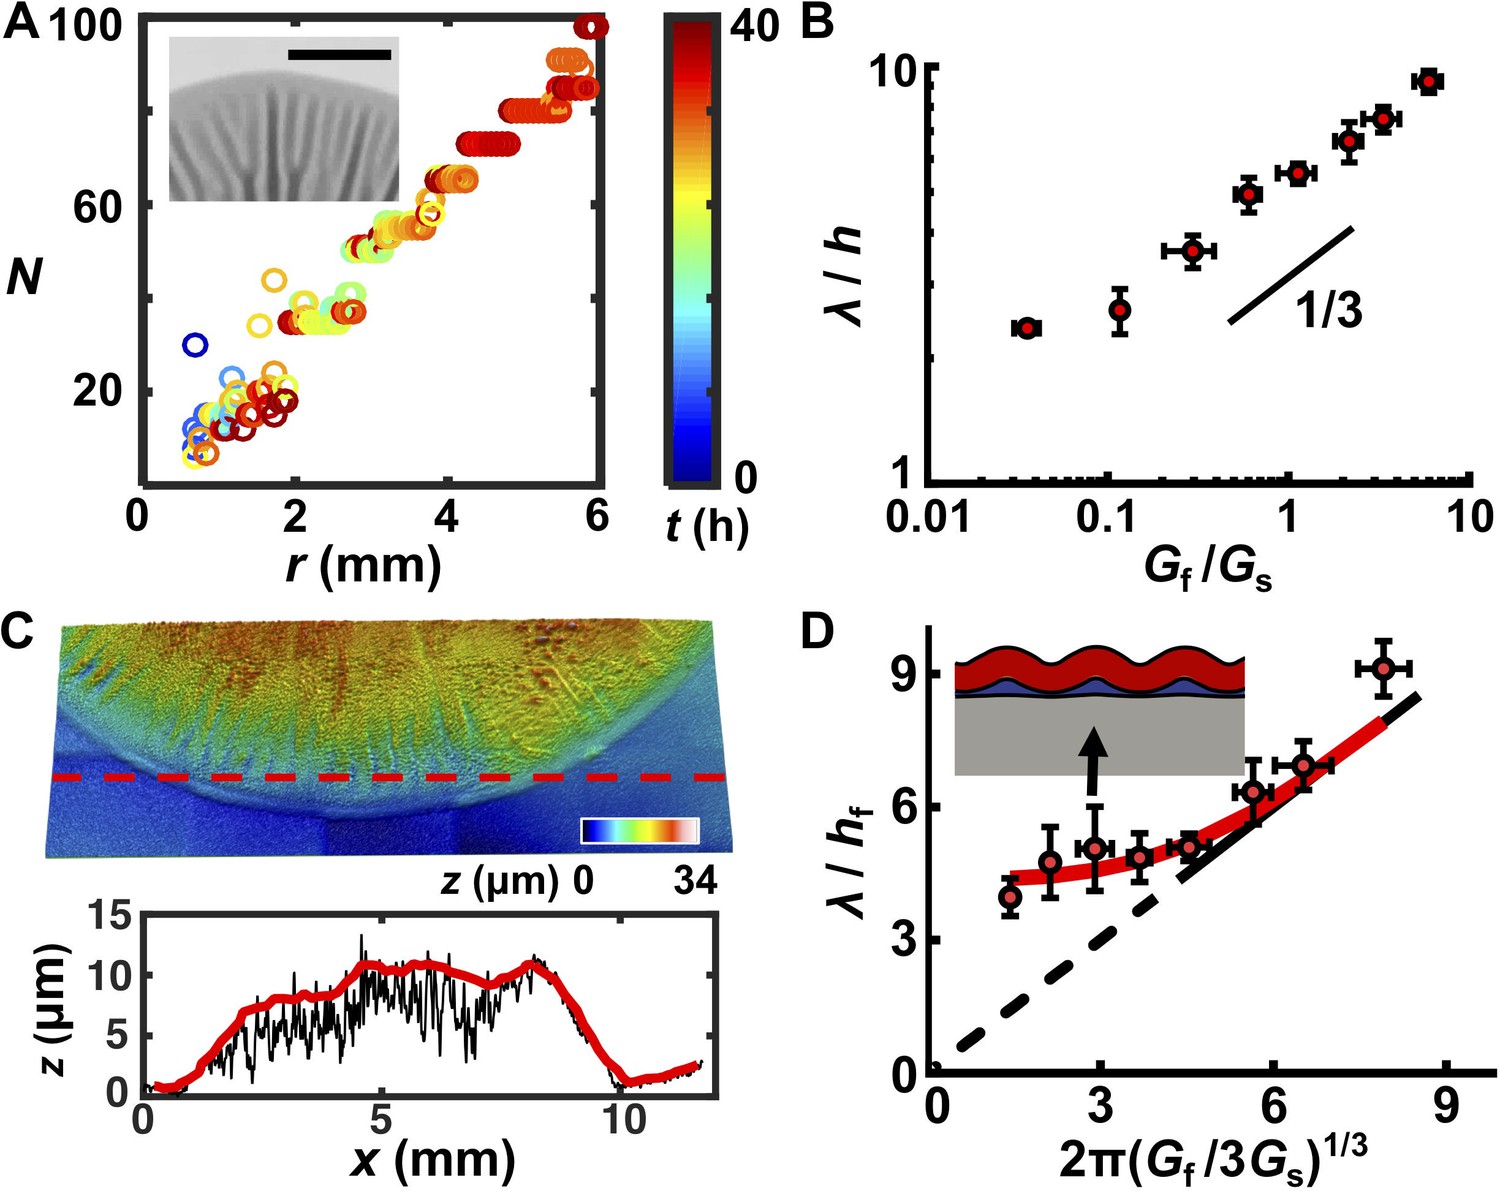
A trilayer mechanical model predicts the intrinsic wavelength of the biofilm pattern.
(A) Number of wrinkles or blisters N versus the radial coordinate r during biofilm growth. The color scale indicates growth time t. Inset: closeup transmission image of a growing biofilm showing that wrinkles or blisters bifurcate to maintain a constant λ. Agar concentration: 0.7%, scale bar: 2 mm. (B) The scaling relationship between λ (normalized by the biofilm thickness h) and the shear modulus ratio Gf/Gs between the biofilm and the agar substrate. The black line indicates a slope of 1/3 on a log-log scale. (C) Characterization of the residual layer. Top: 3D topography of the residual layer after peeling a biofilm off of an agar substrate. Bottom: height profile extracted along the contour indicated by the dashed red line in the top panel. Both the raw (black) and smoothed (red) data, from which the residual layer thickness hr was calculated, are shown. Agar concentration: 0.5%. (D) Replot of the data in panel (B) taking into account the residual layer. The corrected biofilm thickness hf was obtained by subtracting the residual thickness hr from the total thickness h. The solid portion of the black line corresponds to the prediction from the bilayer model, which applies only to x coordinates greater than 4.75 (Wang and Zhao, 2015). The dashed portion of the black line is an extrapolation to zero from the bilayer prediction provided as a guide to the eye. The red line is the fitted data from the trilayer model in which the stiffness contrast between the residual and biofilm layers Gr/Gf is treated as a fitting parameter while holding hr/hf = 0.3. Inset: finite-element simulation of the trilayer model undergoing wrinkling instability. Red denotes the biofilm. Gray denotes the substrate. Blue denotes the residual layer. Simulation parameters were chosen to mimic the growth condition on 1.0% agar (black arrow). Data are represented as mean ± std with n = 3.
-
Figure 2—source data 1
Experimental measuremants of biofilm residual layer thicknesses and wavelengths and predictions from trilayer wrinkling theory.
- https://doi.org/10.7554/eLife.43920.010
Figure 2—figure supplement 1
Analysis of intrinsic wavelengths in the morphologies of biofilms.
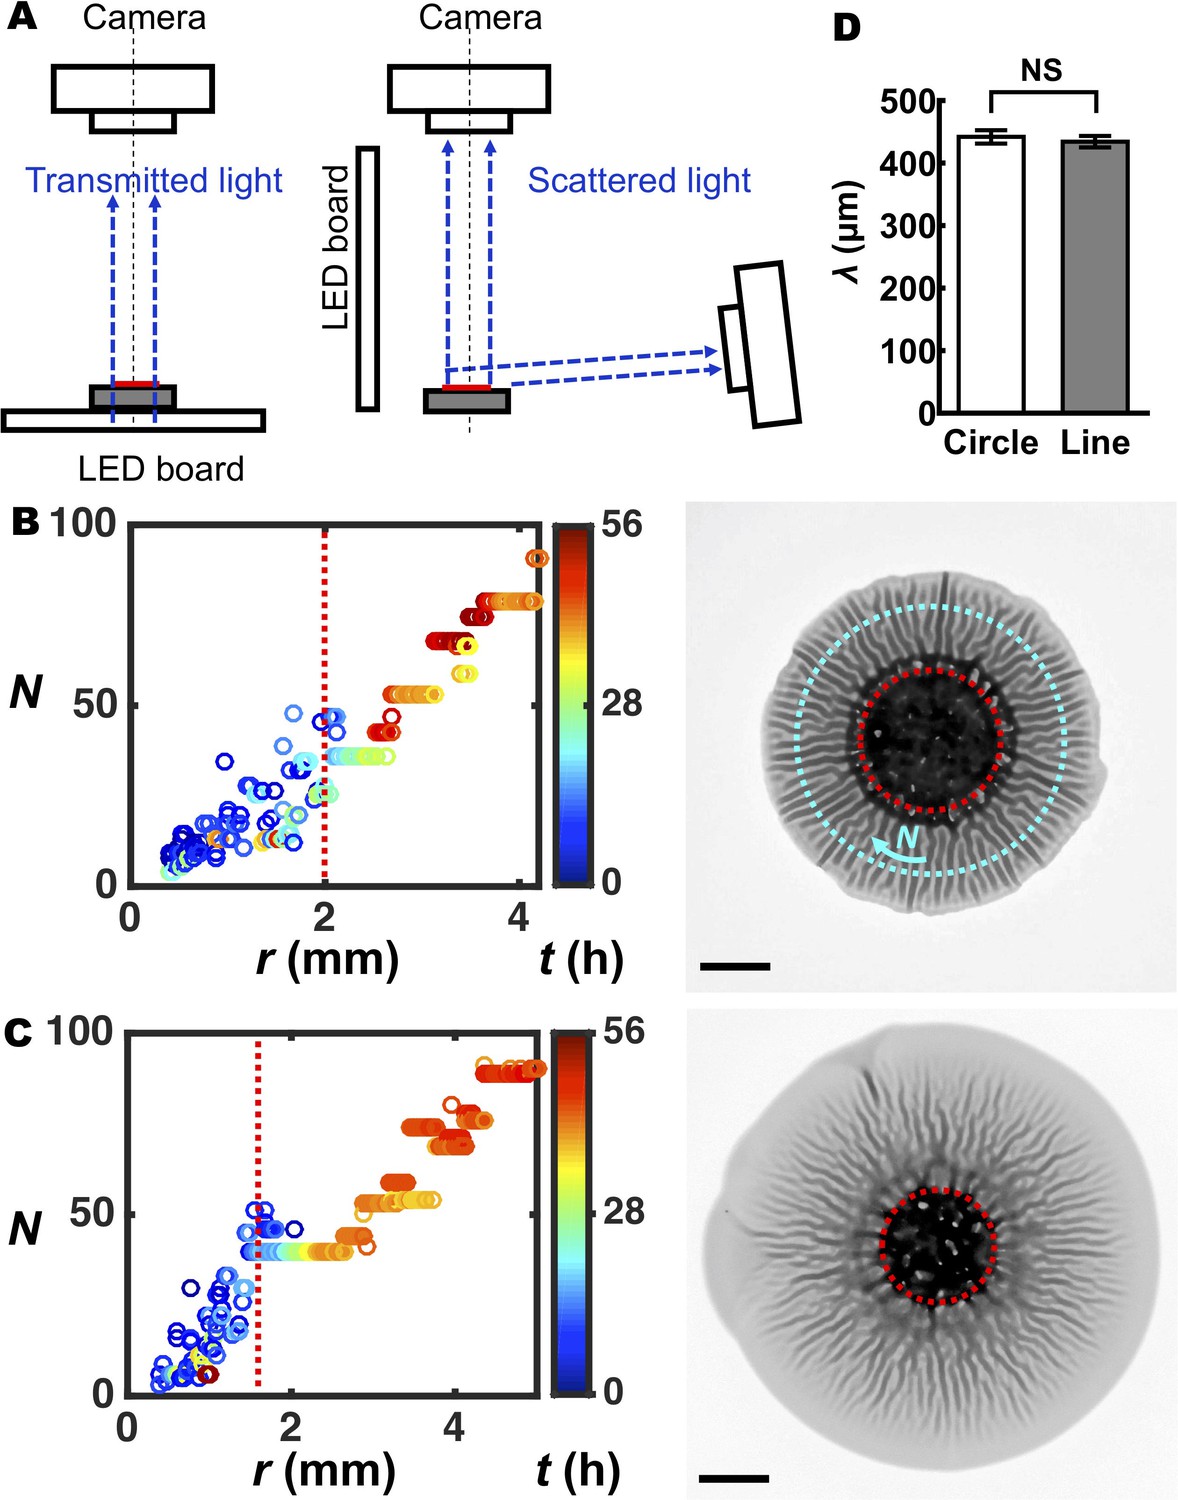
(A) Experimental setups for imaging biofilm morphogenic development. Left: schematic of the imaging system used for the analysis of biofilm patterns and biofilm expansion. An agar plate with cells inoculated onto it was placed on a white-light LED board, under a camera that detects transmitted light. Right: schematic of the imaging system used for simultaneous acquisition of top and side views for analysis of biofilm morphogenesis. A growing biofilm was illuminated with a white-light LED board from the side, and two cameras were employed to detect the scattered light from above and from the side. In both setups, red denotes the biofilm and gray denotes the agar substrate. (B,C) Number of wrinkles or blisters N versus the radial coordinate r during biofilm expansion is plotted on the left, with the image of the corresponding biofilm at 48 hr shown on the right, for (B) agar concentration = 0.8% and (C) agar concentration = 1.0%. The color scale indicates growth time t. We note that the characteristic length of the pattern inside the nutrient-limited zones (outlined with the red dotted circles in panels (B) and (C), images on the right), differs from that of the morphological pattern outside of the zones because the morphology inside the biofilm core has been shown to arise from localized cell death (Asally et al., 2012; Yan et al., 2017). In panel (B), the cyan ring denotes a typical radius in the radial pattern region along which N was counted. Scale bars: 2 mm. (D) Comparison of the wavelengths of the patterns for biofilms grown on identical agar substrates (0.5% agar) but in different initial geometries (circle (white) versus line (gray)). Unpaired t-tests with Welch’s correction were performed for statistical analyses. p-value = 0.394. NS denotes not significant. Data are represented as mean ± std with n = 3.
-
Figure 2—figure supplement 1—source data 1
Biofilm wavelength analysis.
- https://doi.org/10.7554/eLife.43920.012
Figure 2—figure supplement 2
Capillary peeling reveals a residual layer between the biofilm and the substrate.
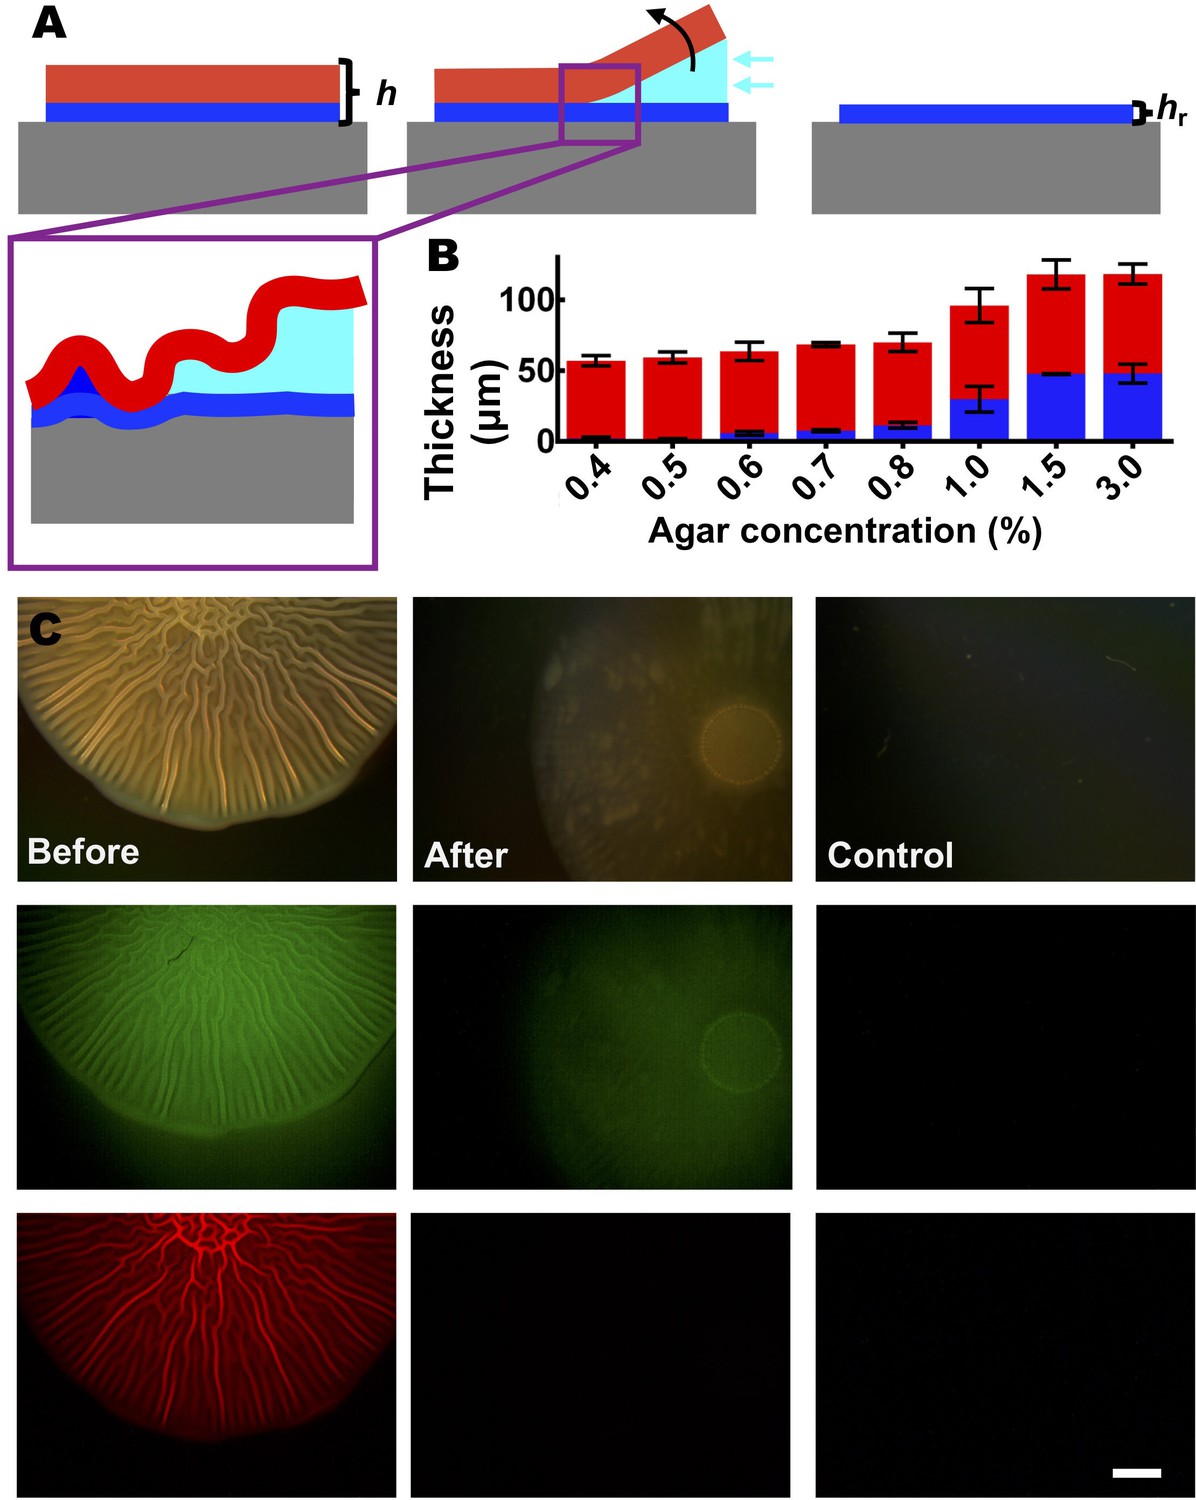
(A) Schematic of the capillary peeling process (see also Yan et al., 2018). Top: the proposed trilayer biofilm model includes a residual layer (blue) between the biofilm layer (red) and the agar substrate (gray). Cyan represents the slowly injected liquid. The weak interface between the biofilm layer and the residual layer is separated by the penetrating liquid, leaving the residual layer on the agar substrate. h denotes the total thickness of the biofilm. hr denotes the residual layer thickness. Bottom left: a closeup version of the schematic representation of liquid penetration between the biofilm and residual layers during the capillary peeling process. (B) Comparison of the corrected biofilm thickness hf (red, obtained from hf = h – hr) and the residual layer thickness hr (blue), as a function of agar concentration. hf changes minimally with changing agar concentrations. Thus, we hypothesize that the final thickness of the biofilm layer is set by the availability of oxygen, which can generally penetrate into a biofilm to a distance of tens of microns (Okegbe et al., 2014). Data are represented as mean ± std with n = 3. (C) The residual layer between the biofilm and the substrate contains primarily matrix material. Top: bright field images. Middle: Oregon green conjugated wheat germ agglutinin (WGA) staining for extracellular polysaccharide (Berk et al., 2012). Bottom: the signal from a constitutive mKate2 transcriptional fusion that marks cells. A V. cholerae biofilm expressing mKate2 was grown for 2 days on a 0.5% agar substrate, stained with WGA, and subsequently imaged (left). After the biofilm was peeled off the substrate using the capillary method from panel (A), the agar substrate was imaged again (middle). After biofilm peeling, a weak signal can be observed in the WGA channel but not in the mKate2 channel, suggesting that the residual layer contains primarily extracellular polysaccharide but not live cells. As a control, an identically treated sterile agar substrate is shown (right). Scale bar: 2 mm.
-
Figure 2—figure supplement 2—source data 2
Thicknesses of the biofilm and residual layers.
- https://doi.org/10.7554/eLife.43920.014
Figure 2—figure supplement 3
The biofilm residual layer consists primarily of polysaccharide.
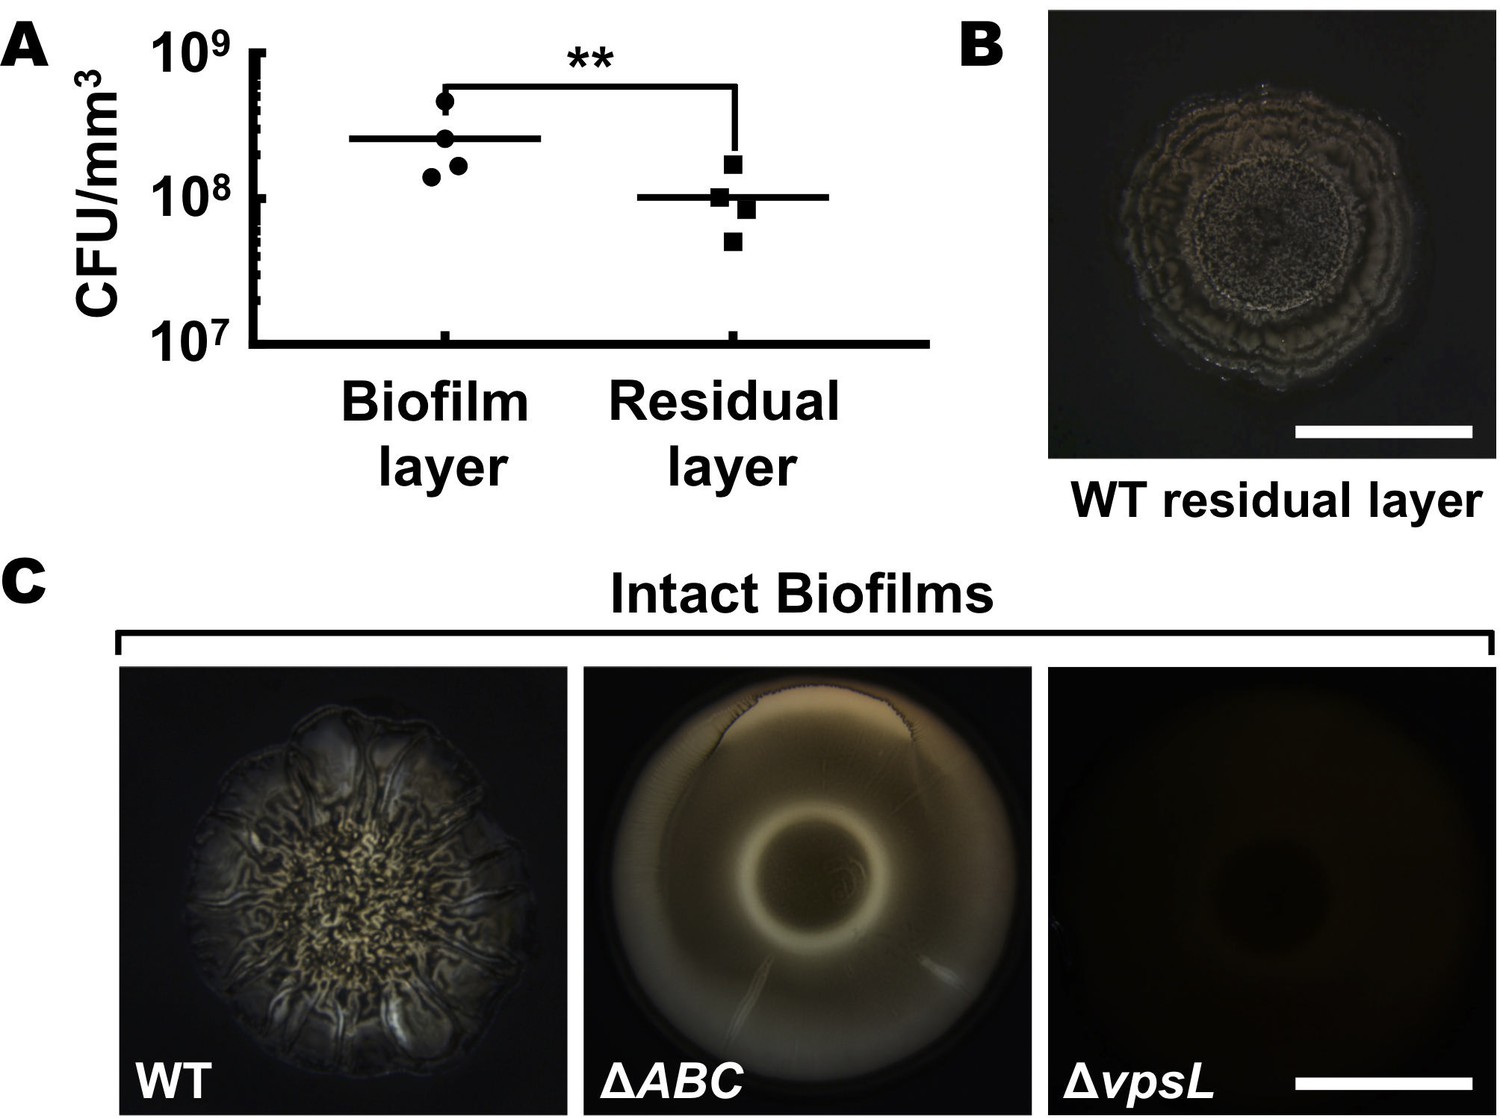
(A) Normalized CFU (colony forming units) in the biofilm and the residual layers for 2-day-old biofilms grown on a 0.6% agar substrate. Paired t-tests (n = 4) were performed for statistical analyses. ** denotes p-value < 0.01. (B) Bright field image of the residual biofilm layer from a WT biofilm counter-stained with India ink, which is excluded by polysaccharides. (C) Control experiments for panel (B). Bright field images of intact WT (left), ΔrbmA Δbap1 ΔrbmC (denoted ΔABC, lacking key matrix proteins but possessing the key matrix polysaccharide) (middle) and ΔvpsL (lacking the key matrix polysaccharide) (right) biofilms counter-stained with India ink. India ink is excluded from the biofilm and residual layer when the key matrix polysaccharide is present (WT residual layer, WT biofilm, ΔABC biofilm) but not when the key matrix polysaccharide is absent (ΔvpsL biofilm). The cells themselves do not exclude the India ink (as shown by the ΔvpsL mutant biofilm). We take these findings as preliminary evidence to suggest that the residual biofilm layer is primarily composed of polysaccharide. We do not exclude the possibility that the residual layer could also contain membrane, proteins, and other components. Scale bars: 5 mm.
-
Figure 2—figure supplement 3—source data 3
Cell counts in biofilm and residual layers.
- https://doi.org/10.7554/eLife.43920.016
Figure 2—figure supplement 4
The trilayer biofilm morphology model predicts the wrinkling wavelength observed in the experiments.
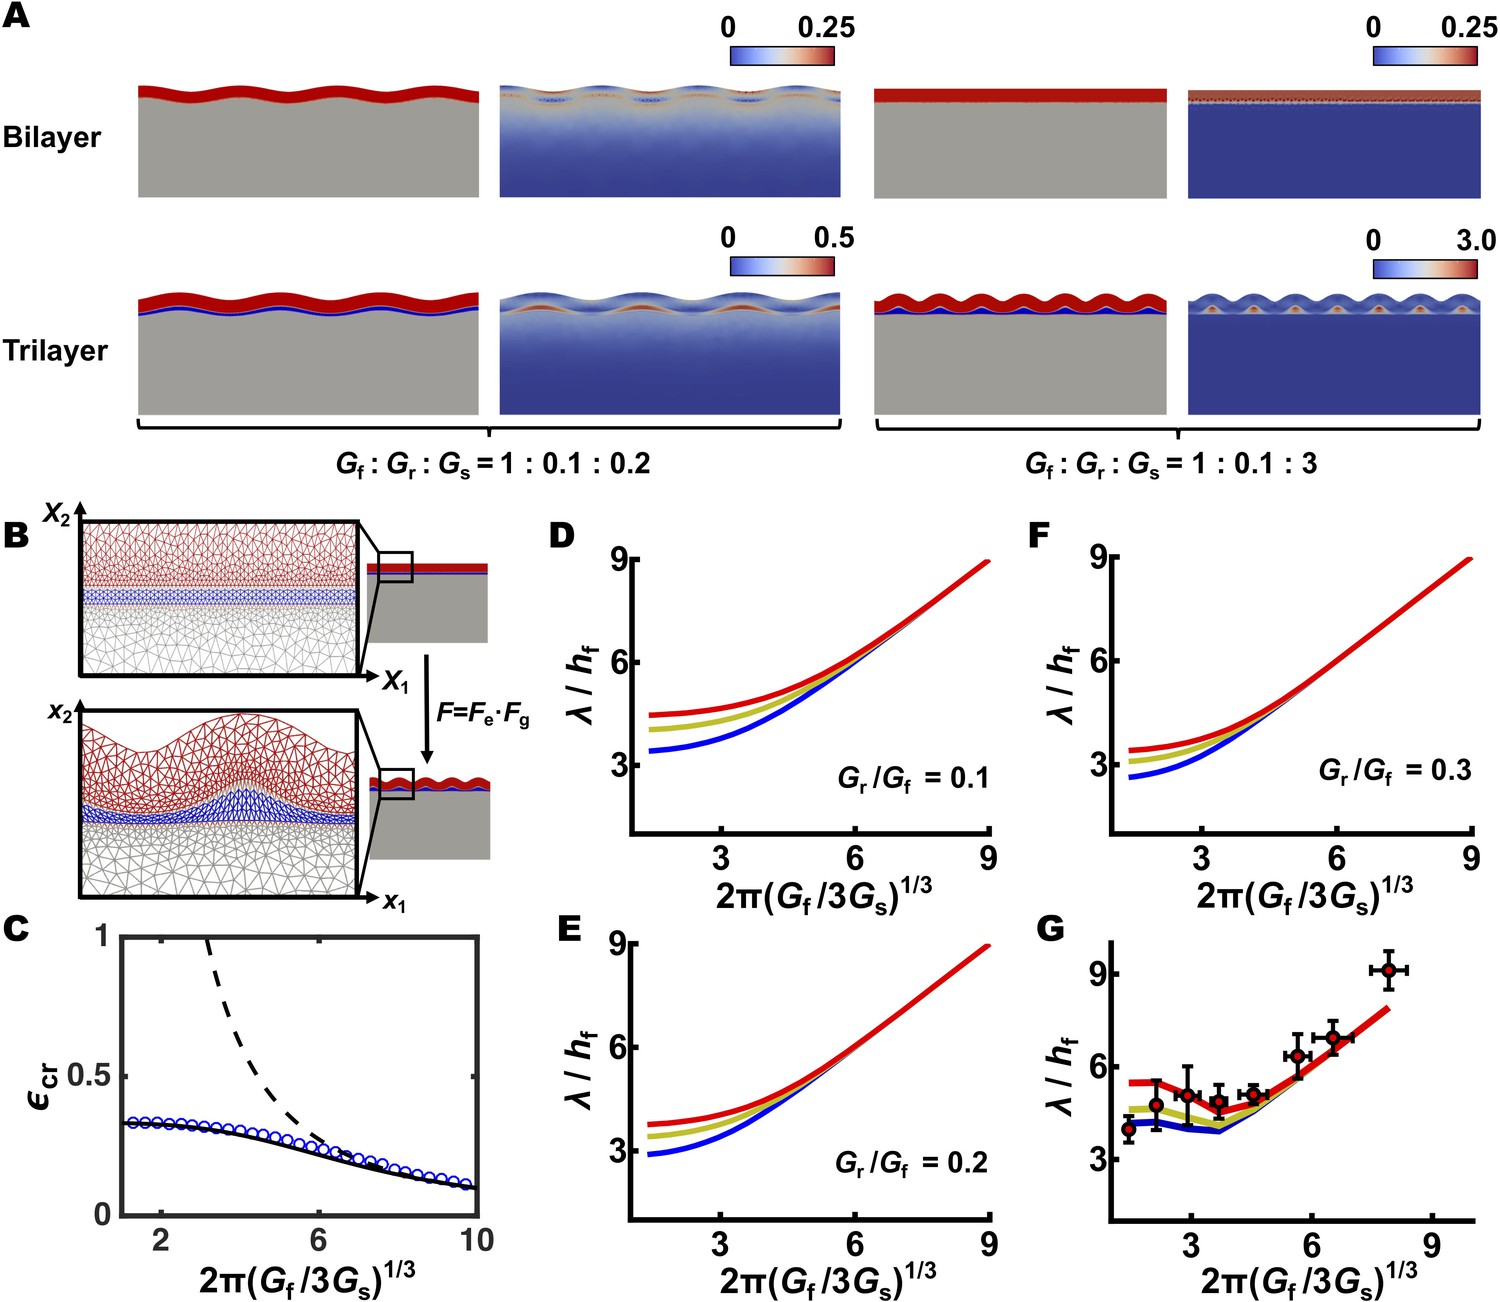
(A) Comparison of simulations of a bilayer model (top) and a trilayer model (bottom) following constrained biofilm growth. Left: both models predict surface wrinkling when the biofilm is stiffer than the substrate. Gf/Gs = 5.0 and the growth-induced compressive strain ε = 0.2. Right: when the substrate is stiffer than the biofilm, the biofilm remains flat in the bilayer model, but wrinkles in the trilayer model. Gf/Gs = 1/3 and ε = 0.32. Parameters for the residual layer in the trilayer model are: Gr/Gf = 0.1 and hr/hf = 0.3 in all simulations. For each simulation, the resulting configuration and strain distribution are shown side by side. First and third panels: color code as in Figure 2D. Second and fourth panels: color code denotes the von Mises equivalent strain (Jones, 2009). (B) Schematic of the trilayer simulation. Three layers are subdivided into finite elements (left). The coordinates in the initial and final deformed states are denoted by X and x, respectively, and are connected by a deformation tensor F. The total deformation can be further decomposed into two parts, one caused by growth Fg and another by elastic deformation Fe. (C) Comparison of the critical compressive strain εcr for wrinkling predicted by bilayer and trilayer models. The bilayer wrinkling pattern would yield an εcr larger than one for small Gf/Gs (corresponding to high agar concentrations in the biofilm growth experiment), which is physically inaccessible (dashed black curve). By contrast, the εcr predicted by the trilayer model (solid black curve, theory; blue circles, simulation) saturates at a value less than 1. Therefore, for small Gf/Gs (<1.3), a wrinkling instability is predicted by the trilayer model but not by the bilayer model. (D–F) Theoretical predictions of the scaling relationships between the normalized wrinkling wavelength λ/hf and the stiffness ratio Gf/Gs in the trilayer model. The modulus ratio between the residual layer and the biofilm is constant (Gr/Gf = 0.1, 0.2, and 0.3 for panels (D–F), respectively). The thickness ratio of the residual layer to the biofilm layer hr/hf is varied from 0.1, 0.2, to 0.3, corresponding to the blue, yellow, and red curves, respectively. (G) As an alternative approach to the fitting procedure represented in Figure 2D, we used the experimentally determined hr/hf and Gf for each growth condition and we varied the Gr/Gf ratio from 0.1, to 0.2, to 0.3 as shown by the blue, yellow, and red curves, respectively. Experimental data (red circles) are represented as mean ± std with n = 3.
-
Figure 2—figure supplement 4—source data 4
Theoretical and computational models for trilayer wrinkling.
- https://doi.org/10.7554/eLife.43920.018
Figure 3 with 1 supplement
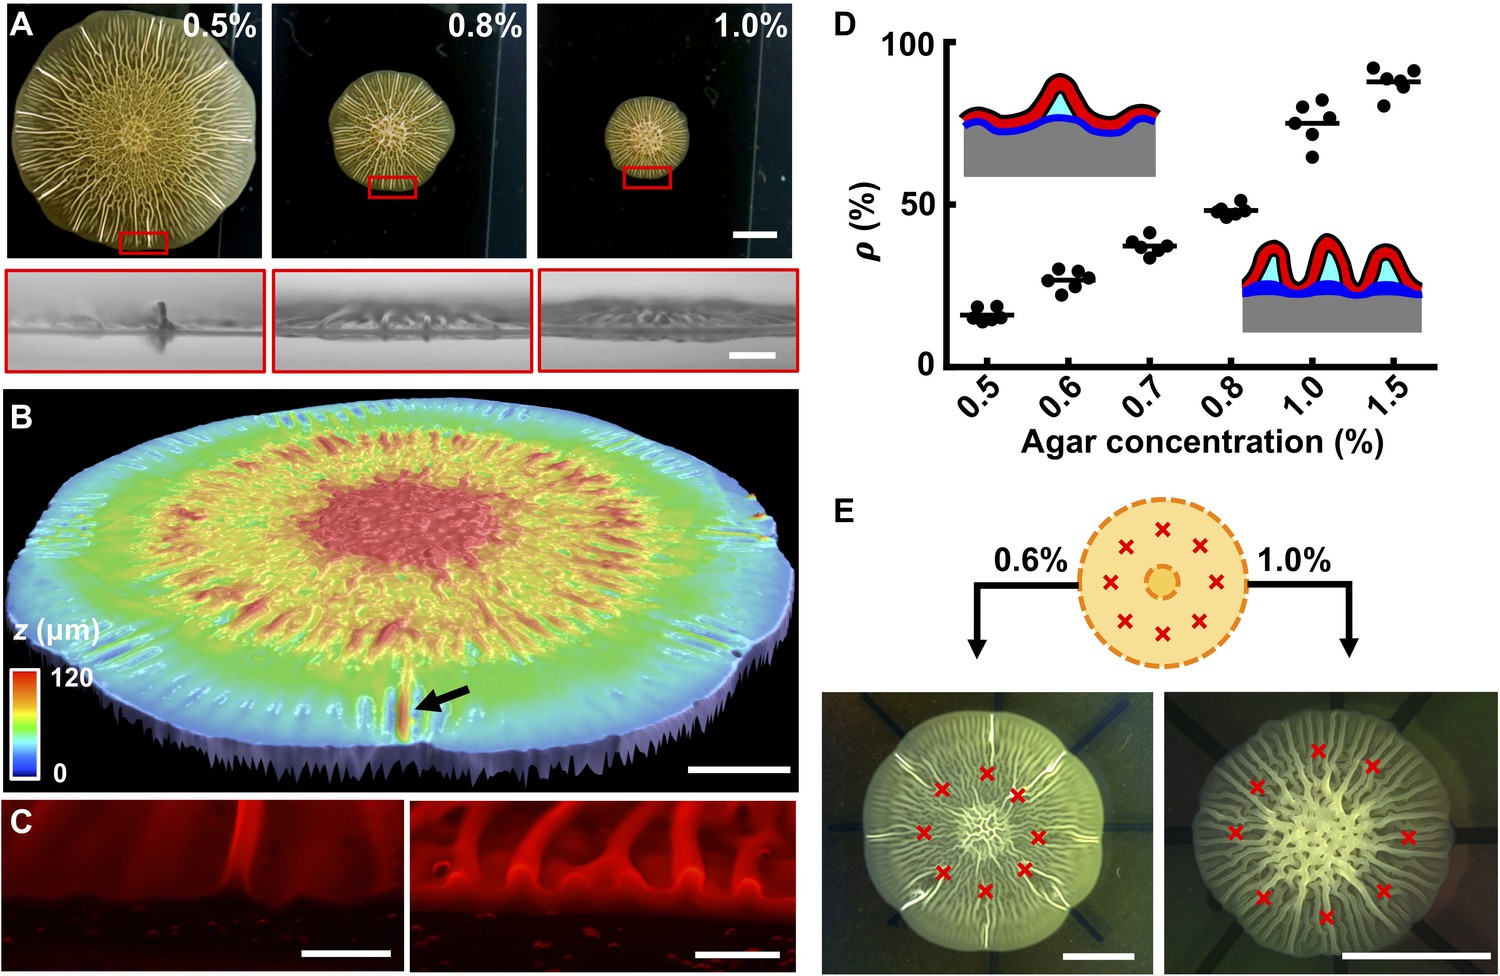
The biofilm wrinkling-to-delamination transition is controlled by adhesion energy.
(A) Top (top) and side (bottom) views of biofilms on plates containing the designated concentrations of agar taken 10 hr after the onset of delamination. Scale bar: 5 mm (top) and 1 mm (bottom). (B) Surface topography of a biofilm grown on 0.5% agar at the onset of the wrinkling-to-delamination transition (36 hr). The arrow indicates a blister. Scale bar: 2 mm. (C) Cross-sectional views of rims of biofilms producing fluorescent mKate2, grown for 40 hr on plates containing 0.6% agar (left) and 1.0% agar (right). Scale bars: 0.5 mm. (D) Percentage (ρ) of blisters in all radially oriented features (wrinkles + blisters) versus agar substrate concentration for 2-day-old biofilms. The distinction between wrinkles and blisters is made on the basis of visual inspection. Insets: schematics showing how ρ depends on substrate stiffness. Red with black outline, biofilms; gray, agar substrate; blue, residual layer; cyan, liquid between the blisters and the agar. (E) Biofilm growth on a substrate with defined defects. Top: schematic. Yellow denotes the growing biofilm. Red crosses denote the eight defects that were generated by manually making holes in the agar. Bottom: bright-field images of typical experiments using the setup shown in the schematic (top), for biofilms grown on plates with the designated agar concentrations. Scale bars: 5 mm.
-
Figure 3—source data 1
Wrinkles and blisters in biofilms.
- https://doi.org/10.7554/eLife.43920.023
Figure 3—figure supplement 1
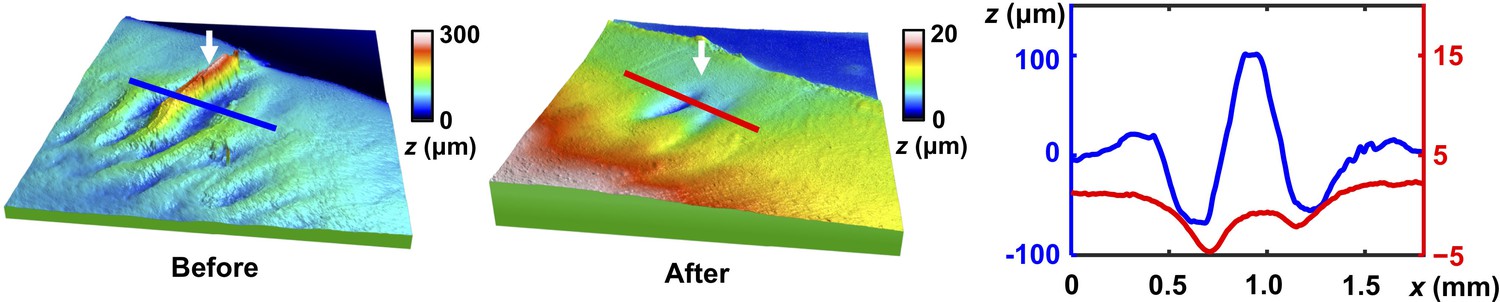
3D topography of a biofilm blister before and after capillary peeling.
3D height maps of a 4.60 × 3.50 mm region of a biofilm grown on 0.5% agar for 36 hr before (left) and after (middle) the biofilm layer was peeled off via the capillary peeling method. Red and blue lines indicate the positions from which the line profiles were extracted. White arrows indicate a blister. Right: line profiles at the indicated positions before (blue) and after (red) peeling. The zero position was chosen as the average height of the corresponding line profile. The capillary peeling process separates the weak interface between the biofilm layer and the residual layer, leaving the residual layer behind on the substrate. The location at which the blister was originally located becomes flat after biofilm removal. This observation suggests that there was no solid (either residual layer or agar substrate) filling the void under the blister, rather, the biofilm layer is locally delaminated from the surface underneath it. In addition, two large dimples are observed in the residual layer immediately adjacent to the position of the original blister, indicating that the biofilm had been significantly deformed into the residual layer. This finding is consistent with our observation that compressive strain is concentrated in the region containing a blister. Presumably, the large bending moment at the base of each dimple causes a large stress.
-
Figure 3—figure supplement 1—source data 1
Height profile of a large blister before and after capillary peeling.
- https://doi.org/10.7554/eLife.43920.025
Figure 4 with 3 supplements
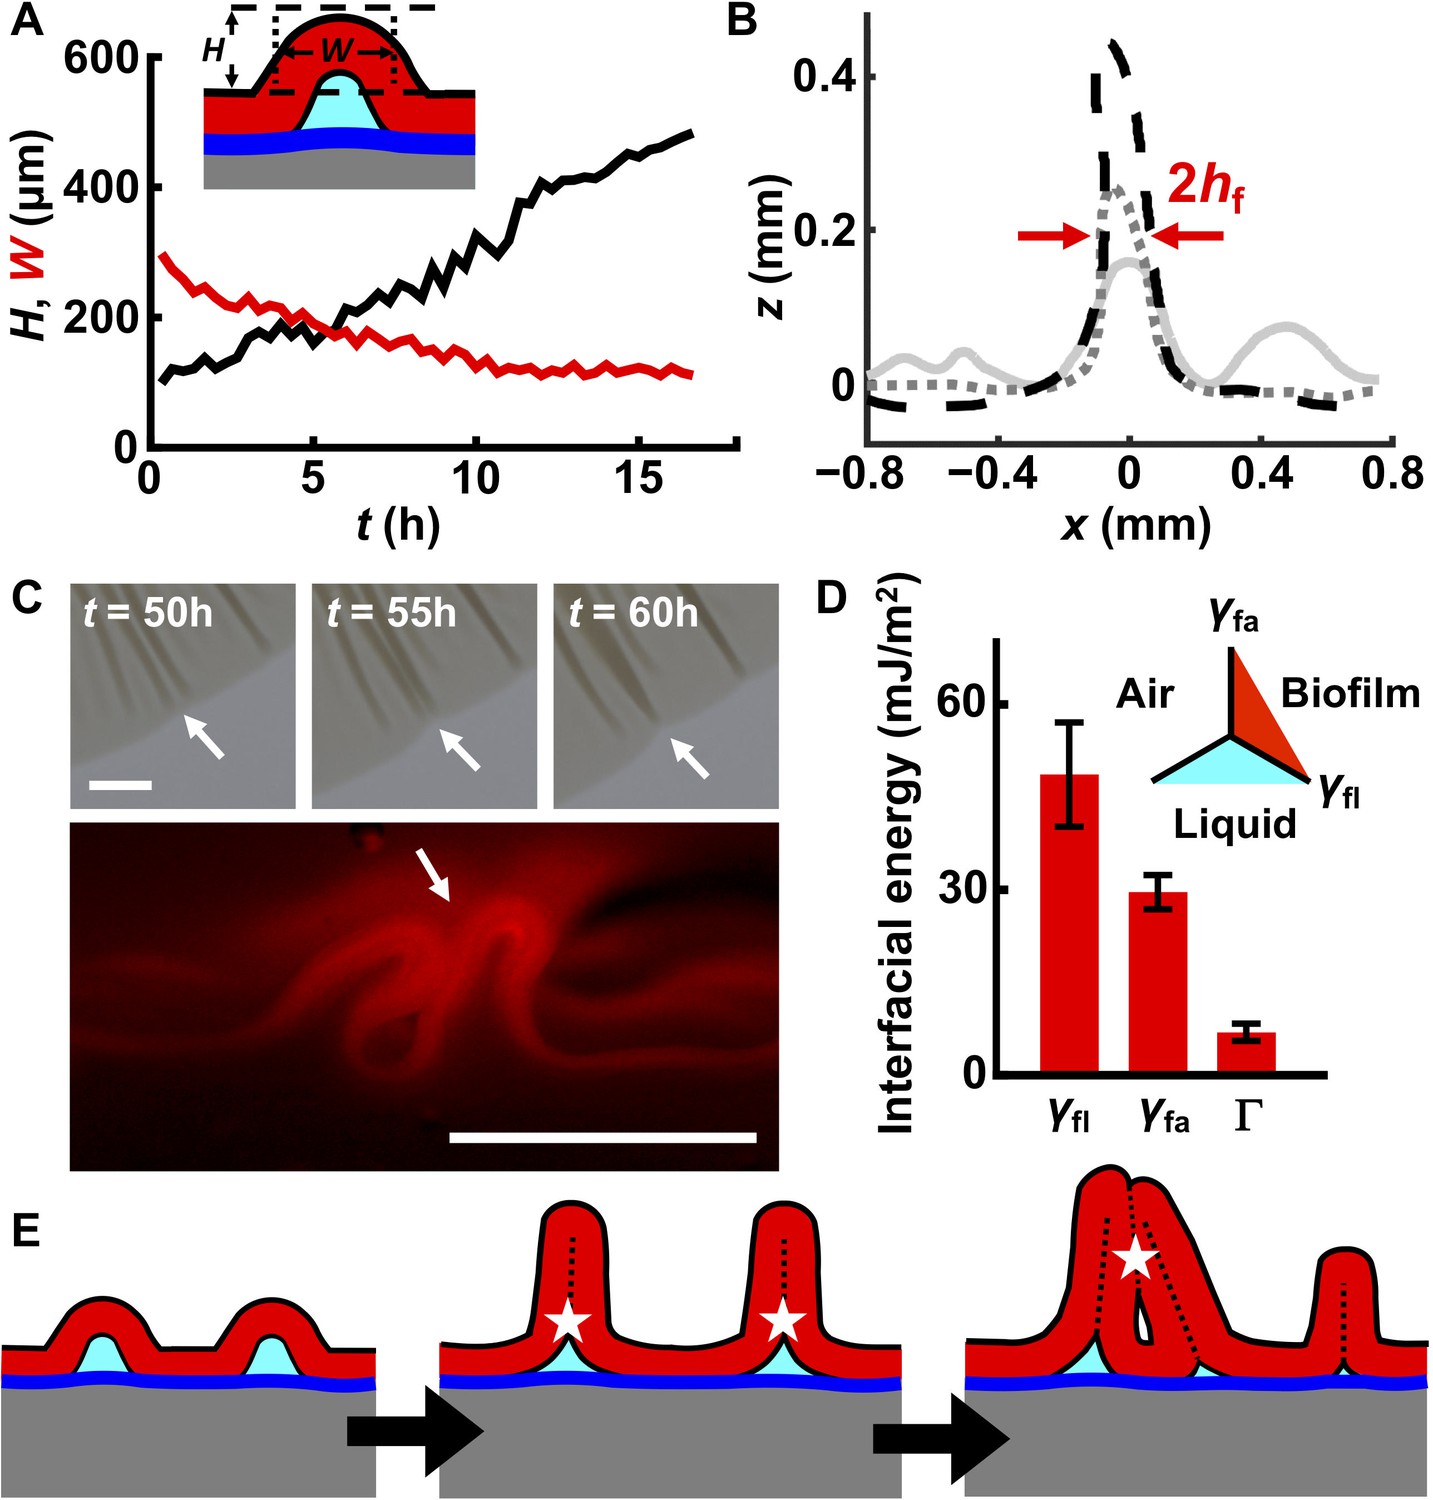
Interfacial energies control blister dynamics and interactions between blisters.
(A) Time evolution of the height H (black) and width W (red) of a representative biofilm blister. Inset: schematic representation of a blister; color code as in Figure 3D. (B) Developing profile of a single blister, extracted from side view images at successive time points after delamination. Profiles are shown at 2.5 hr (gray line), 10 hr (gray dotted line) and 17.5 hr (black dashed line) after the onset of delamination. The distance between the red arrows corresponds to W, which, over time, approaches twice the biofilm thickness (2hf). Regions near the blister become flatter as cell mass is pulled into the blister. Agar concentration: 0.4%. (C) Representative merging of adjacent blisters (white arrows) at specified times (top). Cross-section image from a biofilm producing fluorescent mKate2 reveals blister peak-to-peak contact (bottom; designated by the white arrow). Agar concentration: 0.7%. Scale bars: 1 mm (top) and 0.5 mm (bottom). (D) Interfacial energy of the biofilm–air interface γfa, biofilm–liquid interface γfl, and the adhesion energy between the biofilm and the substrate Γ for WT V. cholerae biofilms. Data are represented as mean ± std with n = 3. Inset: schematic of different interfaces. (E) Schematic of blister development in a WT V. cholerae biofilm. White stars and dashed black lines denote interface annihilation events. For panels (D) and (E), the color code is the same as that in Figure 3D.
-
Figure 4—source data 1
Blister formation and evolution dynamics and related interfacial energies in WT V. cholerae biofilms.
- https://doi.org/10.7554/eLife.43920.027
Figure 4—figure supplement 1
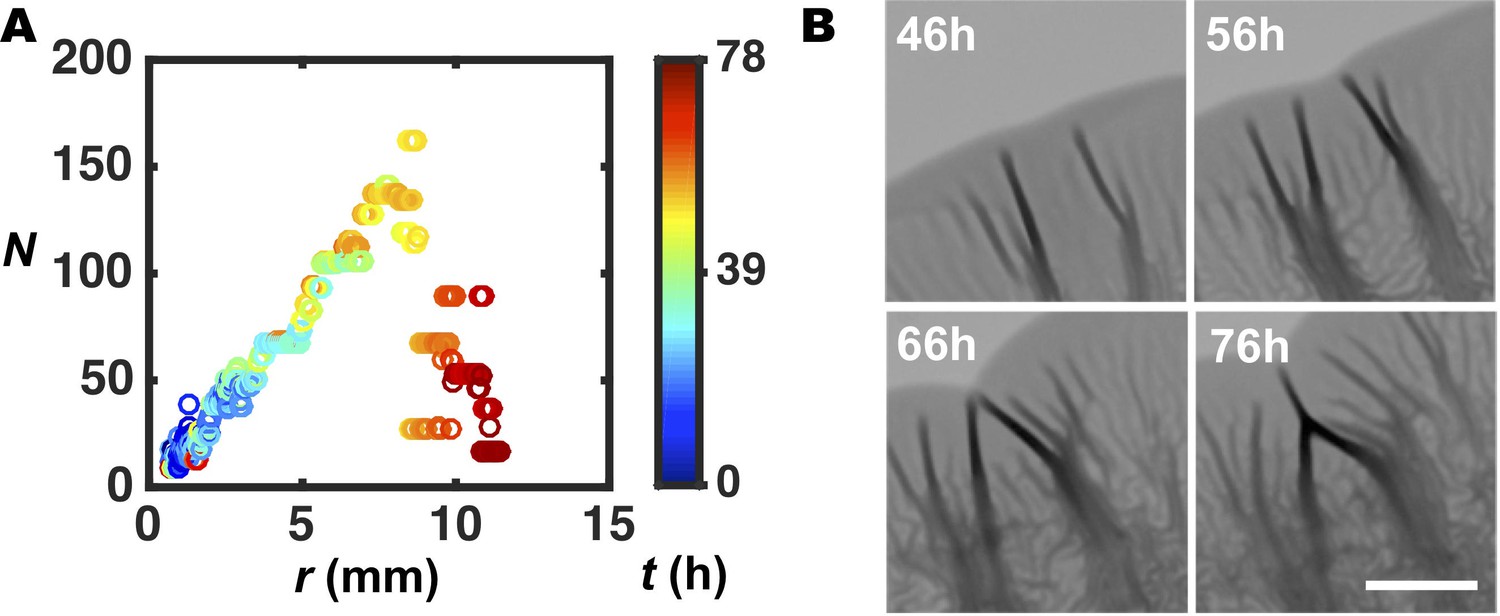
Characterization of pattern merging events.
(A) Number of wrinkles or blisters N versus radial coordinate r, for the biofilm shown in Figure 2A over a longer time interval. N sharply declines at the rim during the late stages of biofilm growth because of the merger of adjacent blisters, which eliminates biofilm–air interfaces (Figure 4C). (B) Representative images of the rim of a WT V. cholerae biofilm grown on 0.4% agar at the designated times. Neighboring blisters are pushed toward each other by the adjacent flat regions. Ultimately, the blisters merge. Scale bar: 2 mm.
-
Figure 4—figure supplement 1—source data 1
Wavelength analysis over three days of biofilm development.
- https://doi.org/10.7554/eLife.43920.029
Figure 4—figure supplement 2
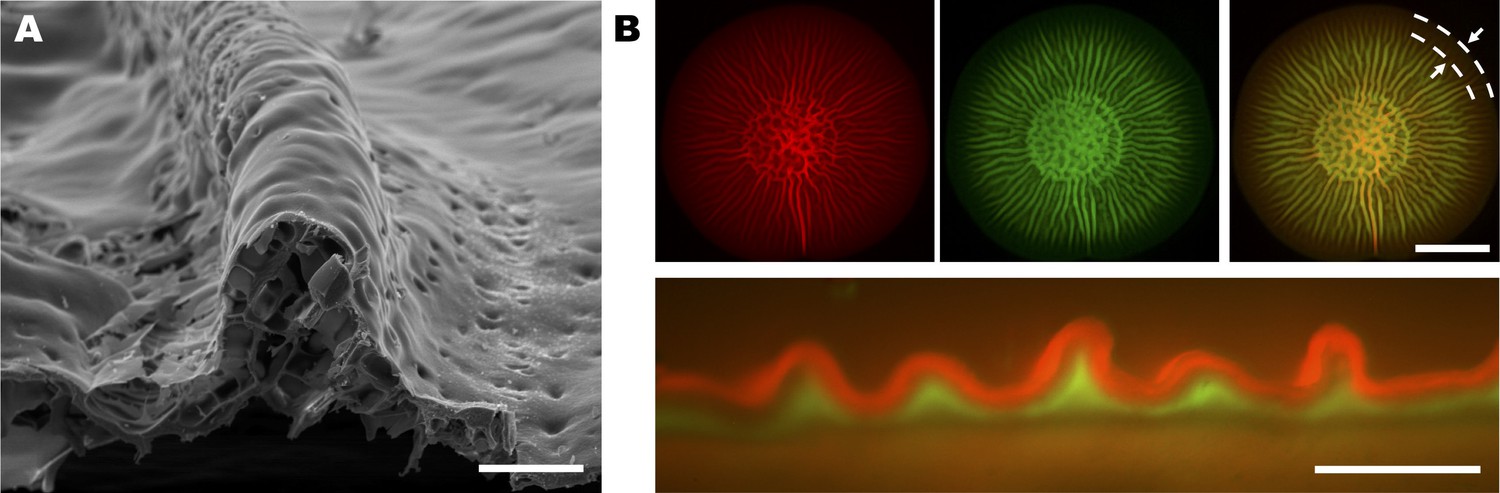
Analysis of the internal structures of biofilm blisters.
(A) SEM image of a cross-section of an isolated blister from a 2-day-old biofilm grown on a 0.6% agar substrate. The two inner faces of the blister contact one another, and an empty space exists underneath the blister. Scale bar: 100 μm. (B) Images of a V. cholerae biofilm expressing mKate2 grown for 2 days on a 0.8% agar substrate containing SytoX Green. The top view (top) and the cross-sectional view (bottom) are shown. Top left: signal from the constitutive mKate2 transcriptional fusion that labels live cells. Top middle: signal from SytoX Green that stains dead cells. Top right: merged signals. Dashed lines and arrows in the top right panel indicate the annulus at the biofilm edge that contains a lower fraction of dead cells relative to the region internal to this annulus. The existence of such an annulus shows that cell growth occurs primarily at the edge of the biofilm. Bottom: cross-sectional view of biofilm blisters reveals stratification between live (red) and dead (green) cells. The sides of blisters contact one another via the dead cell layer. In panel (B), scale bars: 5 mm (top) and 500 μm (bottom).
Figure 4—figure supplement 3
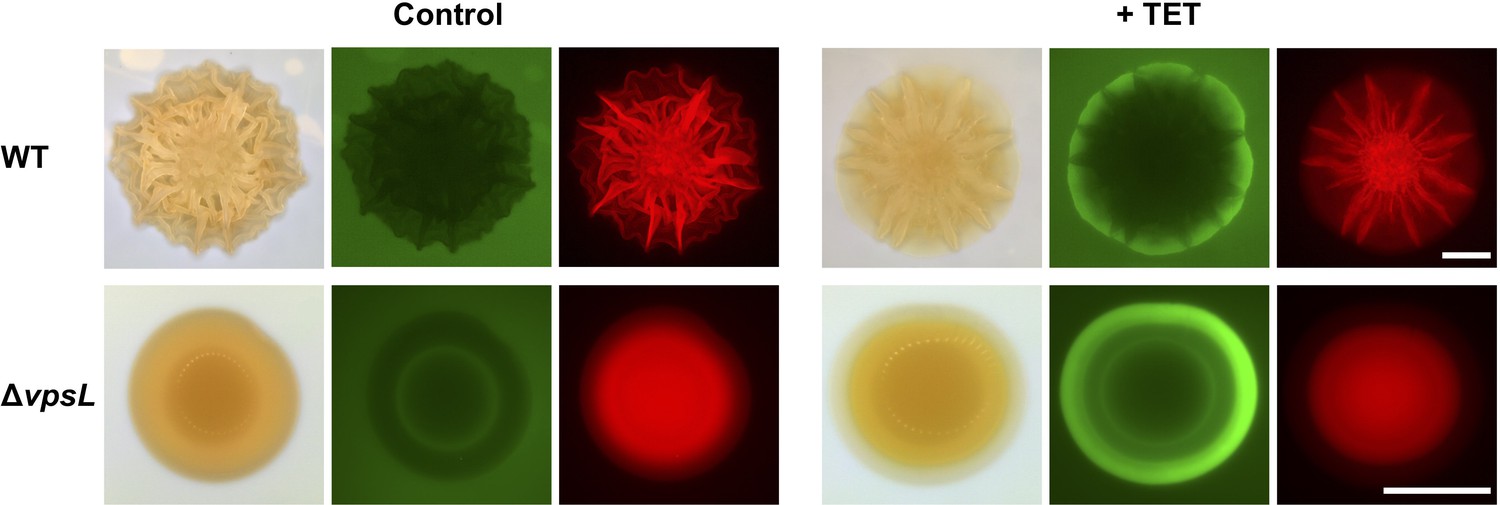
Bacterial cells residing in biofilm blisters are protected from antibiotics.
Biofilms of cells constitutively expressing mKate2 were grown on semipermeable membranes on top of a 0.6% agar substrate for 2 days. The membranes were transferred to the surface of LB liquid medium containing SytoX Green without (left) or with (right) 50 μg/mL tetracycline (TET) overnight. For each condition, the left part shows the bright-field images, the middle part shows SytoX staining of dead cells, and the right part shows the mKate2 signal from live cells. In the absence of tetracycline, both WT and ΔvpsL mutant biofilms harbor few dead cells. In the presence of tetracycline, significant cell death occurs at the edges of both the WT and the ΔvpsL biofilms. However, WT cells in the biofilm regions containing blisters are less susceptible to the lethal effects of antibiotics than are cells in the intervening flat regions, presumably because cells residing in blisters are located further away from the antibiotic source than are cells that are not in blisters. Such variation in survival in the tangential direction does not occur in the ΔvpsL mutant biofilm, which possesses a smooth, blister-less morphology. Scale bars: 2 mm.
Figure 5 with 1 supplement
Morphogenesis of a mutant biofilm possessing altered interfacial energies.
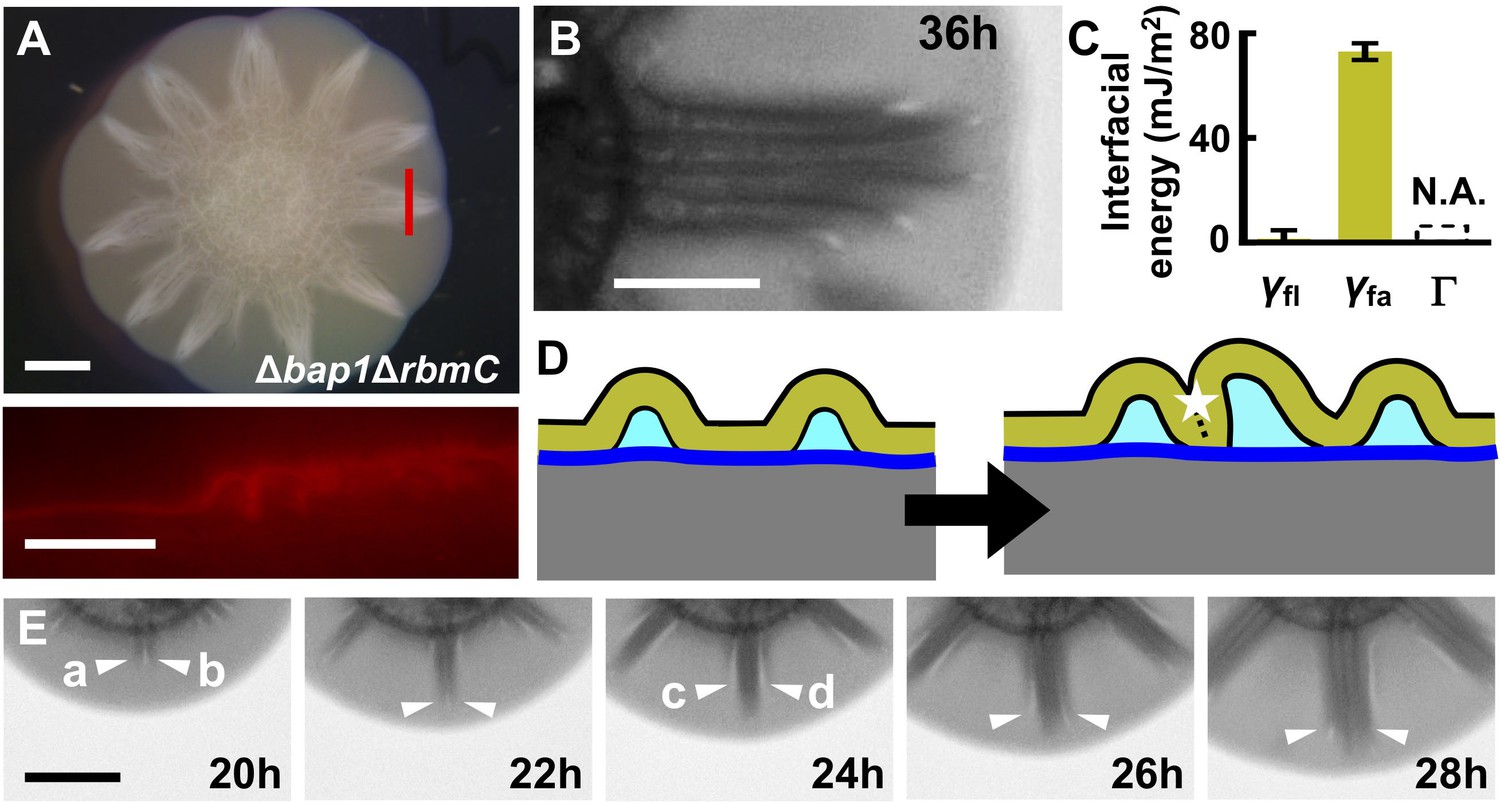
(A) Bright-field (top) and cross-sectional (bottom) images of a V. cholerae Δbap1ΔrbmC mutant (abbreviated as ΔBC below) biofilm producing fluorescent mKate2, grown for 2 days on a 0.6% agar substrate. The red line in the top panel indicates the location of the cross-section used for the bottom panel. Scale bars: 2 mm (top) and 500 μm (bottom). (B) Close-up view of a star facet in a ΔBC biofilm grown on 0.6% agar for 36 hr. Scale bar: 1 mm. (C) Interfacial energies measured for the ΔBC biofilm. N.A. means too small to be measured. Data are represented as mean ± std with n = 3. (D) Schematic representations of ΔBC biofilm morphology development. Color code as in Figure 3D, except that yellow represents the ΔBC biofilm. (E) Transmission images of a section of a ΔBC biofilm growing on a 0.6% agar plate at the designated times. White arrowheads indicate emerging blisters. Four blisters (a–d) emerged during the time shown. Scale bar: 1 mm.
-
Figure 5—source data 1
Interfacial energies of V. cholerae Δbap1ΔrbmC mutant biofilms.
- https://doi.org/10.7554/eLife.43920.033
Figure 5—figure supplement 1
Interfacial energies determine the morphological features of the biofilm.
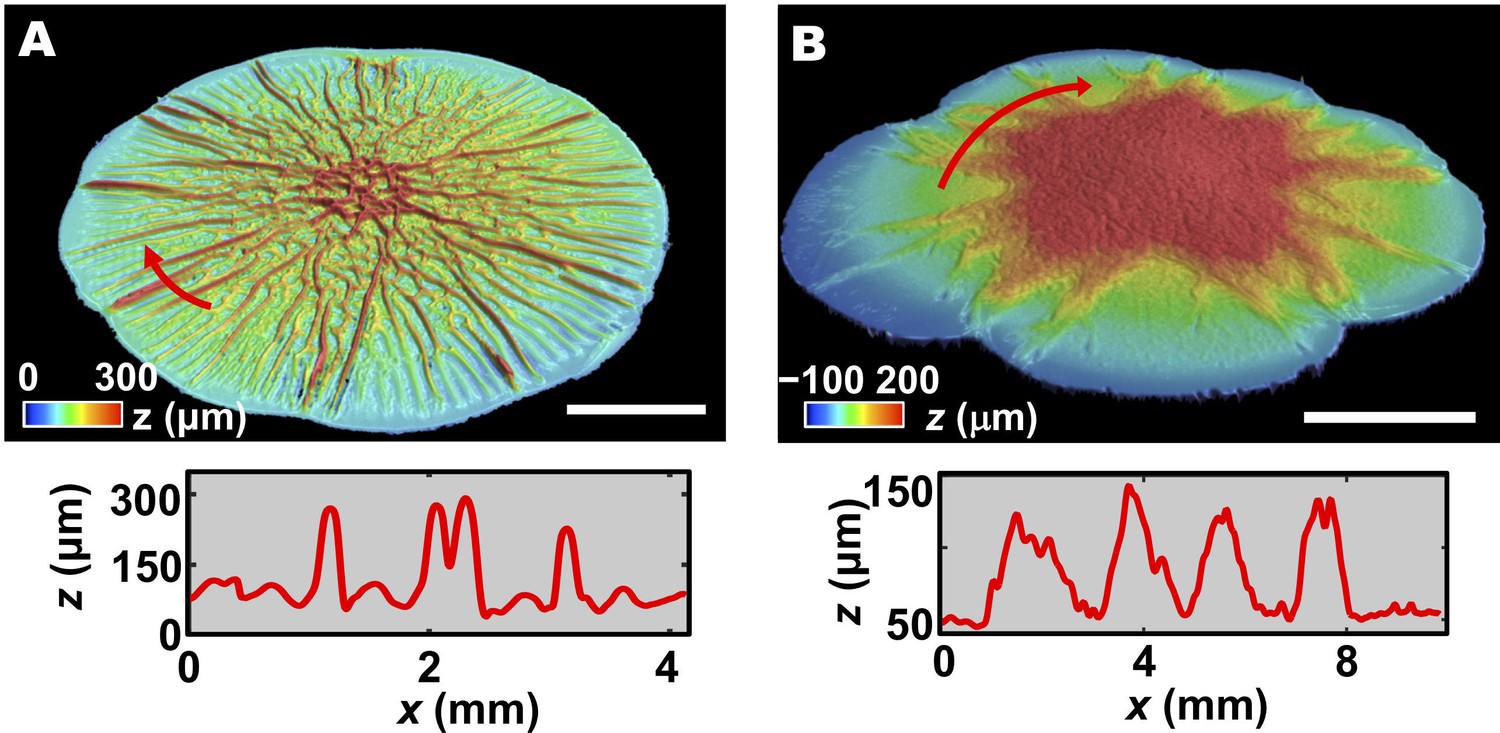
(A, B) Top: 3D profile of a 2-day-old WT V. cholerae biofilm (A) and a 36-h-old ΔBC biofilm (B) grown on a 0.6% agar substrate. Scale bars: 5 mm. Bottom: height profiles extracted from the positions spanned by the red arrows in the top panels. In panel (A), several large blisters can be observed among the smaller amplitude wrinkles. In panel (B), several subpeaks are present within one large peak, indicating aggregation of blisters in the ΔBC biofilm.
-
Figure 5—figure supplement 1—source data 1
Height profiles of WT V. cholerae and Δbap1ΔrbmC mutant biofilms.
- https://doi.org/10.7554/eLife.43920.035
Figure 6 with 2 supplements
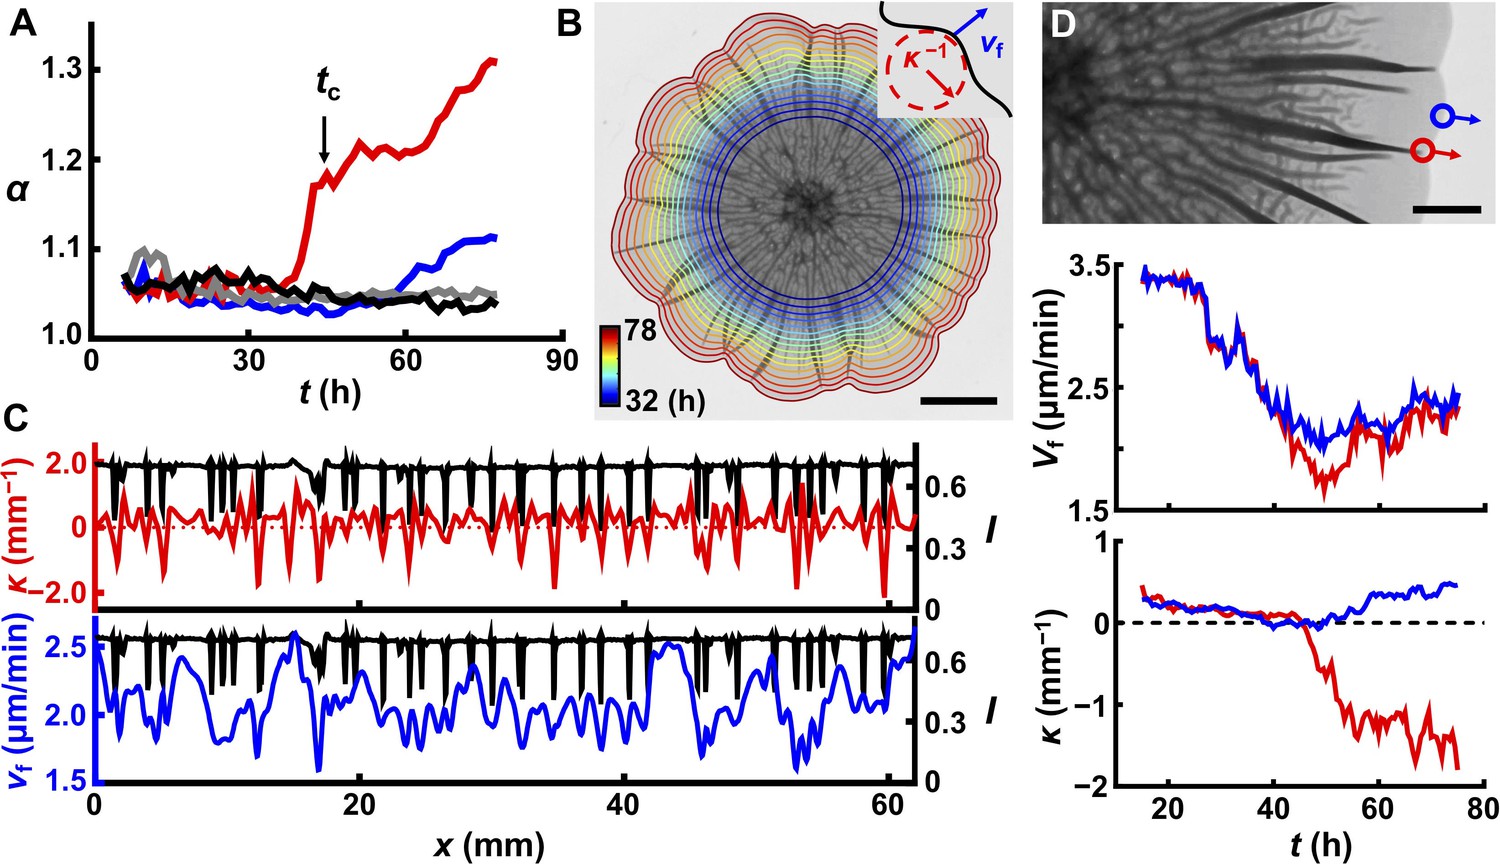
Delamination defines the overall biofilm contour.
(A) Time evolution of acircularity index α (where α = P2/4πA, in which P is the perimeter of the biofilm and A is the area) of the biofilm contour. Two agar substrate concentrations are shown (0.4%, red; 1.0%, blue) for WT V. cholerae biofilms. The sharp upturn in α defines the critical time tc. Biofilms lacking matrix (ΔvpsL mutant; 0.4%, gray) or possessing an unstructured matrix (ΔrbmAΔbap1ΔrbmC mutant; 0.4%, black) remain circular. (B) Image of a WT V. cholerae biofilm grown on 0.7% agar 78 hr after inoculation, overlaid with the time evolution of the biofilm boundary. Colors correspond to the expanding boundary from 32 to 78 hr. Scale bar: 5 mm. Inset: schematic of local velocity Vf and the inverse of local curvature κ−1. (C) Transmitted light intensity profiles I (black), κ (red), and Vf (blue) along the biofilm periphery from panel (B) at 60 hr. (D) Top: partial image of the biofilm shown in panel (B) at 75 hr. Red and blue dots denote two boundary points at the locations of a delaminated and a flat region, respectively. Arrows indicate boundary expansion. Middle and bottom: time evolution of Vf and κ of the designated time points during biofilm development. Scale bar: 2 mm.
-
Figure 6—source data 1
Local curvature, velocity, and transmission image intensity, and acircularity for biofilm contour evolution dynamics.
- https://doi.org/10.7554/eLife.43920.038
Figure 6—figure supplement 1
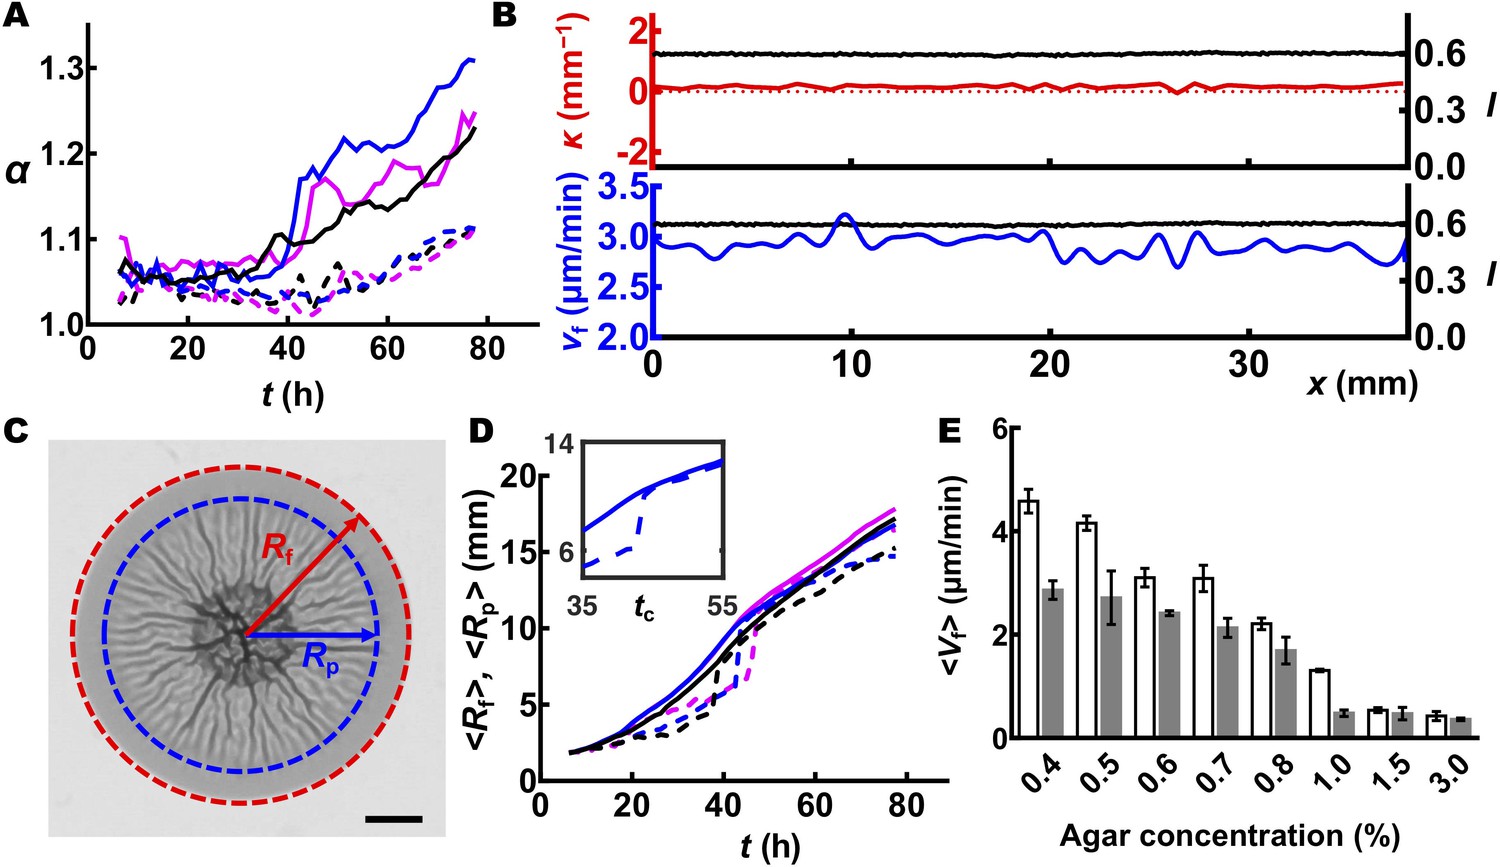
Delamination triggers global and local slowdown of biofilm expansion and shapes the biofilm contour.
(A) Time evolution of the acircularity index α of the biofilm contour. Data are shown in magenta, blue, and black for three biofilms grown on 0.4% (solid curves) and 1.0% (dashed curves) agar plates. (B) Profiles of transmitted light intensity I (black), local curvature κ (red), and local expansion velocity Vf (blue) along the periphery of the biofilm shown in Figure 6B but at 32 hr. At 32 hr, the wrinkling/delamination pattern had not yet reached the boundary, so the biofilm remained approximately circular, and thus both I and κ remain constant over the biofilm periphery. Vf fluctuated modestly, probably because of noise at the growing front and errors in the edge tracking process. (C) Image of a WT V. cholerae biofilm grown on 0.7% agar taken 30 hr after inoculation. Rf and Rp denote the radius of the entire biofilm (outlined in red) and the distal radius to which the morphological pattern extends (outlined in blue), respectively. Scale bar: 2 mm. (D) Time evolution of Rf (solid curves) and Rp (dashed curves). Data are shown from three different WT V. cholerae biofilms (denoted by different colors) grown on 0.4% agar. Initially, Rp lags behind Rf, indicating a peripheral zone in which the biofilm remains flat and lacks identifiable features. Rf increases linearly with time, which defines an expansion velocity <Vf> . At a critical time t’c (35 hr (black), 42.5 hr (blue), and 45 hr (magenta) for the three cases shown), the region harboring wrinkles or blisters rapidly propagates to the edge of the biofilm (Rp = Rf). Concurrently, the global biofilm expansion velocity slows, with a crossover time point at t’c. Inset: close-up view of Rf and Rp versus time for one set of data (blue) around t’c. The critical time that is defined in this manner matches that defined from the α – t plot in Figure 6A (i.e. tc = t’c), suggesting that mechanical instability at the biofilm edge triggers the development of contour undulations. (E) Averaged biofilm expansion velocity <Vf> before (white) and after (gray) morphological features appear at the rim. <Vf> was calculated by linear fitting of Rf versus time. Data are represented as mean ± std with n = 3.
-
Figure 6—figure supplement 1—source data 1
Analysis of contour evolution and biofilm expansion dynamics.
- https://doi.org/10.7554/eLife.43920.040
Figure 6—figure supplement 2
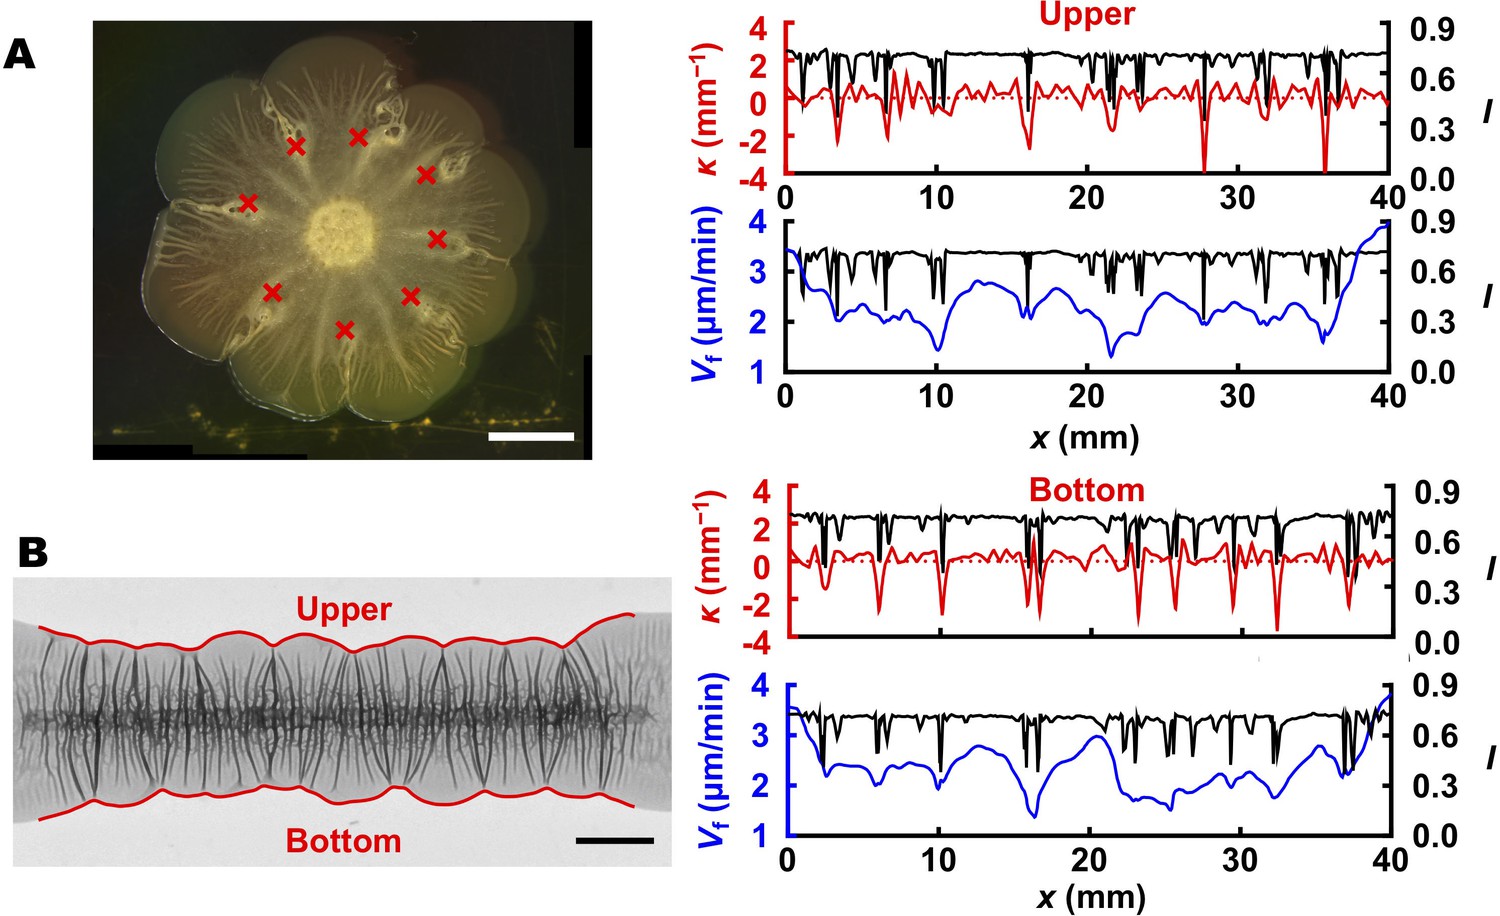
Blister formation drives the overall biofilm contour.
(A) (Left) Bright-field image of a typical 60-hr-old biofilm growing on an agar substrate with predefined defects. The eight surface defects (marked by red crosses) trigger the formation of blisters, which subsequently define the positions of eight ‘petals’ along the biofilm contour. (B) (Left) Transmission image of a 40-hr-old biofilm grown in a line geometry on an agar substrate. Red outlines indicate the upper and bottom contours. (Right) Analyses identical to that provided in Figure 6C were performed for both contours to show that the formation of blisters (indicated by the valleys in the intensity profiles(black)) locally slows down biofilm expansion velocity (blue) and defines the indentation positions along the contour (red). Scale bars: 5 mm.
-
Figure 6—figure supplement 2—source data 2
Local curvature, velocity, and transmission image intensity for biofilm contour evolution dynamics in a line geometry.
- https://doi.org/10.7554/eLife.43920.042
Videos
Video 1
Part 1: A V. cholerae biofilm grown for 24 hr on 0.6% agar medium was peeled off of the substrate by the capillary method using LB medium as the liquid starting from the bottom left. The movie is played in real time.
Part 2: The peeled biofilm from Part 1 grew at the air–liquid interface over time. Imaging began immediately after peeling and its total duration is 6 hr with 5-min time steps. The field of view is 73.0 mm × 48.3 mm.
Video 2
Part 1: Collision of two V. cholerae biofilms grown on medium containing 0.6% agar.
Imaging began 5 hr after inoculation and has a total duration of 75 hr with 15 min time steps. Biofilms were separated by 9 mm at the time of inoculation. At t = 20 hr, the biofilms begin to contact one another. The additional compressive stress present at the collision front leads to the formation of a large blister in the middle. The field of view is 41.5 mm × 27.7 mm. Part 2: Growth of a V. cholerae biofilm on medium containing 0.5% agar after cells were inoculated in a line. Imaging began 5 hr after inoculation and has a total duration of 72 hr with 15 min time steps. The field of view is 50.2 mm × 33.3 mm.
Video 3
Growth of a V. cholerae biofilm on medium containing 0.4% agar.
Imaging began 5 hr after inoculation and has a total duration of 75 hr with 15 min time steps. The field of view is 41.5 mm × 27.7 mm.
Video 4
Growth of a V. cholerae biofilm on medium containing 0.7% agar.
Imaging began 5 hr after inoculation and has a total duration of 75 hr with 15 min time steps. The field of view is 41.5 mm × 27.7 mm.
Video 5
Growth of a V. cholerae biofilm on medium containing 1.0% agar.
Imaging began 5 hr after inoculation and has a total duration of 72 hr with 15 min time steps. The field of view is 24.0 mm × 16.0 mm.
Video 6
Growth of a V. cholerae Δbap1ΔrbmC mutant (denoted ΔBC) biofilm on medium containing 0.6% agar.
Imaging began 5 hr after inoculation and has a total duration of 72 hr with 15 min time steps. The field of view is 24.0 mm × 16.0 mm.
Tables
Key resources table
| Reagent type (species) or resource | Designation | Source or reference | Identifiers | Additional information |
|---|---|---|---|---|
| Strain, strain background (E. coli) | S17 λ-pir | de Lorenzo and Timmis, 1994 | Wild type | |
| Strain, strain background (V. cholerae) | C6706str2 | Thelin and Taylor, 1996 | El Tor wild type | |
| Strain, strain background (V. cholerae) | JY283 | Yan et al., 2017 | vpvCW240R ΔpomA (denoted WT) | |
| Strain, strain background (V. cholerae) | JY285 | Yan et al., 2017 | vpvCW240R ΔpomAΔbap1ΔrbmC | |
| Strain, strain background (V. cholerae) | JY286 | Yan et al., 2017 | vpvCW240R ΔpomAΔrbmAΔbap1ΔrbmC | |
| Strain, strain background (V. cholerae) | JY287 | Yan et al., 2017 | vpvCW240R ΔpomAΔvpsL | |
| Strain, strain background (V. cholerae) | JY370 | Yan et al., 2017 | vpvCW240RΔpomA lacZ:Ptac-mKate2:lacZ | |
| Strain, strain background (V. cholerae) | JY376 | Yan et al., 2017 | vpvCW240RΔpomA ΔvpsL lacZ:Ptac-mKate2:lacZ | |
| Strain, strain background (V. cholerae) | JY395 | This study | vpvCW240RΔpomA Δbap1ΔrbmC lacZ: Ptac-mKate2:lacZ | |
| Recombinant DNA reagent | Plasmid: pKAS32 | Skorupski and Taylor, 1996 | Suicide vector, AmpR SmS | |
| Recombinant DNA reagent | Plasmid: pNUT144 | Drescher et al., 2014 | Suicide vector, AmpR KanR SmS | |
| Recombinant DNA reagent | Plasmid: pNUT157 | Drescher et al., 2014 | pNUT144 vpvCW240R | |
| Recombinant DNA reagent | Plasmid: pCMW112 | Hammer and Bassler, 2003 | pKAS32 ΔvpsL | |
| Recombinant DNA reagent | Plasmid: pCN004 | Nadell and Bassler, 2011 | pKAS32 lacZ:Ptac-mKate2:lacZ | |
| Recombinant DNA reagent | Plasmid: pCN007 | Nadell et al., 2015 | pKAS32 ΔrbmA | |
| Recombinant DNA reagent | Plasmid: pCN008 | Nadell et al., 2015 | pKAS32 ΔrbmC | |
| Recombinant DNA reagent | Plasmid: pCN009 | Yan et al., 2016 | pKAS32 Δbap1 | |
| Recombinant DNA reagent | Plasmid: pCDN010 | Nadell et al., 2015 | pKAS32 ΔpomA | |
| Software, algorithm | MATLAB and ImageProcessing Toolkit | Mathworks, 2015 | https://www.mathworks.com/products/matlab.html | |
| Software, algorithm | PRISM version 6.07 | GraphPad, 2015 | https://www.graphpad.com/scientific-software/prism/ | |
| Software, algorithm | Image composite editor version 2.0.3 | Microsoft, 2015 | https://www.microsoft.com/en-us/research/project/image-composite-editor/ | |
| Software, algorithm | Gmsh version 3.0.6 | Geuzaine and Remacle, 2009 | https://gmsh.info | |
| Software, algorithm | Paraview version 5.5.0 | Ahrens et al., 2005 | https://www.paraview.org/ | |
| Software, algorithm | FEniCS version 2017.2.0 | Alnæs et al., 2015 | https://fenicsproject.org/ | |
| Software, algorithm | DigiCamControl software version 2.0.72.0 | DigiCamControl, 2015 | http://digicamcontrol.com/ | |
| Software, algorithm | Leica Map Start version 7.4.8051 | Leica, 2017 | https://www.leica-microsystems.com/products/microscope-software/details/product/leica-map/ | |
| Software, algorithm | ImageJ and freehand line selection tool | NIH | https://imagej.nih.gov/ij/ | |
| Software, algorithm | RheoPlus version 3.40 | Anton Paar, 2008 | ||
| Other | LB broth, Miller | ThermoFisher | Cat# BP1426-2 | |
| Other | Bacto agar | VWR | Cat# 214030 | |
| Other | O.C.T. agent | Tissue-Tek, Sakura | Cat# 4583 | |
| Other | Silicone oil, 5 cSt | Sigma Aldrich | Cat# 317667 | |
| Other | Glass beads, acid washed, 425 – 600 µm diameter | Sigma Aldrich | Cat# G8772 | |
| Other | MP Biomedicals Roll & Grow Plating Beads, 4 mm in diameter | ThermoFisher | Cat# MP115000550 | |
| Other | BD PrecisionGlide needles (0.6 mm × 2.5 mm) | Sigma Aldrich | Cat# Z118044 | |
| Other | EMD Millipore,25 mm in diameter | Sigma Aldrich | Cat# VSWP02500 | |
| Other | SytoX Green Nucleic Acid Stain | ThermoFisher | Cat# S7020 | |
| Other | Wheat Germ Agglutinin Sampler Kit | ThermoFisher | Cat# W7024 | |
| Other | Higgins Black India Ink | |||
| Other | Physica MCR 301 shear rheometer | Anton Paar, 2008 | ||
| Other | Nikon D3300 SLR digital camera with DX Zoom-Nikkor 18-55 mm lens | Amazon | https://www.amazon.com/Nikon-1532-18-55mm-3-5-5-6G-Focus-S/dp/B00HQ4W1QE/ref=sr_1_3?ie=UTF8&qid=1492108083&sr=8-3&keywords=D3300&th=1 | |
| Other | Huion L4S light box | Amazon | https://www.amazon.com/Huion-L4S-Light-Box-Illumination/dp/B00J0UUHPO | |
| Other | Sigma 105 mm macro lens for Nikon DSLR camera | Amazon | https://www.amazon.com/Sigma-258306-105mm-Macro-Camera/dp/B0058NYW3K/ref=sr_1_sc_3?ie=UTF8&qid=1485483491&sr=8-3-spell&keywords=sigma+macroles | |
| Other | Leica stereoscope model M205 FA | Leica | ||
| Other | Leica DCM 3D micro-optical system | Leica | https://www.leica-microsystems.com/products/light-microscopes/upright-microscopes/details/product/leica-dcm-3d/ | |
| Other | VR3200 wide-area 3D measurement system | Keyence | https://www.keyence.com/products/measure-sys/3d-measure/vr-3000/models/vr-3200/index.jsp | |
| Other | FEI XL 30 FEG-SEM | FEI | https://iac.princeton.edu/equipment.html | |
| Other | Millrock Technology, BT85A-A | Millrock | https://www.millrocktech.com/ | |
| Other | VCR IBS/TM200S ion beam sputterer | VCR | https://iac.princeton.edu/equipment.html |
Additional files
-
Source data 1
Raw data for Supplementary file 1 – Table S1.
- https://doi.org/10.7554/eLife.43920.043
-
Supplementary file 1
Summary of biomaterial parameters for V. cholerae biofilms.
Table S1 reports the measured biomaterial parameters for V. cholerae biofilms grown on different concentrations of agar substrates. These measurements include the shear modulus of the substrate and the biofilm, the thickness of the biofilm and the residual layer, and the wavelength of the biofilm surface pattern.
- https://doi.org/10.7554/eLife.43920.044
-
Transparent reporting form
- https://doi.org/10.7554/eLife.43920.045
Download links
A two-part list of links to download the article, or parts of the article, in various formats.
Downloads (link to download the article as PDF)
Open citations (links to open the citations from this article in various online reference manager services)
Cite this article (links to download the citations from this article in formats compatible with various reference manager tools)
Mechanical instability and interfacial energy drive biofilm morphogenesis
eLife 8:e43920.
https://doi.org/10.7554/eLife.43920


