Dynamic repression by BCL6 controls the genome-wide liver response to fasting and steatosis
- Northwestern University, United States
- Case Western Reserve University, United States
- Jesse Brown VA Medical Center, United States
Figures
Figure 1 with 2 supplements
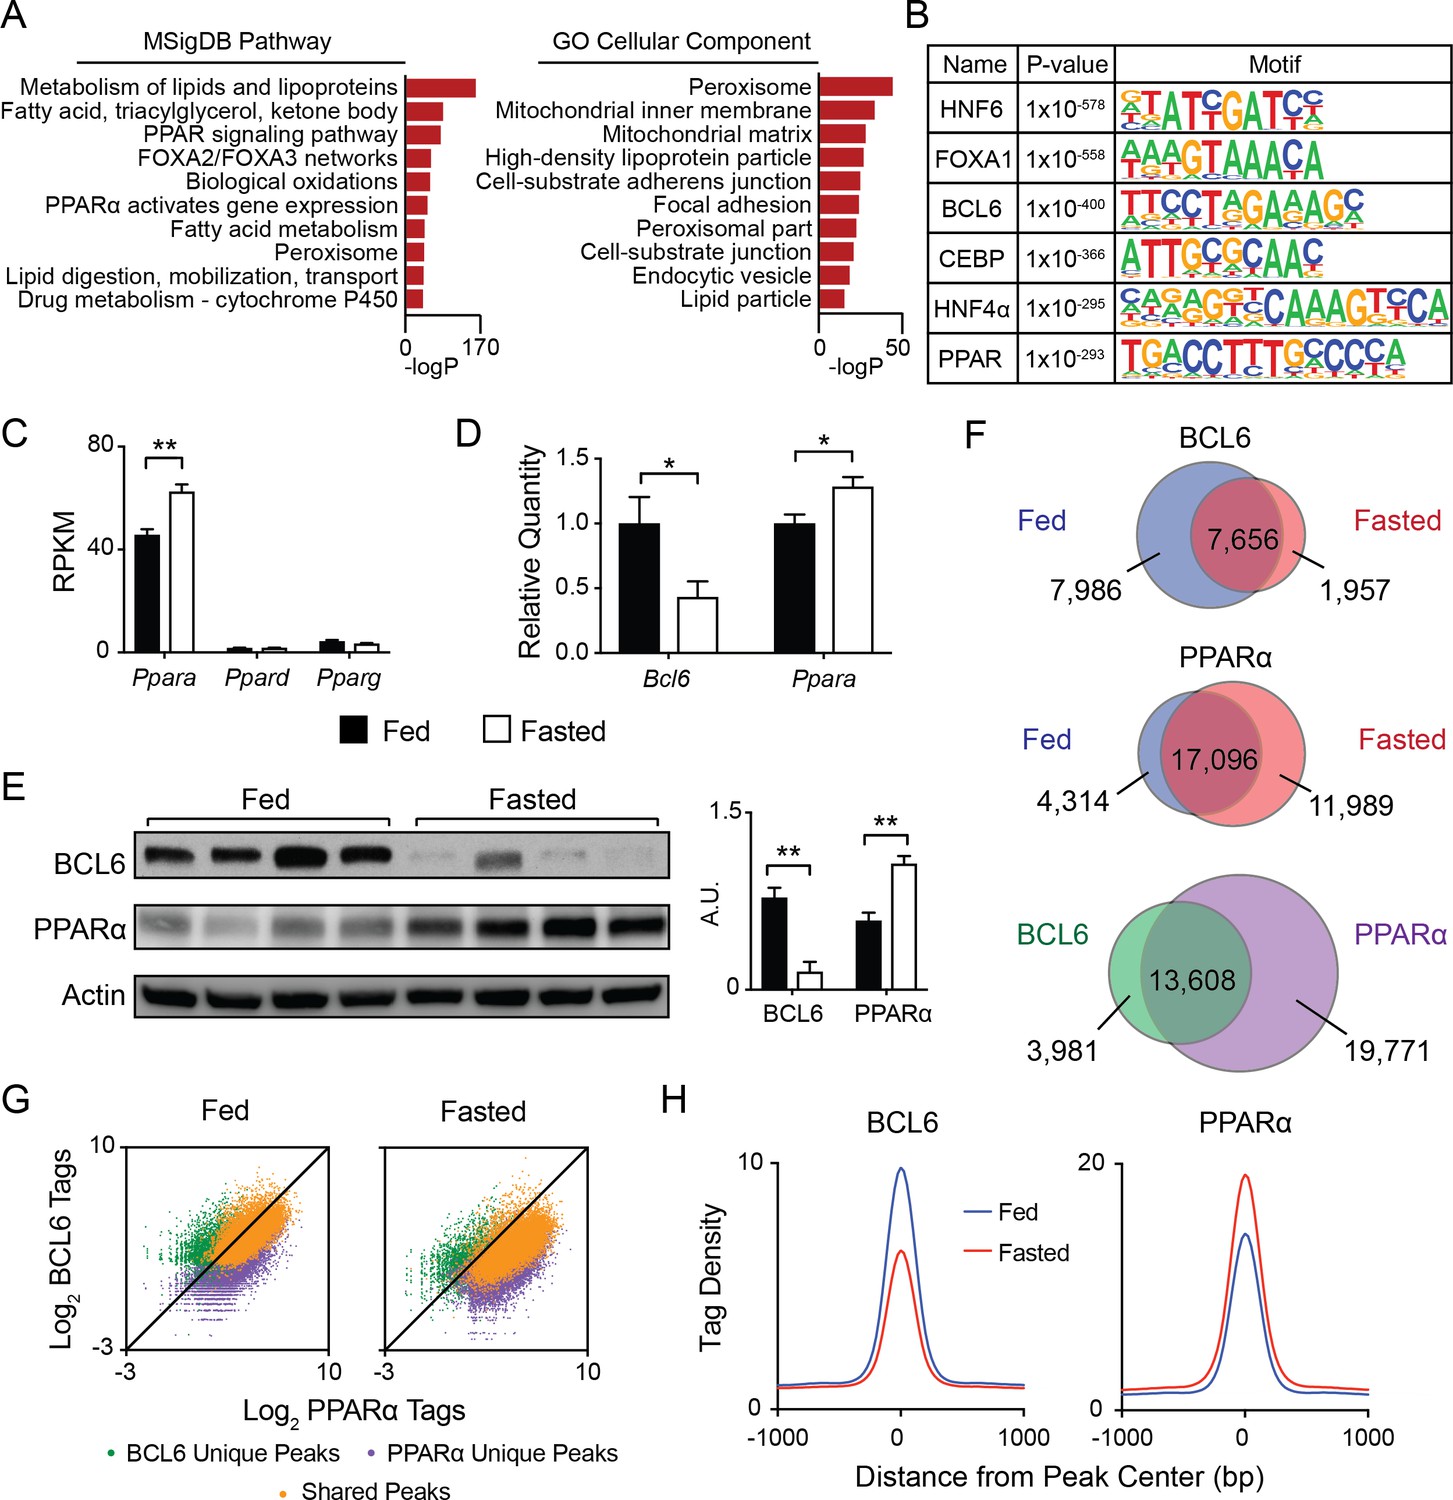
BCL6 converges with PPARα at fasting-regulated lipid genes.
(A) MSigDB Pathway and Gene Ontology (GO) Cellular Compartment analysis of BCL6 ChIP-seq binding sites. (B) Motif enrichment analysis of BCL6-bound regions. (C) Gene expression as measured by reads per kilobase of transcript per million reads (RPKM) of Ppara, Ppard, and Pparg in control (Bcl6fl/fl) mouse liver samples. N = 4 per group. (D) qPCR of Bcl6 and Ppara in fed and fasted Bcl6fl/fl mouse livers. N = 6–7 per group. (E) Western blot analysis of BCL6 and PPARα protein levels in ad libitum fed and overnight fasted C57BL/6 mouse livers. Densitometry normalized to actin levels is shown (right). (F) Venn diagrams comparing liver ChIP-seq peaks from ad libitum and overnight fasted mice using antibodies against BCL6 (top) and PPARα (middle). Overlap between combined fed and fasted BCL6 and PPARα binding sites (based on a distance between peak centers of <200 bp) is shown (bottom). ChIPs were performed in biological triplicates. (G) BCL6 and PPARα ChIP-seq tag densities at BCL6 unique, PPARα unique, or shared BCL6-PPARα peaks in fed and fasted states. (H) BCL6 (left) and PPARα (right) tag densities at BCL6-PPARα shared peaks in fed or fasted livers. N = 3 per group. A two-tailed Student’s t-test assuming equal variance was used to compare mean values between two groups. Data are represented as mean ±SEM. ∗p<0.05, ∗∗p<0.01, ∗∗∗p<0.001.
Figure 1—figure supplement 1
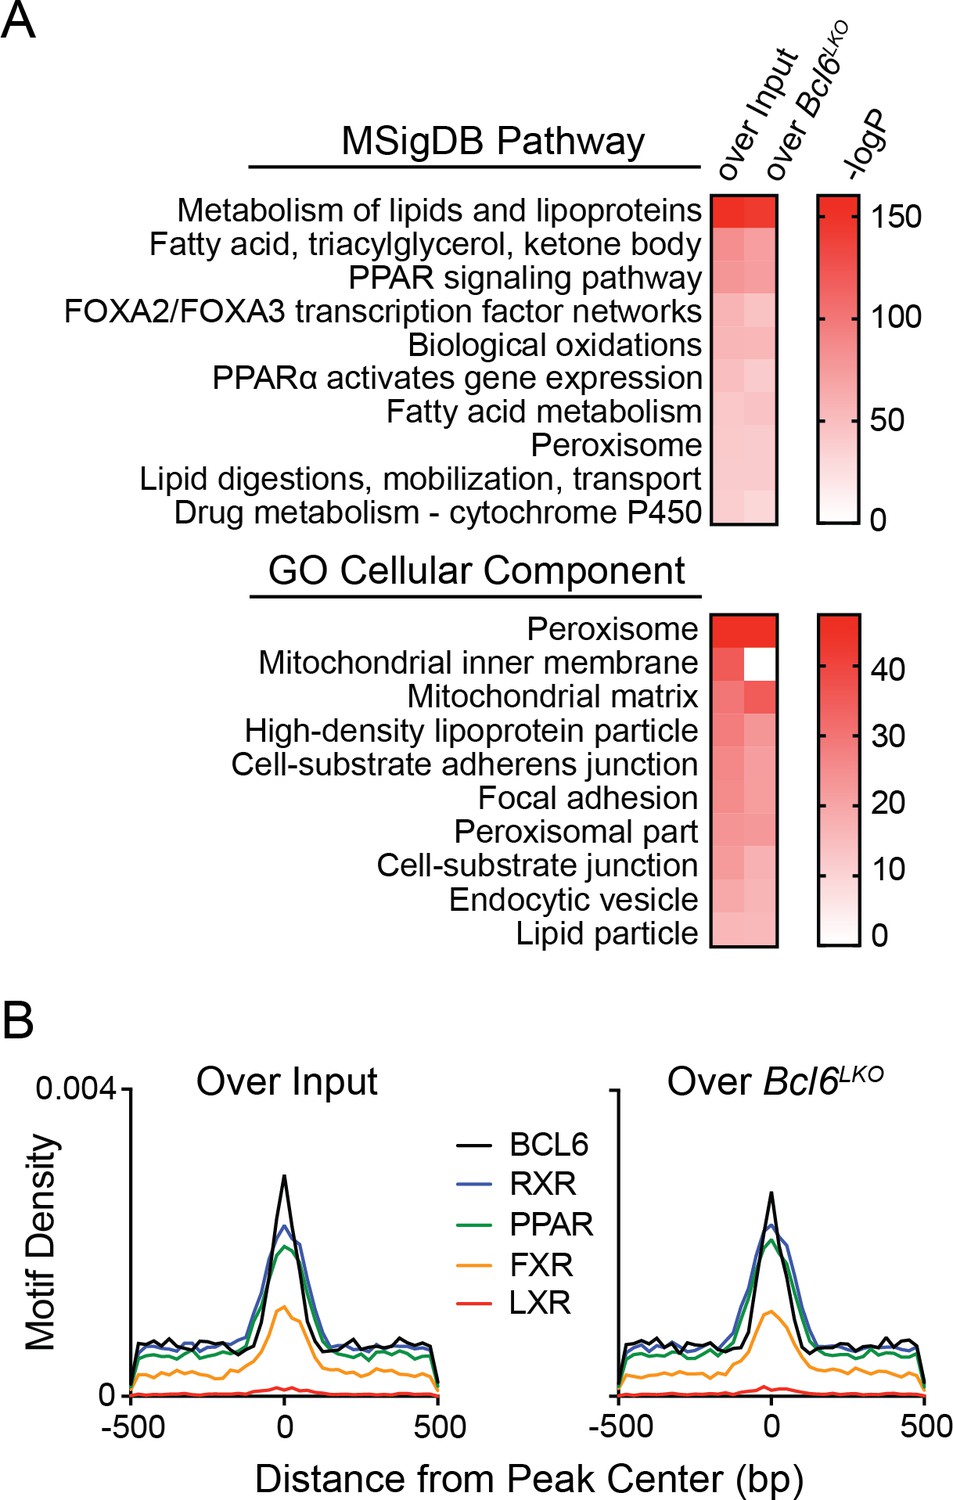
BCL6 liver ChIP-seq reflects binding events specific to hepatocytes.
(A, B) MSigDB Pathway/Gene Ontology analysis (A) and motif densities (B) for BCL6 ChIP-seq peaks identified in wild-type livers, as determined by enrichment over input chromatin or over BCL6 ChIP-seq in Bcl6LKO liver samples.
Figure 1—figure supplement 2
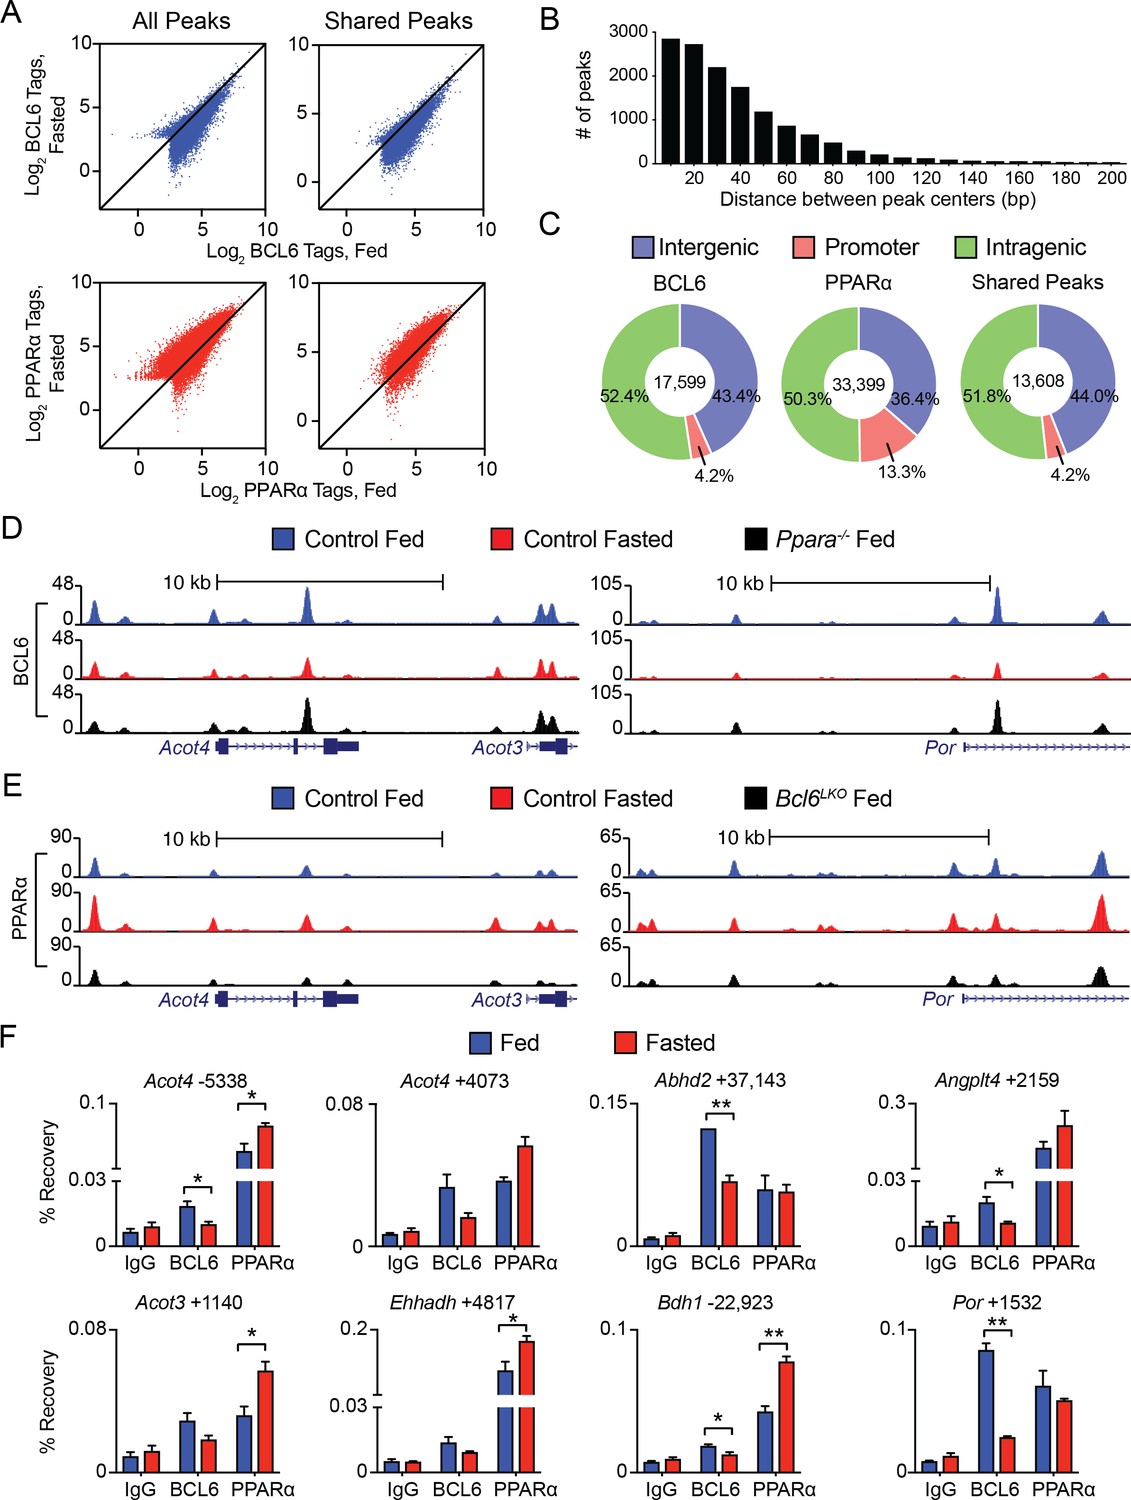
BCL6 and PPARα reciprocally bind to shared regulatory regions near fasting genes.
(A) Fed and fasted BCL6 (top) and PPARα (bottom) ChIP-seq tag densities at all respective sites (left panel) or at shared sites (right panel). (B) Histogram of distances between BCL6 and PPARα peak centers; distances < 200 bp are shown. Bin width is 10 bp. (C) Genome-wide distributions of BCL6, PPARα, and shared BCL6-PPARα ChIP-seq peaks at intergenic, promoter, and intragenic regions. (D,E) UCSC genome browser tracks for ChIP-seq of BCL6 (D) or PPARα (E) in control fed (blue), control fasted (red), and genetic knockout samples as indicated in legend (black). (F) ChIP-qPCR using pre-immune IgG, BCL6, and PPARα antibodies at shared BCL6-PPARα binding sites in fed and fasted livers. Enriched regions are located at the indicated distance (in base pairs) away from the TSS of specified genes. ChIPs were performed in technical duplicates and biological triplicates. A two-tailed Student’s t-test assuming equal variance was used to compare mean values between two groups. Data are represented as mean ±SEM. ∗p<0.05, ∗∗p<0.01, ∗∗∗p<0.001.
Figure 2 with 1 supplement
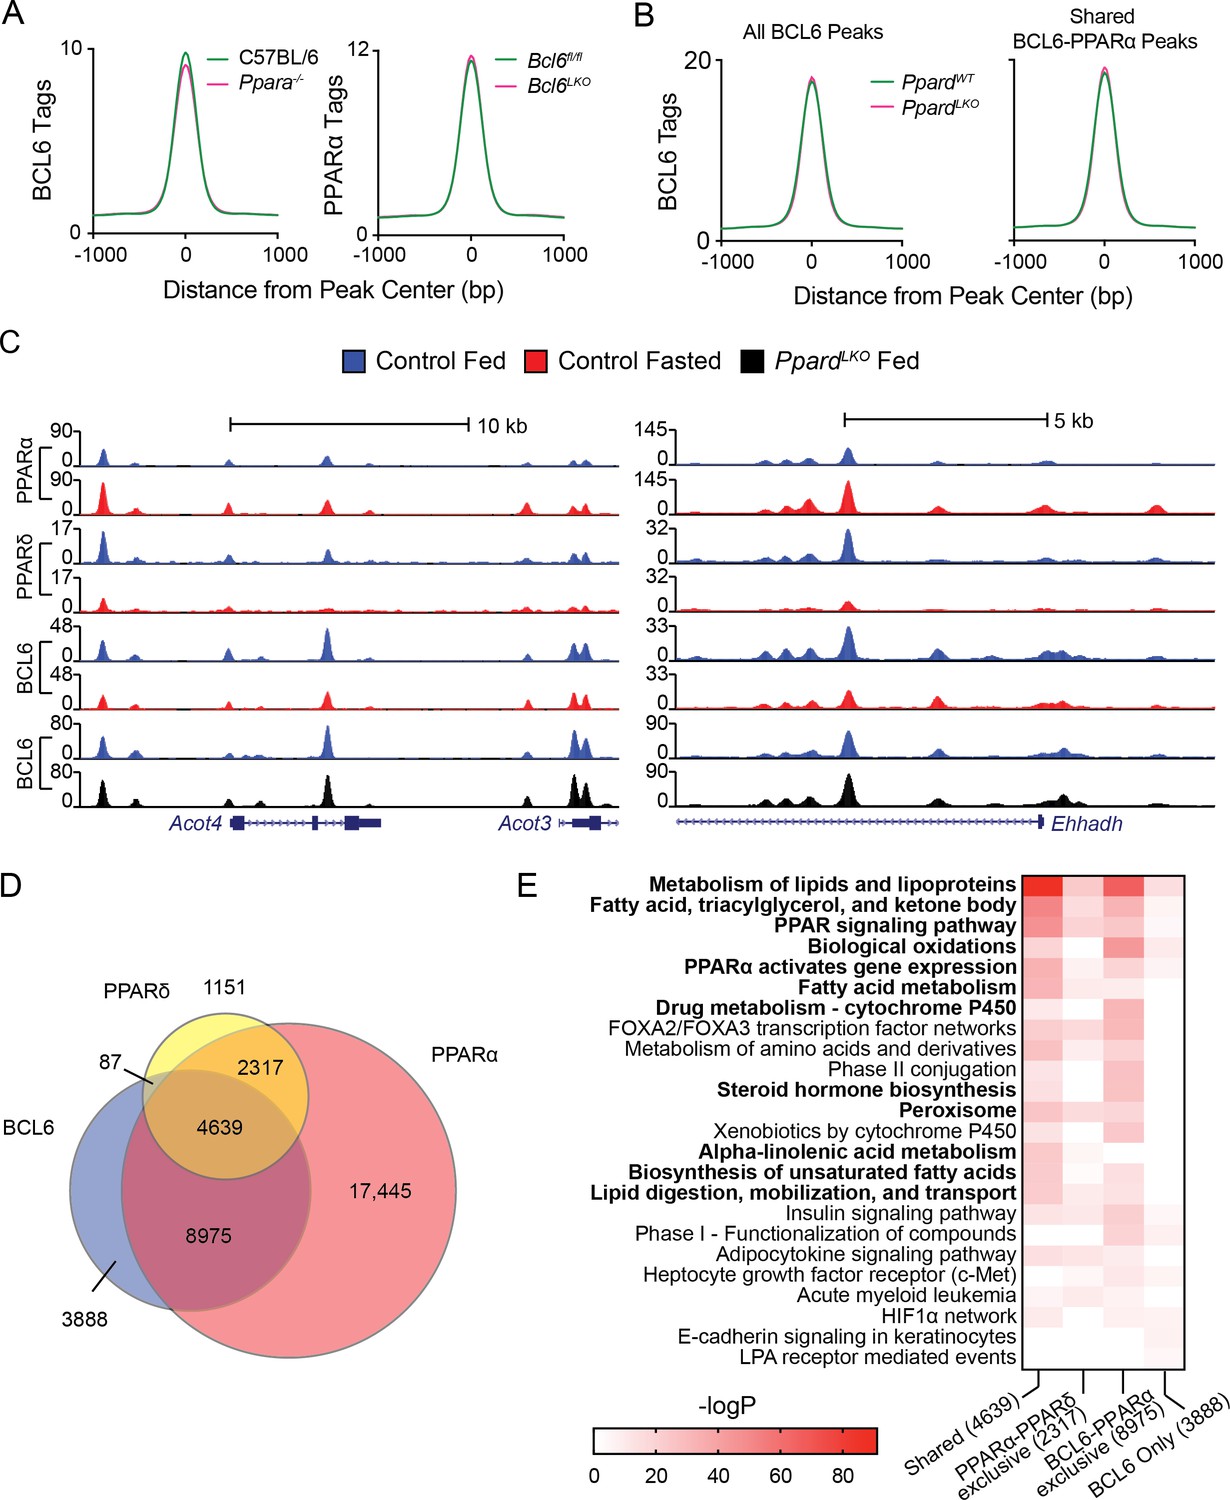
BCL6 genome-wide DNA binding is independent of PPARα and PPARδ.
(A) BCL6 ChIP-seq tag densities in C57BL/6 and Ppara-/- livers at shared BCL6-PPARα peaks (left). PPARα tag density in Bcl6fl/fl and Bcl6LKO livers at shared BCL6-PPARα peaks (right). (B) BCL6 tag densities in control and PpardLKO mouse livers at all BCL6 peaks (left) or shared BCL6-PPARα peaks (right), N = 2 per group. (C) UCSC genome browser tracks showing PPARα, PPARδ, and BCL6 ChIP-seq in control fed livers (blue), control fasted livers (red), or PpardLKO livers (black). (D) Venn diagram showing overlap of PPARδ, BCL6, and PPARα cistromes in mouse liver. Cistromes for each factor include peaks identified in either fed or fasted livers. Peaks were considered overlapping if peak centers were within 200 bp. ChIPs were performed in biological triplicates. (E) Gene ontology enrichment for binding regions common among BCL6, PPARα, and PPARδ (Shared); exclusive to PPARα and PPARδ (PPARα-PPARδ); exclusive to BCL6 and PPARα (BCL6-PPARα); or exclusive to BCL6 (BCL6 only).
Figure 2—figure supplement 1
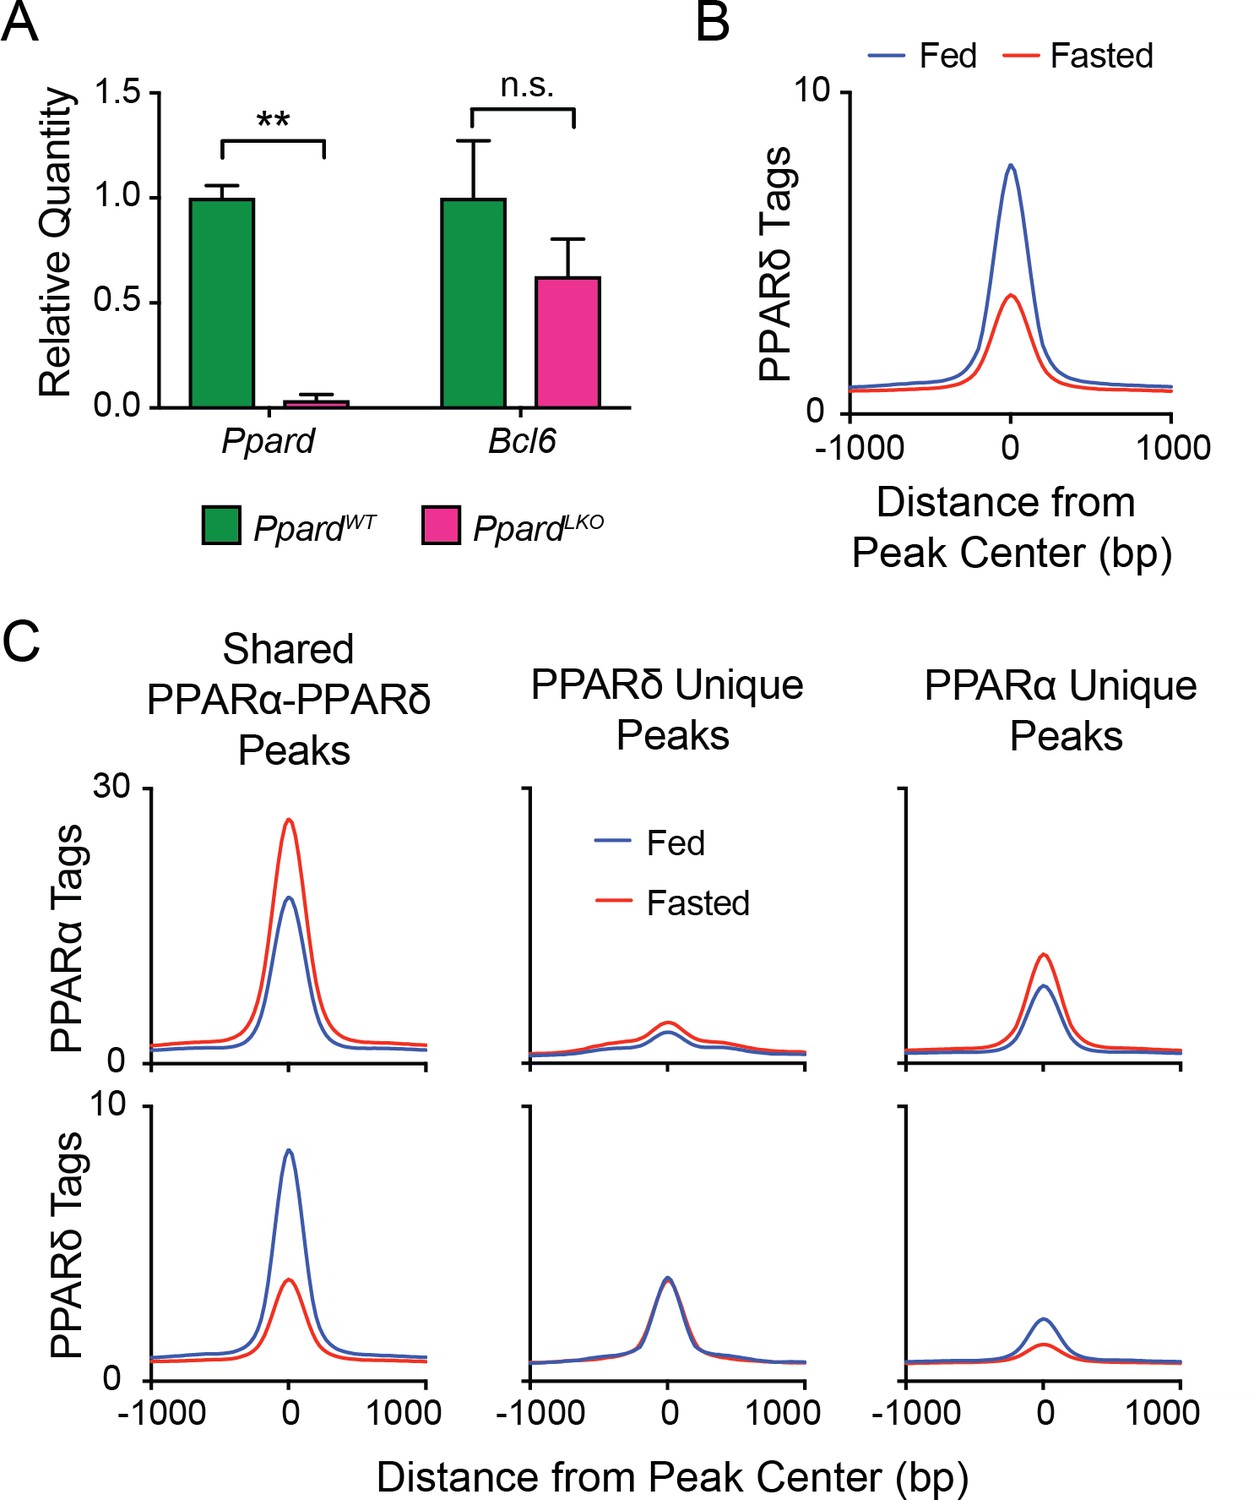
PPARα and PPARδ compete for binding at shared sites.
(A) qPCR gene expression of Ppard and Bcl6 genes in control (PpardWT) and PpardLKO mouse livers. N = 2 per group. (B) PPARδ tag densities in fed or fasted mouse livers at all PPARδ peaks. N = 3 per group. (C) PPARα (top panel) and PPARδ (bottom panel) tag densities in fed and fasted livers at PPARα-PPARδ overlapping peaks (left panel), PPARδ unique peaks (middle panel) or PPARα unique peaks (right panel). N = 3 per group. A two-tailed Student’s t-test assuming equal variance was used to compare mean values between two groups. Data are represented as mean ±SEM. ∗p<0.05, ∗∗p<0.01, ∗∗∗p<0.001.
Figure 3 with 2 supplements
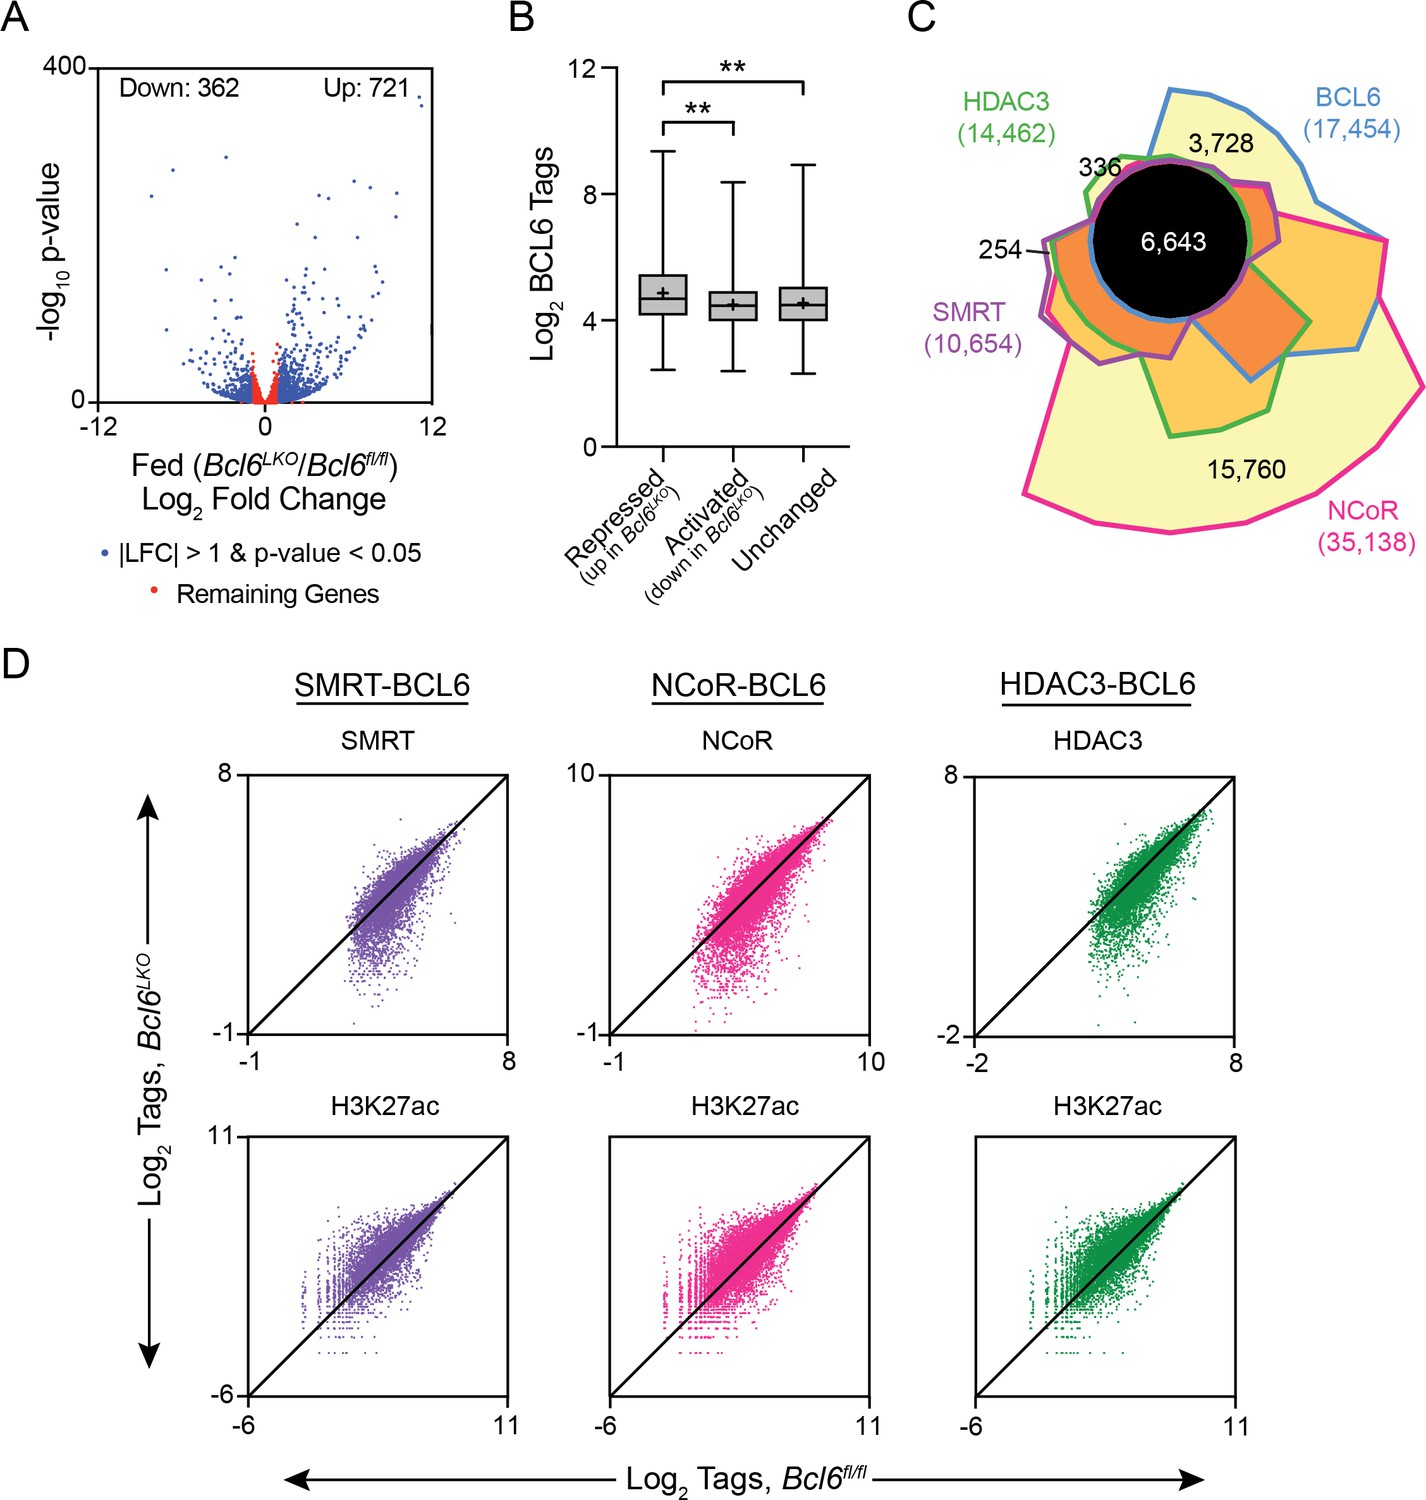
BCL6 complexes with SMRT/NCoR-HDAC3 to reduce H3K27ac and represses transcription.
(A) Volcano plots showing log2 fold change (LFC) in expression of fed Bcl6LKO over Bcl6fl/fl livers. Blue dots represent |LFC| greater than one with an adjusted p-value less than 0.05. Red dots represent remaining expressed genes. N = 4 per group. (B) BCL6 tags in control livers at BCL6 peaks near BCL6-activated, -repressed, or -unchanged genes. Box plots display interquartile range (box), median (horizontal black line), mean (black ‘+’), and min to max (whiskers). (C) Four-way Venn diagram comparing ad lib fed control BCL6, SMRT, NCoR and HDAC3 ChIP-seq peak sets. (D) Tag density of H3K27ac, SMRT, NCoR, and HDAC3 ChIP-seq in Bcl6fl/fl and Bcl6LKO livers at respective cofactor peaks co-bound with BCL6. ChIPs were performed in biological triplicates. For (B), a one-way ANOVA and Tukey’s post-hoc testing was used to compare tag density between groups. ∗p<1×10⁻³, ∗∗p<1×10⁻⁶, ∗∗∗p<1×10⁻⁹, ∗∗∗∗p<1×10⁻¹².
Figure 3—figure supplement 1

Bcl6LKO mice exhibit efficient protein and mRNA reductions of BCL6.
(A) qPCR analysis of Bcl6 in Bcl6fl/fl and Bcl6LKO livers. N = 7 per group. (B) Western blots of BCL6 protein in Bcl6fl/fl and Bcl6LKO livers. Densitometric quantification is shown normalized to MemCode membrane staining (bottom). A two-tailed Student’s t-test assuming equal variance was used to compare mean expression between samples. Data are represented as mean ±SEM. ∗p<0.05, ∗∗p<0.01, ∗∗∗p<0.001.
Figure 3—figure supplement 2

SMRT, NCoR, and HDAC3 are recruited to chromatin by BCL6 in liver.
(A) Enriched motifs for SMRT, NCoR and HDAC3 binding sites. For each corepressor, enriched motifs are shown in all peaks (all), peaks shared with BCL6 (BCL6 shared), and BCL6-exclusive peaks (Unique). Unique peaks were used as background for BCL6 shared motif discovery; conversely, Shared peaks were used as background for Unique peak motif discovery. (B) H3K27ac, HDAC3, SMRT, and NCoR ChIP-seq tags in Bcl6fl/fl and Bcl6LKO livers at respective cofactor peaks co-bound by BCL6 peaks. Box plots display interquartile range (box), median (horizontal line), mean (black ‘+’), and min to max (whiskers). Mann-Whitney test was used to compare tags between genotypes. ∗p<1×10⁻³, ∗∗p<1×10⁻⁶, ∗∗∗p<1×10⁻⁹, ∗∗∗∗p<1×10⁻¹².
Figure 4 with 2 supplements
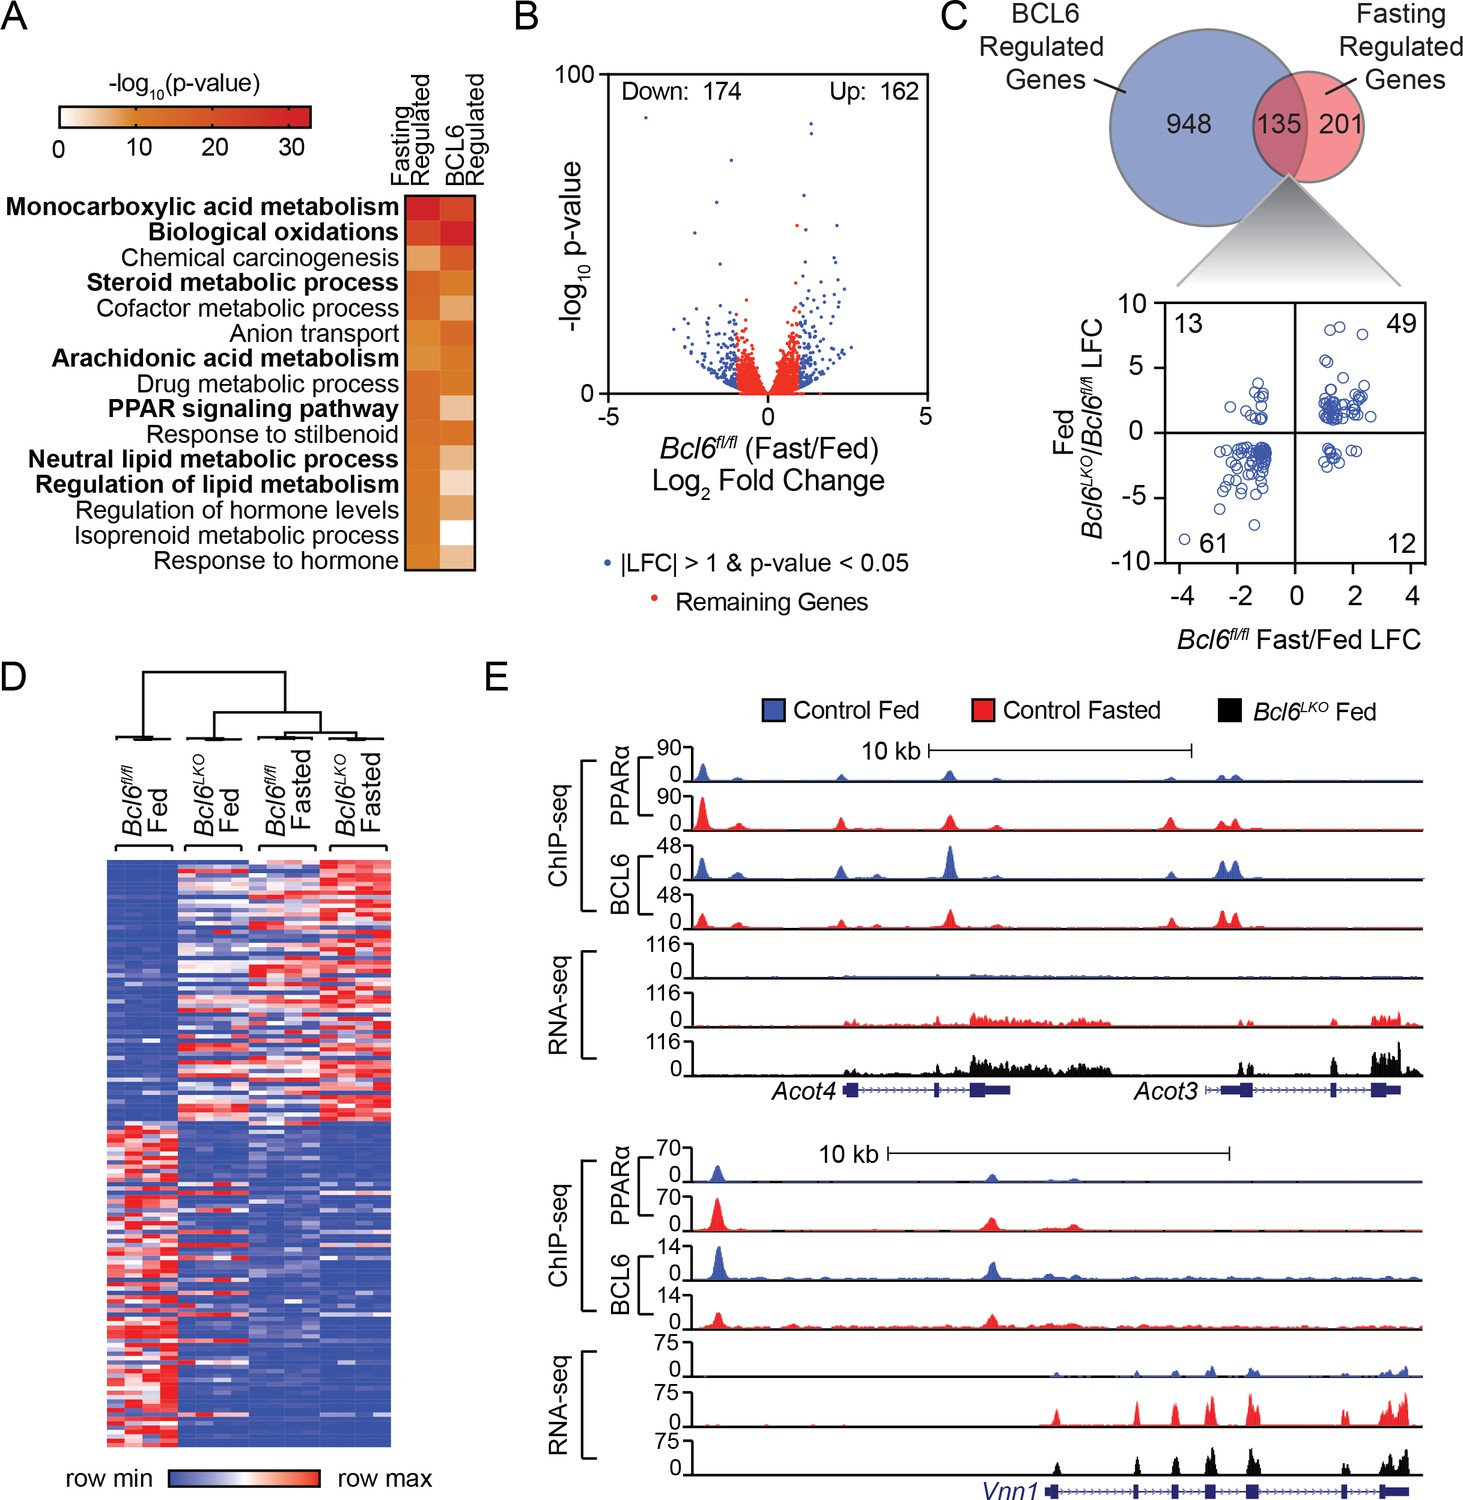
Bcl6 deletion de-represses a fasting liver gene program.
(A) Pathway enrichment analysis for genes differentially expressed (|LFC| greater than one and an adjusted p-value less than 0.05) with fasting or Bcl6 deletion in liver. (B) Volcano plots showing log2 fold change (LFC) in expression of Bcl6fl/fl fasted over fed. Blue dots represent |LFC| greater than one with an adjusted p-value less than 0.05. Red dots represent remaining expressed genes. N = 4 per group. (C) Venn diagram comparing differentially expressed genes with fasting or Bcl6 deletion (top panel). Comparison of LFC between fed (Bcl6LKO/Bcl6fl/fl) (y-axis) and Bcl6fl/fl (fasted/fed) (x-axis) for genes differentially expressed by both fasting and Bcl6 deletion is shown (bottom panel). (D) Hierarchical clustering heatmap of RPKM values in fed and fasted Bcl6fl/fl and Bcl6LKO samples for genes regulated by both fasting and Bcl6 deletion. N = 4 per group. (E) UCSC genome browser tracks of BCL6 and PPARα ChIP-seq and RNA-seq data at PPARα-regulated genes, Acot4/3 and Vnn1 in control fed (blue), control fasted (red), and Bcl6LKO fed (black) livers.
Figure 4—figure supplement 1

BCL6 deletion mimics the fasting gene program.
(A) Clustered heatmap of a distance matrix across fed and fasted Bcl6fl/fl and Bcl6LKO RNA-seq samples at genes differentially expressed with fasting. N = 4 per group. (B) Gene ontology analysis for transcripts differentially expressed both with fasting and Bcl6 deletion (135 genes). (C) qPCR analysis of PPARα- and fasting-regulated transcripts in livers of fed and fasted Bcl6fl/fl and fed Bcl6LKO mice, N = 6–7 per group. A two-tailed Student’s t-test assuming equal variance was used to compare mean expression between fasted Bcl6fl/fl or fed Bcl6LKO and control Bcl6fl/fl animals. Data are represented as mean ±SEM. ∗p<0.05, ∗∗p<0.01, ∗∗∗p<0.001.
Figure 4—figure supplement 2
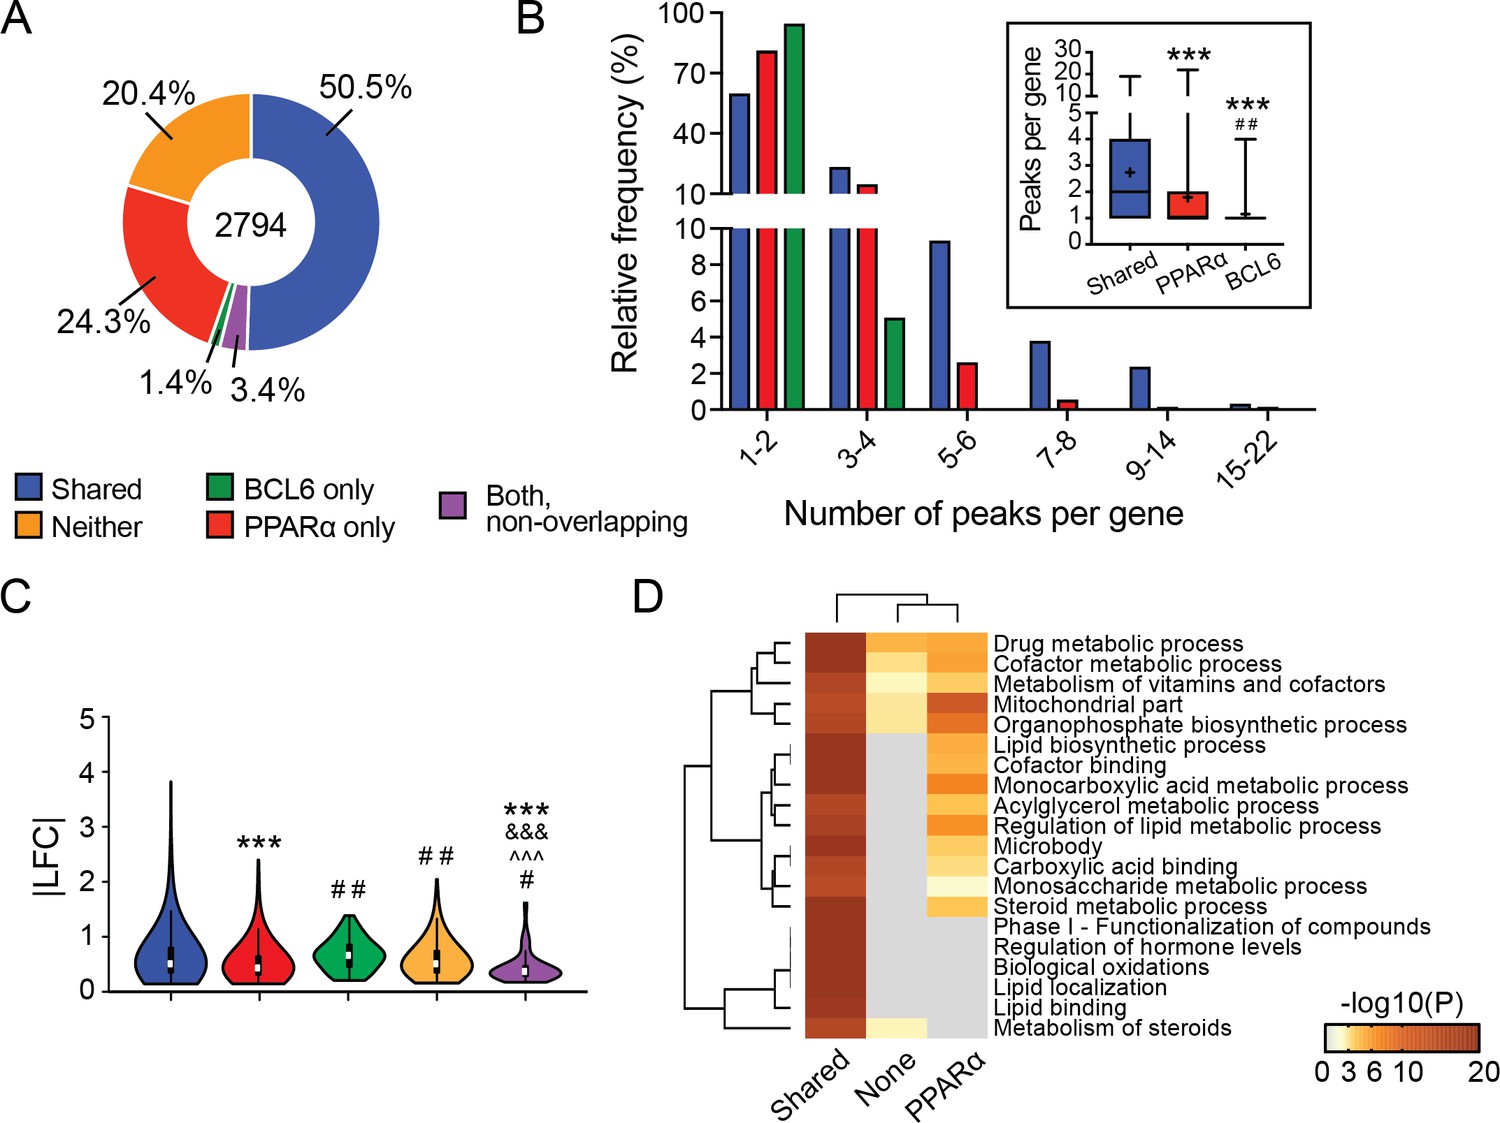
The BCL6-PPARα regulatory module clusters along dynamic fasting genes.
(A) Distribution of fasting genes annotated with BCL6 and/or PPARα binding peaks. Differential fasting genes here include all significantly different genes with fasting (adjusted p-value<0.05). (B) Histogram showing the frequency of shared BCL6-PPARα peaks, PPARα only peaks, and BCL6 only peaks per fasting-regulated gene. Inset shows box plots of peaks per gene, denoting interquartile range (colored box), median (horizontal black line), mean (black ‘+’), and min to max (whiskers). (C) Absolute value of log2 fold change (|LFC|) in expression of genes differentially expressed with fasting (adjusted p-value<0.05) with a nearby shared BCL6-PPARα peak; PPARα only peak; BCL6 only peak; non-overlapping BCL6 and PPARα peaks; or no BCL6 or PPARα peak (neither). Violin plots display median (white square), interquartile range (black rectangle), 95% confidence interval (black line), and frequency (colored density plot). For (B) and (C), the Kruskal-Wallis test and Dunn’s post-hoc testing were used to compare significant differences between groups. ∗p<0.05, ∗∗p<0.01, ∗∗∗p<0.001 compares to genes with a nearby shared BCL6-PPARα peak. Similarly, ‘#’ denotes comparison to PPARα only, ‘ and ’ denotes comparison to BCL6 only, and ‘^’ denotes comparison to neither. (D) Metascape gene enrichment and clustering analysis of genes differentially expressed with fasting that have an annotated shared BCL6-PPARα peak; PPARα only peak; or neither.
Figure 5 with 2 supplements
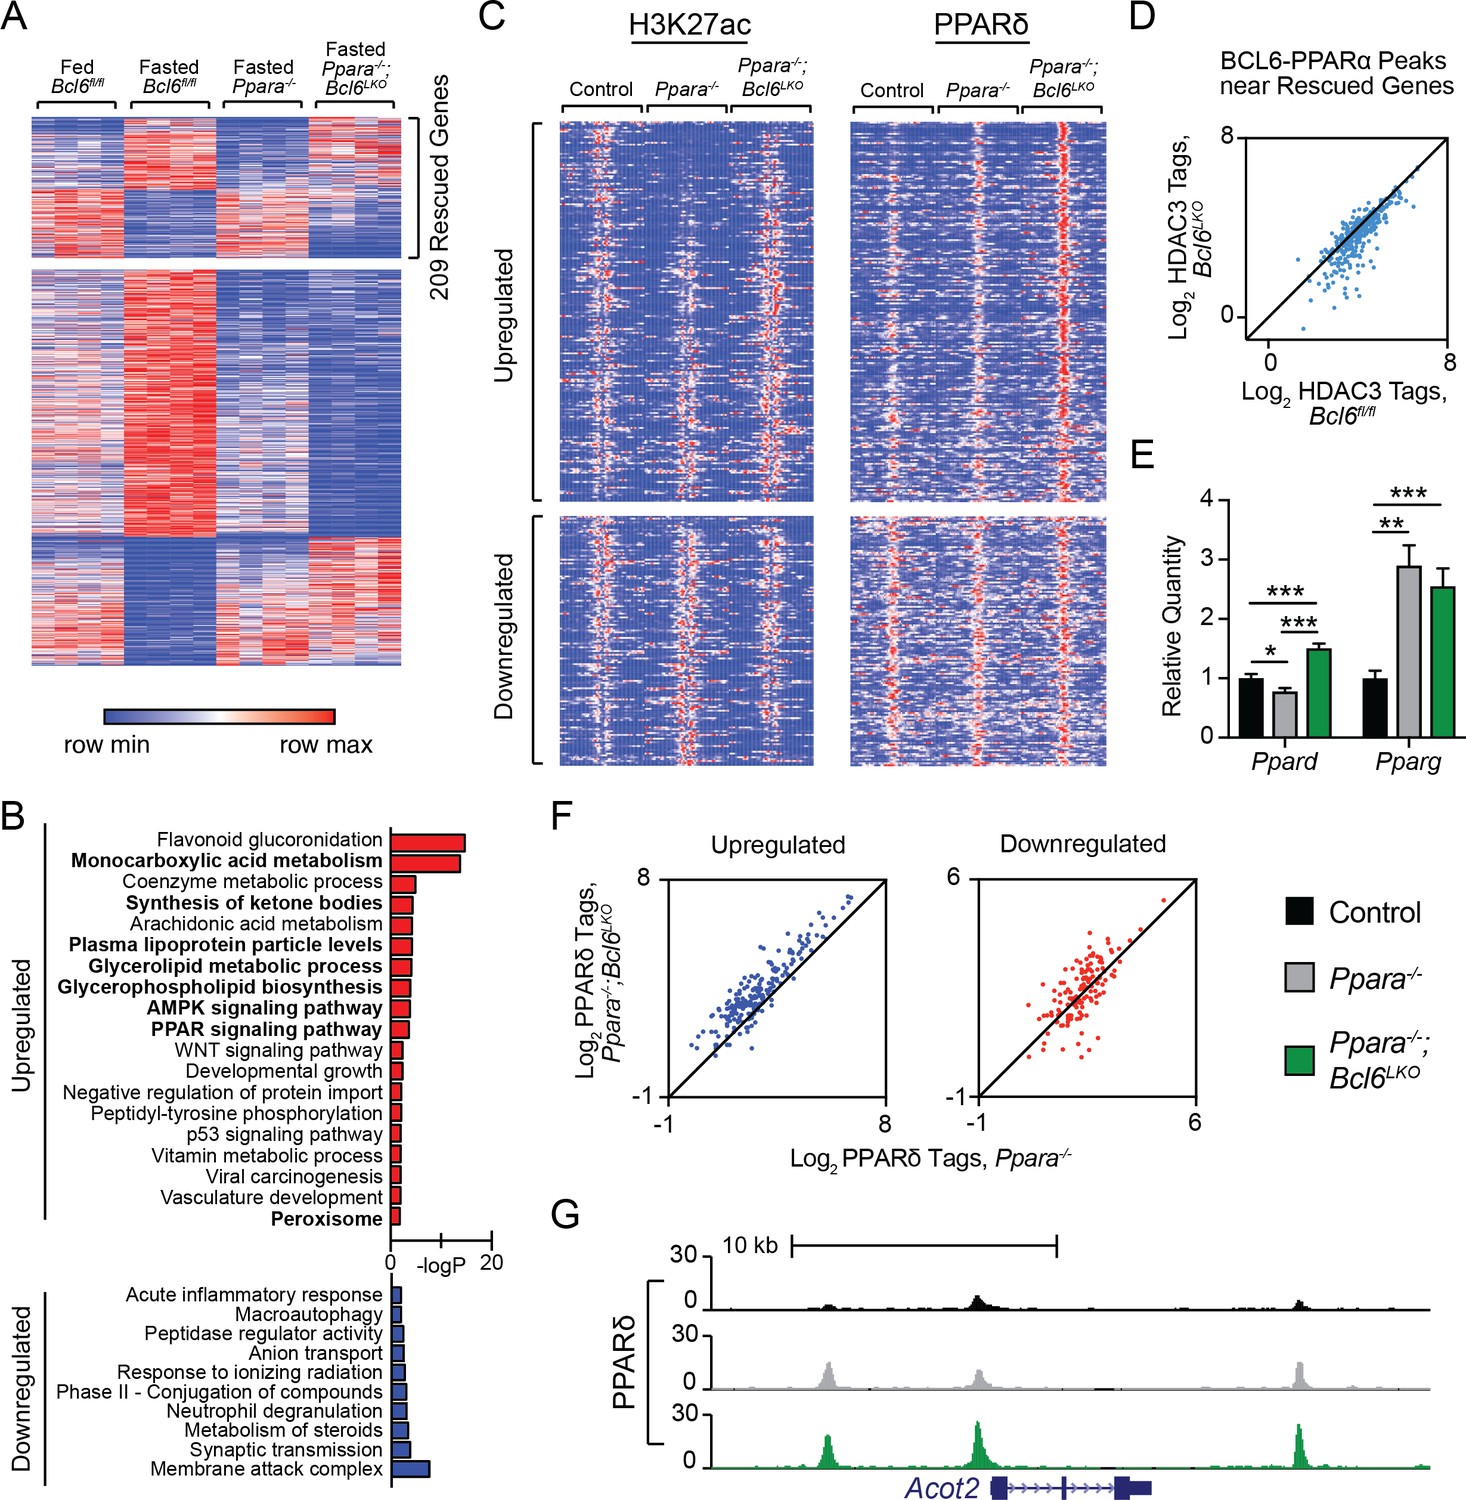
Bcl6 ablation reduces HDAC3 activity and promotes PPARδ binding in Ppara-/- mice at rescued genes.
(A) Heatmap of RPKM values at fasting-regulated genes that are dysregulated in Ppara-/- mice. 209 genes have partially or completely restored expression upon fasting in Ppara-/-;Bcl6LKO mice. N = 4 per group. (B) Gene ontologies of upregulated (top) and downregulated (bottom) fasting genes restored in Ppara-/-;Bcl6LKO mice. (C) Heatmap of H3K27ac and PPARδ ChIP-seq in fasted control Bcl6fl/fl, Ppara-/-, and Ppara-/-;Bcl6LKO mice at BCL6-PPARα shared peaks that annotate to rescued Ppara-/- dysregulated genes in Ppara-/-;Bcl6LKO mice. N = 3 per group. (D) HDAC3 ChIP-seq tag density in Bcl6fl/fl and Bcl6LKO livers at BCL6-PPARα shared peaks near rescued fasting genes. (E) qPCR of Ppard and Pparg in fasted control, Ppara-/-, and Ppara-/-;Bcl6LKO mice. N = 5–6 per group. (F) PPARδ tag density at rescued upregulated (left) and downregulated (right) fasting genes in fasted Ppara-/-;Bcl6LKO and Ppara-/- livers. ChIP was performed in biological triplicate. (G) UCSC genome browser track of PPARδ ChIP-seq at Acot2. In (E), a one-way ANOVA and Holm-Sidak’s post-hoc testing was used to compare mean expression between groups. ∗p<0.05, ∗∗p<0.01, ∗∗∗p<0.001.
Figure 5—figure supplement 1

BCL6 deletion in Ppara-/- mice restores fasting gene expression.
qPCR analysis of PPARα- and fasting-regulated transcripts in overnight fasted Bcl6fl/fl, Ppara-/-, and Ppara-/-;Bcl6LKO mouse livers, N = 5–6 per group. A one-way ANOVA and Holm-Sidak’s post-hoc testing was used to compare mean expression between groups. ∗p<0.05, ∗∗p<0.01, ∗∗∗p<0.001.
Figure 5—figure supplement 2
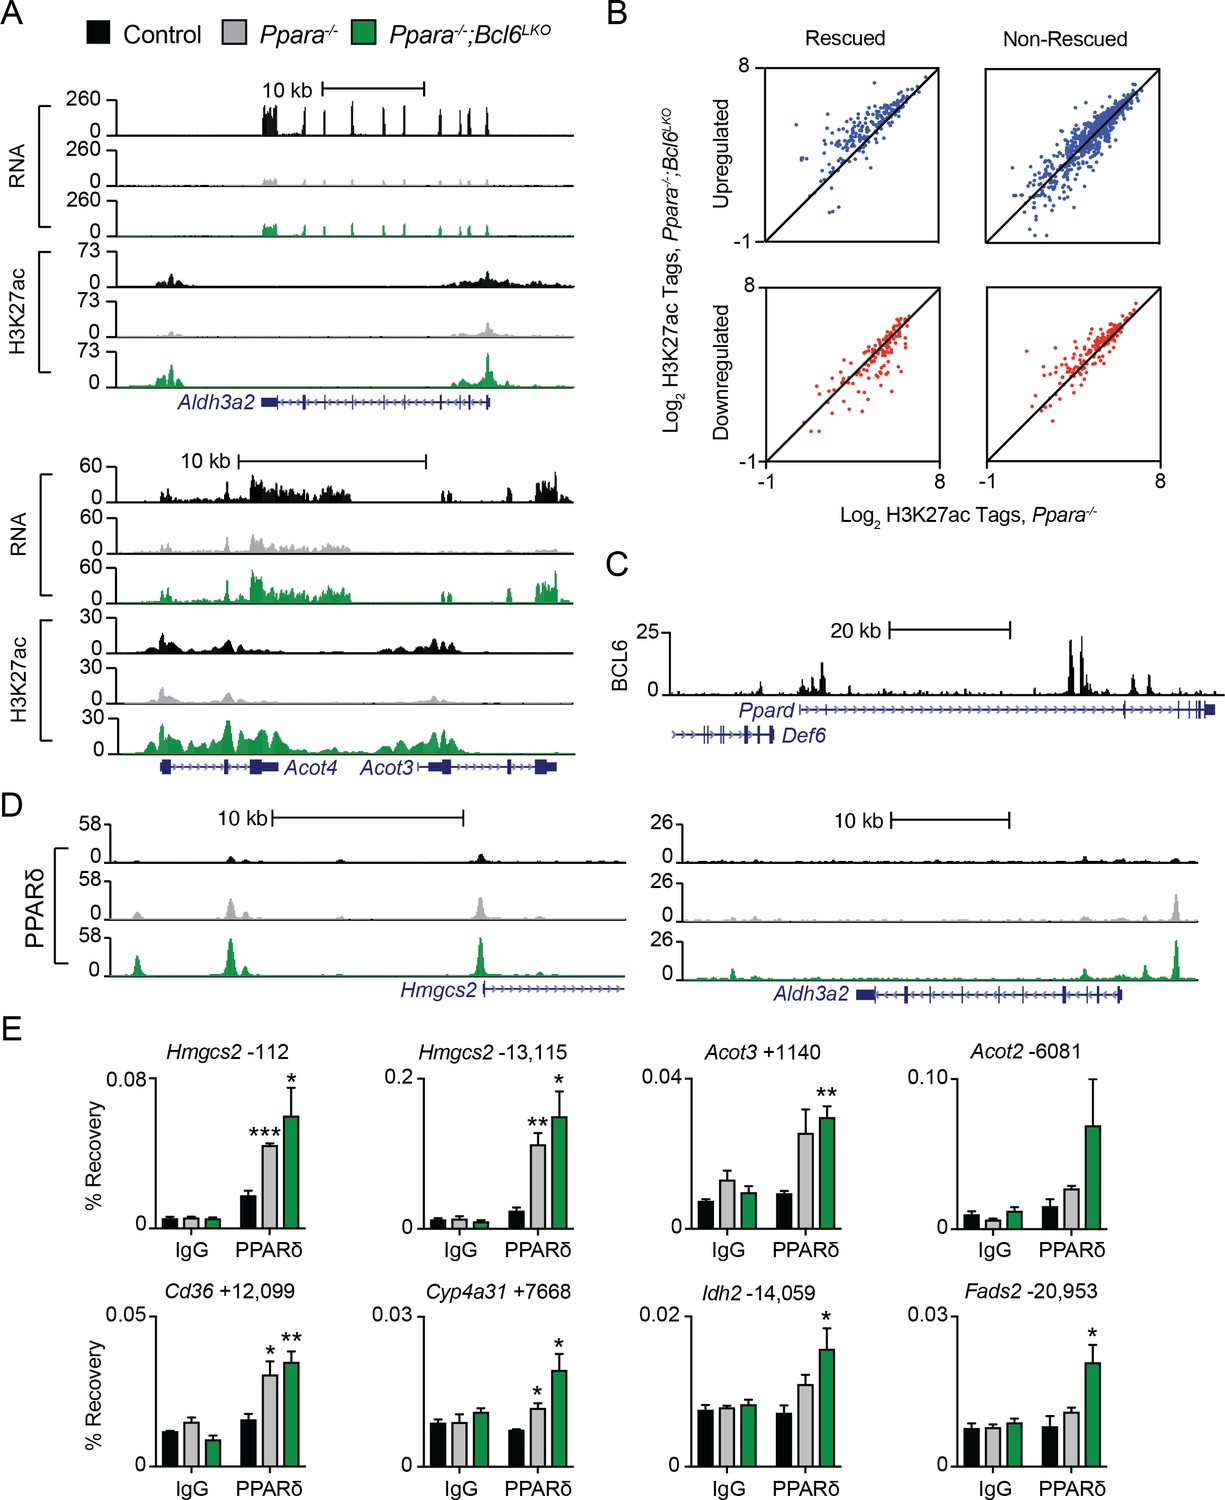
Bcl6 deletion is linked to enhanced PPARδ binding in fasted Pparα-/- mice.
(A–B) UCSC genome browser tracks showing (A) RNA-seq and H3K27ac ChIP-seq data in fasted control Bcl6fl/fl, Ppara-/-, and Ppara-/-;Bcl6LKO livers at Aldh3a2 and Acot4/3. (B) H3K27ac tags in Ppara-/-;Bcl6LKO and Ppara-/- at up- and down-regulated rescued (left panel) or non-rescued genes (right panel). (C) UCSC genome browser track of BCL6 binding along Ppard. (D) UCSC genome browser tracks showing PPARδ binding at rescued genes Hmgcs2 and Aldh3a2. (E) ChIP-qPCR using pre-immune IgG and PPARδ antibodies at shared BCL6-PPARα-binding sites near rescued genes in fasted control, Ppara-/-, and Ppara-/-;Bcl6LKO livers. Enriched regions are located at the indicated distance (in base pairs) away from the TSS of specified genes. ChIPs were performed in technical duplicates and biological triplicates. For (E) a two-tailed Student’s t-test assuming equal variance was used to compare mean PPARδ IP values between Ppara-/- or Ppara-/-; Bcl6LKO and control. Data are represented as mean ±SEM. ∗p<0.05, ∗∗p<0.01, ∗∗∗p<0.001.
Figure 6 with 1 supplement

Bcl6 deletion enhances fatty acid oxidation and ameliorates steatosis.
(A) Serum β-hydroxybutyrate levels were measured in mice over the course of a 48 hr fast. N = 8–12 per group. (B) Rates of 14C-palmitate oxidation in Bcl6fl/fl and Bcl6LKO liver homogenates measured in CO2 and acid soluble fractions. N = 3 per group. (C) In vivo lipid uptake quantified by bodipy C16 assays in Bcl6fl/fl and Bcl6LKO mice. N = 7 per group. (D) Lipid secretion measured by serum triglyceride sampling over time after injecting Bcl6fl/fl and Bcl6LKO mice with Poloxomer. N = 11–13 per group. (E) In vivo palmitate and stearate synthesis determined by 2H incorporation in Bcl6fl/fl and Bcl6LKO livers. N = 8–10 per group. (F) Oil red O staining in livers, (G) biochemical quantification of liver triglycerides, and (H) % change in body weight in Bcl6fl/fl and Bcl6LKO mice following 19 weeks on 45% high fat diet. N = 7–11 per group. (I) Oil red O staining in livers and (J) biochemical quantification of liver triglycerides from Ppara-/- and Ppara-/-;Bcl6LKO mice following a 48 hr fast. N = 16–18 per group. (K) Rates of 14C-palmitate oxidation in Ppara-/- and Ppara-/-;Bcl6LKO liver homogenates measured in CO2 and acid soluble fractions. N = 4–5 per group. (L) Serum β-hydroxybutyrate levels were measured in mice over the course of a 48 hr fast. N = 8–17 per group. A two-tailed Student’s t-test assuming equal variance was used to compare means between two groups. Data are represented as mean ±SEM. ∗p<0.05, ∗∗p<0.01, ∗∗∗p<0.001.
Figure 6—figure supplement 1

Mice lacking hepatic Bcl6 have improved insulin sensitivity after high-fat diet.
(A–B) Overnight fasted serum (A) glucose and (B) insulin in Bcl6fl/fl and Bcl6LKO mice after 17 weeks of high-fat diet. N = 6–9 per group. (C) Western blots showing phosphorylated AKT (pAKT) and total AKT (panAKT) protein levels following injection of insulin in Bcl6fl/fl and Bcl6LKO livers. MemCode membrane staining is used as the loading control. Densitometric analysis shows ratio of pAKT over panAKT (right). Data are represented as mean ±SEM. ∗p<0.05, ∗∗p<0.01, ∗∗∗p<0.001.
Author response image 1
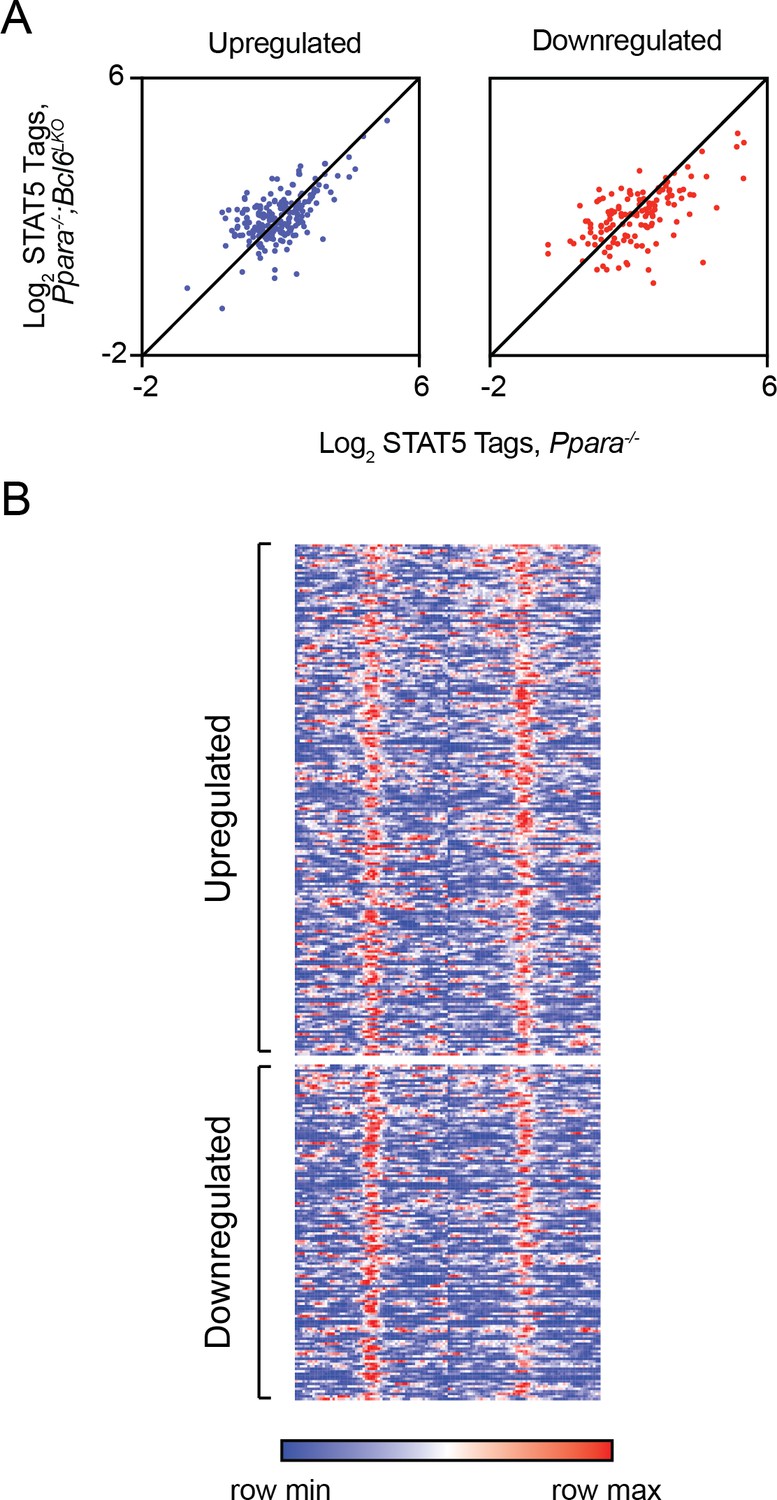
Loss of BCL6 does not enhance STAT5 recruitment to shared BCL6-PPARα enhancers.
(A) STAT5 ChIP-seq tag density in Ppara-/- and Ppara-/-;Bcl6LKO livers at BCL6-PPARα peaks near rescued upregulated and downregulated fasting genes. ChIP was performed in biological triplicate. (B) Heatmap of STAT5 ChIP-seq in fasted control Bcl6fl/fl, Ppara-/-, and Ppara-/-;Bcl6LKOmice at BCL6-PPARα shared peaks that annotate to rescued Ppara-/-dysregulated genes in Ppara-/-;Bcl6LKO mice.
Author response image 2
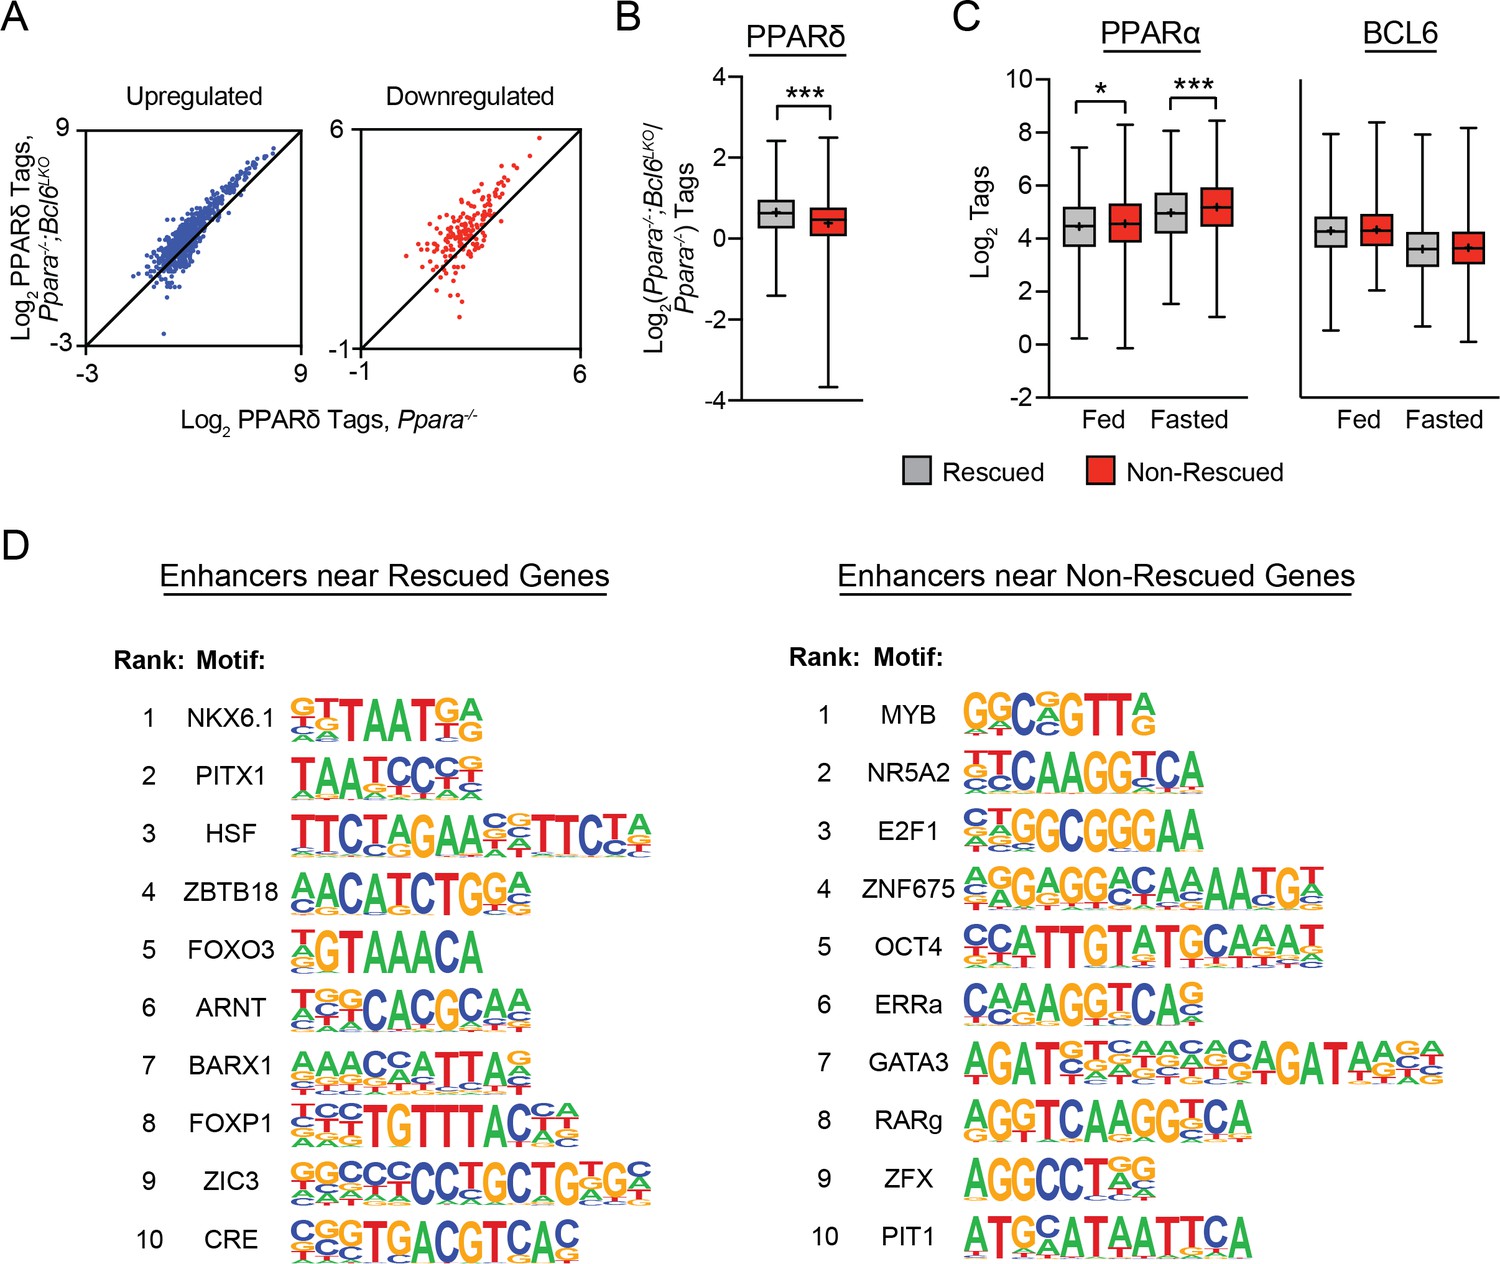
Rescued genes are enriched for nearby PPARδ binding and motifs for distinct transcription factors compared to non-rescued genes.
(A) PPARδ ChIP-seq tag density in Ppara-/- and Ppara-/-;Bcl6LKO livers at shared BCL6-PPARα peaks near up- and downregulated non-rescued fasting genes. (B) Log2 ratio of PPARδ ChIP-seq tag density in Ppara-/-;Bcl6LKO over Ppara-/- livers at BCL6-PPARα peaks near rescued and non-rescued fasting genes. (C) PPARα tag density (left) and BCL6 tag density (right) in control fed and fasted livers at respective peaks near rescued and non-rescued genes. (D) Top 10 enriched motifs at enhancers identified by H3K27ac ChIP-seq in fasted Ppara-/-;Bcl6LKO livers near rescued (left) and nonrescued (right) genes. Motifs near rescued genes were identified against DNA sequences in non-rescued enhancers; motifs near non-rescued genes were identified against DNA sequences in rescued enhancers. Box plots display interquartile range (box), median (horizontal line), mean (black ‘+’), and min to max (whiskers). Mann-Whitney test was used to compare tags between groups. p < 0.05, p < 0.01, p < 0.001.
Author response image 3
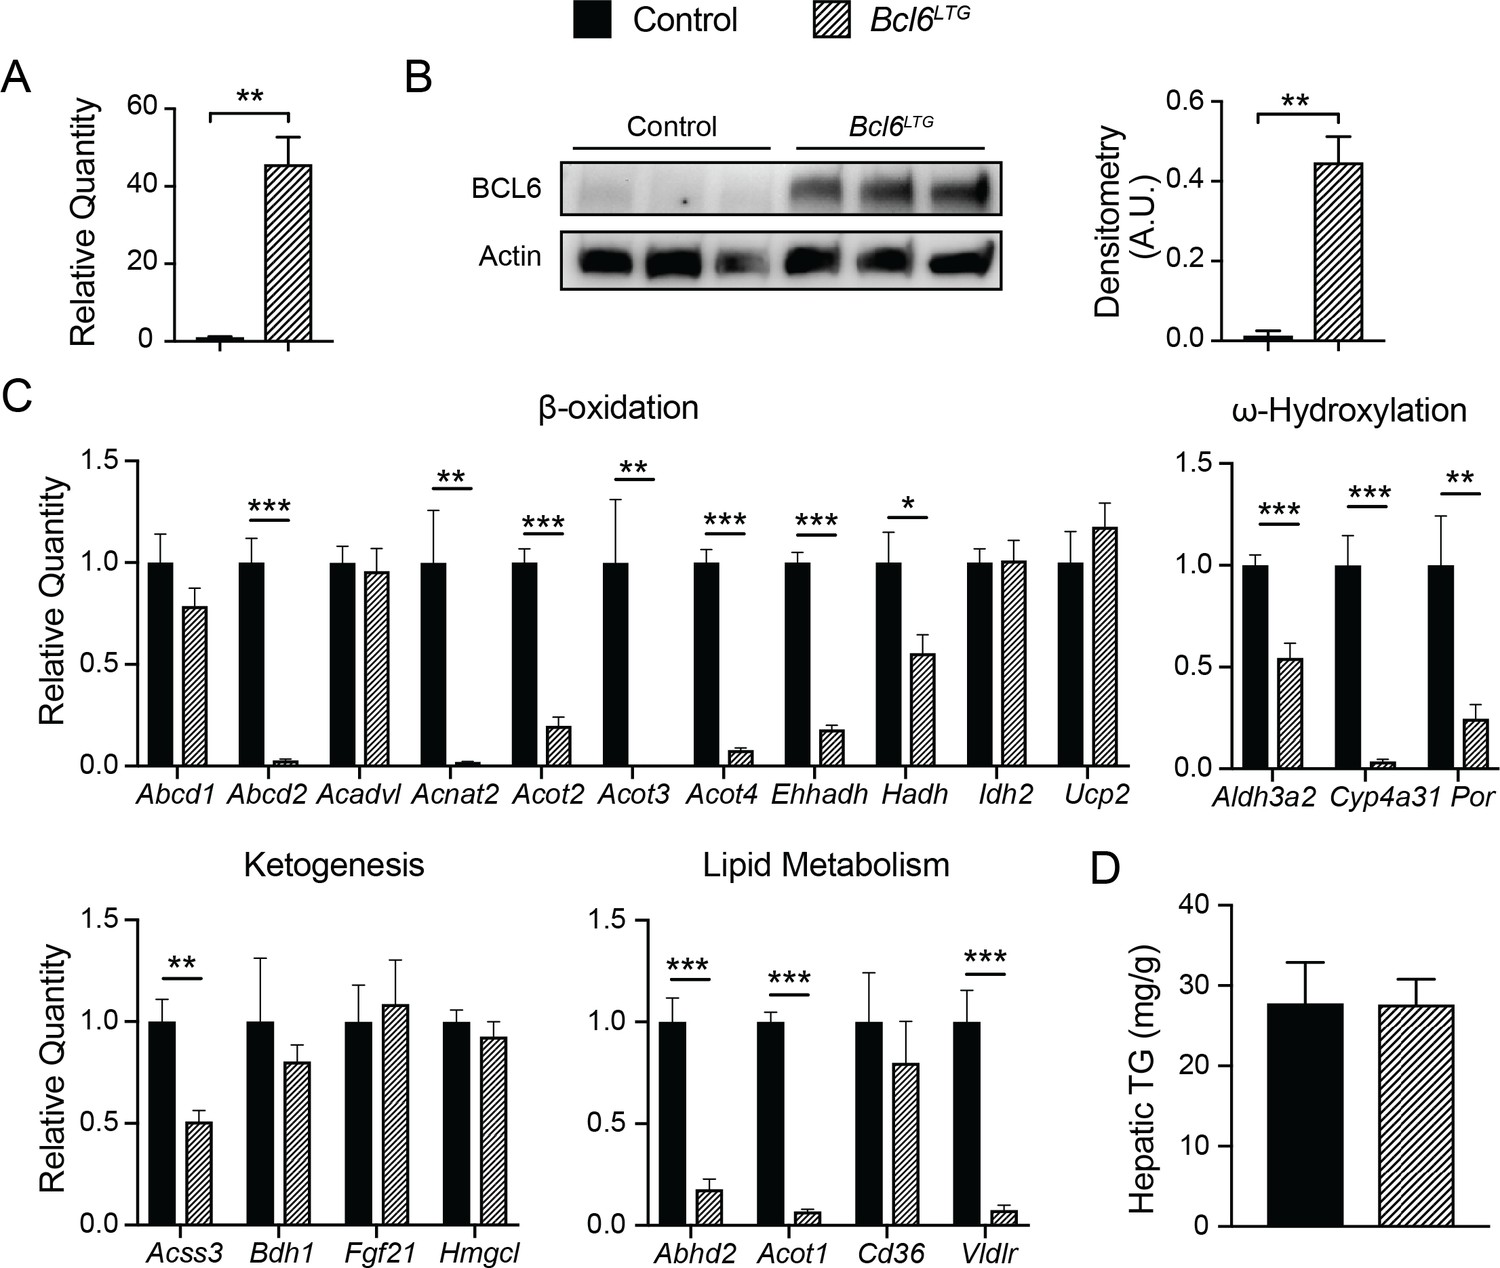
Overexpression of BCL6 downregulates fatty acid oxidation genes.
(A) qPCR analysis of Bcl6 in control and Bcl6LTG livers. N = 3-7 per group. (B) Western blot of BCL6 protein in control and Bcl6LTG livers. Densitometric quantification is shown normalized to actin (right). (C) qPCR analysis of fatty acid oxidation and ketogenesis genes after a 48-hour fast. N = 6-7 per group. (D) Hepatic triglyceride content after a 48-hour fast. N = 67 per group. A two-tailed Student’s t-test assuming equal variance was used to compare mean values between groups. Data are represented as mean ± SEM. p < 0.05, p < 0.01, p < 0.001.
Author response image 4
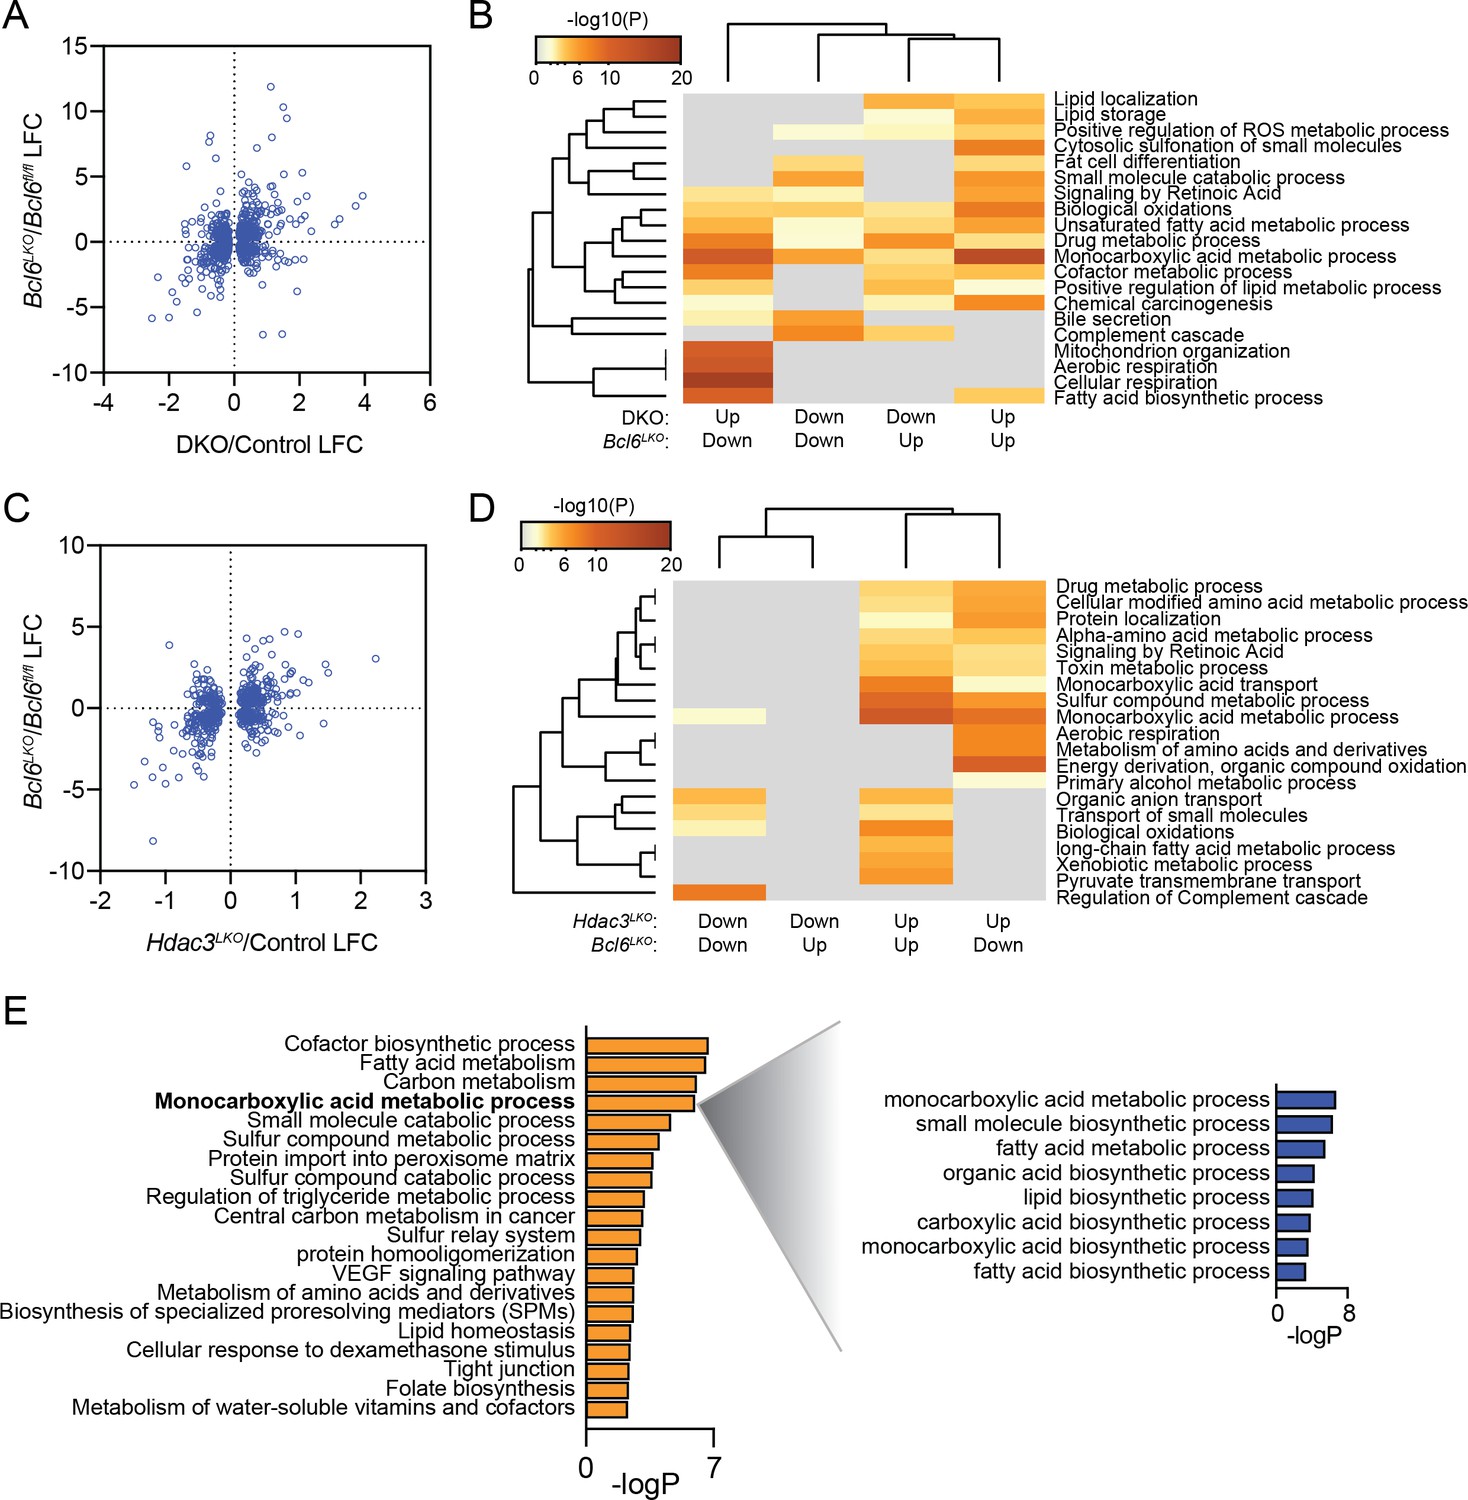
BCL6 suppress fatty acid oxidation genes while SMRT/NCoR and HDAC3 suppress lipogenic genes.
(A) Comparison of log fold change (LFC) at significant (p-value <0.05) differentially expressed genes in both Bcl6LKO and Ncor/Smrt double knockout (DKO) livers over control samples. (B) Pathway enrichment analysis for genes differentially expressed in Bcl6LKO and DKO livers based on direction of change. (C) Comparison of log fold change (LFC) at significant (p-value <0.05) differentially expressed genes in both Bcl6LKO and Hdac3 knockout (Hdac3LKO) livers over control samples. (D) Pathway enrichment analysis for genes differentially expressed in Bcl6LKO and Hdac3LKO livers based on direction of change. (E) Pathway enrichment analysis for genes differentially expressed only in Hdac3LKO livers over control (left) and sub-pathway analysis of ‘monocarboxylic acid metabolic process’ (right).
Tables
Key resources table
| Reagent type (species) or resource | Designation | Source or reference | Identifiers | Additional Information |
|---|---|---|---|---|
| Genetic reagent (Mus musculus) | Bcl6fl/fl | PMID 30566857 | ||
| Genetic reagent (Mus musculus) | Albumin-cre | Jackson Laboratory | Stock #003574 | |
| Genetic reagent (Mus musculus) | Ppara-/- | Jackson Laboratory | Stock #008154 | |
| Genetic reagent (Mus musculus) | Ppardfl/fl | Jackson Laboratory | Stock #005897 | |
| Antibody | anti-BCL6 (guinea pig polyclonal) | PMID 30566857 | custom polyclonal 7.5 μg per IP | |
| Antibody | anti-PPARδ (guinea pig polyclonal) | PMID 28467934 | custom polyclonal 7.5 μg per IP | |
| Antibody | anti-SMRT (guinea pig polyclonal) | PMID 22465074 | custom polyclonal 7.5 μg per IP | |
| Antibody | anti-NCoR (guinea pig polyclonal) | PMID 22465074 | custom polyclonal 7.5 μg per IP | |
| Antibody | anti-HDAC3 (rabbit polyclonal) | Santa Cruz | Cat. #: sc-11417x | 5 μg per IP |
| Antibody | anti-H3K27ac (rabbit polyclonal) | Active Motif | Cat. #: 39133 | 5 μg per IP |
| Antibody | anti-pAKT (rabbit monoclonal) | Cell Signaling | Cat. #: 4060 s | (1:1000) |
| Antibody | anti-panAKT (rabbit monoclonal) | Cell Signaling | Cat. #: 4691 s | (1:1000) |
| Antibody | anti-BCL6 (mouse monoclonal) | Santa Cruz | Cat. #: sc7388 | (1:200) |
| Antibody | anti-β-Actin (mouse monoclonal) | Sigma-Aldrich | Cat. #: A1978 | 1:1000) |
| Antibody | anti-PPARα (rabbit polyclonal) | Santa Cruz | Cat. #: sc-9000x | 7.5 μg per IP; WB: (1:500) |
| Antibody | Peroxidase AffiniPure Goat Anti-Mouse IgG | Jackson ImmunoResearch | Cat. #: 115-035-174 | (1:20,000) |
| Antibody | Peroxidase IgG Fraction Monoclonal Mouse Anti-Rabbit IgG | Jackson ImmunoResearch | Cat. #: 211-032-171 | (1:20,000) |
| Antibody | Rabit Anti-guinea pig IgG H and L | Abcam | Cat. #: ab6698 | |
| Chemical compound, drug | DSG Crosslinker | ProteoChem | Cat. #: c1104 | |
| Chemical compound, drug | Formaldehyde, 16%, methanol-free, Ultra Pure | Polysciences, Inc | Cat. #: 18814–20 | |
| Chemical compound, drug | RNAlater Stabilization Solution | ThermoFisher Scientific | Cat. #: AM7020 | |
| Chemical compound, drug | TRIzol Reagent | ThermoFisher Scientific | Cat. #: 15596018 | |
| Chemical compound, drug | Poloxamer 407 | Sigma-Aldrich | Cat. #: 16758 | |
| Chemical compound, drug | cOmplete Ultra Tablets, EDTA-free | Sigma-Aldrich | Cat. #: 5892953001 | |
| Chemical compound, drug | Deuterium oxide | Sigma-Aldrich | Cat. #: 151882 | |
| Chemical compound, drug | Sodium Palmitate | Sigma-Aldrich | Cat. #: P9767 | |
| Chemical compound, drug | Palmitic Acid, [1–14C] | MP Biomedicals | Cat. #: 12195 | |
| Chemical compound, drug | BODIPY 500/510 C1, C12 | Invitrogen | Cat. #: D3823 | |
| Chemical compound, drug | Humulin R | Lilly | NDC 0002-8215-01 | |
| Commercial assay or kit | Dynabeads M-280 Sheep Anti-Rabbit IgG | Invitrogen | Cat. #: 11204D | |
| Commercial assay or kit | Dynabeads M-280 Tosylactivated | Invitrogen | Cat. #: 14204 | |
| Commercial assay or kit | Protein A Agarose/Salmon Sperm DNA | Millipore | Cat. #: 16–157 | |
| Commercial assay or kit | iScript cDNA Synthesis Kit | BioRad | Cat. #: 1708891 | |
| Commercial assay or kit | iTaq Universal SYBR Green | BioRad | Cat. #: 1725124 | |
| Commercial assay or kit | Infinity Triglyceride Assay Kit | ThermoFisher Scientific | Cat. #: TR22421 | |
| Commercial assay or kit | β-Hydroxybutyrate (Ketone Body) Colorimetric Assay Kit | Cayman Chemical | Cat. #: 700190 | |
| Commercial assay or kit | Ultra Sensitive Mouse Insulin ELISA Kit | Crystal Chem | Cat. #: 90080 | |
| Commercial assay or kit | Glucose Colorimetric /Fluorometric Assay Kit | BioVision | Cat. #: K606 | |
| Commercial assay or kit | Microvette CB 300 K2E | Sarstedt | Cat. #: 16.444 | |
| Commercial assay or kit | MemCode Reversible Protein Stain Kit | ThermoFisher Scientific | Cat. #: 24585 | |
| Commercial assay or kit | Whatman qualitative filter paper | Sigma-Aldrich | Cat. #: WHA1003055 | |
| Commercial assay or kit | KAPA Hyper Prep Library Prep Kit | Kapa Biosystems | Cat. #: KK8504 | |
| Commercial assay or kit | KAPA Stranded RNA-seq Kit with RiboErase | Kapa Biosystems | Cat. #: KK8483 | |
| Commercial assay or kit | NextSeq 500/550 High Output Kit v2.5 (75 cycles) | Illumina | Cat. #: 20024906 | |
| Other, research diet (45% kcal from fat) | HFD | Research Diets, Inc | Stock #D12451 |
Additional files
-
Supplementary file 1
Quantitative PCR primers for chromatin immunoprecipitation.
- https://doi.org/10.7554/eLife.43922.019
-
Supplementary file 2
Quantitative PCR primers for gene expression.
- https://doi.org/10.7554/eLife.43922.020
-
Transparent reporting form
- https://doi.org/10.7554/eLife.43922.021
Download links
A two-part list of links to download the article, or parts of the article, in various formats.
Downloads (link to download the article as PDF)
Open citations (links to open the citations from this article in various online reference manager services)
Cite this article (links to download the citations from this article in formats compatible with various reference manager tools)
Dynamic repression by BCL6 controls the genome-wide liver response to fasting and steatosis
eLife 8:e43922.
https://doi.org/10.7554/eLife.43922


