Sensory prediction errors in the human midbrain signal identity violations independent of perceptual distance
- Northwestern University, United States
- National Institutes of Health, United States
Figures
Figure 1
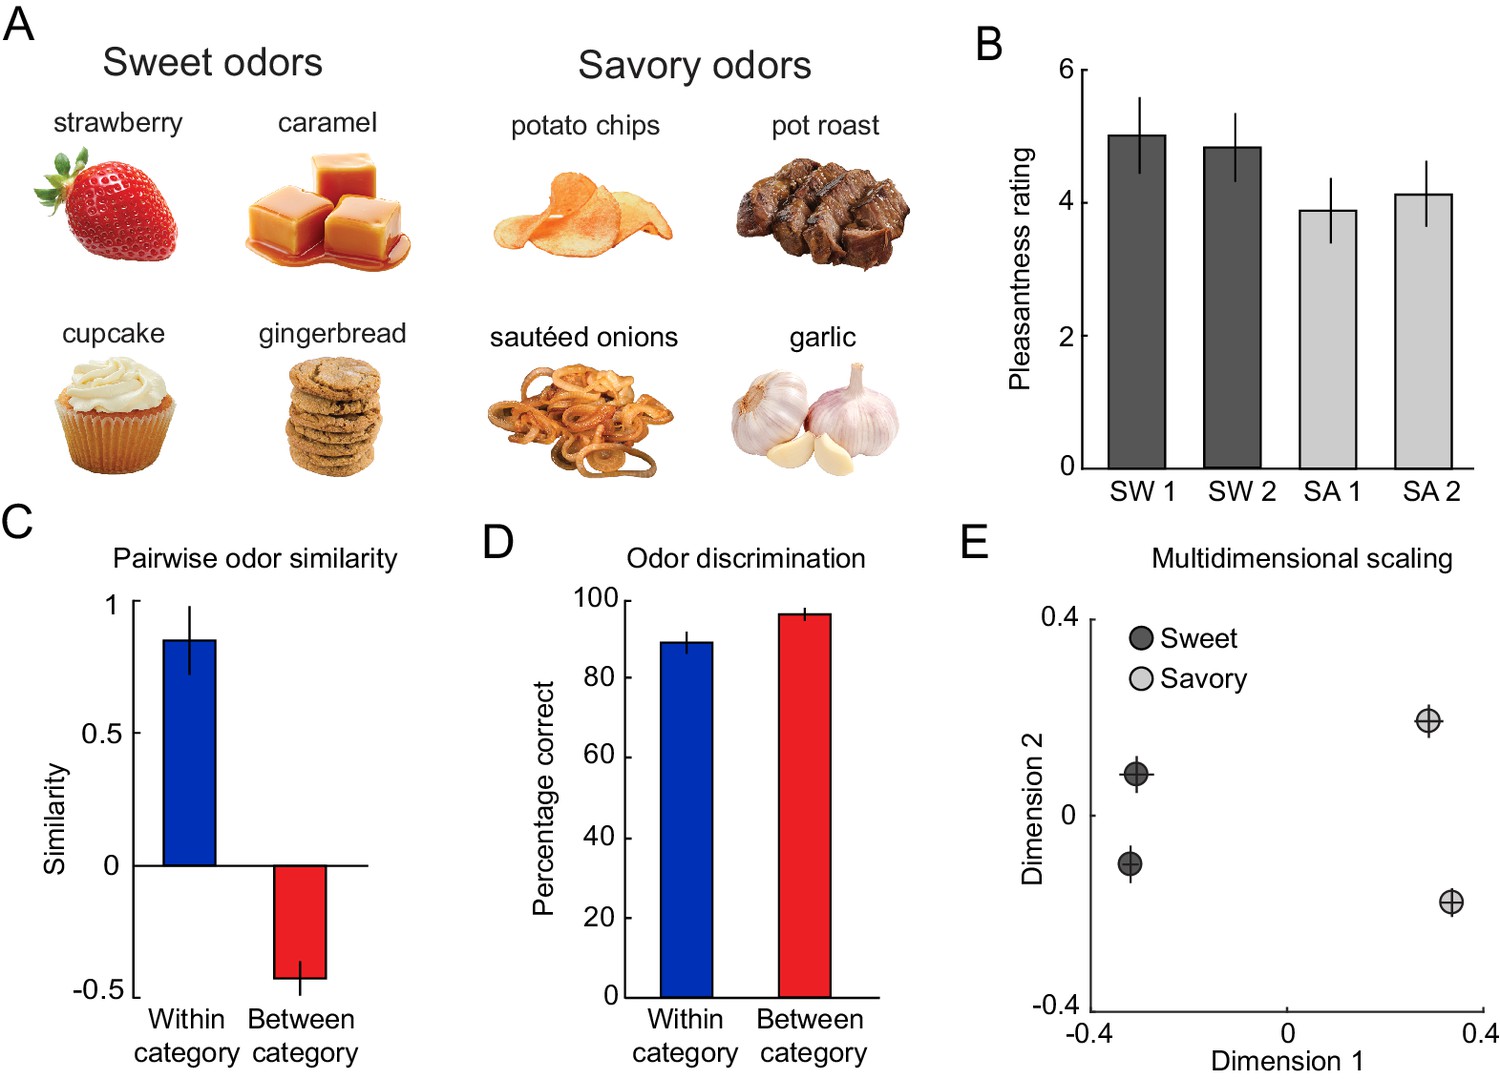
Odor stimuli are organized in a two-category structure.
(A) From an initial set of eight food odors, two sweet and two savory odors with the highest and most similar pleasantness ratings were selected. (B) On average, this selection procedure resulted in equal pleasantness ratings across the selected odors. (C) Subjects rated odors belonging to the same food category to be significantly more similar compared to odors belonging to different categories. (D) Subjects were able to discriminate between pairs of odors regardless of whether odors belonged to the same or different categories. (E) MDS plot showing average positions of odors in a two-dimensional space. Error bars represent SEM.
-
Figure 1—source data 1
Relates to panel (B).
- https://doi.org/10.7554/eLife.43962.003
-
Figure 1—source data 2
Relates to panel (C).
- https://doi.org/10.7554/eLife.43962.004
-
Figure 1—source data 3
Relates to panel (D).
- https://doi.org/10.7554/eLife.43962.005
-
Figure 1—source data 4
Relates to panel (E).
- https://doi.org/10.7554/eLife.43962.006
Figure 2 with 2 supplements
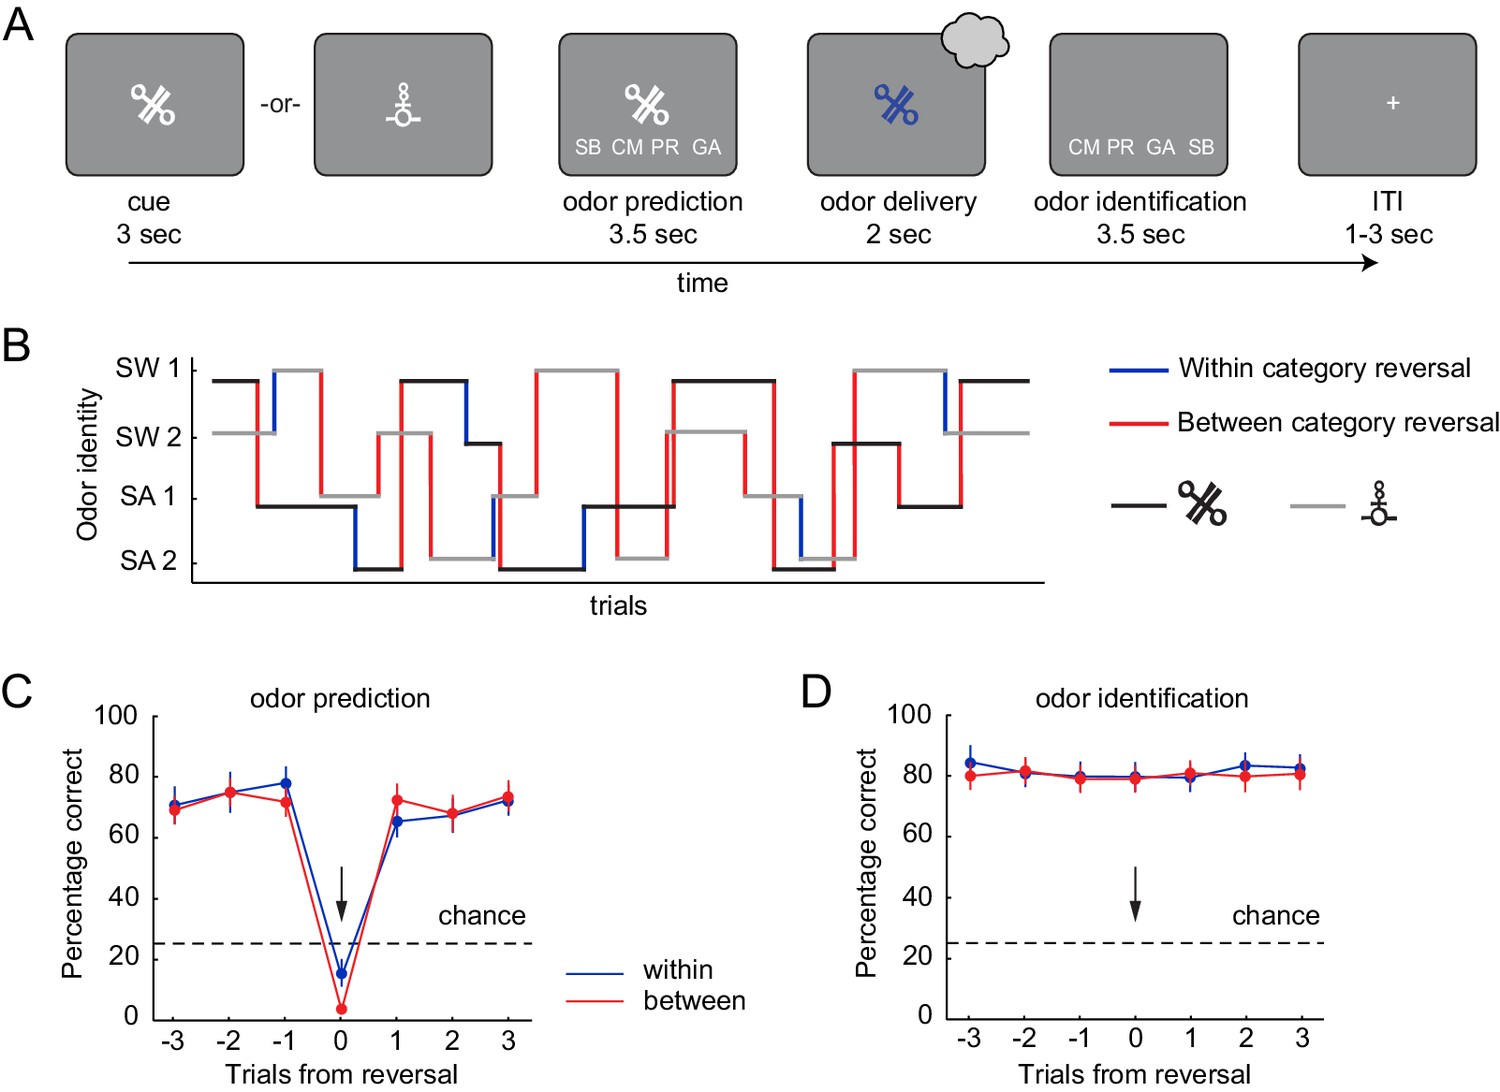
Pavlovian transreinforcer reversal task and behavioral performance.
(A) After presentation of the CS, subjects predicted which odor they expected based on the presented CS and then identified the odor they received. (B) An example trial sequence illustrating the possible reversals. Reversals could occur throughout the task (after 4–6 presentations of a given CS) without warning, and independently for the two CS. (C) Subjects correctly predicted the upcoming odor well above chance (25%) and learned new associations quickly after a reversal (black arrow). Performance did not differ between reversal types (within vs. between category reversal). (D) Subjects accurately identified the received odor well above chance (25%) regardless of whether a reversal occurred and independent of reversal type. Error bars represent SEM.
-
Figure 2—source data 1
Relates to panel (C).
- https://doi.org/10.7554/eLife.43962.015
-
Figure 2—source data 2
Relates to panel (D).
- https://doi.org/10.7554/eLife.43962.016
Figure 2—figure supplement 1
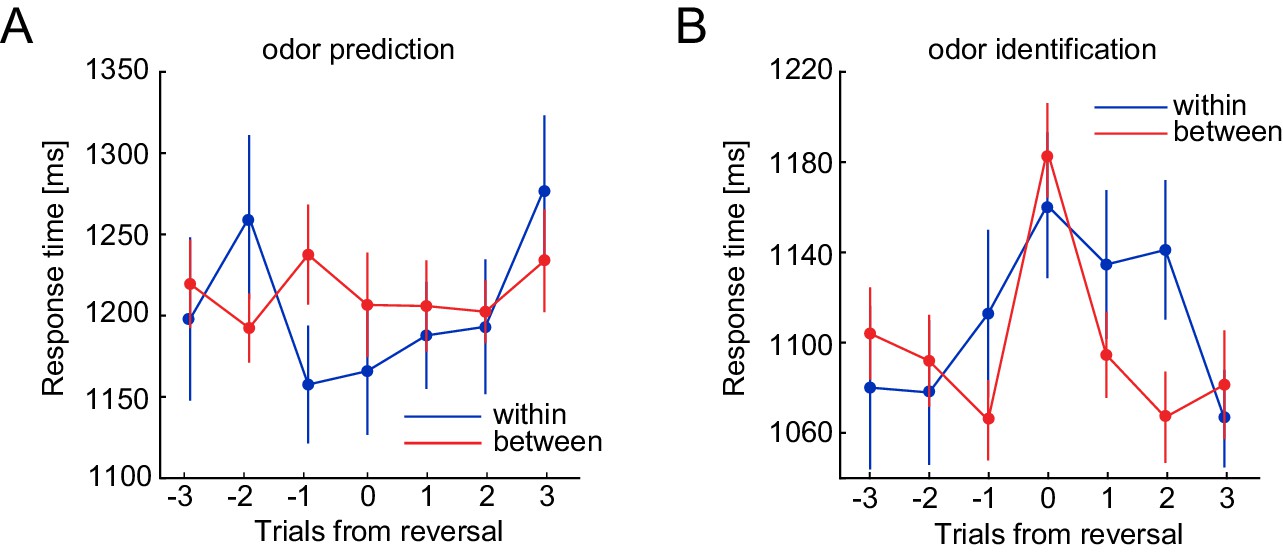
Response times for odor prediction and odor identification.
Response times for odor prediction (A) and odor identification (B) during the three trials leading up to the reversal, the reversal, and the three trials post-reversal. Error bars represent SEM.
-
Figure 2—figure supplement 1—source data 1
Relates to panel (A).
- https://doi.org/10.7554/eLife.43962.009
-
Figure 2—figure supplement 1—source data 2
Relates to panel (B).
- https://doi.org/10.7554/eLife.43962.010
Figure 2—figure supplement 2

Respiratory responses.
(A) Breathing traces for different trial types. (B) Sniff amplitude per trial type (non-reversal, between-category reversal, and within-category reversal). Sniff amplitude differed significantly between trial types (repeated measures ANOVA: Type: F(2, 32)=4.12 p=0.033). Post-hoc t-tests revealed that the effect was driven by significant differences between within-category reversals and non-reversal trials (t(16)=-3.13, p=0.006). No difference was found between within-category and between-category reversals (t(16)=1.80, p=0.091), or between non-reversal trials and between-category reversals (t(16)=-0.63, p=0.535). (C) Sniff latency (time to peak) per trial type. There were no significant differences between trial types (repeated measures ANOVA: Type: F(2, 32)=0.89 p=0.405). Error bars represent SEM.
-
Figure 2—figure supplement 2—source data 1
Relates to panel (A).
- https://doi.org/10.7554/eLife.43962.012
-
Figure 2—figure supplement 2—source data 2
Relates to panel (B).
- https://doi.org/10.7554/eLife.43962.013
-
Figure 2—figure supplement 2—source data 3
Relates to panel (C).
- https://doi.org/10.7554/eLife.43962.014
Figure 3
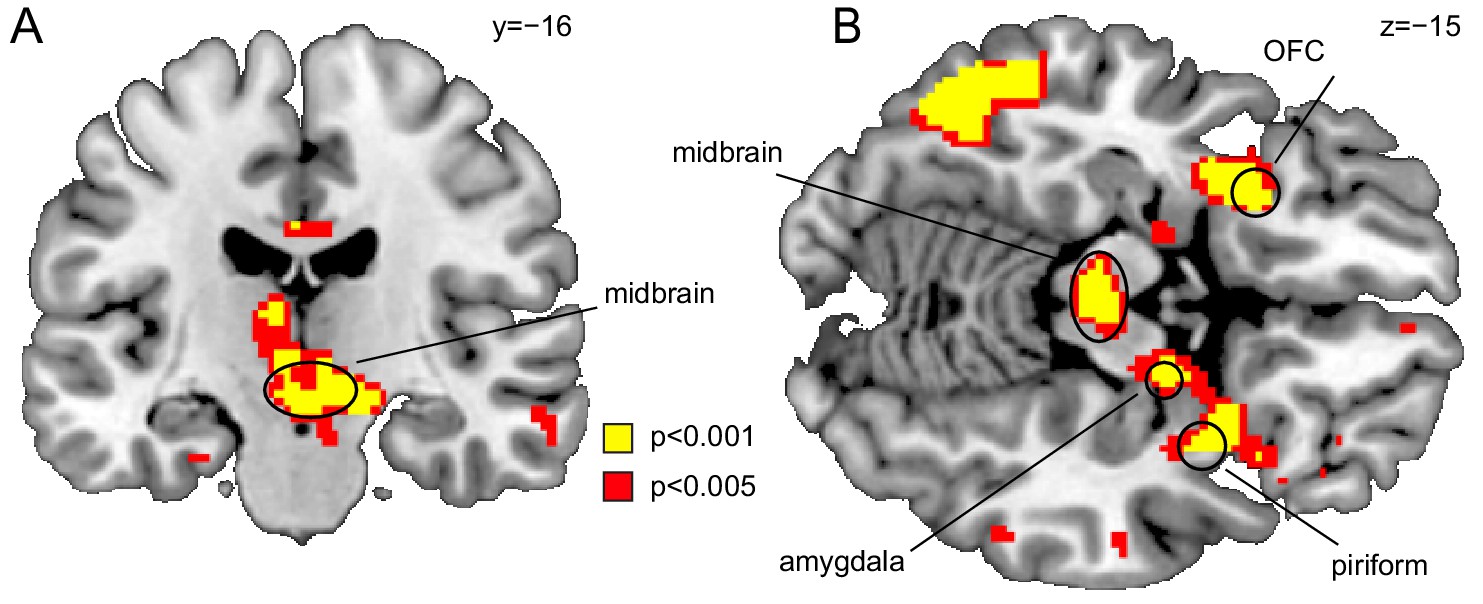
Midbrain responds to value-neutral identity PEs.
(A) Coronal and (B) axial sections displayed at puncorr = 0.001 (yellow) and puncorr = 0.005 (red) for illustration. Whole-brain map can be viewed at neurovault.org/images/109243/.
Figure 4
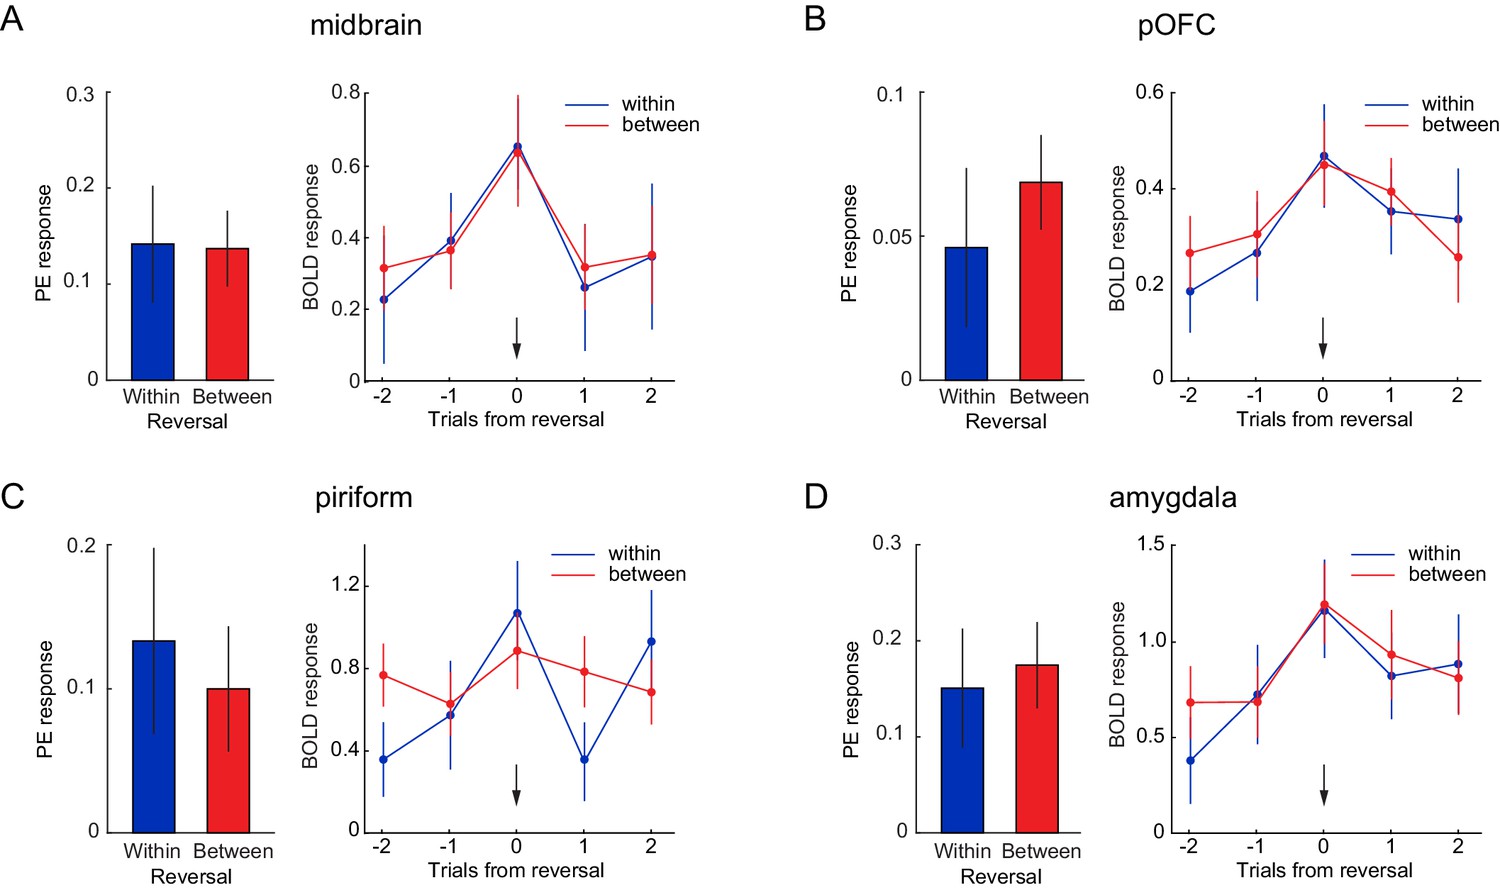
Neural responses to identity PEs are independent of perceptual similarity.
Parameter estimates for identity PEs during within- and between-category reversals (left) and US-evoked responses for trials before, during, and after within- and between-category reversals (right), in a priori ROIs of (A) midbrain, (B) posterior OFC, (C) PC, and (D) amygdala. Arrows indicate reversal trial. Error bars represent SEM. Time by reversal type repeated measures ANOVAs on US-evoked fMRI responses (right) in all ROIs showed a main effect of time (midbrain, F(4, 72)=6.36, p=0.0005; posterior OFC, F(4, 72)=5.08, p=0.006; PC, F(4, 72)=4.71, p=0.003; amygdala, F(4, 72)=6.92, p=0.001), no main of effect reversal type (midbrain, F(1, 18)=1.96, p=0.179; posterior OFC, F(1, 18)=0.09, p=0.767; PC, F(1, 18)=0.91, p=0.352; amygdala, F(1, 18)=0.57, p=0.461), and, except in PC (F(4, 72)=2.91, p=0.048), no interaction between time and type (midbrain, F(4, 72)=0.144, p=0.933; posterior OFC, F(4, 72)=0.66, p=0.583; amygdala, F(4, 72)=0.79, p=0.507).
-
Figure 4—source data 1
Relates to panel (A).
- https://doi.org/10.7554/eLife.43962.020
-
Figure 4—source data 2
Relates to panel (B).
- https://doi.org/10.7554/eLife.43962.021
-
Figure 4—source data 3
Relates to panel (C).
- https://doi.org/10.7554/eLife.43962.022
-
Figure 4—source data 4
Relates to panel (D).
- https://doi.org/10.7554/eLife.43962.023
Figure 5
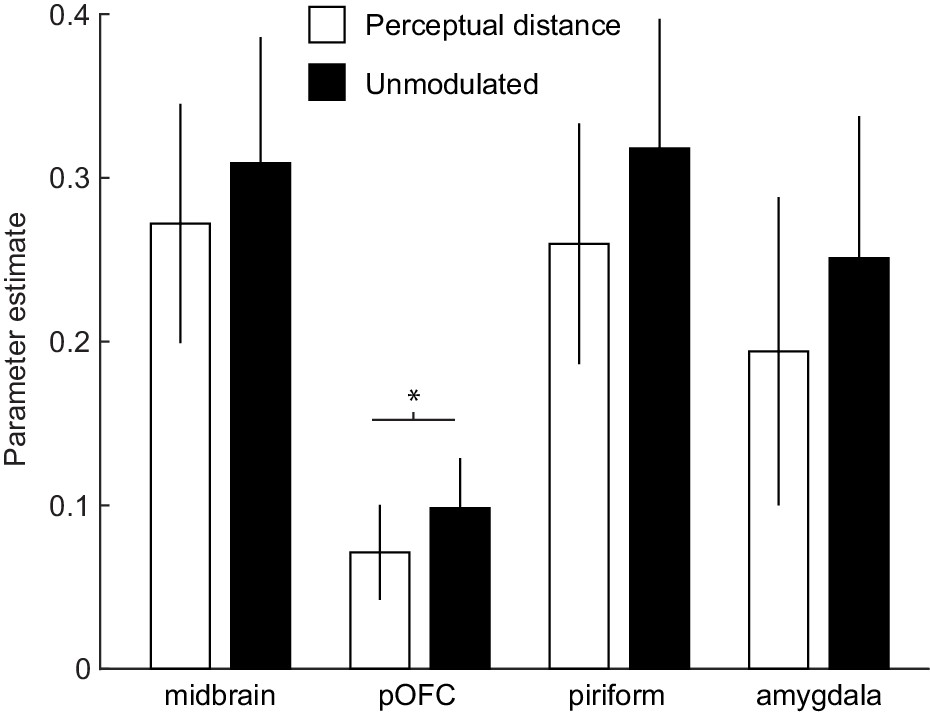
Identity PEs unmodulated by perceptual distance better account for fMRI responses.
Bar plots depict parameter estimates for identity PEs modulated (white) and unmodulated (black) by the MDS-derived perceptual distance between expected and received odors in a priori ROIs of midbrain, posterior OFC (pOFC), PC, and amygdala. Note that parameter estimates are from z-scored parametric modulators in otherwise identical GLMs and thus reflect explained variance in fMRI responses. Error bars represent SEM.
-
Figure 5—source data 1
ROI activity for identity PEs modulated and unmodulated by perceptual distance.
- https://doi.org/10.7554/eLife.43962.025
Tables
Table 1
Brain regions correlating with identity PEs (pFWE <0.05).
https://doi.org/10.7554/eLife.43962.018| Region | X | Y | Z | t-value | K |
|---|---|---|---|---|---|
| Midbrain | 0 | −24 | −22 | 7.51 | 3 |
| Midbrain | 12 | −10 | −10 | 7.17 | 4 |
| Left middle frontal gyrus | −50 | 24 | 34 | 10.11 | 147 |
| Left superior medial frontal gyrus | -8 | 24 | 44 | 7.90 | 31 |
| Left insula | −34 | 18 | -4 | 7.13 | 8 |
| Right insula | 36 | 14 | -6 | 8.46 | 74 |
| Left precentral gyrus | −34 | 4 | 40 | 9.38 | 74 |
| Precuneus | -2 | −64 | 44 | 8.49 | 111 |
| Left posterior parietal cortex | −32 | −64 | 46 | 7.25 | 35 |
| Right posterior parietal cortex | 38 | −64 | 52 | 7.09 | 5 |
| Right posterior parietal cortex | 34 | −72 | 46 | 6.90 | 3 |
-
Brain regions responding to identity PEs (FWE whole-brain corrected at the voxel level, pFWE <0.05). Coordinates (x, y, z) are in MNI space; k = number of voxels in cluster.
Additional files
-
Supplementary file 1
Estimated learning rates and choice stochasticity parameters from reinforcement learning model.
Subject-wise parameters for learning rate and choice stochasticity.
- https://doi.org/10.7554/eLife.43962.026
-
Transparent reporting form
- https://doi.org/10.7554/eLife.43962.027
Download links
A two-part list of links to download the article, or parts of the article, in various formats.
Downloads (link to download the article as PDF)
Open citations (links to open the citations from this article in various online reference manager services)
Cite this article (links to download the citations from this article in formats compatible with various reference manager tools)
Sensory prediction errors in the human midbrain signal identity violations independent of perceptual distance
eLife 8:e43962.
https://doi.org/10.7554/eLife.43962


