Identification of a bilirubin receptor that may mediate a component of cholestatic itch
- Johns Hopkins University School of Medicine, United States
- Howard Hughes Medical Institute, Johns Hopkins University School of Medicine, United States
Figures
Figure 1 with 1 supplement

Bilirubin elicits non-histaminergic, Mrgpr-dependent pruritus.
(A) Scratching bouts associated with injection of bilirubin. The indicated amount of bilirubin was injected into the nape of mice. The blue bar (+HSA) represents animals injected with 60 µg bilirubin pre-incubated with 1% human serum albumin. Veh n = 8; 6 µg n = 5, 18 µg n = 11, 30 µg n = 12, 60 µg n = 7,+HSA n = 12. (B) Time course of itch behavior associated with bilirubin, histamine, or chloroquine. Scratching bouts were binned according to 5 min intervals. Bilirubin n = 16, Histamine n = 13, Chloroquine n = 11. (C) 60 µg bilirubin was injected into the nape of WT and Mrgpr-cluster KO littermates. WT n = 8, Mrgpr-cluster KO n = 13. (D) 60 µg of the indicated metabolite was injected into WT and Mrgpr-cluster KO littermates. Hemin (WT n = 10, Mrgpr-cluster KO n = 6), Biliverdin (WT n = 7, Mrgpr-cluster KO n = 7), Urobilinogen (WT n = 15, Mrgpr-cluster KO n = 8), Stercobilin (WT n = 7, Mrgpr-cluster KO n = 5). (E) The pathway of heme degradation. The skeletal formula of each metabolite is depicted above its optimal 3D geometry, as calculated by a B3LYP functional and 6-31G(d) basis set. Blue and orange represent orbital parity of each metabolite’s HOMO obtained from DFT calculations. (A, C, D) Mean ±s.e.m. depicted. Each open circle represents an individual mouse. *, p < 0.05; **, p < 0.01; ***, p < 0.001; two-tailed unpaired Student’s t-test.
-
Figure 1—source data 1
Source data for Figure 1.
- https://doi.org/10.7554/eLife.44116.005
Figure 1—figure supplement 1
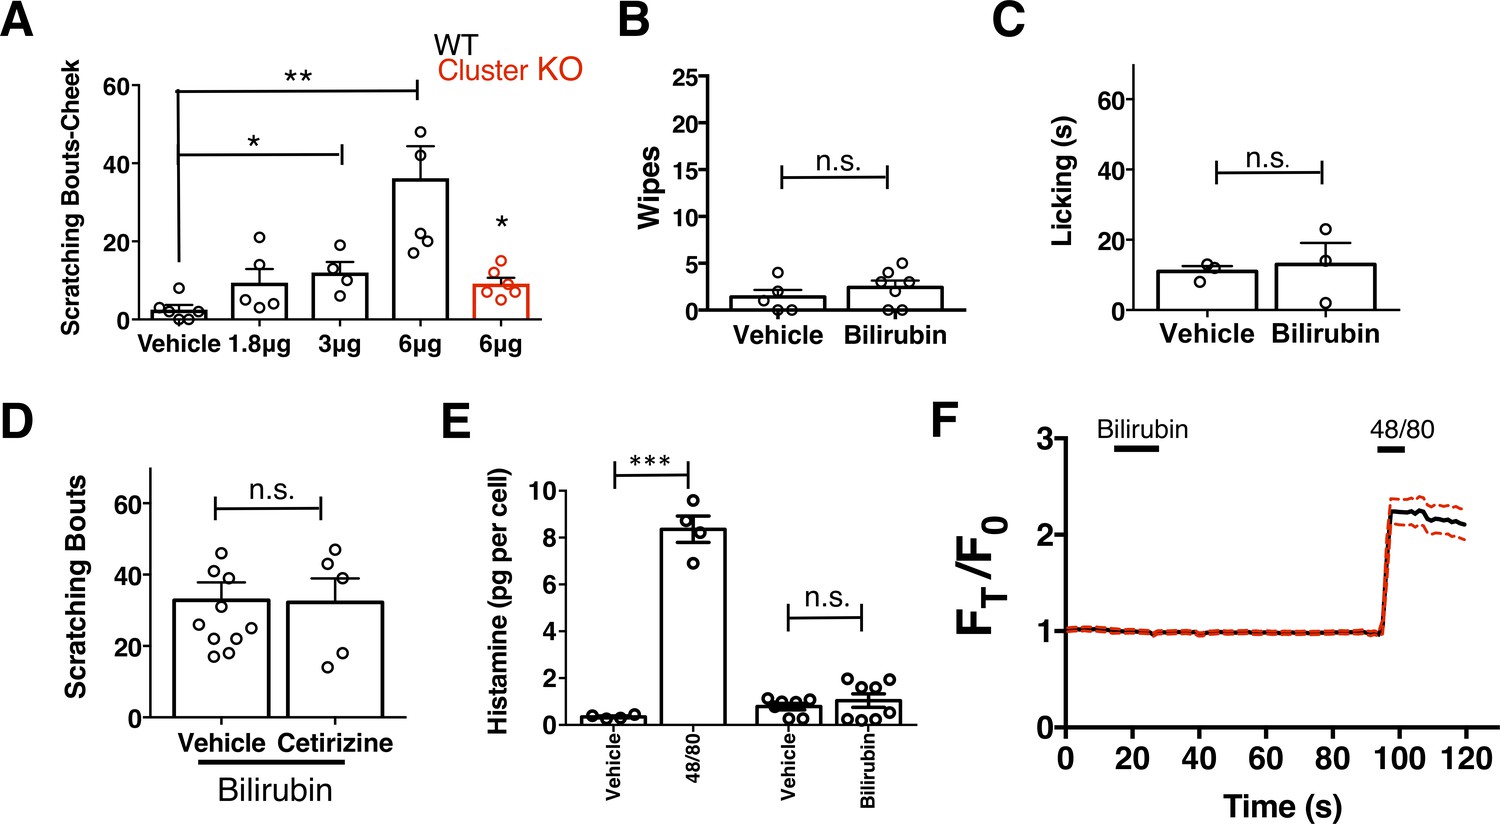
Bilirubin elicits non-histaminergic pruritus and not pain.
(A) Scratching bouts associated with cheek injection of bilirubin. The indicated amount of bilirubin was injected in a 10 µl volume and the number of scratching bouts was assessed for 30 min. Vehicle n = 6, 1.8 µg n = 5, 3 µg n = 4, 6 µg n = 5, 6 µg (Mrgpr-clusterΔ−/−) n = 6. (B) Wiping associated with injection of 6 µg bilirubin into the cheek. Wipes were assessed for 10 min post-injection, vehicle n = 5, bilirubin n = 7. (C) Lick time associated with injection of 6 µg bilirubin into the paw. Licking was assessed for 10 min post-injection. n = 3 per condition. (D) H1 blocker does not inhibit bilirubin-induced pruritus. Either vehicle or 30 mg/kg Cetirizine was given i.p. 30 min prior to injection of bilirubin at the nape of the neck. Scratching bouts were assessed for 30 min post-injection. Vehicle n = 10, Cetirizine n = 5. (E) Mast cell histamine release in response to 100 µM bilirubin. Vehicle for Compound 48/80 n = 4, Compound 48/80 (10 µg/mL) n = 4, Vehicle n = 6, Bilirubin n = 8. (F) Ca2+ imaging of murine peritoneal mast cells. After a 10 s baseline, 100 µM bilirubin was added. 15 s later, a 1 min wash was applied before addition of 10 µg/mL compound 48/80. Drugs were applied when indicated by the black bars. Mean ±95% CI depicted. n = 26. (A–E) Mean plus s.e.m. depicted. Open circles represent independent data points. *, p < 0.05; **, p < 0.01; ***, p < 0.001; two-tailed unpaired Student’s t-test. n.s., not significant.
Figure 2 with 2 supplements
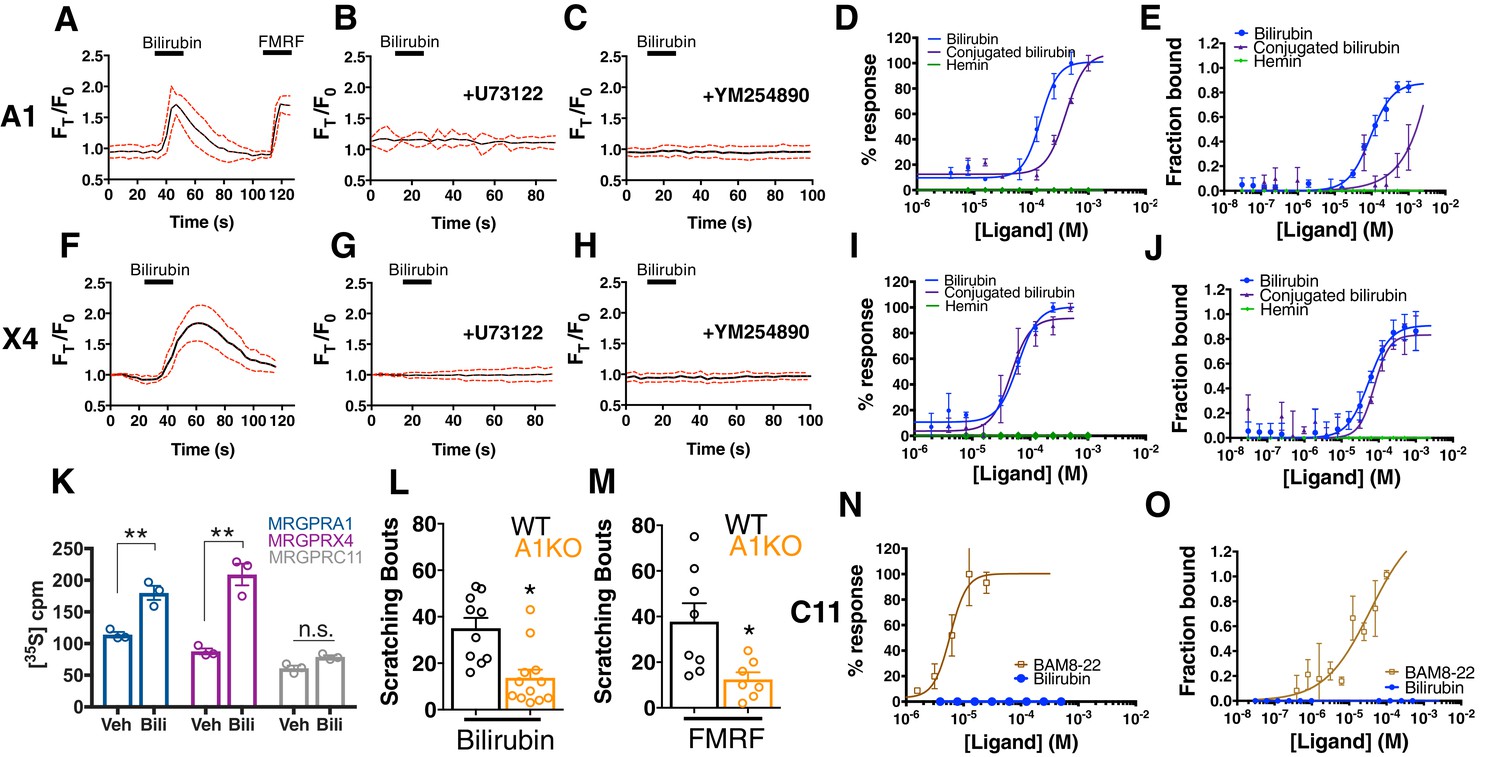
Bilirubin activates murine MRGPRA1 and human MRGPRX4.
Ca2+ imaging and transformed binding isotherms of HEK293 cells stably expressing MRGPRA1 (A-E) or MRGPRX4 (F-J). (A-C, F-H) 50 µM bilirubin was added where indicated by black bars. After 15 s, a 1 min wash was applied. Mean ±95% confidence interval (CI) depicted. n = 10. In (A) 30 µM FMRF was added after washing as indicated by the black bar. In (B-C) and (G-H), cells were pre-incubated with either 10 µM of the PLC inhibitor U73122 or 10 µM of the Gαq inhibitor YM254890 for 30 min prior to imaging. Concentration–Ca2+ response curves of bilirubin, conjugated bilirubin, and hemin towards (D) MRGPRA1, (I) MRGPRX4, and (N) MRGPRC11 and BAM8-22 towards MRGPRC11, an established peptide ligand. Data are a representative experiment of three independent replicates performed in triplicate, depicted as mean ±s.e.m. Transformed binding isotherms for bilirubin, conjugated bilirubin, and hemin to (E) MRGPRA1, (J) MRGPRX4, and (O) MRGPRC11 and BAM8-22 to MRGPRC11. Data are an average of three independent experiments, depicted as mean ±s.e.m. (K) Bilirubin-stimulated G-protein activity of partially-purified MRGPRA1, MRGPRX4, and MRGPRC11 membrane complexes. [35S]GTPγS binding was measured in the presence of 0.5% DMSO or 50 μM bilirubin. Mean ±s.e.m. depicted. **, p < 0.01; two-tailed unpaired Student’s t-test. (L) Scratching bouts from injection of 60 µg of bilirubin in WT and A1 KO animals. WT n = 10, A1 KO n = 12. (M) Scratching bouts from injection of 60 µg of FMRF in WT and A1 KO animals. WT n = 8, A1 KO n = 7. (L-M) Mean ±s.e.m. depicted. Open circles represent individual mice. *, p< 0.05 by two-tailed unpaired Student’s t-test.
-
Figure 2—source data 1
Source data for Figure 2 .
- https://doi.org/10.7554/eLife.44116.009
Figure 2—figure supplement 1
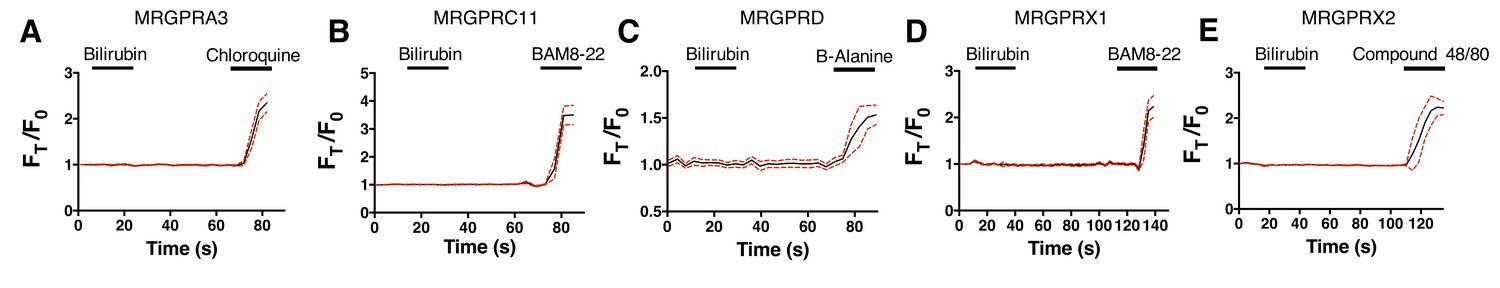
Bilirubin does not activate other itch-associated Mrgprs.
(A–E) Ca2+ imaging of HEK293 cells transiently expressing (A) MRGPRA3, (B) MRGPRC11, (C) MRGPRD, (D) MRGPRX1, or (E) MRGPRX2. 50 µM bilirubin was added where indicated by black bars. After fifteen seconds, a one minute wash was applied. After washing, either (A) 1 mM chloroquine, (B) 3 µM BAM8-22, (C) 1 mM β-alanine, (D) 3 µM BAM8-22, or (E) 10 µg/mL compound 48/80 was added as indicated by black bars. Mean ±95% CI depicted. n = 10.
Figure 2—figure supplement 2
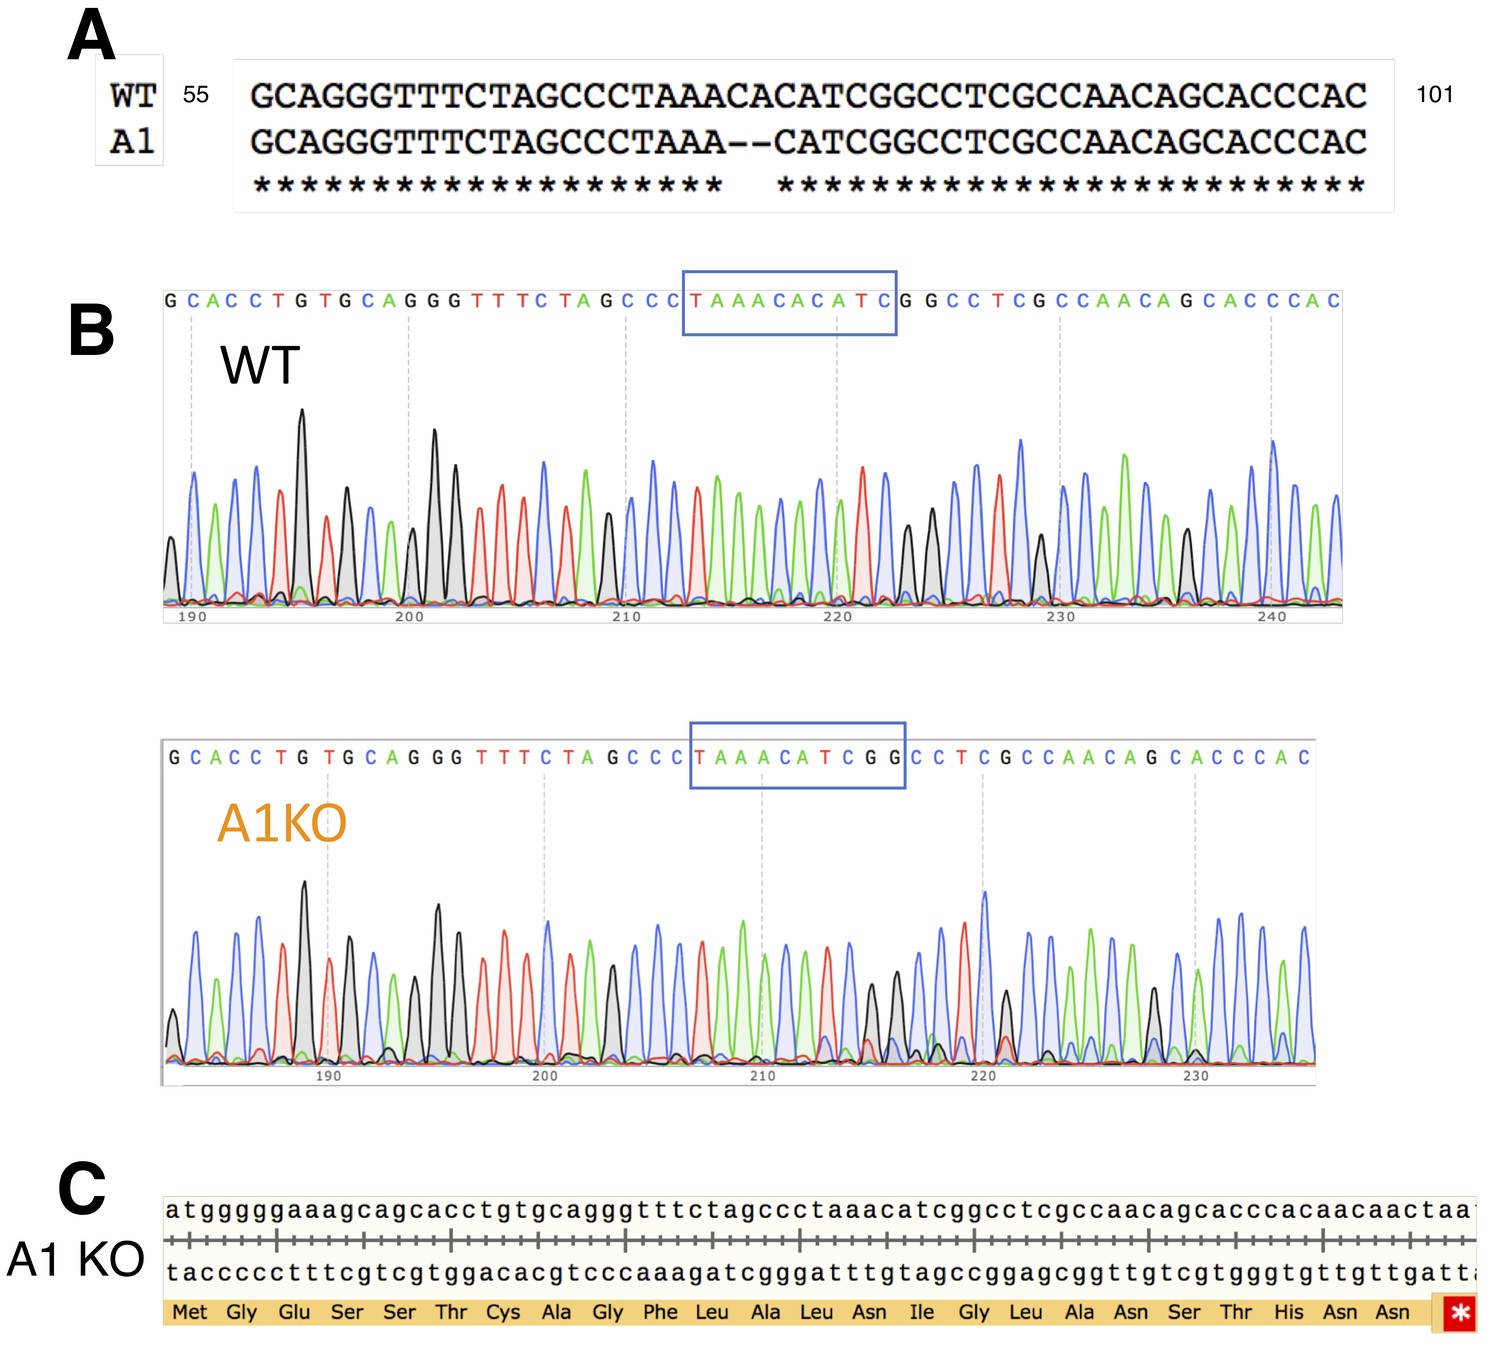
CRISPR deletion of MRGPRA1.
(A) Comparison of WT and A1 KO genomic sequences. Location of 2 base pair (bp) deletion shown by dashes. Numbers correspond to MRGPRA1 open reading frame. (B) Sequencing data depicting the 2 bp deletion. (C) A translation of the open reading frame of MRGPRA1 KO beginning with the start codon. The 2 bp deletion creates a frameshift which results in early termination, marked by a red asterisk.
Figure 3
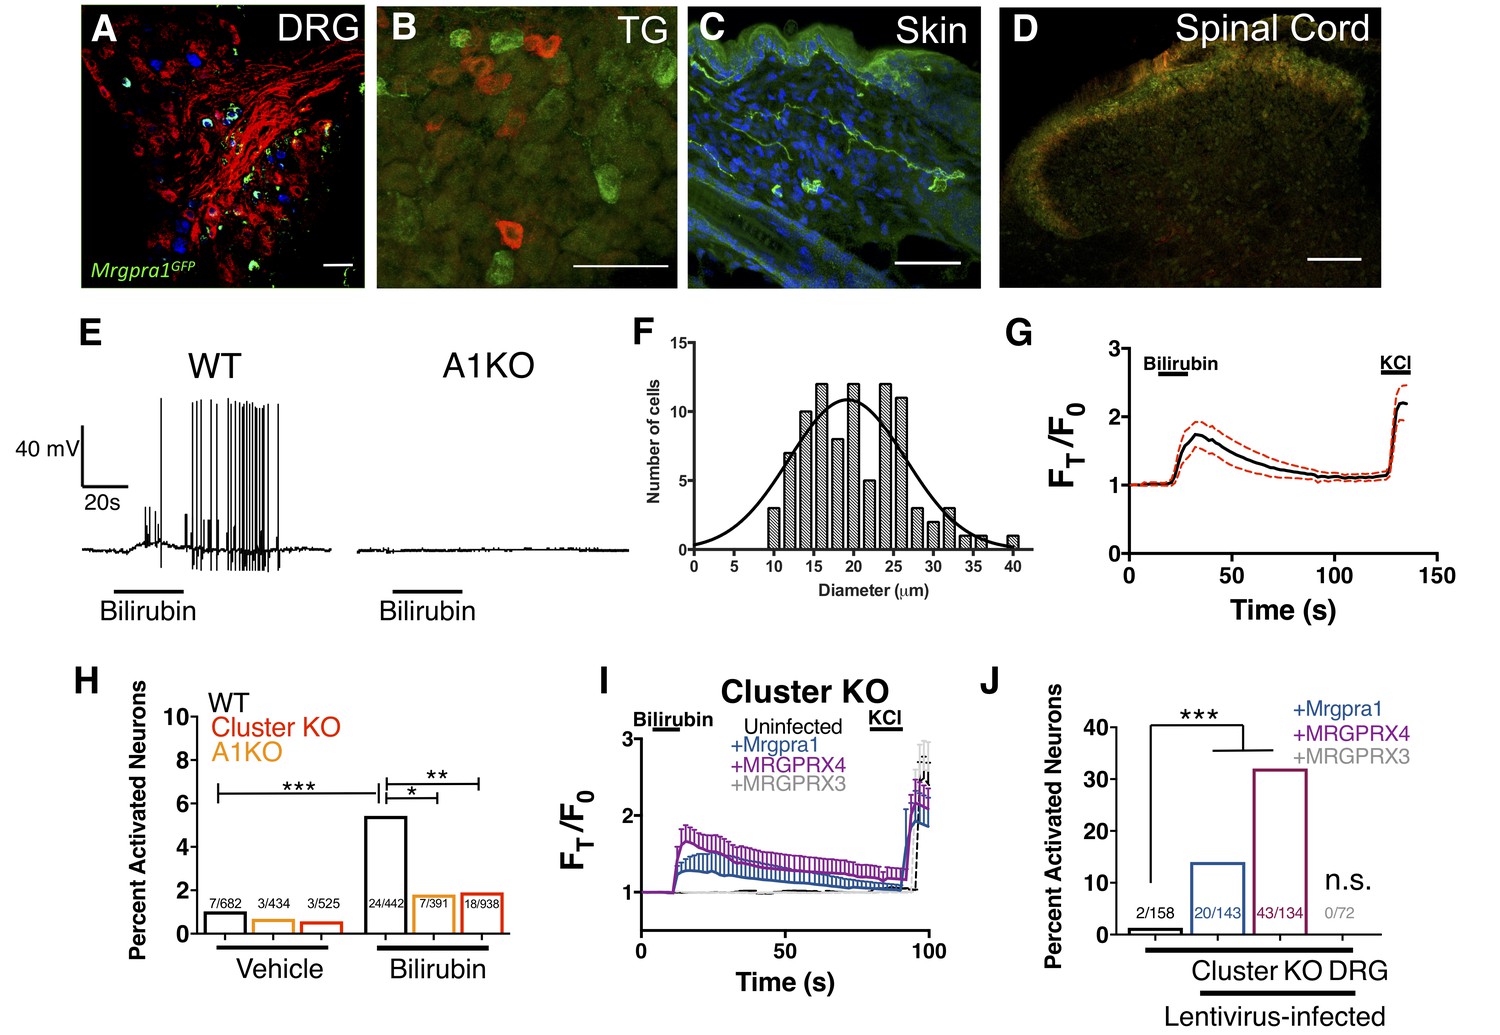
Bilirubin activates sensory neurons in an MRGPR-dependent manner.
(A–D) Confocal microscopy immunofluorescence images of adult mouse tissue sections from Mrgpra1GFP animals with GFP expression under the control of the endogenous Mrgpra1 locus. (A) Mrgpra1 expression in dorsal root ganglia. Green depicts Mrgpra1GFP. Red depicts anti-PLAP antibody staining where PLAP expression is controlled by the endogenous Mrgprd locus (MrgprdPLAP). Blue depicts antibody staining against calcitonin gene-related peptide (CGRP). Scale bar is 50 µM. (B) Trigeminal ganglia (TG) stained with Mrgpra1GFP (green) and anti-Substance P antibody (red). Scale bar is 50 μm. (C) Back skin stained with anti-GFP antibody (green) to visualize Mrgpra1GFP nerve fibers in the dermis. Blue represents DAPI counterstain. Scale bar is 50 μm. (D) Spinal cord (SC) (lamina 1 and 2) stained with anti-GFP and IB4-564. Mrgpra1GFP (green) staining was found in lamina two along with IB4 (red) positive terminals. Scale bar is 100 μm. (E) Representative whole-cell current-clamp recording of either WT or A1 KO DRG neurons. In WT DRG, bilirubin elicited action potentials in 5 out of 50 small-diameter neurons. In A1 KO DRG, bilirubin elicited action potentials in 0 out of 60 small-diameter neurons. Fisher’s exact test p < 0.05. (F) Histogram of bilirubin-activated neuronal soma diameter. (G) Ca2+ imaging of WT DRG neurons. Mean ±95% CI depicted. Compounds applied where indicated by black bars. After a 10 s baseline, 50 µM bilirubin was added. 50 mM KCl was added at the end of each trial. n = 20 neurons. (H) Percent activation of WT, A1 KO, and Mrgpr-cluster KO DRG by vehicle and 50 µM bilirubin. *, P < 0.05; **, p < 0.01; ***, p < 0.001; Chi-squared test. A neuron was considered to be activated if ∆F > 0.2 for at a least 30 s. (I) Ca2+ imaging of Mrgpr-cluster KO DRG neurons 48 hr after either mock infection with lentivirus (n = 10) or infected with lentivirus encoding Mrgpra1 (n = 6), MRGPRX4 (n = 10), or MRGPRX3 (n = 20). 50 µM bilirubin was added when indicated by the black bar. After 20 s, a 1 min wash was applied before addition of 50 mM KCl. Compounds applied where indicated by black bars. Mean ±95% CI depicted. n = 10 neurons. (J) Percent activation of uninfected, Mrgpra1-infected, MRGPRX4-infected, and MRGPRX3-infected Cluster -/- neurons by bilirubin. ***, p < 0.001. Chi-squared test.
-
Figure 3—source data 1
Source data for Figure 3.
- https://doi.org/10.7554/eLife.44116.011
Figure 4
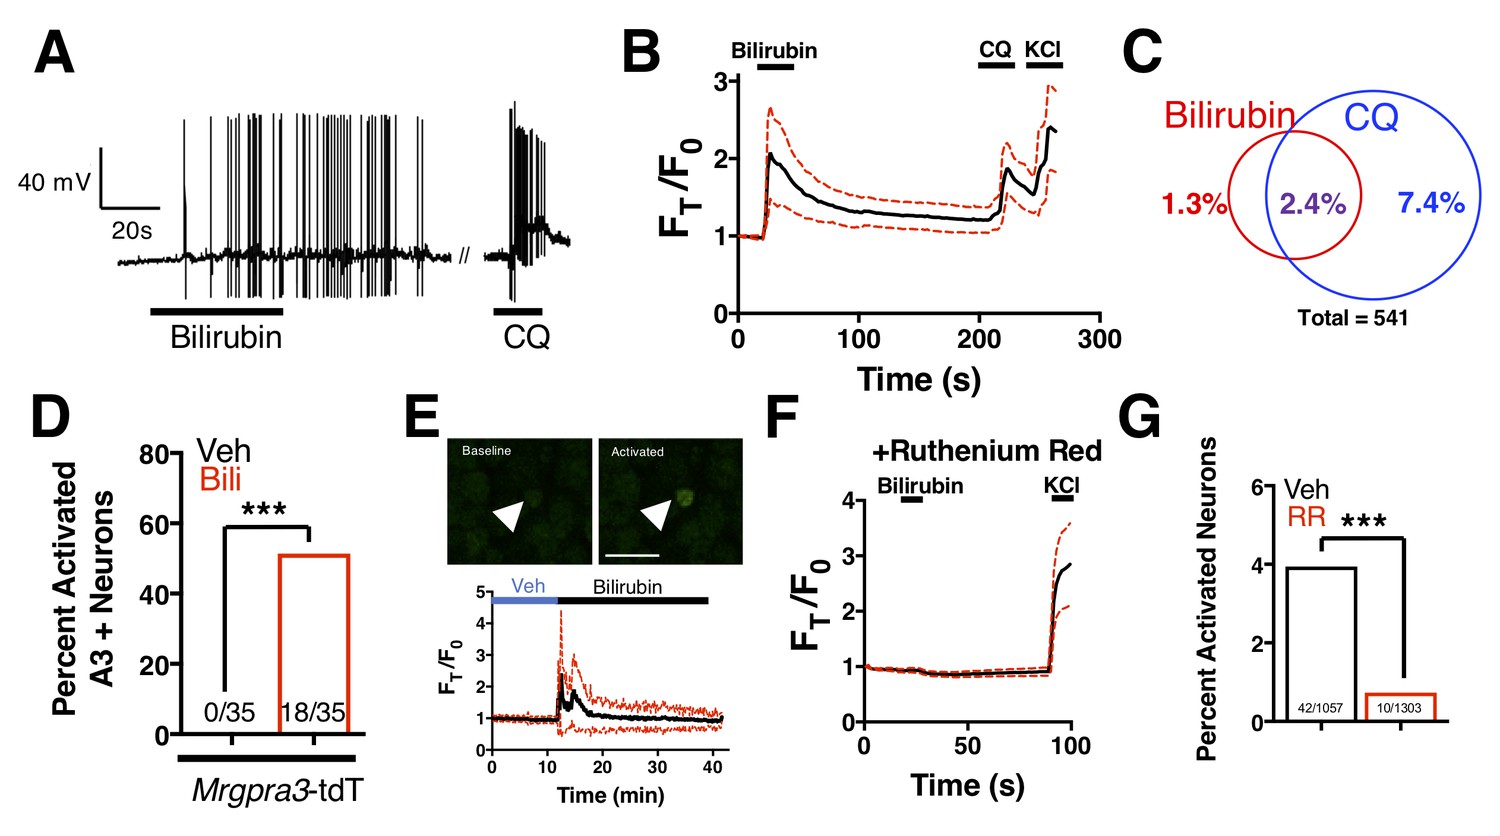
Bilirubin activates a population of small-diameter, chloroquine-sensitive sensory neurons in a TRP channel dependent mechanism.
(A) A representative whole-cell current-clamp recording of a WT DRG neuron responsive to addition of both 50 µM bilirubin and 1 mM chloroquine (CQ). (B) Ca2+ imaging of WT DRG neurons. Mean ±95% CI depicted. Compounds applied where indicated by black bars. After a 10 s baseline, 50 µM bilirubin was added. After 20 s, a 3 min wash was applied before 1 mM chloroquine was added. After 15 s, 50 mM KCl was added. n = 10 neurons. (C) Venn diagram of total neurons activated by either bilirubin and/or chloroquine (Bilirubin alone = 7, Chloroquine = 40, Overlap = 13). (D) Percent activation of Tg(Mrgpra3-Cre);lsl-tdTomato neurons as assessed by calcium imaging with vehicle, 1 mM Chloroquine, or 50 µM bilirubin. (E) In vivo Ca2+ imaging of Pirt-Cre; lsl-GCaMP6s animals. Briefly, a surgery was performed to expose L4 DRG. Baseline measurements were taken before a vehicle injection in ipsilateral paw and subsequent injection of 5 μL of 100 μM bilirubin. Depicted is a representative Ca2+ imaging trace of bilirubin-activated neurons, n = 20, identified by post hoc imaging analysis. The black trace is the mean Ft/F0 and red dotted lines represent 95% confidence intervals. (F) Neurons were incubated with 10 µM ruthenium red for 10 min before application of 50 µM bilirubin. (G) Percent activation of WT neurons, incubated with either vehicle or 10 µM ruthenium red, by 50 µM bilirubin.
-
Figure 4—source data 1
Source data for Figure 4.
- https://doi.org/10.7554/eLife.44116.013
Figure 5 with 3 supplements
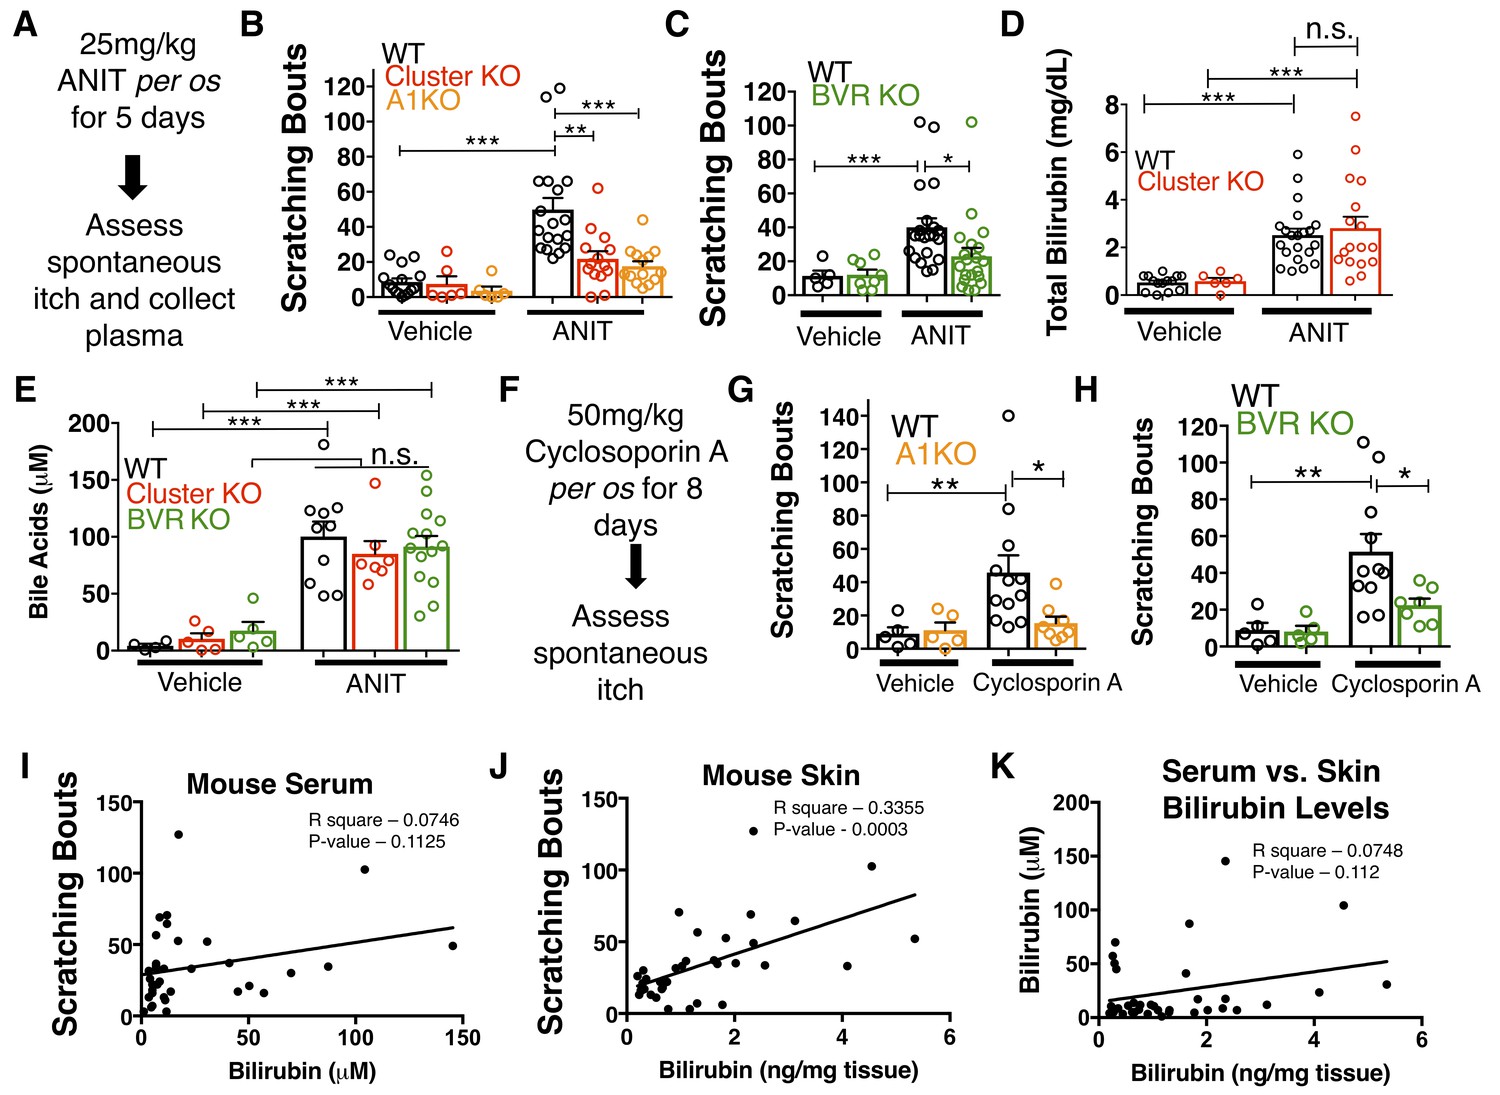
MrgprA1 KO, Mrgpr-cluster KO−, and BVR KO animals exhibit decreased cholestatic pruritus.
(A) Experimental flowchart for ANIT model of cholestasis. (B) Scratching bouts for vehicle and ANIT-treated mice among WT, Mrgpr-cluster KO, and A1 KO groups. Bouts were assessed in a 30 min period. For the vehicle cohort: WT n = 15, Mrgpr-cluster KO n = 6, A1 KO n = 6. For ANIT cohort: WT n = 20, Mrgpr-cluster KO n = 14, A1 KO n = 14. (C) Scratching bouts for vehicle and ANIT-treated animals among WT and BVR KO groups. Bouts were assessed in a 30 min period. For the vehicle cohort: WT n = 5 and BVR KO n = 8. For ANIT cohort: WT n = 21 and BVR KO n = 20. (D) Plasma bilirubin levels (mg/dL) from WT and Mrgpr-cluster KO ANIT-treated and vehicle-treated animals. For the vehicle cohort: WT n = 14, Mrgpr-cluster KO n = 6. For the ANIT cohort: WT n = 21, Mrgpr-cluster KO n = 17. (E) Plasma bile acid levels (µM) from ANIT-treated and vehicle-treated animals. For the vehicle cohort: WT n = 4, Mrgpr-cluster KO n = 5, BVR KO n = 5. For the ANIT cohort: WT n = 10, Mrgpr-cluster KO n = 7, BVR KO n = 14. (F) Experimental flowchart for Cyclosporin A model of cholestasis. (G) Scratching bouts for vehicle and Cyclosporin A-treated WT and A1 KO animals. For the vehicle cohort: n = 5 for all. For Cyclosporin A cohort: WT n = 10 and A1 KO n = 8. (H) Scratching bouts from vehicle and Cyclosporin A treated WT and BVR KO animals. For the vehicle cohort: n = 5. For Cyclosporin A cohort: WT n = 11 and BVR KO n = 7. (I) Correlation of serum bilirubin levels from cholestatic animals and scratching bouts. Line of best fit: Y = 0.23 (X) + 28.78. (J) Correlation of skin bilirubin levels from cholestatic animals and scratching bouts. Line of best fit: Y = 12.34 (X) + 16.7. (K) Correlation of skin and serum bilirubin levels from cholestatic animals. Line of best fit: Y = 7.015(X) – 14.52. (A–H) Mean ±s.e.m. depicted. Open circles represent individual data points. *, p < 0.05; **, p < 0.01; ***, p < 0.001 by unpaired two-tailed Student’s t-test.
-
Figure 5—source data 1
Source data for Figure 5.
- https://doi.org/10.7554/eLife.44116.018
Figure 5—figure supplement 1

Plasma levels of pathological markers of liver injury are similar between WT, Mrgpr-clusterΔ−/−, A1 KO, and BVR KO animals.
(A) Plasma alkaline phosphatase (ALP) levels among vehicle and ANIT-treated animals. For vehicle cohort: WT n = 10, Mrgpr-cluster KO n = 4, A1 KO n = 4, BVR KO n = 6. For ANIT cohort: WT n = 17, Mrgpr-cluster KO n = 6, A1 KO n = 5, BVR KO n = 15. (B) Plasma aspartate aminotransferase (AST) levels among vehicle and ANIT-treated animals. For vehicle cohort: WT n = 10, Mrgpr-cluster KO n = 4, A1 KO n = 4, BVR KO n = 9. For ANIT cohort: WT n = 12, Mrgpr-cluster KO n = 6, A1 KO n = 5, BVR KO n = 17. (C) Alanine aminotransferase (ALT) levels among vehicle and ANIT-treated animals. For vehicle cohort: WT n = 10, Mrgpr-cluster KO n = 4, A1 KO n = 4, BVR KO n = 6. For ANIT cohort: WT n = 15, Mrgpr-cluster KO n = 6, A1 KO n = 5, BVR KO n = 17. (D) Gamma-glutamyl transferase (GGT) levels among vehicle and ANIT-treated animals. For vehicle cohort: WT n = 10, Mrgpr-cluster KO n = 4, BVR KO n = 6. For ANIT cohort: WT n = 17, Mrgpr-cluster KO n = 6, BVR KO n = 15. (E) Met-enkephalin levels among plasma from vehicle and ANIT-treated animals. For vehicle cohort: WT n = 4, Mrgpr-cluster KO and BVR KO n = 5. For ANIT cohort: WT n = 19, Mrgpr-cluster KO n = 10, BVR KO n = 11. (F) Autotaxin activity among plasma from vehicle and ANIT-treated animals. For vehicle cohort: WT and BVR KO n = 4, Mrgpr-cluster KO n = 5. For ANIT cohort: WT n = 12, Mrgpr-cluster KO n = 8, BVR KO n = 10. (A-F) Mean ±s.e.m. depicted. Open circles represent independent data points. *, p < 0.05; **, p < 0.01, ***, p < 0.001; two-tailed unpaired Student’s t-test. n.s., not significant.
Figure 5—figure supplement 2
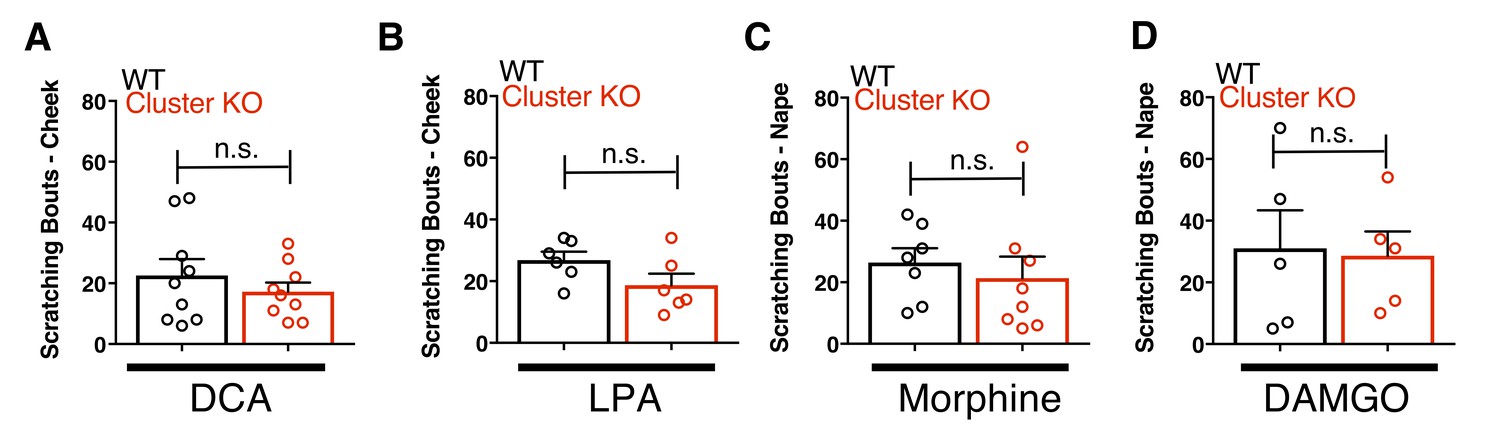
Mrgpr-cluster KO animals have intact itch to other cholestatic pruritogens and bilirubin synergism with chloroquine itch.
(A) Scratching bouts to 1.3 mM deoxycholic acid (DCA) injected into cheek. WT n = 9, Mrgpr-cluster KO n = 9. (B) Scratching bouts to 4 mM lysophosphatidic acid (LPA) injected into cheek. WT n = 6, Mrgpr-clusterΔ−/−n = 6. (C) Scratching bouts to 25 µg of morphine injected into back. WT n = 7, Mrgpr-clusterΔ−/−n = 8. (D) Scratching bouts to 25 µg of DAMGO injected into back. WT n = 5, Mrgpr-cluster KO n = 5. (E) Synergism of bilirubin with chloroquine pruritus. Scratching bouts to 1 mM chloroquine plus either vehicle or 500 µM bilirubin injected into back. For 1 mM chloroquine plus vehicle: WT n = 9, A1 KO n = 5. For 1 mM chloroquine plus 500 µM bilirubin: WT n = 11, A1 KO n = 5. (A-E) Mean ±s.e.m. depicted. Open circles represent independent data points. **, p < 0.01, ***, p < 0.001; two-tailed unpaired Student’s t-test. n.s., not significant.
Figure 5—figure supplement 3
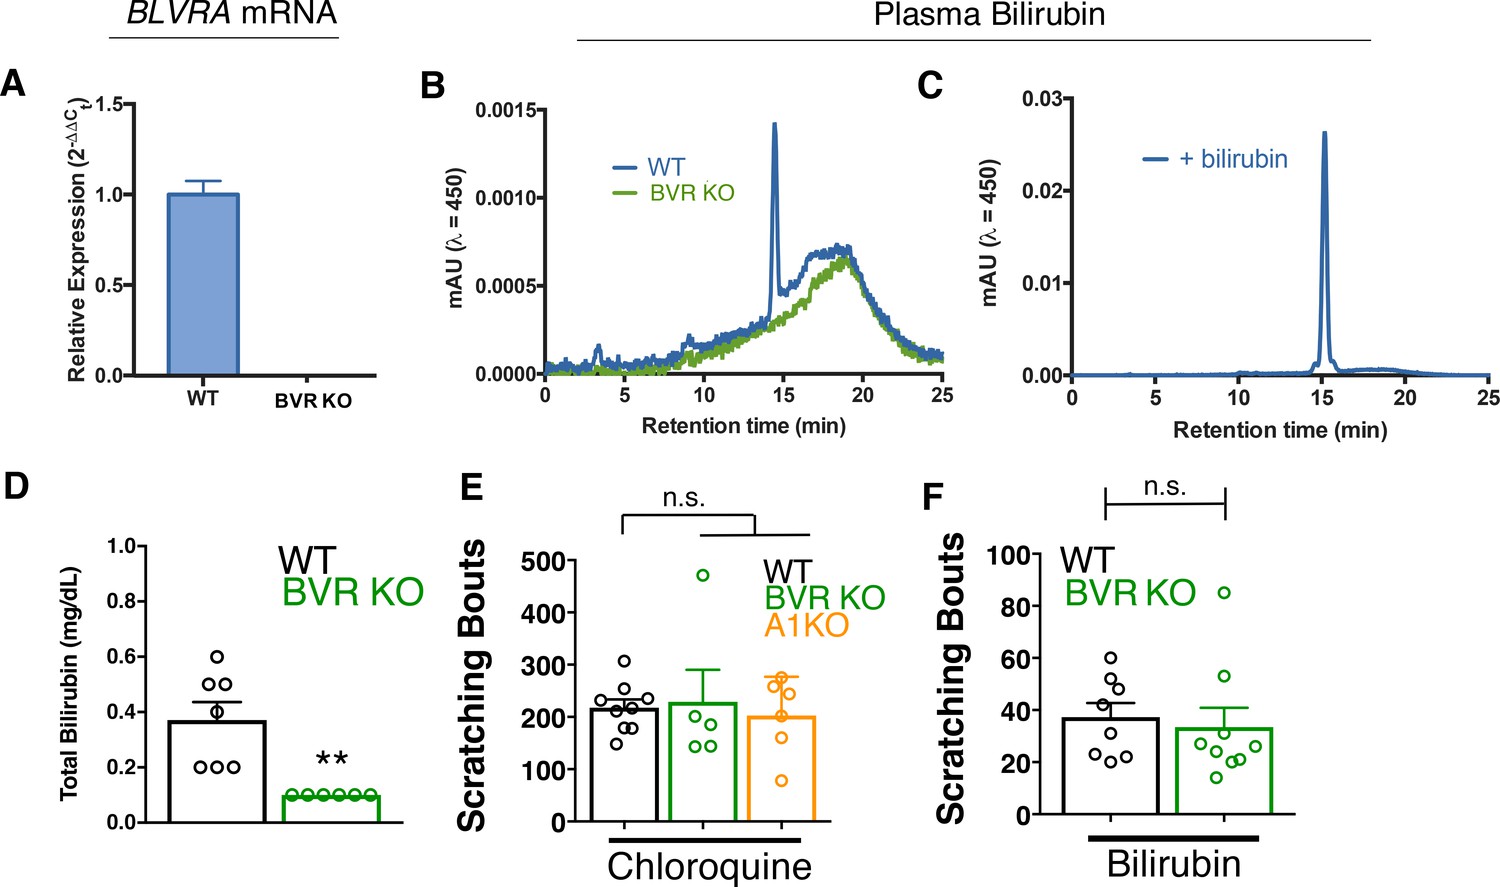
BVR KO and A1 KO animals have intact itch circuits.
(A) Quantitative PCR analysis of BLVRA transcript from whole brain of WT and BVR KO mice. (B) Representative chromatogram of HPLC analysis of plasma from WT and BVR KO mice separated via a C18 column and analysed by absorbance at 450 nm. (C) HPLC chromatogram of plasma from a WT mouse spiked with excess bilirubin. (D) Total bilirubin levels from plasma of WT and BVR KO animals. WT n = 7, BVR KO n = 6. (E) Scratching bouts to 150 µg (50 µL of 10 mM) of chloroquine. After chloroquine injection, scratching bouts were assessed in a 30 min period. WT n = 9, BVR KO n = 5, A1 KO n = 6. (F) Scratching bouts to 60 µg (100 µL of 1 mM) of bilirubin. After bilirubin injection, scratching bouts were assessed in a 30 min period. WT n = 8, BVR KO n = 9. (D-F) Mean plus S.E.M. depicted. Open circles represent independent data points. **, p < 0.01 by student’s t-test. n.s., not significant.
Figure 6
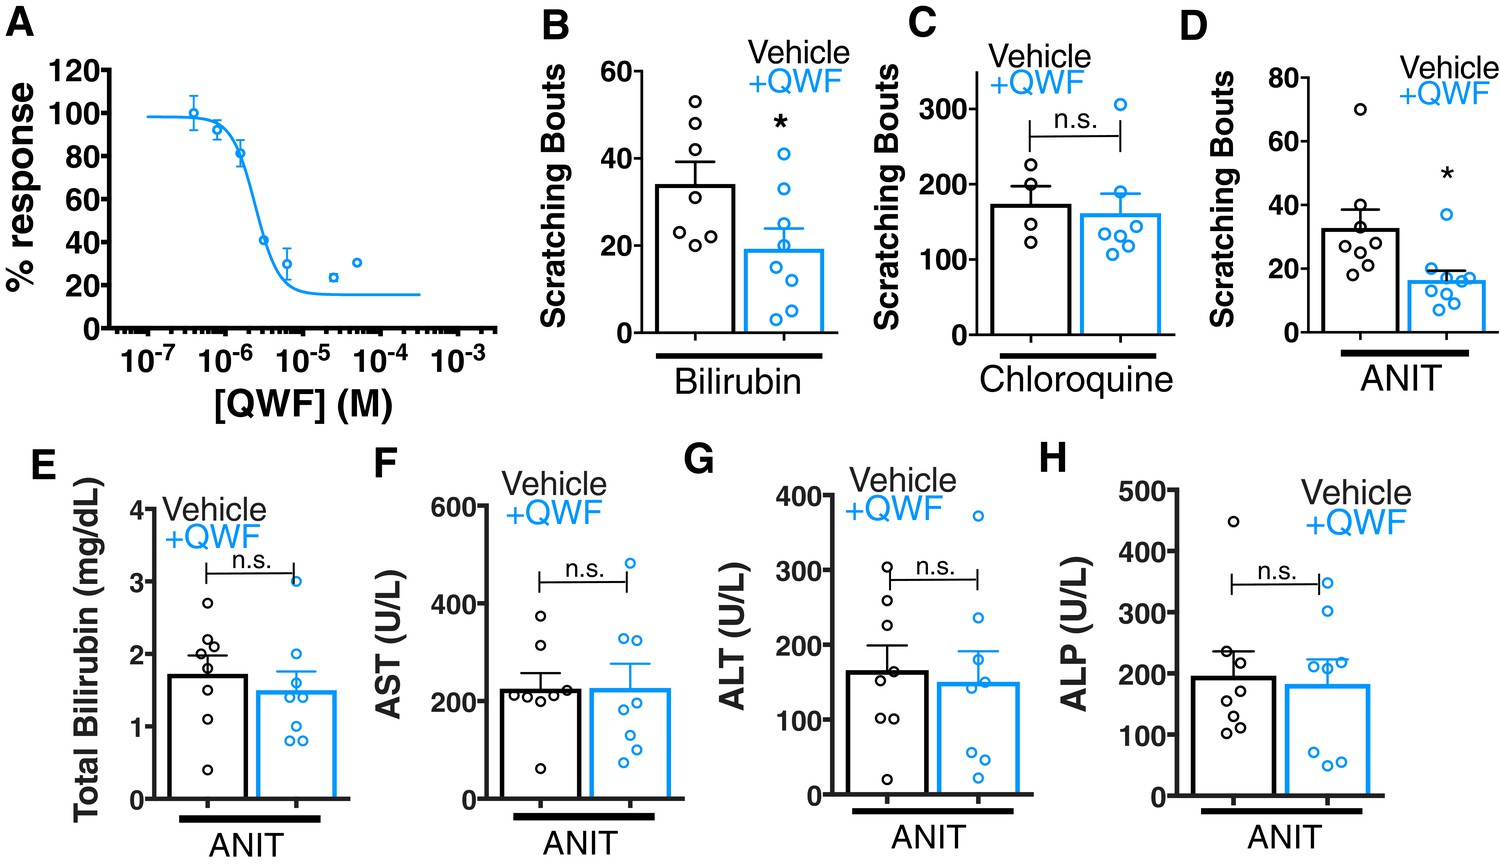
QWF treatment blocks bilirubin activation of Mrgpra1 and cholestatic pruritus.
(A) Concentration-response curve for bilirubin induced Ca2+ signal in MRGPRA1-expressing HEK cells. 200 µM bilirubin was maintained in competition with indicated doses of QWF. Mean ±s.e.m. depicted. n = 3 replicates in duplicate. (B–C) Scratching bouts from (B) 60 µg (100 mL of 1 mM) bilirubin or (C) 150 µg chloroquine co-injected with either vehicle or 1 mg/kg QWF. After injection, the number of scratching bouts in 30 min was assessed. For bilirubin: Vehicle n = 7, QWF n = 8. For chloroquine: Vehicle n = 4, QWF n = 7. (D) Scratching bouts from WT ANIT-treated animals. Either vehicle or 1 mg/kg QWF was delivered i.p. Vehicle n = 8, QWF n = 9. (E–H) Plasma (E) bilirubin, (F) AST, (G) ALT, and (H) ALP levels from of vehicle and QWF-dosed WT animals that have undergone ANIT liver injury. (B–H) Mean ±s.e.m. depicted. Open circles represent independent data points. n.s., not significant; *, p < 0.05 by two-tailed unpaired Student’s t-test.
-
Figure 6—source data 1
Source data for Figure 6.
- https://doi.org/10.7554/eLife.44116.020
Figure 7 with 1 supplement
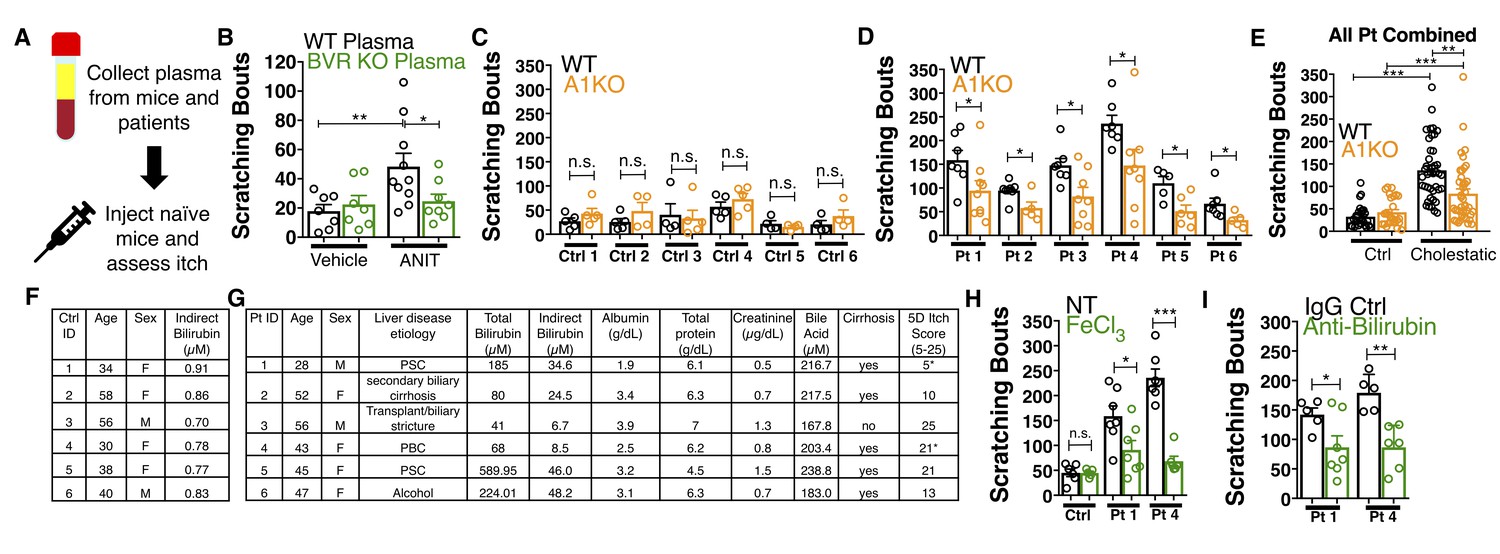
Bilirubin from mouse and human cholestatic plasma contributes to pruritus in a Mrgpra1-dependent manner.
(A) Experimental flowchart of plasma injection assay. (B) Scratching bouts from WT mice injected with either vehicle- or ANIT-treated plasma from WT and BVR KO animals. For the vehicle plasma cohort: n = 7. For cholestatic ANIT-treated plasma: WT n = 10 and BVR KO n = 8. (C) Scratching bouts from either WT or A1 KO mice injected with control donor plasma. Ctrl 1, WT n = 5, A1 KO n = 5. Ctrl 2, WT n = 5, A1 KO n = 5. Ctrl 3, WT n = 5, A1 KO n = 4. Ctrl 4, WT n = 4, A1 KO n = 5. Ctrl 5, WT n = 4, A1 KO n = 4. Ctrl 6, WT n = 4, A1 KO n = 4. (D) Scratching bouts from either WT or A1 KO mice injected with either cholestatic patient plasma. Patient 1, WT n = 7, A1 KO n = 9. Patient 2, WT n = 8, A1 KO n = 5. Patient 3, WT n = 7, A1 KO n = 8. Patient 4, WT n = 6, A1 KO n = 8. Patient 5, WT n = 5, A1 KO n = 6. Patient 6, WT n = 7, A1 KO n = 5. (E) Scratching bouts from either WT or A1 KO mice injected with plasma collected from all tested control donor samples and all tested cholestatic patient samples. For Control: WT n = 27, A1 KO n = 27. For cholestatic patient: WT n = 41, A1 KO n = 41. (F–G) Biochemical characteristics of patient and control plasma. (F) Age, sex, and bilirubin levels of control plasma collected. All control plasma donors did not suffer from any chronic itch condition. (G) 5D itch questionnaire was administered at time of plasma collection. Asterisk denotes patients taking anti-pruritic medication at time of plasma collection and questionnaire administration. Patient one was taking sertraline (100 mg QD) and Patient four was taking Gabapentin (800 mg TID). A score of 25 represents the maximum level of itchiness. (H) Scratching bouts from mice injected with either untreated (NT) control human plasma, FeCl3-treated control human plasma, NT cholestatic patient 1 and 4 plasma (same data from Patient WT data in (D), or FeCl3-treated patient plasma. For control plasma, NT n = 6 and FeCl3n = 5. For Patient one plasma, NT n = 7 and FeCl3n = 7. For Patient four plasma, NT n = 7 and FeCl3n = 6. (I) Scratching bouts from mice injected with either normal rabbit IgG –treated patient plasma or anti-bilirubin IgG – treated patient plasma. For Patient 1, Normal IgG n = 5, Anti-bilirubin n = 7. For Patient 4, Normal IgG n = 5, Anti-bilirubin n = 6. (B–I) Mean ±s.e.m. depicted. Open circles represent independent data points. n.s., not significant; *, p<0.05; **, p<0.01; ***, p<0.001 by unpaired two-tailed Student’s t-test.
-
Figure 7—source data 1
Source data for Figure 7.
- https://doi.org/10.7554/eLife.44116.023
Figure 7—figure supplement 1
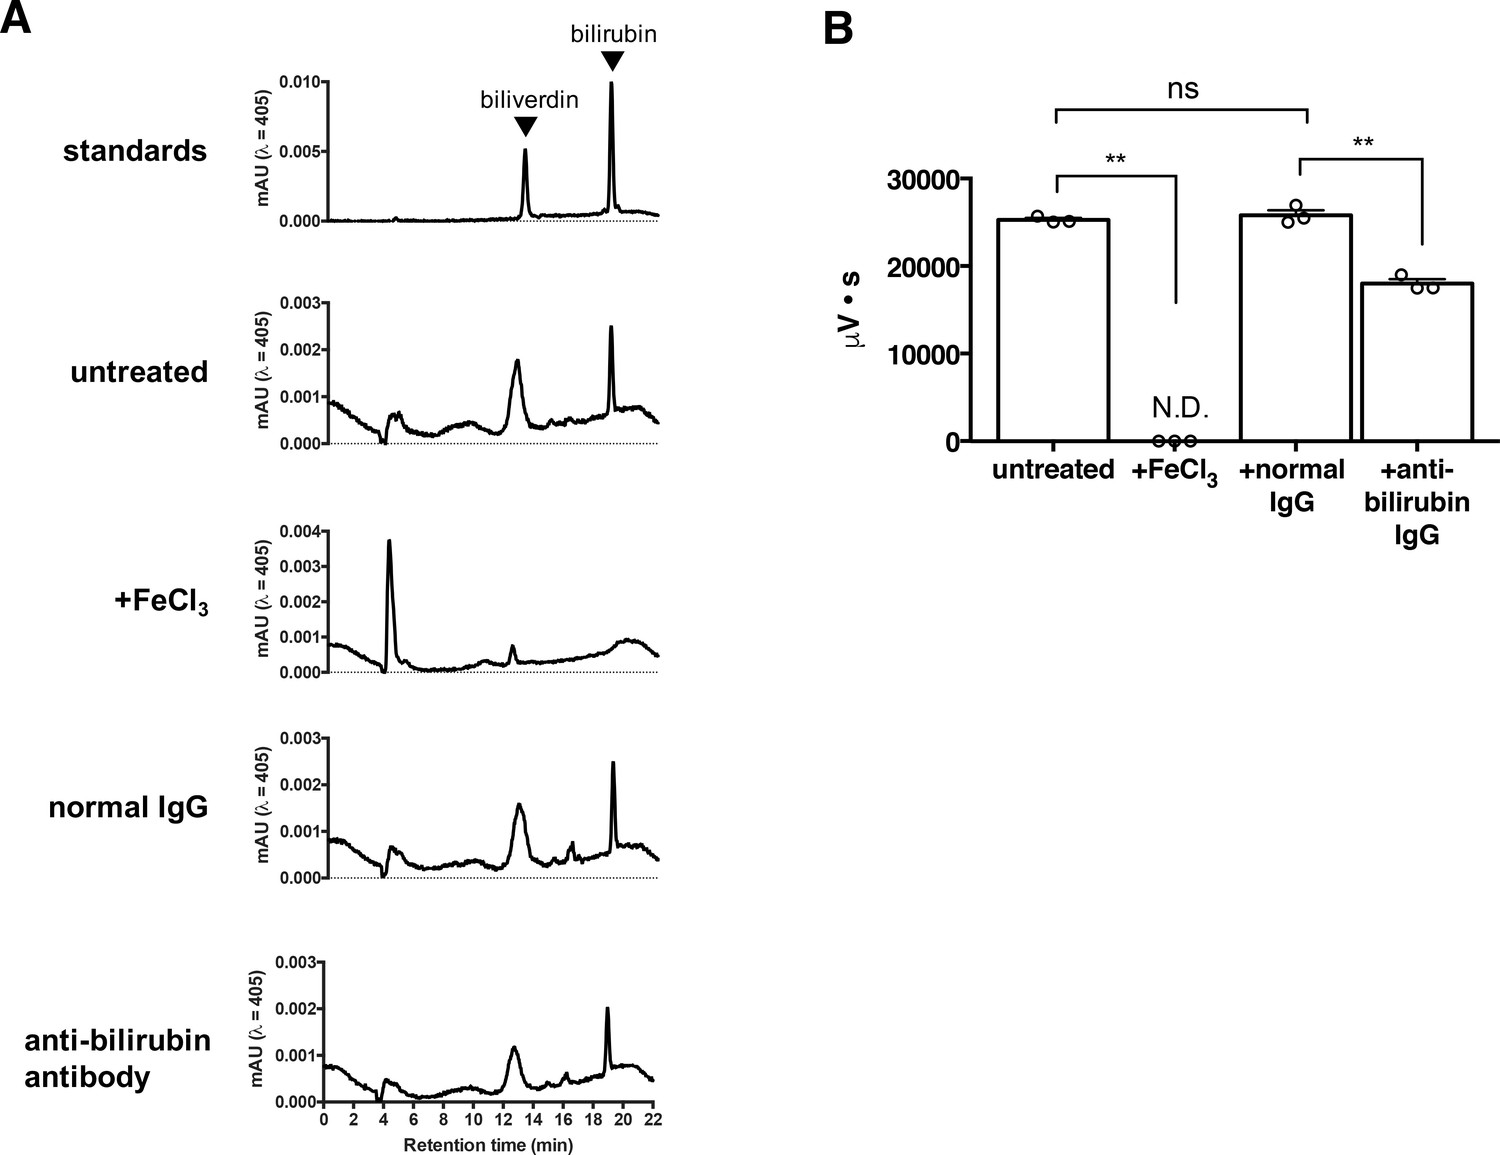
FeCl3 and anti-bilirubin antibody depletion of plasma bilirubin.
(A) Representative HPLC chromatogram of 100 μM biliverdin +100 μM bilirubin standards and treated plasma samples. Absorbance was measured at 405 nm. (B) Quantification of plasma bilirubin in untreated, FeCl3, normal rabbit IgG, and bilirubin antibody-treated samples. Points represent technical replicates. Mean ±s.e.m. depicted **, p<0.01; n.s., not significant by two-way ANOVA followed by post-hoc Tukey test.
Tables
Key resources table
| Reagent type (species) or resource | Designation | Source or reference | Identifiers | Additional information |
|---|---|---|---|---|
| Gene (M. Musculus) | Mrgpra1 | N/A | MGI:3033095 | |
| Gene (H. Sapiens) | MRGPRX4 | N/A | Ensembl: ENSG00000179817 | |
| Genetic reagent (M. Musculus) | Mrgpr-cluster KO | PMID: 20004959 | MGI:2684085 | |
| Genetic reagent (M. Musculus) | Mrgpra1GFP | PMID: 11551509 | MGI:3033095 | |
| Genetic reagent (M. Musculus) | MrgprdPLAP | PMID: 17618277 | MGI:3033142 | |
| Genetic reagent (M. Musculus) | Tg(Mrgpra3-Cre) | PMID: 23263443 | MGI:5506535 | |
| Genetic reagent (M. Musculus) | Tg(Pirt-Cre) | PMID: 24462040 | MGI:2443635 | |
| Genetic reagent (M. Musculus) | Rosa26-lslGCaMP6s | Jackson Labs | Stock No: 024106 | |
| Genetic reagent (M. Musculus) | Rosa26-lslTdTomato | Jackson Labs | Stock No: 007914 | |
| Genetic reagent (M. Musculus) | Mrgpra1 KO | Newly generated | MGI:3033095 | Generated by CRISPR Cas9 by Johns Hopkins Transgenics Core on the C57Bl/6J background |
| Genetic reagent (M. Musculus) | BVR KO | Newly generated | MGI:88170 | Generated by Ozgene on the C57Bl/6J background |
| Chemical compound, drug | bilirubin IXα | Frontier Scientific | Catalog No. B584-9 | |
| Chemical compound, drug | a-naphthyl isothiocyanate | Sigma | Catalog No. N4525 | |
| Chemical compound, drug | Biliverdin | Sigma | Catalog No. 30891 | |
| Chemical compound, drug | Chloroquine | Sigma | Catalog No. C6628 | |
| Chemical compound, drug | Compound 48/80 | Sigma | Catalog No. C2313 | |
| Chemical compound, drug | Cyclosporin A | Sigma | Catalog No. 30024 | |
| Chemical compound, drug | Hemin | Sigma | Catalog No. H9039 | |
| Chemical compound, drug | U73122 | Selleck Chemicals | Catalog No. S8011 | |
| Chemical compound, drug | YM254890 | Wako Chemicals | Catalog No. 253–00633 | |
| Chemical compound, drug | Ruthenium Red | Sigma | Catalog No. R2751 | |
| Chemical compound, drug | Fluo-4 AM | Molecular Probes | Catalog No. 20550 | |
| Chemical compound, drug | Fura-2 AM | Thermo Fisher | Catalog No. F1201 | |
| Chemical compound, drug | BOC-GLN-D-(FORMYL)TRP-PHE-BENZYLESTER | Sigma | Catalog No. B5431 | |
| Chemical compound, drug | Bilirubin ditaurate | Lee Biosciences | Catalog No. 910–12 | |
| Chemical compound, drug | Cetirizine | Tocris Biosciences | Catalog No. 2577 | |
| Chemical compound, drug | Stercobilin | Santa Cruz Biotechnology | Catalog No. sc-264326 | |
| Chemical compound, drug | Urobilinogen | Santa Cruz Biotechnology | Catalog No. sc-296690 | |
| Chemical compound, drug | GS-IB4 - 568 | Invitrogen | I-21412 | (1:500) |
| Peptide, recombinant protein | Human Serum Albumin | Sigma | Catalog No. A9511 | |
| Peptide, recombinant protein | BAM8-22 | Sigma | Catalog No. SML0729 | |
| Peptide, recombinant protein | FMRF peptide | Sigma | Catalog No. N3637 | |
| Peptide, recombinant protein | Fibronectin | Sigma | Catalog No. F0895 | |
| Antibody | anti-GFP (rabbit polyclonal) | Molecular Probes | A-11122; RRID:AB_221569 | (1:1000) |
| Antibody | anti-CGRP (rabbit polyclonal) | Peninsula | T-4239; RRID:AB_518150 | (1:1000) |
| Antibody | anti-Substance P (rat monoclonal) | Abcam | M09205; RRID:AB_305866 | (1:250) |
| Antibody | Goat anti-rabbit (Alexa Fluor 568) | Molecular Probes | A11011; RRID:AB_143157 | (1:1000) |
| Antibody | Goat anti-rabbit (Alexa Fluor 488) | Molecular Probes | A11008; RRID:AB_143165 | (1:1000) |
| Antibody | Goat anti-Rat (Alexa Fluor 647) | Invitrogen | A-21247; RRID:AB_141778 | (1:500) |
Additional files
-
Transparent reporting form
- https://doi.org/10.7554/eLife.44116.024
Download links
A two-part list of links to download the article, or parts of the article, in various formats.
Downloads (link to download the article as PDF)
Open citations (links to open the citations from this article in various online reference manager services)
Cite this article (links to download the citations from this article in formats compatible with various reference manager tools)
Identification of a bilirubin receptor that may mediate a component of cholestatic itch
eLife 8:e44116.
https://doi.org/10.7554/eLife.44116


