High-order thalamic inputs to primary somatosensory cortex are stronger and longer lasting than cortical inputs
- Columbia University, United States
Figures
Figure 1

Long-range projection axons from POm, M1 and S2 innervate Layer 1.
(A) Top panel: labeling of long-range projection axons with ChR2-eYFP from POm (left), M1 (center), and S2 (right) shown in coronal sections of barrel cortex. Bottom: Sites of viral infection in POm (left), M1 (center), and S2 (right). Bar: 500 μm. D, dorsal; L, lateral. Dashes, pia. (B) Average laminar profile of ChR2-eYFP labeled axons in barrel cortex. Pixel intensity was measured only for barrel-related columns (not including septal regions) and normalized to peak (n = 4 rats for each infected region; shading,±SEM).
Figure 2 with 2 supplements
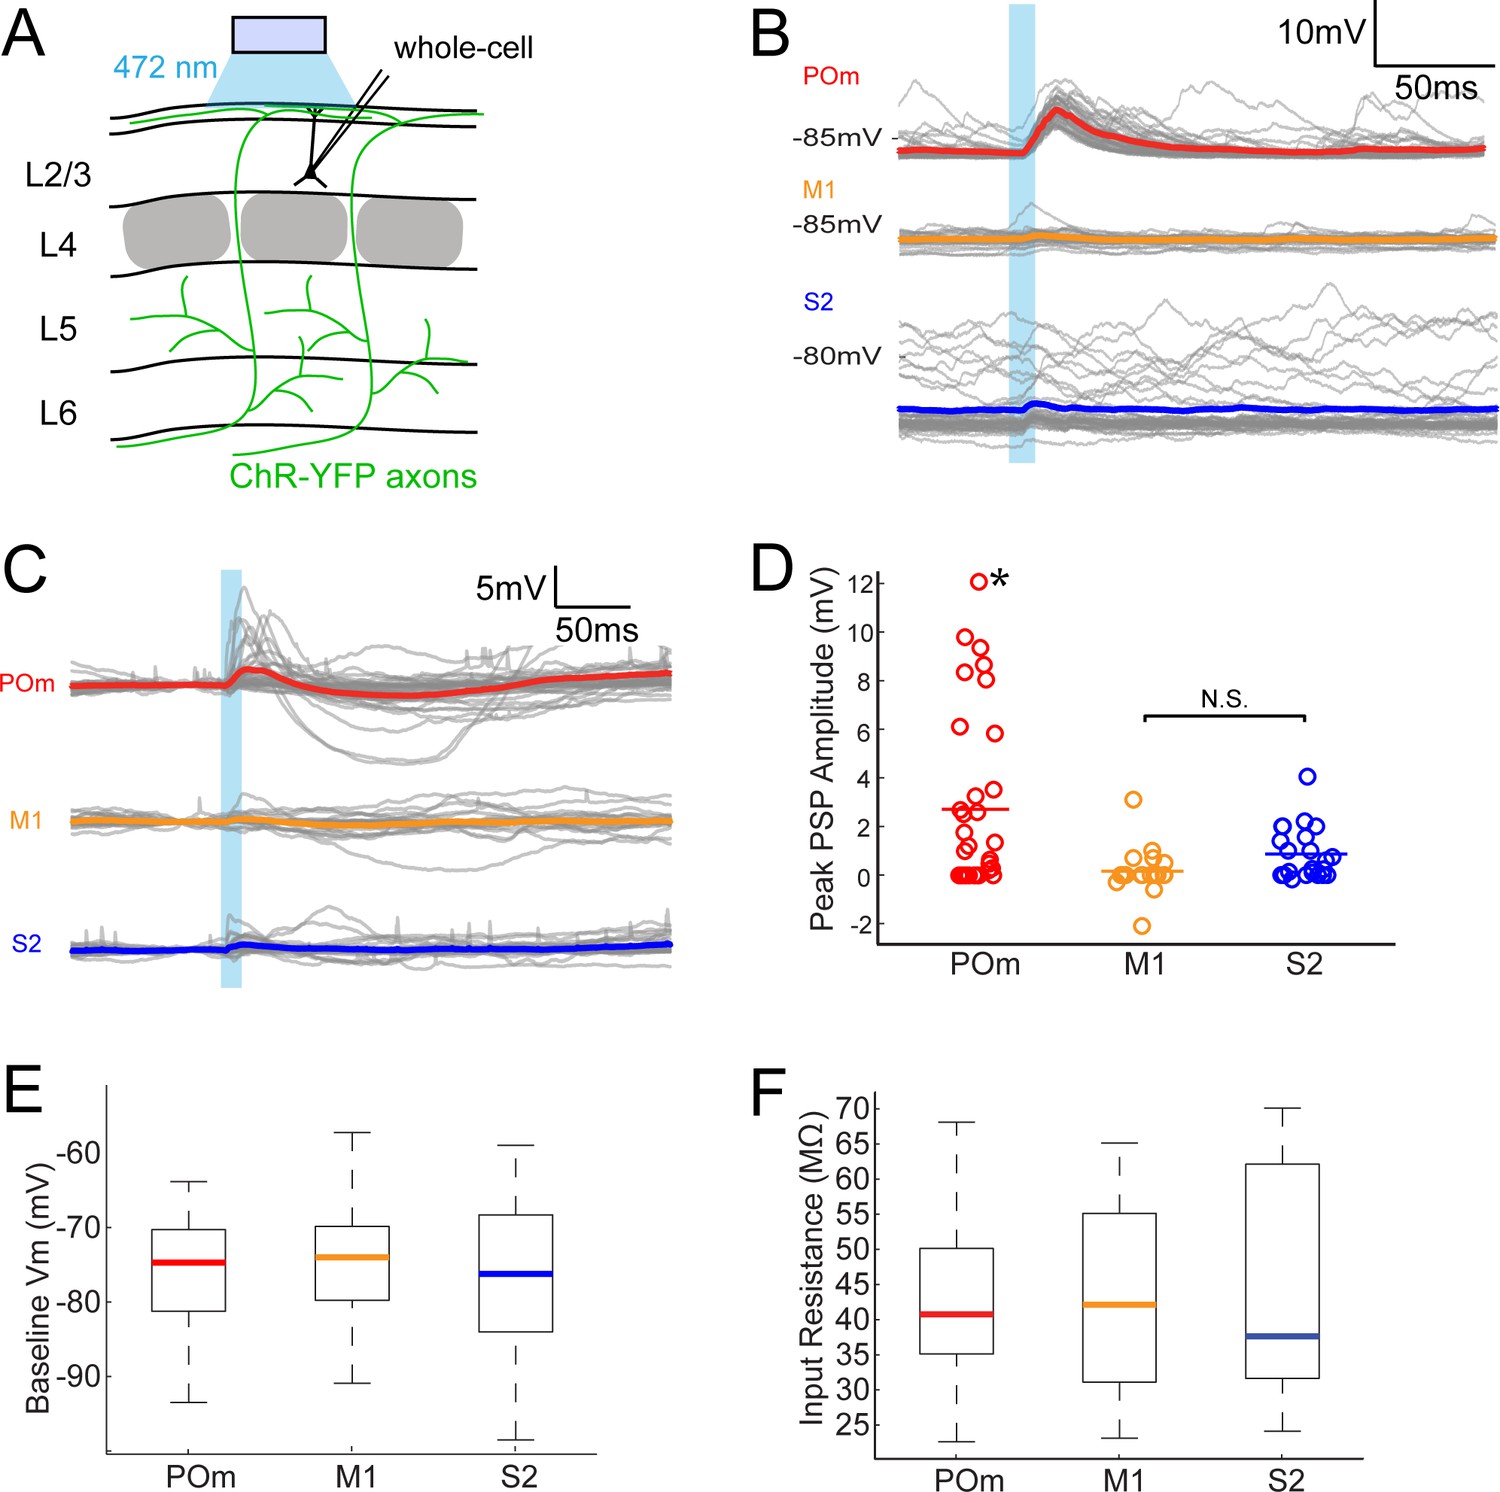
POm axons more strongly excite L2/3 pyramidal neurons than M1 or S2 axons do.
(A) Schematic of in vivo ChR2 activation of long-range projection axons in barrel cortex and whole-cell recording of L2/3 pyramidal neurons. Gray, L4 barrels. (B) Example whole-cell responses of three L2/3 pyramidal neurons to photo-activating long-range axons from infected cells in POm (top), M1 (middle), and S2 (bottom). Gray, 20 single trials recorded per cell; Colored, trial average. (C) Population average, baseline-subtracted responses of L2/3 pyramidal neurons to photo-activation of axons. Gray, average responses of individual neurons, n = 33 for POm, 19 for M1, and 22 for S2. Colored, average response for each input type. Baselines just prior to photo-activation have been aligned to allow visual comparison of responses. (D) Distributions of peak response amplitudes to photo-activation. Activation of POm axons on average elicits a significantly larger excitatory response than activation of M1 and S2 . One-way ANOVA, p=0.0015. N.S., not significant. (E) Distribution of baseline Vm of recorded L2/3 neurons. Baseline Vm did not differ among groups (one-way ANOVA, p=0.92). (F) Distribution of resting Rin of recorded L2/3 neurons. Resting Rin did not differ among groups (one-way ANOVA, p=0.85).
Figure 2—figure supplement 1
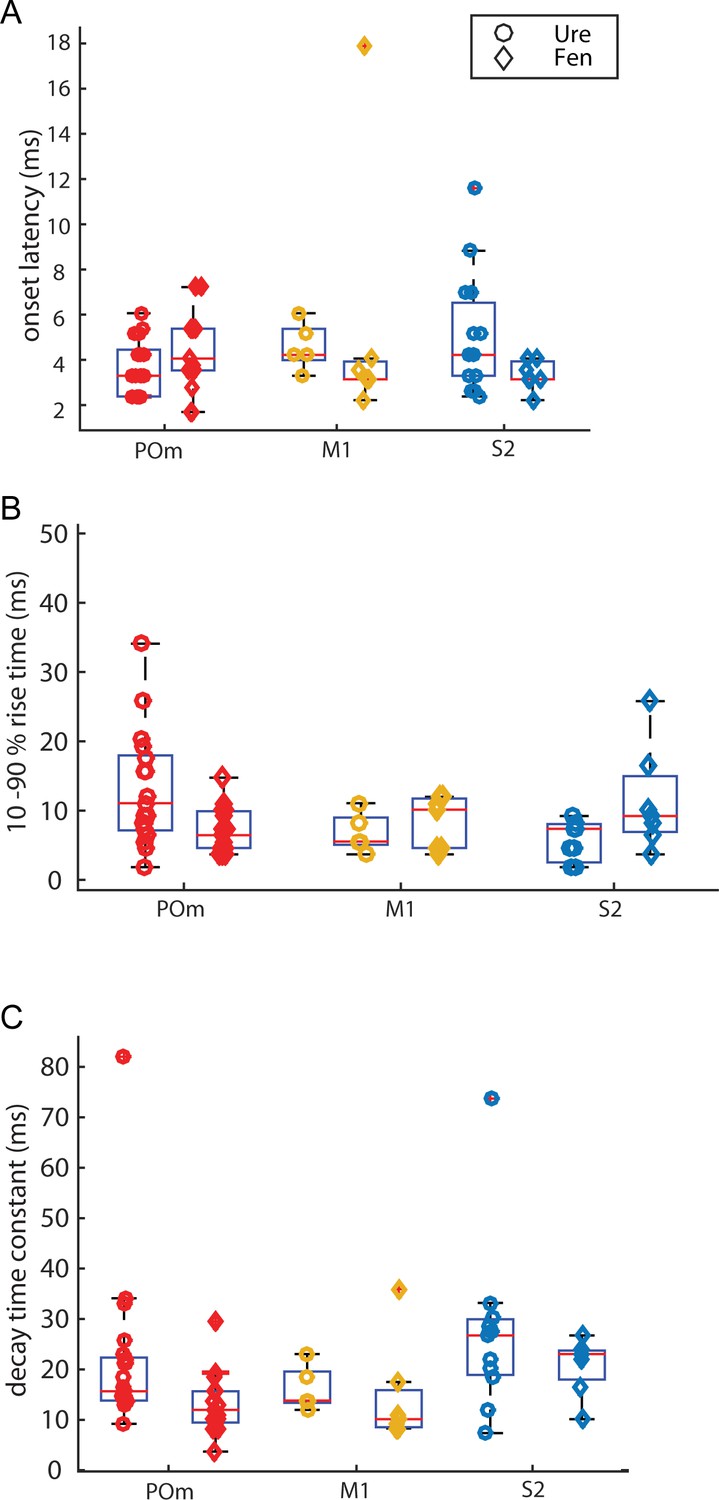
Kinetic characteristics of initial EPSP elicited by photo-activation.
(A) Onset delays of ChR-activated EPSPs are similar for all groups compared. (Kruskal-Wallis, p = 0.34; POm: urethane n = 22, fentanyl n = 15; M1 urethane: n = 5, fentanyl n = 8; S2 urethane: n = 16, fentanyl n = 7) (B) Rise time (10 - 90%) of ChR-activated EPSPs are similar for all groups compared. (Kruskal-Wallis, p = 0.29) (C) Decay time constant of ChR-activated EPSPs are similar for all groups compared, (Kruskal-Wallis, p = 0.37)
Figure 2—figure supplement 2
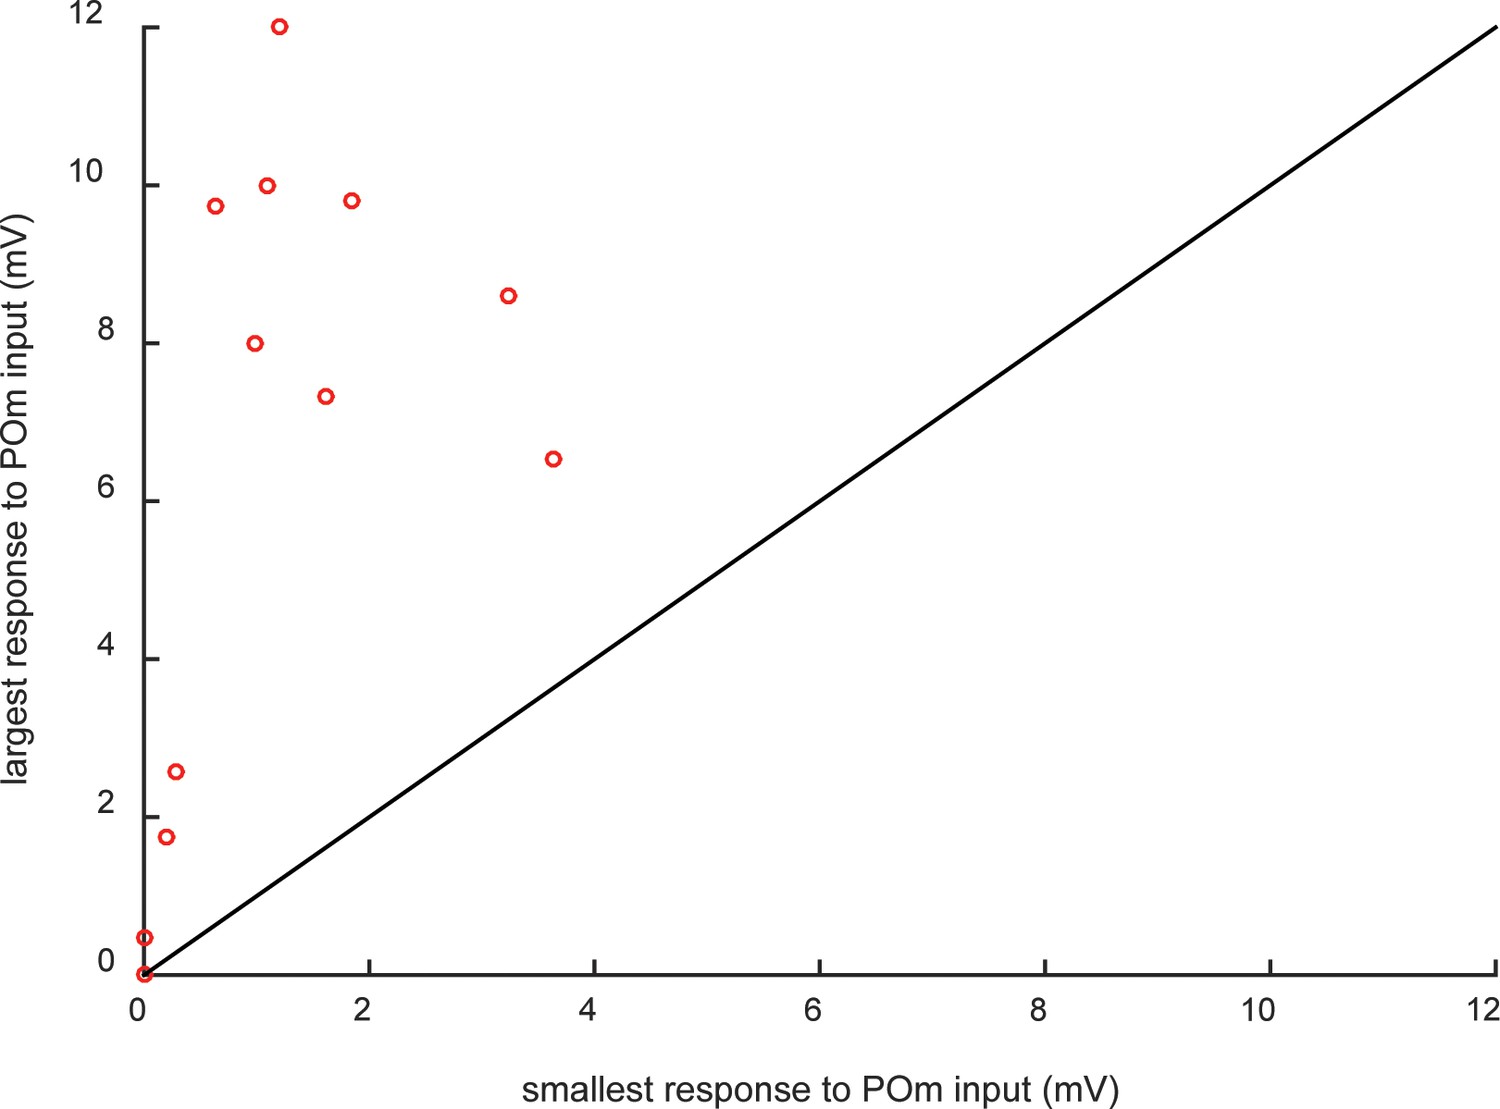
Individual animals exhibited wide ranges of POm input strengths.
Multiple L2/3 cortical neurons per animal were recorded in 15 of the POm-infected rats. Each circle indicates the smallest and largest PSPs observed in a rat. Cells with the strongest POm inputs (>6 mV) are observed in the same rats in which cells receiving relatively weak POm input, as much as 10 times smaller. If cells with strong POm inputs were regularly found in the same animals (due to injection variability), individual rats would have fallen close to the unity line.
Figure 3
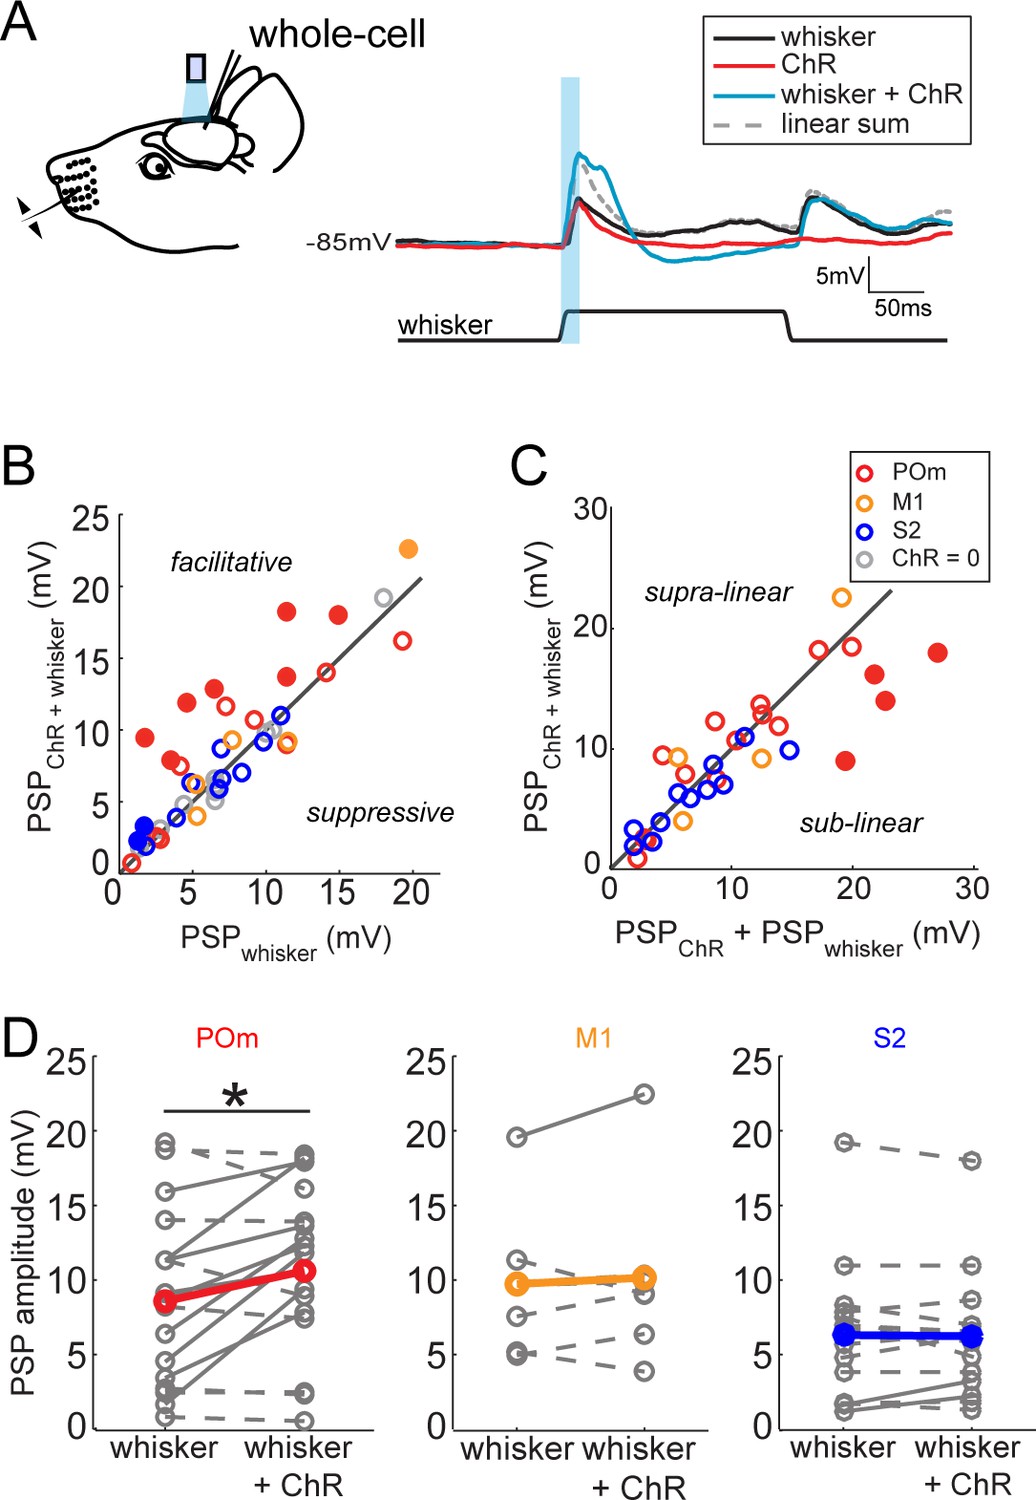
Activation of POm inputs facilitates sensory responses of L2/3 pyramidal neurons.
(A) Left, schematic of in vivo ChR2 activation of long-range projection axons and whisker stimulus during whole-cell recording from a L2/3 pyramidal neuron. Right, average response of an example neuron to photo-activation alone (red), deflection of the PW (black), and simultaneous photo-activation of POm axons and PW deflection (blue). Dotted line, linear sum of PSP response to PW deflection and photo-activation. Light blue bar: 10 ms laser pulse. (B) Photo-activation of POm inputs to L2/3 facilitates the neurons’ sensory responses. Filled circles, neurons for which the responses to the combined sensory and photo stimuli are statistically significantly greater than the sensory response alone. (C) L2/3 responses to simultaneous sensory and photo stimuli are linear. Line, linearity. Filled circles, neurons for which the responses to the combined sensory and photo stimuli are statistically significantly smaller than the sum of responses to sensory or photo stimulation alone. (D) Only photo-activation of POm axons significantly facilitates sensory responses of L2/3 pyramidal neurons (paired t-test: POm, n = 16, p=0.027; M1, n = 5, p=0.86; S2, n = 13, p=0.95). Dashed lines, cells for which whisker response and combined whisker and photo response are not statistically different. Solid lines, cell for which responses are statistically different.
Figure 4 with 1 supplement
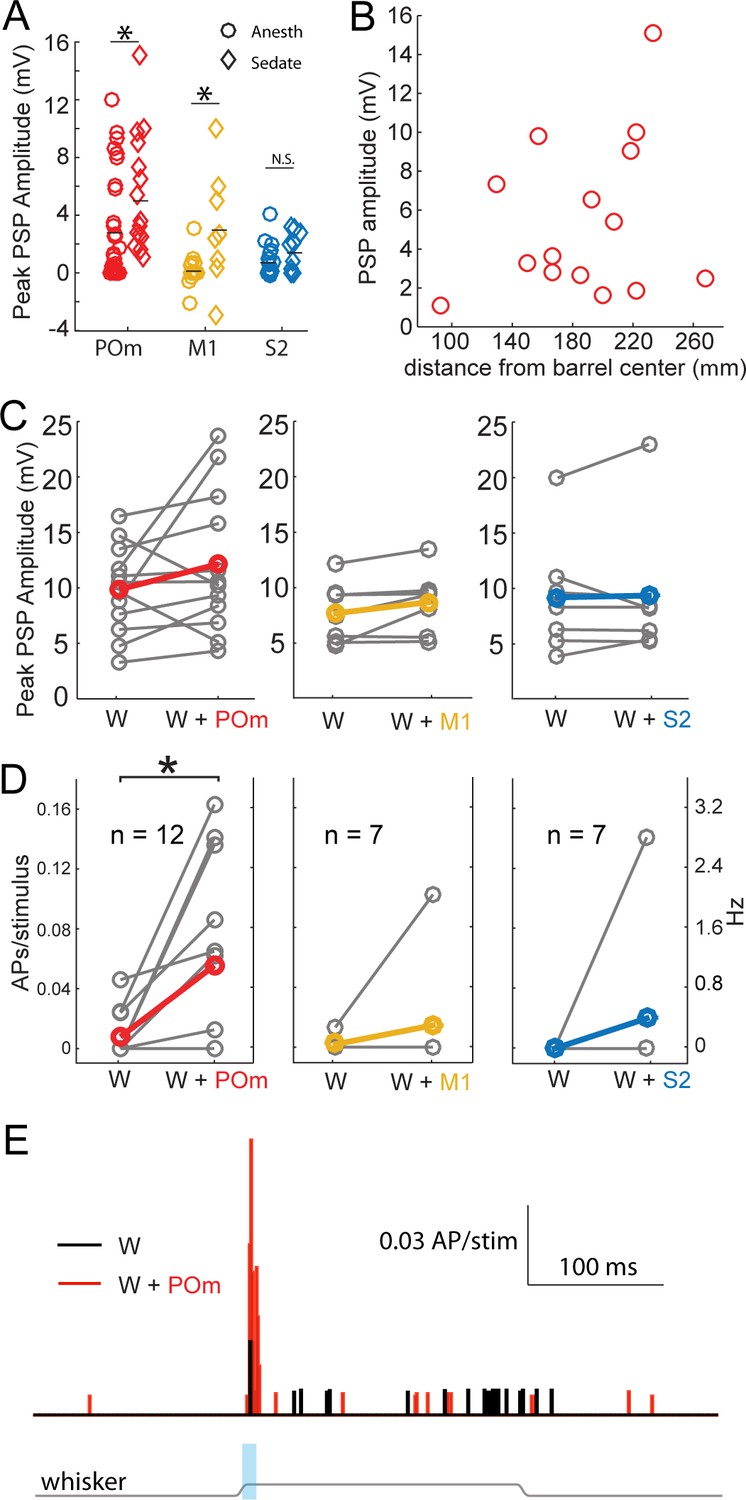
Strong excitation of L2/3 neurons by photo-activation of POm axons is not an artifact of general anesthesia.
(A) Average L2/3 responses to photo-activation of POm and M1 axons under fentanyl sedation is larger than those measured under urethane general anesthesia (two-sided rank sum tests; POm, n = 15 fentanyl cells, mean ± SEM 5.5 ± 1.0 mV, p=0.004; M1,n = 8 cells, mean 3.1 ± 1.4, p=0.009; S2, n = 9 cells, mean 1.6 ± 0.4, p=0.13). Lines, means. (B) PSP amplitude (in response to POm activation) as a function of distance of L2/3 soma from center of nearest barrel column. (C) Under fentanyl sedation, neither POm (left) nor M1 axon activation (middle) significantly boosted subthreshold whisker responses (paired t-tests; n = 12, p=0.16 and n = 7, p=0.07 respectively) despite slight appearances of trends. S2 axon activation (right) did not significantly boost the subthreshold whisker responses (n = 7, p=0.83). Gray, individual cells; Red, mean. (D) Left: Under fentanyl sedation, POm axon activation significantly increase spiking responses of L2/3 neurons to whisker deflection (paired t-test, n = 12, p=0.018). Middle: M1 axon activation does not significantly increase spiking responses of L2/3 neurons to whisker deflection (n = 7, p=0.36). Right: S2 axon activation does not significantly increase spiking responses of L2/3 neurons to whisker deflection (n = 7, p=0.37). Gray, individual cells; Red, mean. Some data points have the same values (i.e., 0). (E) Population PSTH of spiking responses of L2/3 neurons to whisker deflect (black) and whisker deflection combined with POm axon activation (red), n = 12 neurons. Gray line: displacement of whisker stimulus. Blue bar: duration of photostimulation (when present).
Figure 4—figure supplement 1

Strength of ChR-mediated input to L2/3 is related to POm not VPM infection.
(A) Gallery of example POm infections. Green, immuno-amplified ChR2- YFP expression. Red, streptavidin-Alexa594. (B) Strength of ChR-mediated input to L2/3 is related to POm infection size (linear regression, p = 0.016). POm infection size accounts for 28% of the variability in PSP amplitude (R2 = 0.28). (C) Strength of ChR-mediated input to L2/3 is unrelated to VPM infection size (p = 0.63), which accounts for virtually no variability in PSP amplitude (R2 = 0.01).
Figure 5

Only POm inputs elicit large late, persistent depolarization in L2/3 neurons under fentanyl sedation.
(A) Example recording (single trial) of a L2/3 pyramidal neuron’s response to a 10 ms laser pulse (blue) stimulation of POm axons during fentanyl sedation. (B) Population average of L2/3 response to POm, VPM, M1, and S2 input under fentanyl sedation (POm, n = 15 cells; VPM, n = 10 cells; M1, n = 8 cells; S2, n = 9 cells). Gray, average responses of individual neurons; Colored, population average. Baselines just prior to photo-activation have been aligned to allow visual comparison of responses. (C) Power-spectrum of persistent period (colored) vs. spontaneous period (black) in whole-cell recordings. Shading, 95% confidence bands computed using the Jackknife.
Figure 6
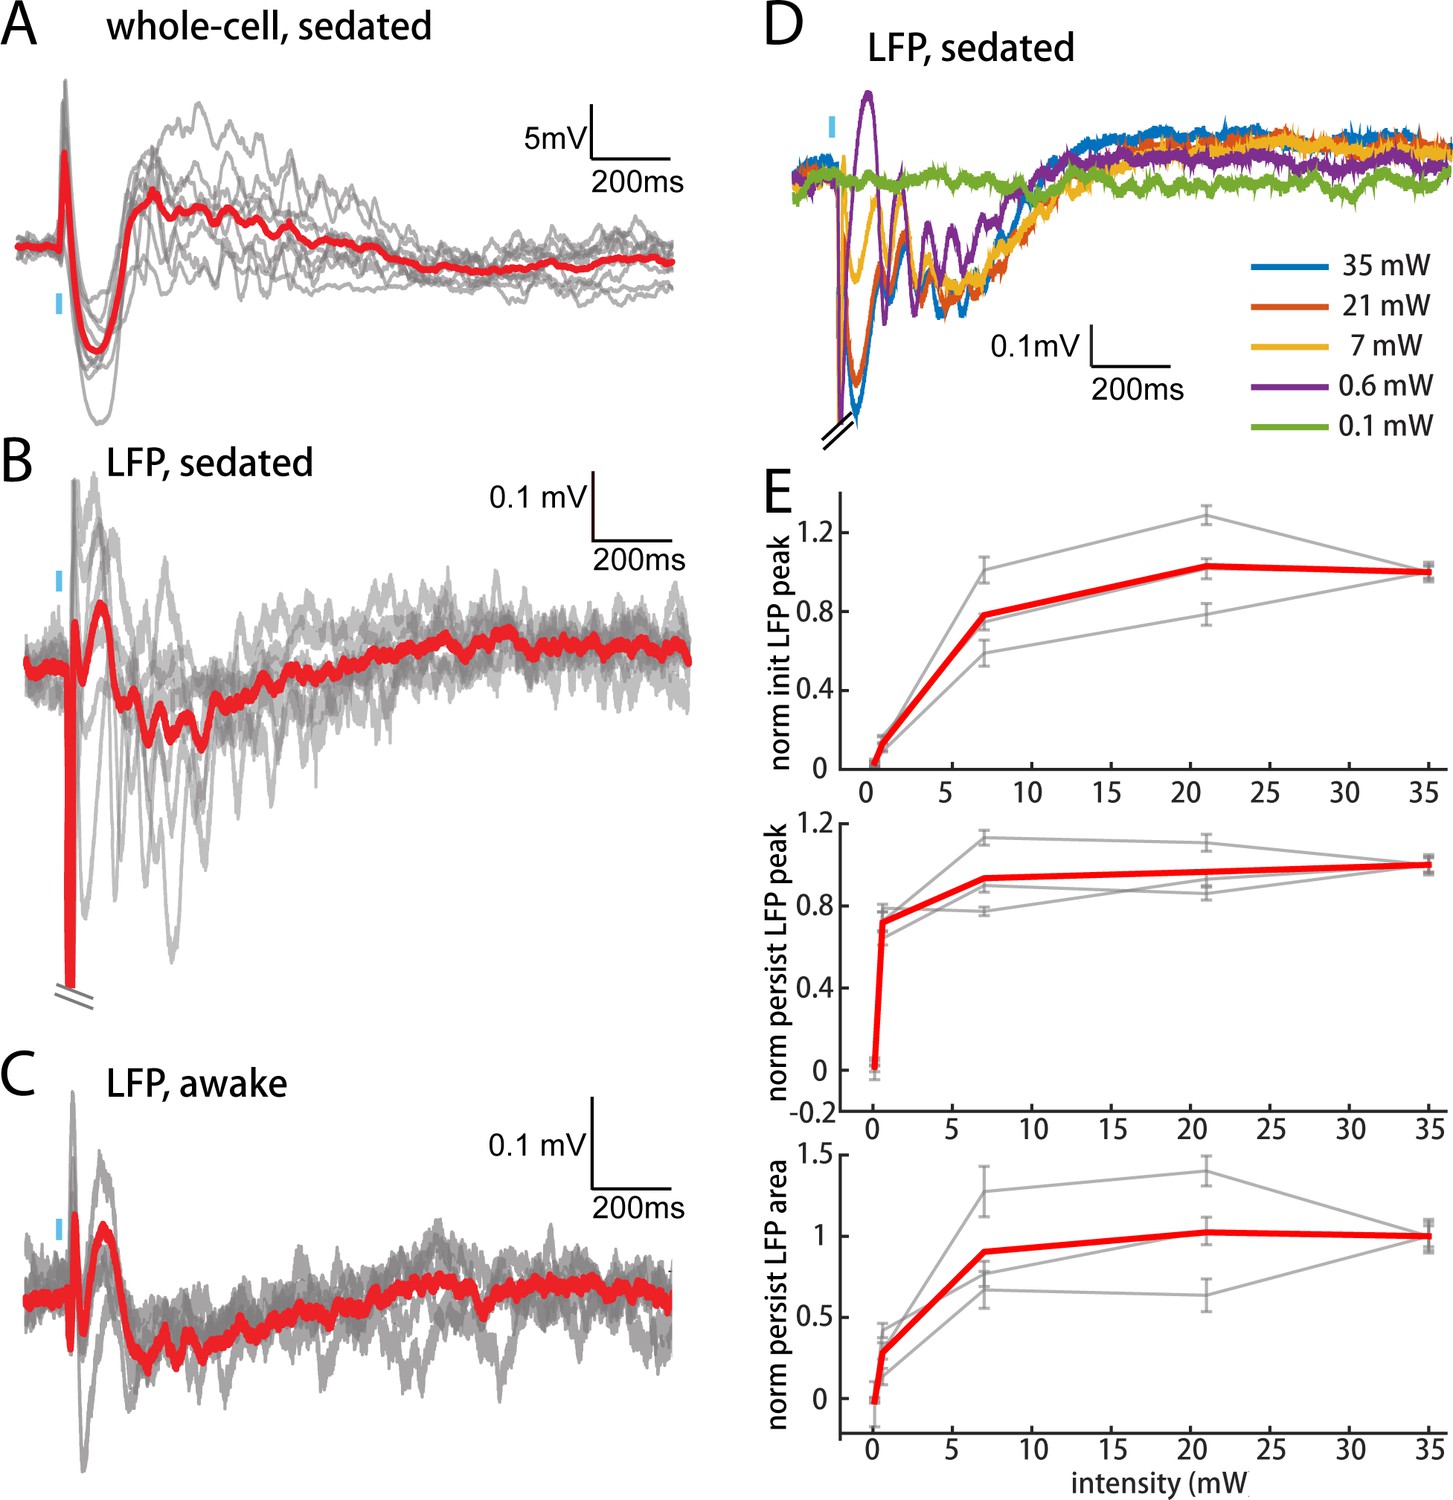
POm elicits an all-or-none persistent depolarization in L2/3 during wakefulness.
(A) Population average of L2/3 whole-cell response to POm during fentanyl sedation (n = 15 cells). Gray, average responses of individual neurons. Red, population average. Baselines just prior to photo-activation have been aligned to allow visual comparison of responses. (B) L2/3 LFP response to POm inputs recorded in fentanyl sedated rats (n = 7 rats, 40 trials/rat). Gray, average responses at each recording site. Red, population average. (C) L2/3 LFP response to POm inputs recorded in awake rats (n = 4 rats). Gray, average responses at each recording site. Red, population average. (D) Example L2/3 LFP responses to POm stimulation with different levels of light intensity, recorded under fentanyl sedation. (E) Top: LFP initial peak amplitude vs. light intensity, normalized to responses induced by highest light intensity. Middle: LFP persistent peak amplitude vs. light intensity, normalized to responses induced by highest light intensity. Bottom: LFP persistent area vs. light intensity, normalized to responses induced by highest light intensity. Gray, average response for each rat. Red, population average (n = 3 rats; errorbar, SEM).
Figure 7
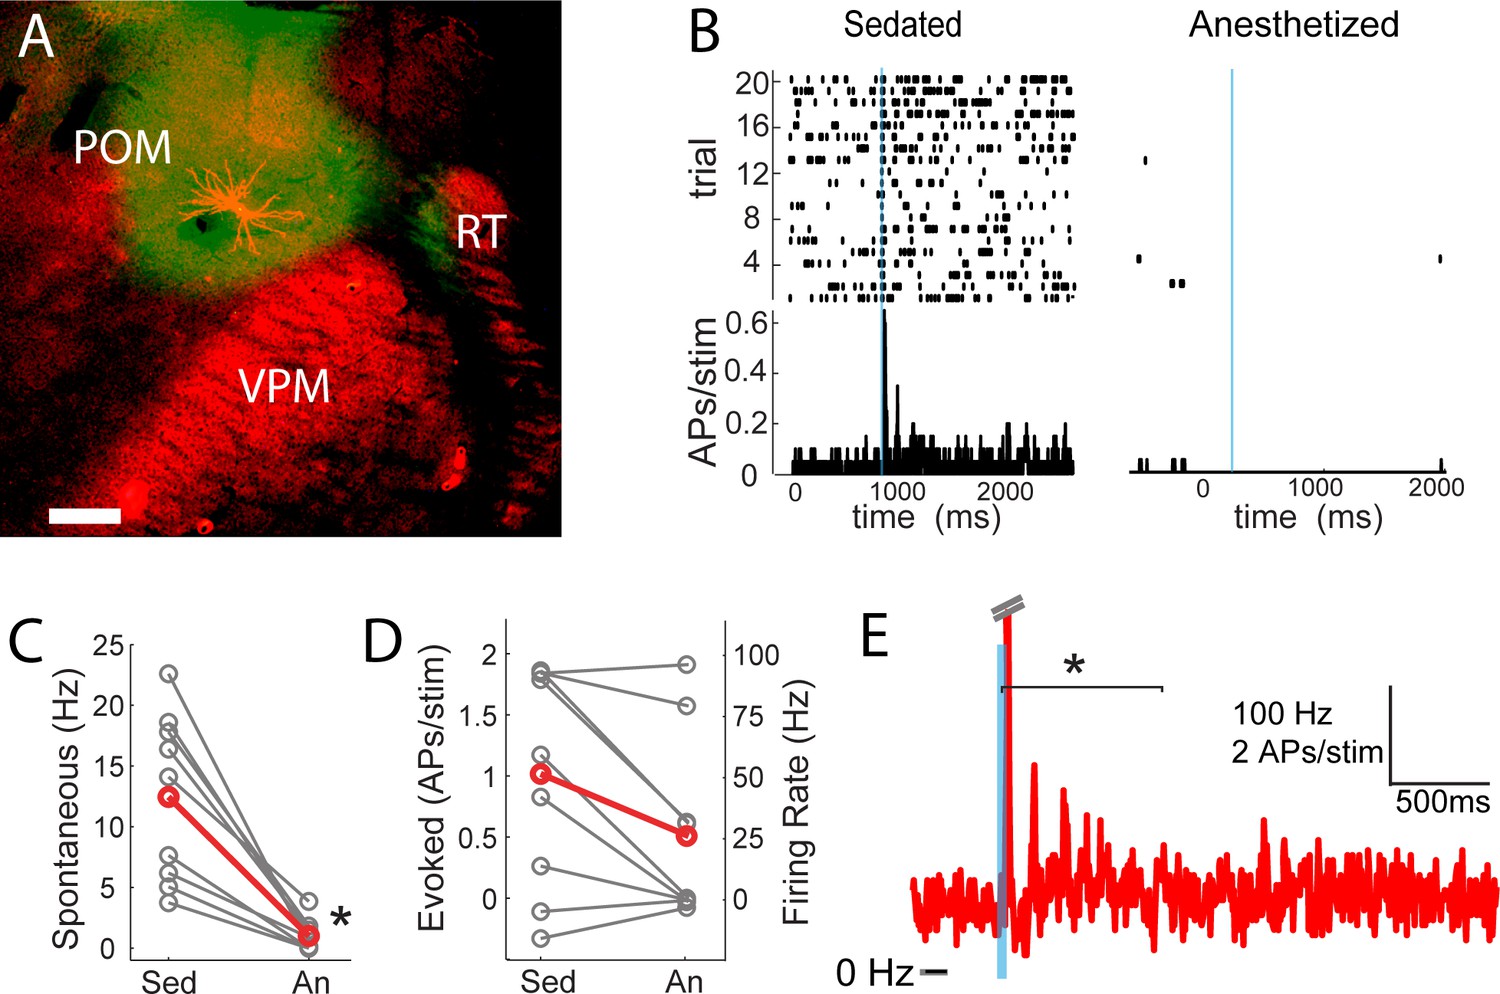
POm spiking mirrors L2/3 depolarization dynamics during anesthesia and sedation.
(A) Morphologically recovered POm neuron recorded and filled juxtasomally in vivo. Red, biocytin-Alexa594. Green, ChR2-YFP. (B) Raster plot (top) and PSTH (bottom) of a POm neuron’s response to photo-stimulation of ChR2-containing cortically-projecting axons. Left, POm cell recorded under sedation; Right, same cell under isoflurane-induced anesthesia. Blue line, 10 ms laser stimulation. (C) POm spontaneous activity is significantly lower under anesthesia than under sedation (paired t-test, n = 9, p=8×10⁻⁴). Gray, individual cells; Red, mean. (D) Photo-activation of POm cortically-projecting fibers elicits more antidromic spikes in POm under sedation than anesthesia (paired t-test, n = 9, p=0.091). Peak firing rate is baseline-corrected by subtracting spontaneous firing rate measured in the pre-laser period. Gray, individual cells; Red, mean. (E) Population PSTH of POm neurons that displayed persistent activation under sedation (n = 5). Each cell displays significant higher firing rate than baseline (t-test, p<0.01) during the persistent period (0–800 ms post light stimulation, indicated by the bracket). Dashes, peak truncation for clarity.
Figure 8
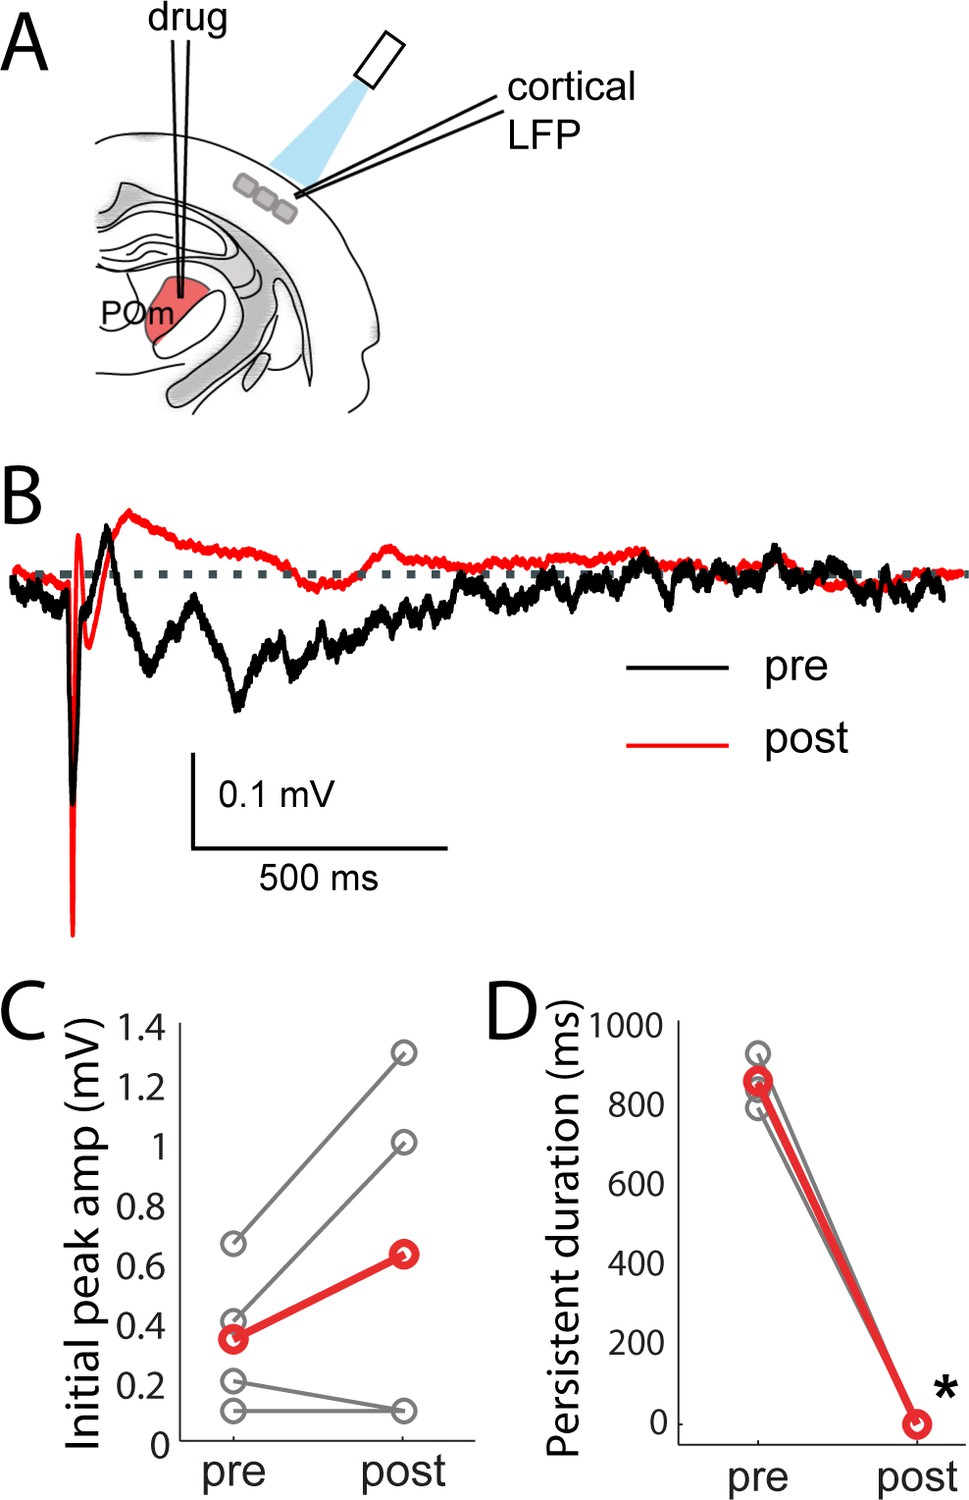
Persistent depolarization of L2/3 requires sustained POm firing.
(A) Schematic of POm inactivation experiment. POm fibers are photo-activated while cortical LFP is recorded, before and after injection of 10% lidocaine or 1 mg/mL muscimol through a pipette in POm. (B) Population average of L2/3 LFP responses to POm input pre (black) and post (red) inactivation (n = 4 rats, 40 trials/rat). (C) Pharmacological inactivation slightly increased the magnitude of initial response in L2/3 (paired t-test, n = 4 rats, 40 trials/rat, p=0.24). Gray, individual animals; red, population average. (D) Persistent depolarization in L2/3 was abolished by POm inactivation (paired t-test, p<10−4). Gray, individual animals; red, population average.
Tables
Key resources table
| Reagent type (species) or resource | Designation | Source or reference | Identifiers | Additional information |
|---|---|---|---|---|
| Antibody | rabbit anti-GFP primary | EMD Millipore | AB3080P | |
| Antibody | goat anti-rabbit Alexa 488 secondary | Invitrogen | A11034 | |
| Recombinant DNA reagent | AAV1.hSyn.ChR2(H134R)-eYFP.WPRE.hGH | U.Penn Vector Core | ||
| Chemical compound, drug | lidocaine HCl, monohydrate | Sigma Aldrich | L5647 | |
| Chemical compound, drug | muscimol | Sigma Aldrich | M1523 | |
| Chemical compound, drug | strepavidin-Alexa594 | Life Technologies | S-11227 |
Additional files
-
Transparent reporting form
- https://doi.org/10.7554/eLife.44158.013
Download links
A two-part list of links to download the article, or parts of the article, in various formats.
Downloads (link to download the article as PDF)
Open citations (links to open the citations from this article in various online reference manager services)
Cite this article (links to download the citations from this article in formats compatible with various reference manager tools)
High-order thalamic inputs to primary somatosensory cortex are stronger and longer lasting than cortical inputs
eLife 8:e44158.
https://doi.org/10.7554/eLife.44158


