Renal medullary carcinomas depend upon SMARCB1 loss and are sensitive to proteasome inhibition
- Boston Children’s Hospital, United States
- Dana-Farber Cancer Institute, United States
- Broad Institute of Harvard and MIT, United States
- Rare Cancer Research Foundation, United States
- RMC Support, United States
- St. Jude Children’s Research Hospital, United States
- Brigham and Women’s Hospital, United States
Figures
Figure 1 with 1 supplement
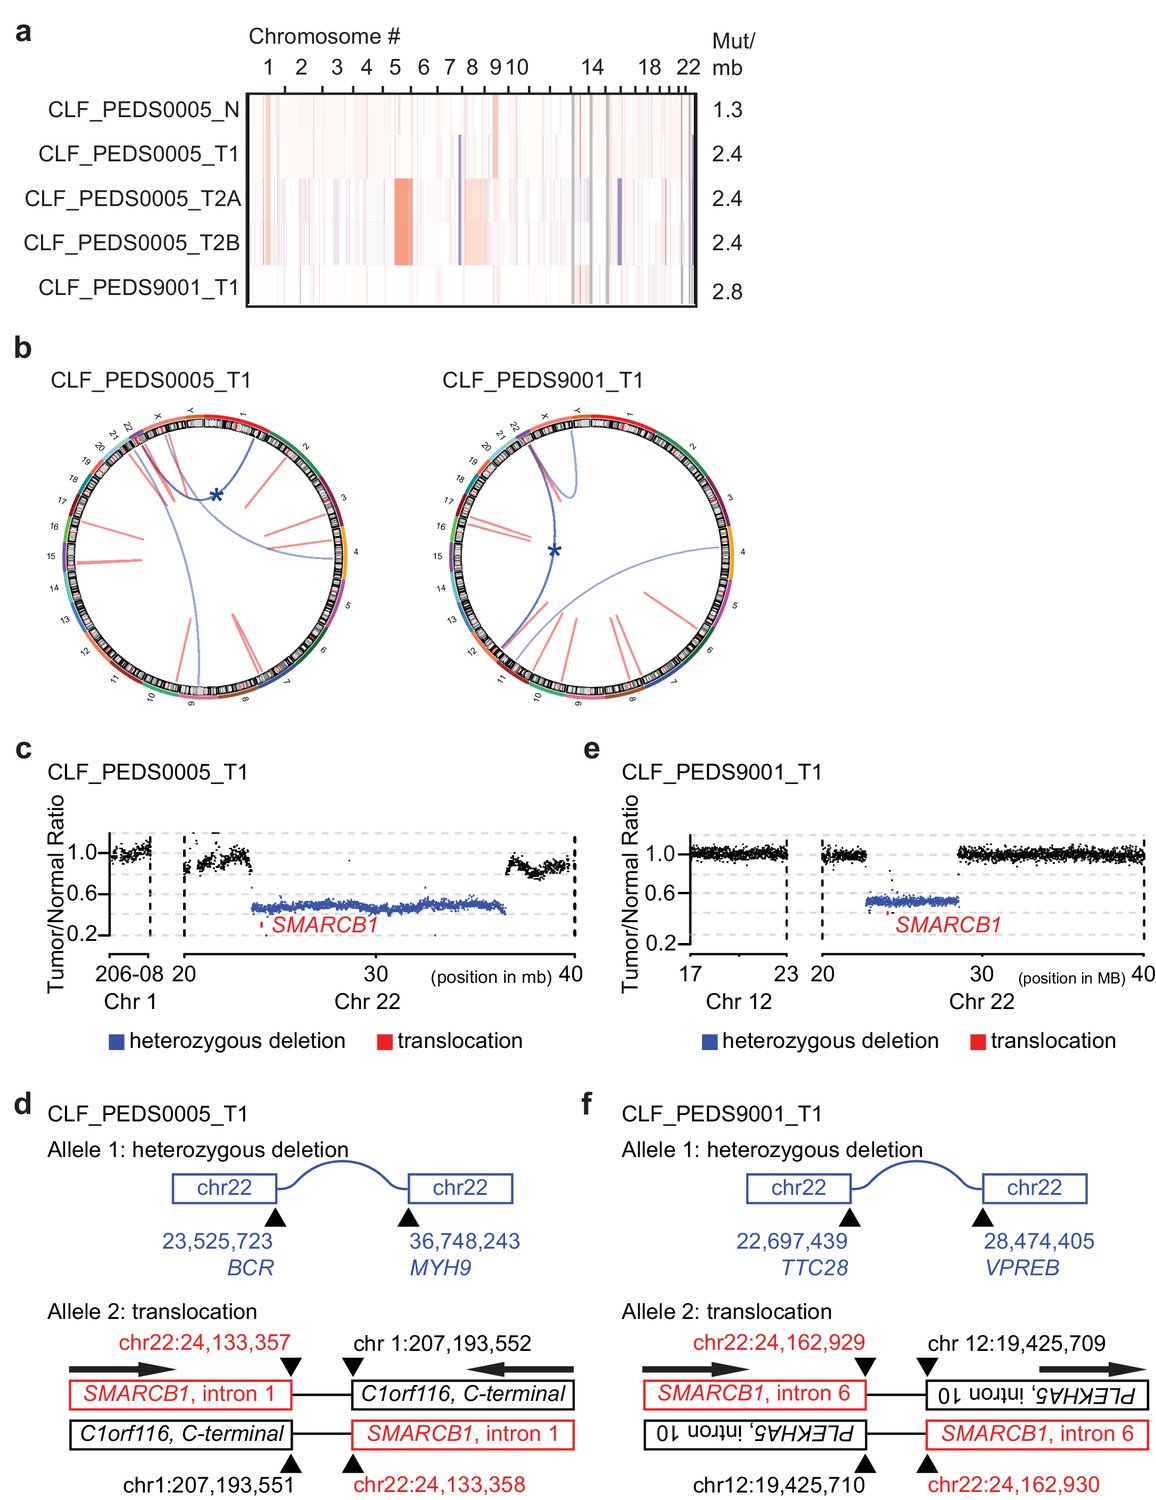
Patient-derived models of RMC have quiet genomes and are driven by intronic translocations.
(a) Copy number analysis of RMC models from WES identifies heterozygous loss of alleles particularly at 22q where SMARCB1 resides or low-level gains in primary and metastatic tumors. Red indicates degree of genomic amplification while blue indicates degree of genomic loss. Rates of mutations per megabase are consistent with patients with RMC or other pediatric cancers such as rhabdoid tumor. (b) Circos plots from WGS to represent structural alterations seen in RMC cell lines. Red indicates a deletion. All deletions are located in the introns. Blue arcs indicate fusions identified with SvABA v0.2.1 (Wala et al., 2018). Blue star indicates a SMARCB1 rearrangement. (c) Read counts from WGS identify single copy deletion of SMARCB1 in CLF_PEDS0005_T1 indicated by a Tumor/Normal ratio of approximately 0.5 where SMARCB1 is located. (d) Second allele of SMARCB1 is lost by a balanced translocation occurring in intron 1 of SMARCB1 and fuses to the C-terminal end of C1orf116 in chromosome one in CLF_PEDS0005_T1. (e) Read counts from WGS identify single copy deletion of SMARCB1 in CLF_PEDS9001_T1. (f) Second allele of SMARCB1 is lost by a balanced translocation occurring in intron 6 of SMARCB1 and fuses to the anti-sense intron 10 of PLEKHA5 in chromosome 12 in CLF_PEDS9001_T1.
Figure 1—figure supplement 1
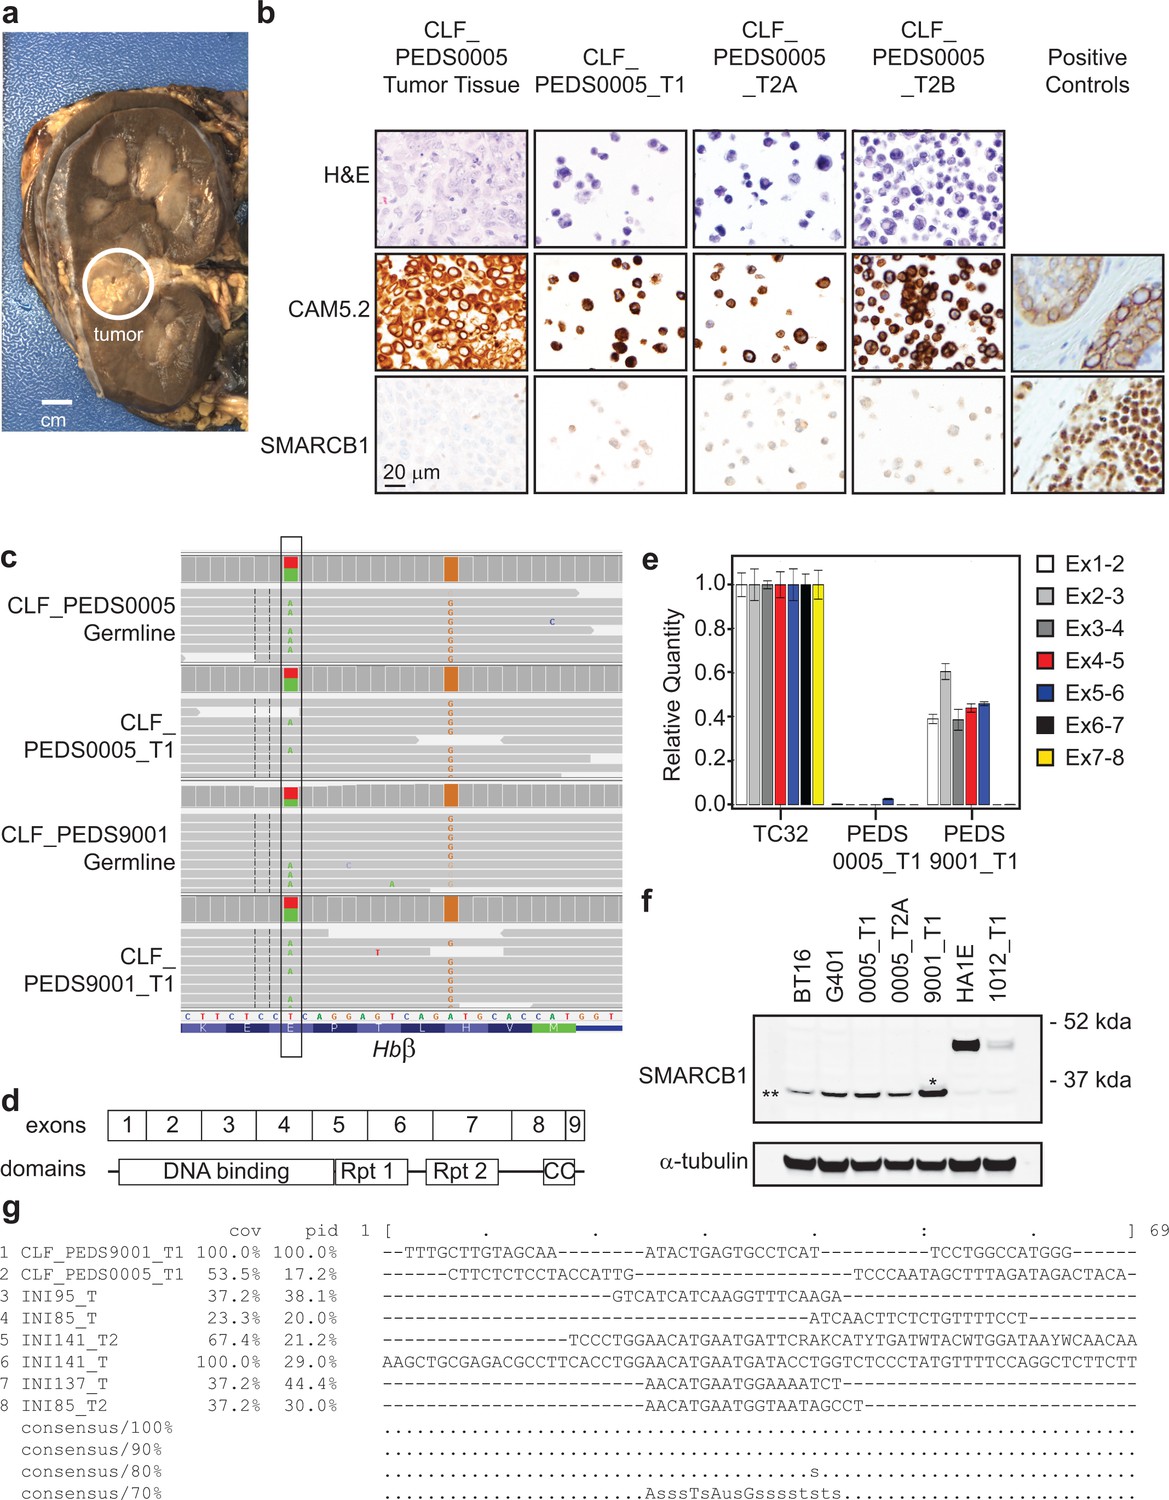
Patient-derived RMC models are reflective of known biology and are faithful models of the primary tumors.
(a) Gross pathology of CLF_PEDS0005 nephrectomy. Circle highlights treated tumor. (b) Immunohistochemistry of CLF_PEDS0005 cells highlighting same staining patterns as seen in RMC. For CAM5.2, the positive control is the brown staining of skin cells and for SMARCB1, the positive control is the brown nuclear staining of tonsil cells. (c) Integrated Genomic Viewer (IGV) screen shot of the hemoglobin beta (HbB) loci. At amino acid 7, there is a T/A heterozygous mutation (Glutamic acid/Valine) leading to sickle cell trait. (d) Mapping of how exons of SMARCB1 correlate to known domains of SMARCB1 (Allen et al., 2015; Das et al., 2013). (e) Quantitative reverse transcriptase PCR (qRT-PCR) of each exon-exon junction of SMARCB1 confirms expression loss in RMC samples. Relative expression of these exon-exon junctions in the RMC models was compared to TC32, a Ewing Sarcoma cell line with wild-type SMARCB1. (f) Immunoblot of SMARCB1 across BT16 (ATRT cell line), G401 (MRT cell line), CLF_PEDS0005 and CLF_PEDS9001 (RMC cell lines), and HA1E and CLF_PEDS1012_T1 (SMARCB1 WT cell lines). SMARCB1 is lost in ATRT, MRT and RMC cell lines. For CLF_PEDS9001_T1, there is a faint band (*) above the nonspecific band (**) that likely represents a truncated SMARCB1. (g) Sequence alignment across breakpoints of SMARCB1 and fusion partners from this and published studies (Calderaro et al., 2016). There are no clear consensus sequences identified.
Figure 2 with 1 supplement
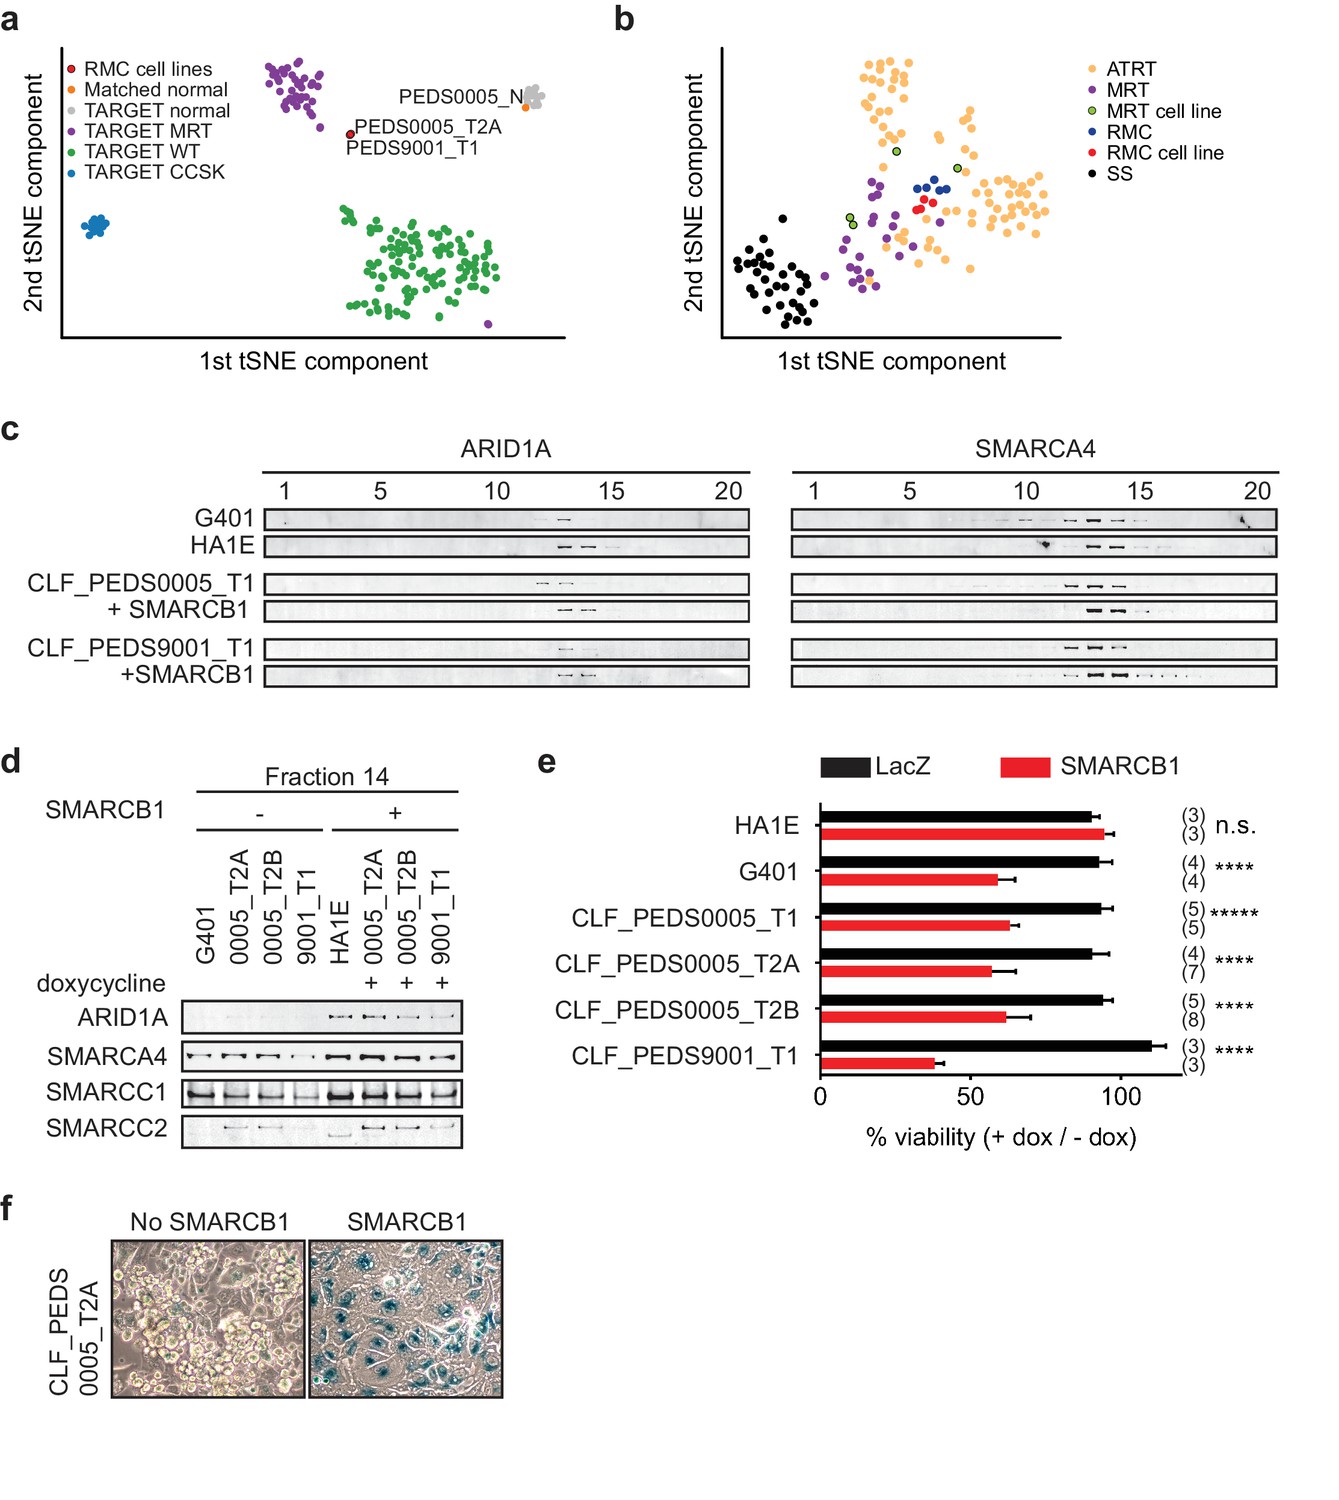
Patient-derived models of RMC are functionally similar to SMARCB1 deficient cancers.
(a) Using tSNE, gene expression by RNA-sequencing from patients with pediatric renal tumors profiled in TARGET such as clear cell sarcoma of the kidney (CCSK), malignant rhabdoid tumor (MRT) or Wilms tumor (WT) was compared with patient-derived models of RMC. RMC cell lines (red) cluster with rhabdoid tumor samples (purple). The normal cell line (orange) (CLF_PEDS0005_N) clusters with other normal kidneys profiled in TARGET. (b) tSNE analysis of gene-expression array data shows RMC cell lines (red) clustering with RMC patients (blue) and these cluster with other MRT (purple) or ATRT (yellow) samples. However, these do not cluster as closely with synovial sarcomas (black). (c) Glycerol gradients (10–30%) followed by SDS-PAGE analysis of rhabdoid tumor cell line G401, as compared to SMARCB1 wild-type cell line HA1E, show ARID1A is seen in higher fractions when SMARCB1 is expressed (left). Gradients were then performed on patient-derived models of RMC with doxycycline-inducible SMARCB1. A similar rightward shift of ARID1A occurs upon re-expression of SMARCB1. These same shifts occur with SMARCA4 (right). These experiments are representative of at least two biological replicates. (d) Fraction 14 of the glycerol gradients shows a modest increase in SWI/SNF complex members, SMARCC1, SMARCC2, SMARCA4 and ARID1A in HA1E, a SMARCB1 wild type cell line. When SMARCB1 is re-expressed in G401 and RMC lines, a similar pattern is seen. Images are representative of 2 biological replicates. (e) Using cell lines with stably transfected and inducible SMARCB1, cell viability was assessed with or without expression of SMARCB1 over 8 days. There is no significant difference in SMARCB1 wild type cell line, HA1E. Re-expression of SMARCB1 leads to significant decreases in cell viability as compared to LacZ control in SMARCB1 deficient cancer cell lines G401, CLF_PEDS9001_T, and CLF_PEDS0005. Error bars are standard deviations based on number of samples in parentheses. (f) CLF_PEDS0005_T2A cell line shows signs of senescence following re-expression of SMARCB1. Images representative of 3 biological replicates.
-
Figure 2—source data 1
Source data for Figure 2e.
- https://doi.org/10.7554/eLife.44161.006
Figure 2—figure supplement 1

Kinetics of re-expression of SMARCB1 in patient-derived RMC models.
(a) CellTiter-Glo of parental cell lines treated with increasing doses of doxycycline for 96 hr. Error bars shown are standard deviations from two biological replicates. Dotted line at doxycycline of 1 ug/mL (or log 0) indicates dosage used in this study. (b) SMARCB1 inducible vectors were stably transfected into cell lines. Administration of doxycycline caused similar induction of SMARCB1 across all cell lines. Blots are representative of at least two biological replicates. (c) SMARCB1 immunoblot from 10–30% glycerol gradients. SMARCB1 is prominently in fractions 13 and 14. Blots are representative of at least two biological replicates. (d) Representative images from three biological replicates of β-galactosidase staining following 7 days of SMARCB1 or LacZ re-expression across CLF_PEDS0005 cell lines. (e) When SMARCB1 is re-expressed, SMARCB1 expression is maintained at the transcriptional level by qRT-PCR over 5 days. (f) Kinetics of differentially expressed genes when SMARCB1 is re-expressed over 120 hr. Left panel shows a more rapid decline followed by overall stabilization while the right panel shows a gradual decline of transcripts over time.
Figure 3 with 1 supplement
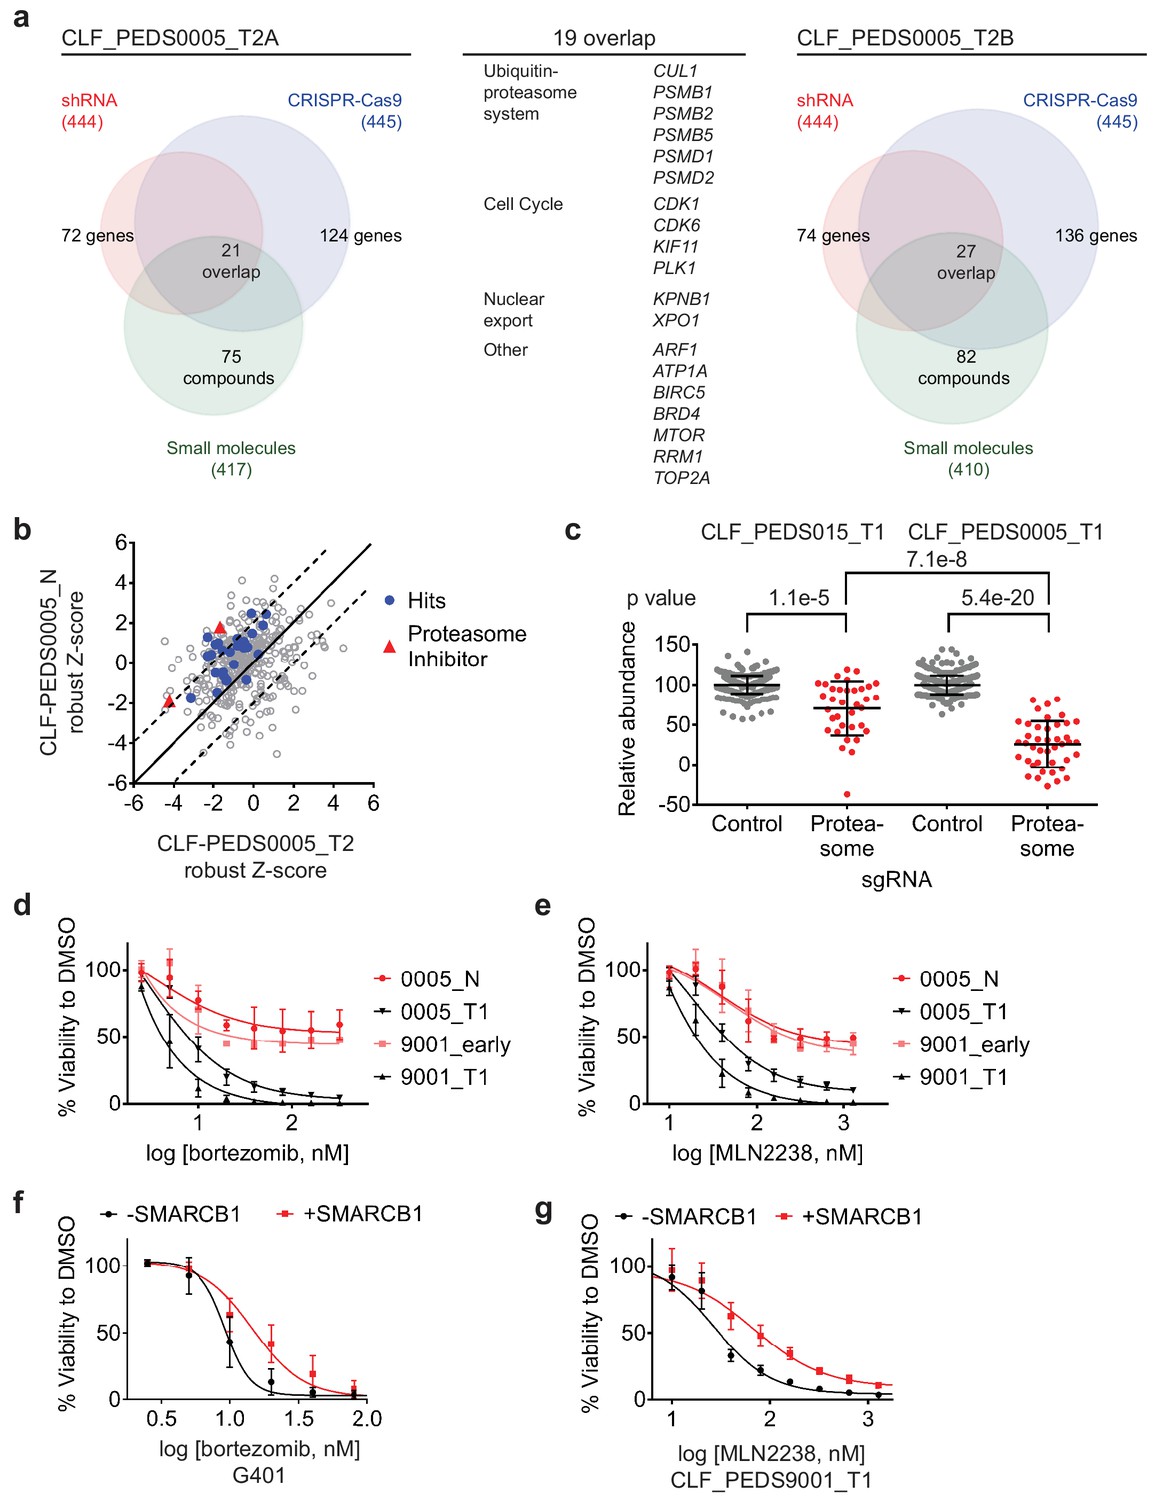
Functional genomic screens identify inhibition of the proteasome as a vulnerability in RMC.
(a) Left: RNAi suppression of 444 evaluable genes (red) identifies 72 genes that when suppressed caused a significant viability loss in CLF_PEDS0005_T2A. Genomic indels created by CRISPR-Cas9 in 445 evaluable genes (blue) identify 124 genes that cause a viability loss. RNAi and CRISPR-Cas9 screens were performed in biological replicates. Small-molecule screen (performed in technical replicates) with 417 evaluable compounds (green) identifies 75 compounds that lead to significant viability loss. 21 genes overlap across these three screens. Right: The same screens were performed with CLF_PEDS0005_T2B and 27 genes were found to be significantly depleted when suppressed by RNAi, genomically deleted by CRISPR-Cas9 or inhibited when treated with a small molecule. Center: List of 19 genes that overlapped between functional screens from CLF_PEDS0005_T2A and CLF_PEDS0005_T2B can be categorized into genes involving the ubiquitin-proteasome system, cell cycle and nuclear export (Supplementary file 7). (b) Comparison of Z-score normalized small-molecule screens between CLF_PEDS0005_T2 and CLF_PEDS0005_N (normal isogenic cell line). Small molecules targeting the genes identified in Figure 3a are either in red (proteasome inhibitors) or blue (other hits). Each dot is representative of the average of two technical replicates. (c) Relative log2 fold change in abundance from CRISPR-Cas9 screens between sgRNA controls (grey) and genes in the DCT v1.0 screen involving the proteasome (red). Data is taken at 23 days following selection and compared to an early time point. As compared to the undifferentiated sarcoma cell line CLF_PEDS015_T1, inhibition of the proteasome subunits leads to a more profound viability loss as compared with controls. Each dot is representative of a minimum of 2 biological replicates. (d) Short term cultures of the normal cell line (CLF_PEDS0005_N) or early passage of the heterogenous cell line (CLF_PEDS9001_early) were compared for assessment of viability to the primary tumor cell lines following treatment with bortezomib. Two-tailed t-test p-value=0.008 for PEDS0005_T1 and two-tailed t-test p-value=4.76e-5 for PEDS9001_T1. Error bars represent standard deviations from two biological replicates. (e) Short term cultures of the normal cell line (CLF_PEDS0005_N) or early passage of the heterogenous cell line (CLF_PEDS9001_early) were compared for assessment of viability to the primary tumor cell lines following treatment with MLN2238. Error bars represent standard deviations from two biological replicates. (f) Re-expression of SMARCB1 in G401 leads to a rightward shift in the dose-response curve with bortezomib compared with uninduced cells. Error bars represent standard deviations from two biological replicates. (g) Re-expression of SMARCB1 in CLF_PEDS9001_T leads to a rightward shift in the dose-response curve with MLN2238 compared with uninduced cells. Error bars represent standard deviations from three biological replicates.
-
Figure 3—source data 1
Source data for Figure 3b.
- https://doi.org/10.7554/eLife.44161.010
Figure 3—figure supplement 1
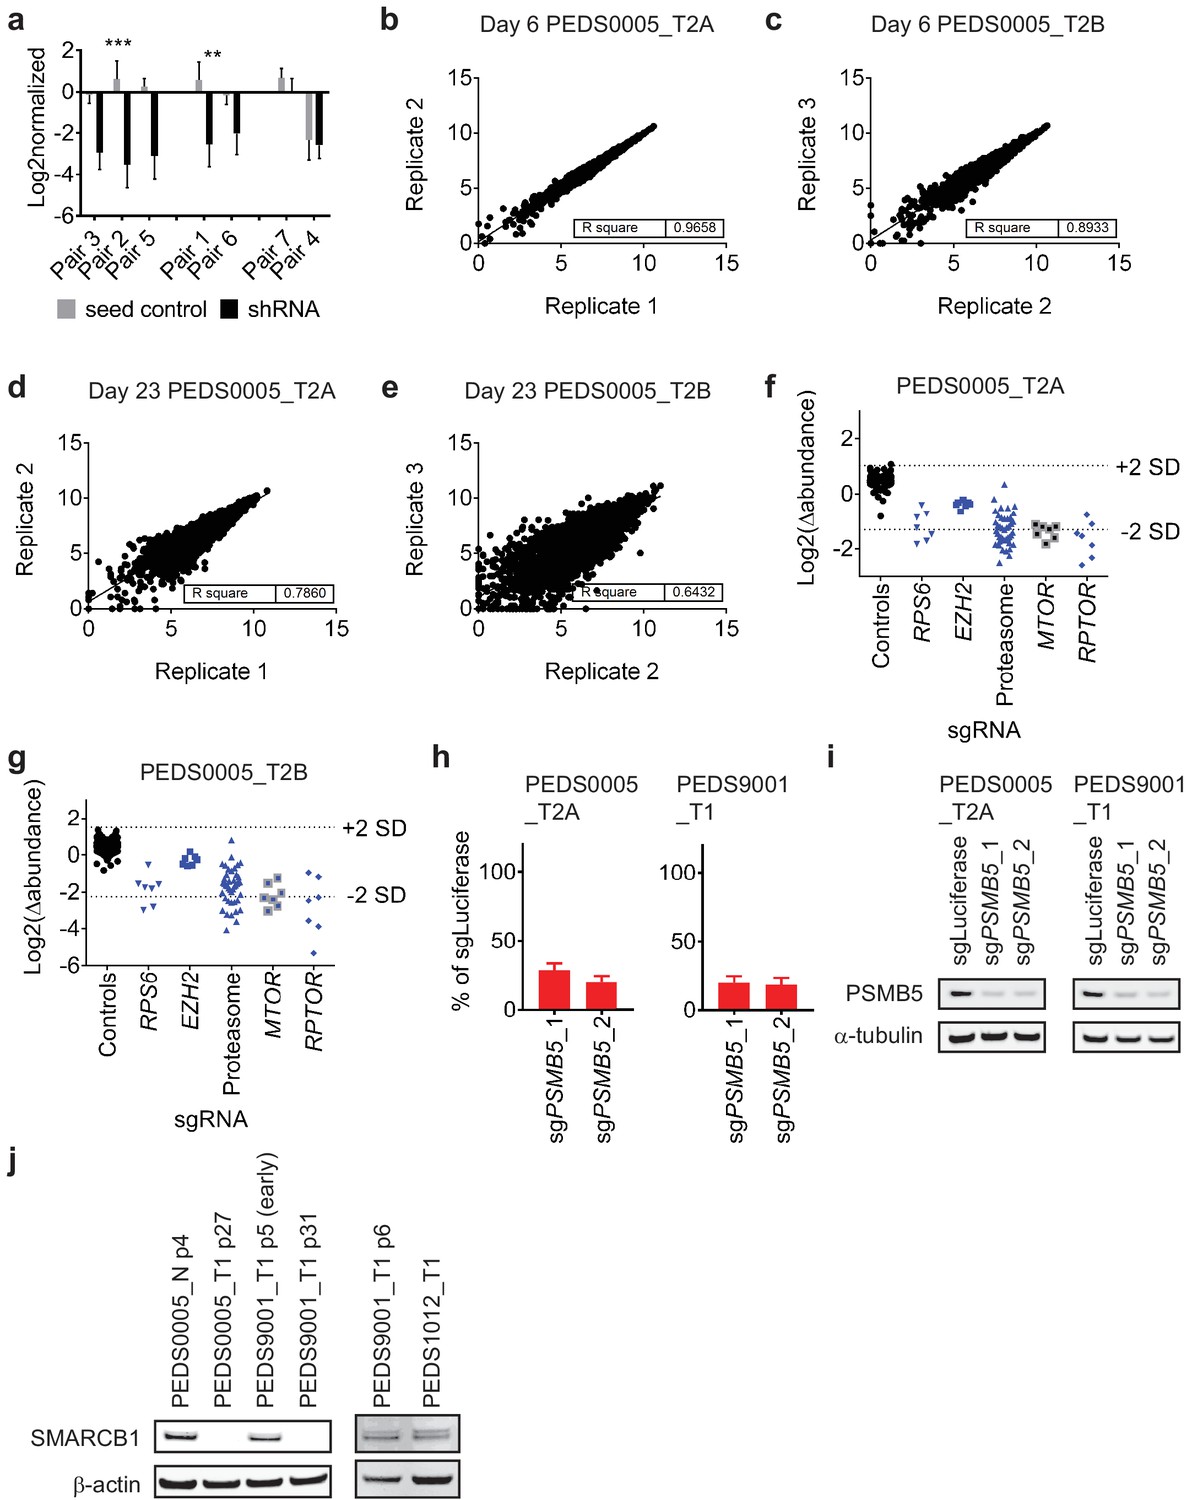
Functional genomic screens identify proteasome inhibition as a vulnerability in RMC and other SMARCB1 deficient cancers.
(a) Suppression of RPS6 in CLF_PEDS0005_T2A in RNAi screens. Following log2 normalized counts, shRNAs (black) and paired seed controls (grey) were assessed for off-target effects. Most pairs showed minimal off-target effects while Pair four showed significant off-target effects. Error bars represent standard deviation from at least two replicates. *** indicates a two-tailed t-test p-value<0.0005, **<0.005. (b) and (c) Correlation of replicates from normalized counts of CRISPR-Cas9 screens in CLF_PEDS0005_T2A or CLF_PEDS0005_T2B at the early day six timepoint. (d) and (e) Correlation of replicates from normalized counts of CRISPR-Cas9 screens in CLF_PEDS0005_T2A or CLF_PEDS0005_T2B at the end of the screen (e.g. day 23) timepoint. (f) and (g) Log2 fold change in abundance of sgRNAs in CRISPR-Cas9 loss of function screens. Controls include sgControls (black) and common essential gene, RPS6. In comparison to these, genes involving the proteasome were similarly depleted like RPS6. (h) Gene deletion by CRISPR-Cas9 of PSMB5 leads to significant decrease in viable cells in RMC cell lines. Error bars represent standard deviation from at least two replicates. (i) Gene deletion by CRISPR-Cas9 of PSMB5 is confirmed by immunoblot. (j) Confirmation that the normal cell line, CLF_PEDS0005_N, early passaged tumor cell line, CLF_PEDS9001_T1 and Wilms tumor cell line, CLF_PEDS1012_T1, express SMARCB1 as compared to the primary RMC cancer cell lines.
Figure 4 with 2 supplements
Proteasome inhibitors such as MLN2238 are specific to SMARCB1 deficient cancers and lead to cell cycle arrest and programmed cell death.
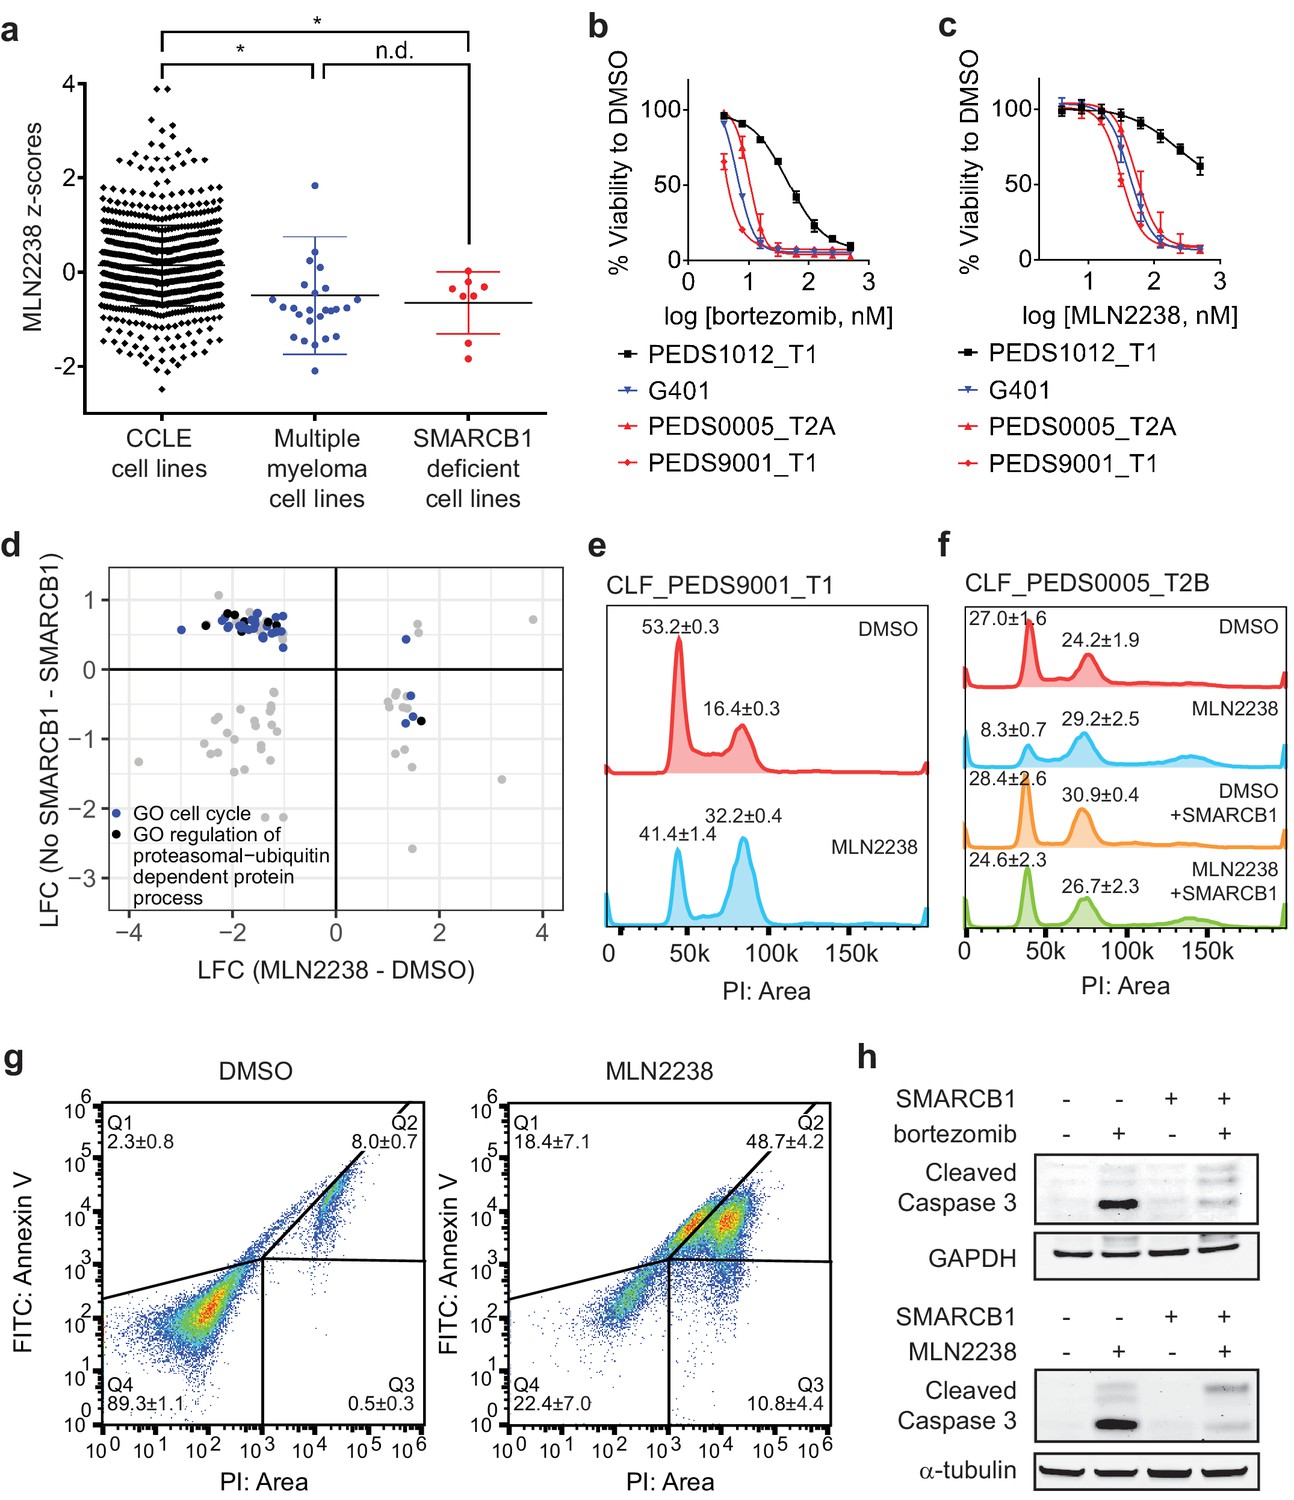
(a) Multiple myeloma cell lines and SMARCB1-deficient lines are similarly sensitive to proteasome inhibitor, MLN2238. Both are significantly different from other CCLE cell lines based on Z-score normalized sensitivity. * two-tailed t-test p-value<0.05. n.d. no difference. (b) Early passage Wilms tumor (SMARCB1 wild-type) cell line CLF_PEDS1012_T1 is not as sensitive to treatment with bortezomib compared with RMC and MRT cell lines. Error bars represent standard deviations following at least two biological replicates. (c) Early passage Wilms tumor (SMARCB1 wild-type) cell line CLF_PEDS1012_T1 is not as sensitive to treatment with MLN2238 compared with RMC and MRT cell lines. Error bars represent standard deviations following at least two biological replicates. (d) Analysis of differentially expressed genes when SMARCB1 was re-expressed in SMARCB1 deficient cancers compared with differentially expressed genes when SMARCB1 deficient cancers were treated with 200 nM MLN2238. Gene sets enriched based on GO-based GSEA involved the cell cycle (blue) and regulation of the ubiquitin-proteasome system (black). (e) Treatment with proteasome inhibitor, MLN2238 at 200 nM for 24 hr leads to G2/M arrest in CLF_PEDS9001_T1. Values shown represent the percent of cells in G1 or G2/M. Error values shown are standard deviations from two biological replicates. (f) Treatment with MLN2238 at 200 nM for 24 hr leads to G2/M arrest in CLF_PEDS0005_T2B which can be prevented by re-expression of SMARCB1. Error values shown are standard deviations from two biological replicates. (g) Treatment of CLF_PEDS9001_T1 with MLN2238 at 200 nM for 48 hr leads to increased frequency of cells with Annexin V/PI staining and PI only staining. Error values shown are standard deviations from two biological replicates. (h) G401 cells stably infected with inducible SMARCB1 treated with either bortezomib at 15 nM or MLN2238 at 200 nM induce cleaved caspase-3 compared with DMSO controls after 24 hr. When SMARCB1 is re-expressed, cleaved caspase-3 levels are decreased compared to uninduced cell lines. Blots are representative of a minimum of 2 biological replicates.
-
Figure 4—source data 1
Source data for Figure 4a.
- https://doi.org/10.7554/eLife.44161.014
-
Figure 4—source data 2
Source data for Figure 4d.
- https://doi.org/10.7554/eLife.44161.015
Figure 4—figure supplement 1
SMARCB1 deficient cell lines are sensitive to proteasome inhibition.
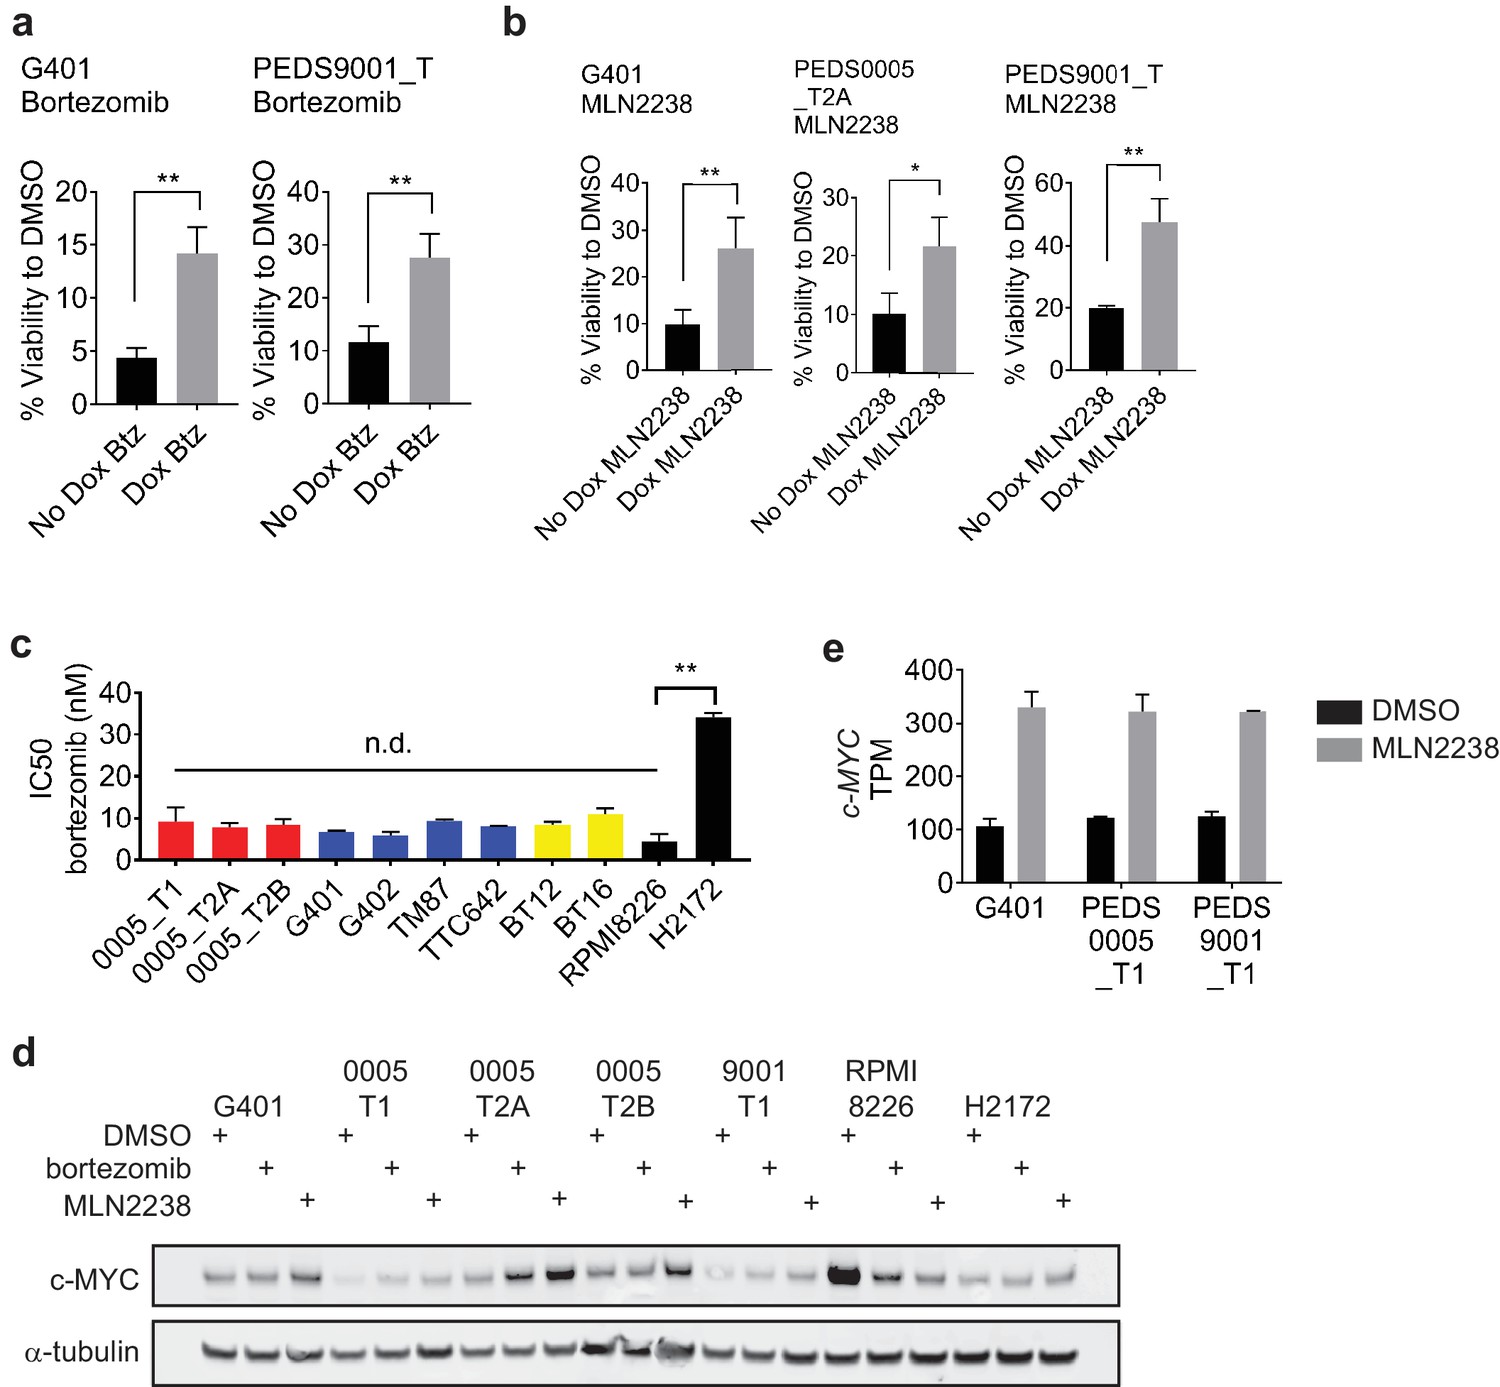
(a) Using the inducible SMARCB1 cell lines, SMARCB1 deficient lines have increased sensitivity to bortezomib (btz) at 15 nM when compared to cells with SMARCB1 re-expressed. Error bars represent standard deviation from at least three biological replicates. ** indicates a two-tailed t-test p-value<0.005. (b) Using the inducible SMARCB1 cell lines, SMARCB1 deficient lines have increased sensitivity to MLN2238 at 100 nM when compared to cells with SMARCB1 re-expressed. Error bars represent standard deviation from at least three biological replicates. * indicates a two-tailed t-test p-value<0.05 and **<0.005. (c) Sensitivity to bortezomib as measured by IC50s. RMC cell lines (red), MRT cell lines (blue) and ATRT cell lines (yellow) are similarly sensitive to RPMI8226, multiple myeloma cell line. This is in comparison to H2172 which is significantly less sensitive to proteasome inhibition. Error bars represent standard deviation from at least three biological replicates. n.d. no difference. ** indicates a two-tailed t-test p-value<0.005. (d) c-MYC is not downregulated upon proteasome inhibition at the protein level. Cell lines were treated with DMSO, bortezomib at 15 nM or MLN2238 at 200 nM for 48 hr. c-MYC protein levels in RPMI8226, a multiple myeloma cell line, decrease following proteasome inhibition by immunoblot. However, this does not occur in the SMARCB1 deficient cancer cell lines. Immunoblots are representative of at least two biological replicates. (e) c-MYC is not downregulated upon proteasome inhibition in the transcriptome. Cell lines were treated with DMSO or MLN2238 at 200 nM for 48 hr. Samples from three biological replicates were subjected to RNA-sequencing and c-MYC levels were assessed. Across all the SMARCB1 deficient cell lines, c-MYC transcript levels were increased. Error bars represent standard deviation from at least three biological replicates.
Figure 4—figure supplement 2
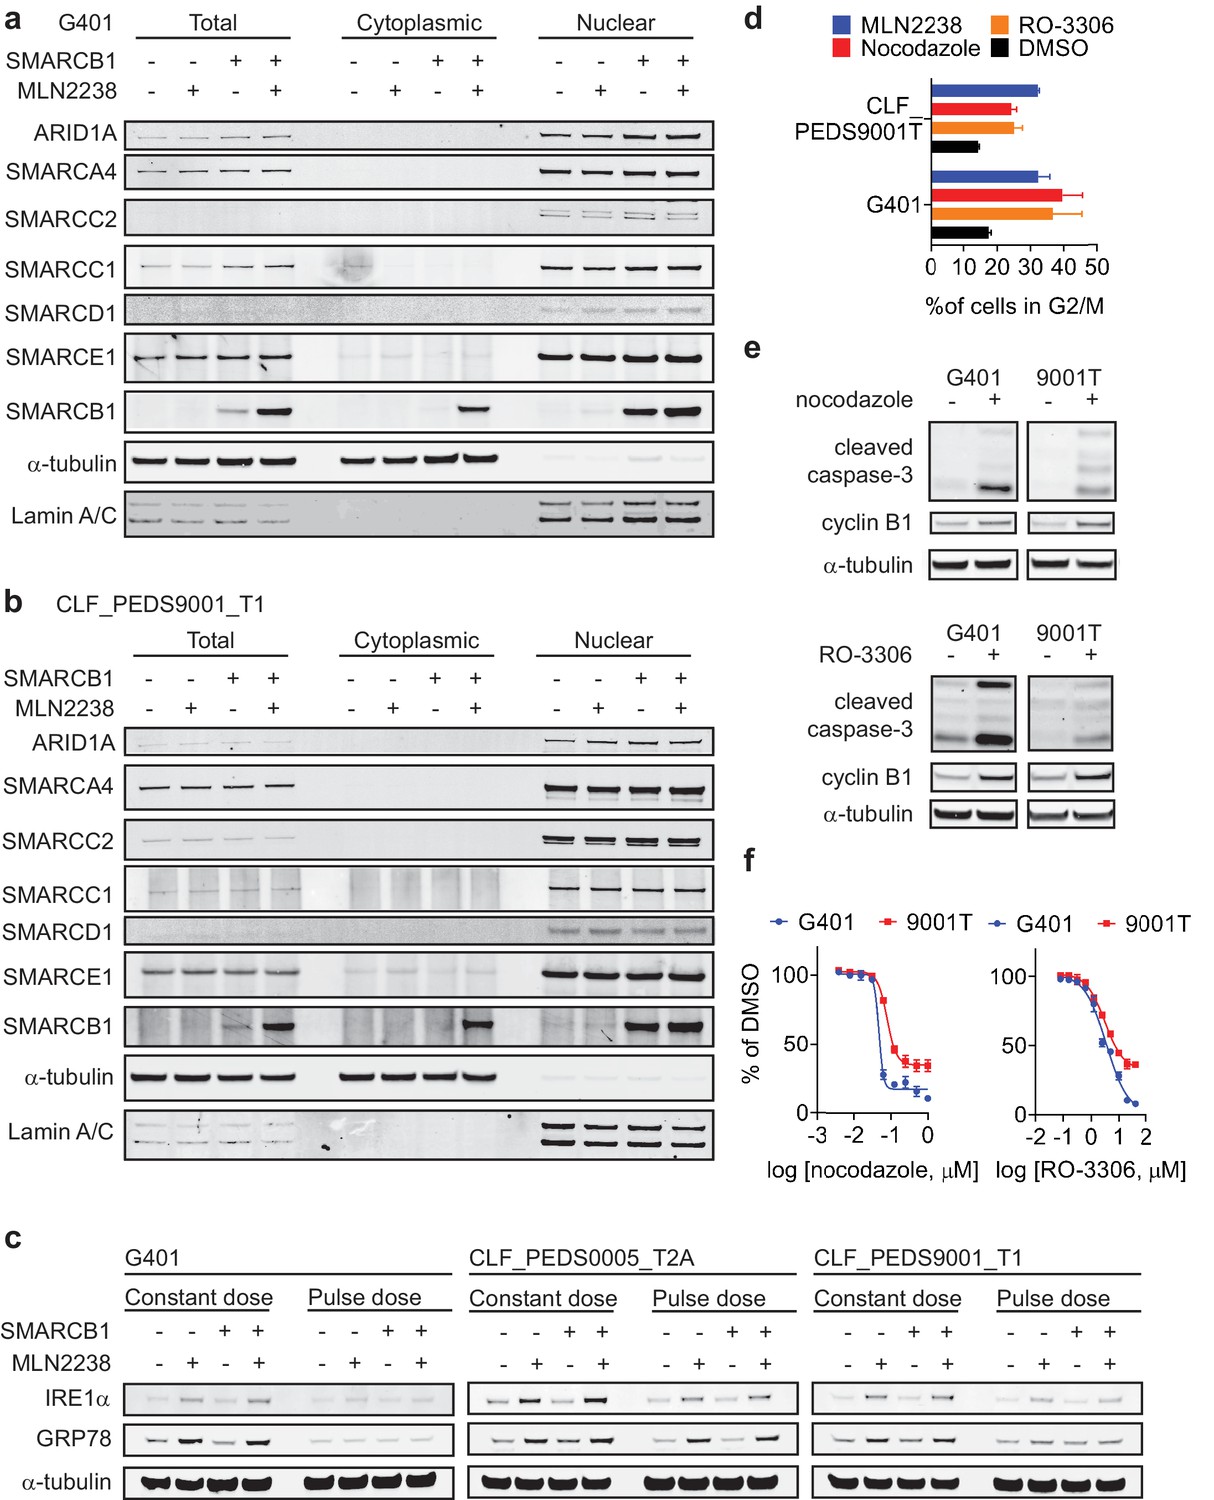
Treatment with proteasome inhibition does not lead to changes that can be rescued by SMARCB1 re-expression in the nuclear or cytoplasic levels of SWI/SNF complex members or ER stress proteins but is in part driven by cell cycle arrest in G2/M.
(a) and (b) Immunoblots from total, cytoplasmic and nuclear protein fractions show no significant difference in SWI/SNF complex members upon treatment of proteasome inhibitors (MLN2238 at 200 nM). Lamin A/C and alpha tubulin are loading controls. Blots representative of at least two biological repeats. (c) Treatment with proteasome inhibitor, MLN2238 at 200 nM, leads to induction of IRE1α and GRP78. However, induction of these ER stress proteins is not rescued upon re-expression of SMARCB1. (d) Treatment with cell cycle inhibitors nocodazole (microtubule assembly inhibitor; red) at 100 nM for G401 and 300 nM for CLF_PEDS9001_T1 or RO-3306 (CDK1 inhibitor; orange) at 10 μM for both cell lines leads to accumulation of cells in G2/M after 24 hr similar to that of MLN2238 (blue). (e) Nocodazole and RO-3306 treatment for 24 hr leads to activation of cleaved caspase-3 and accumulation of cyclin B1. (e) Treatment with cell cycle inhibitors nocodazole or RO-3306 at 72 hr leads to a maximum decrease in cell viability of 65–90% depending on the cell line and compound.
Figure 5 with 2 supplements
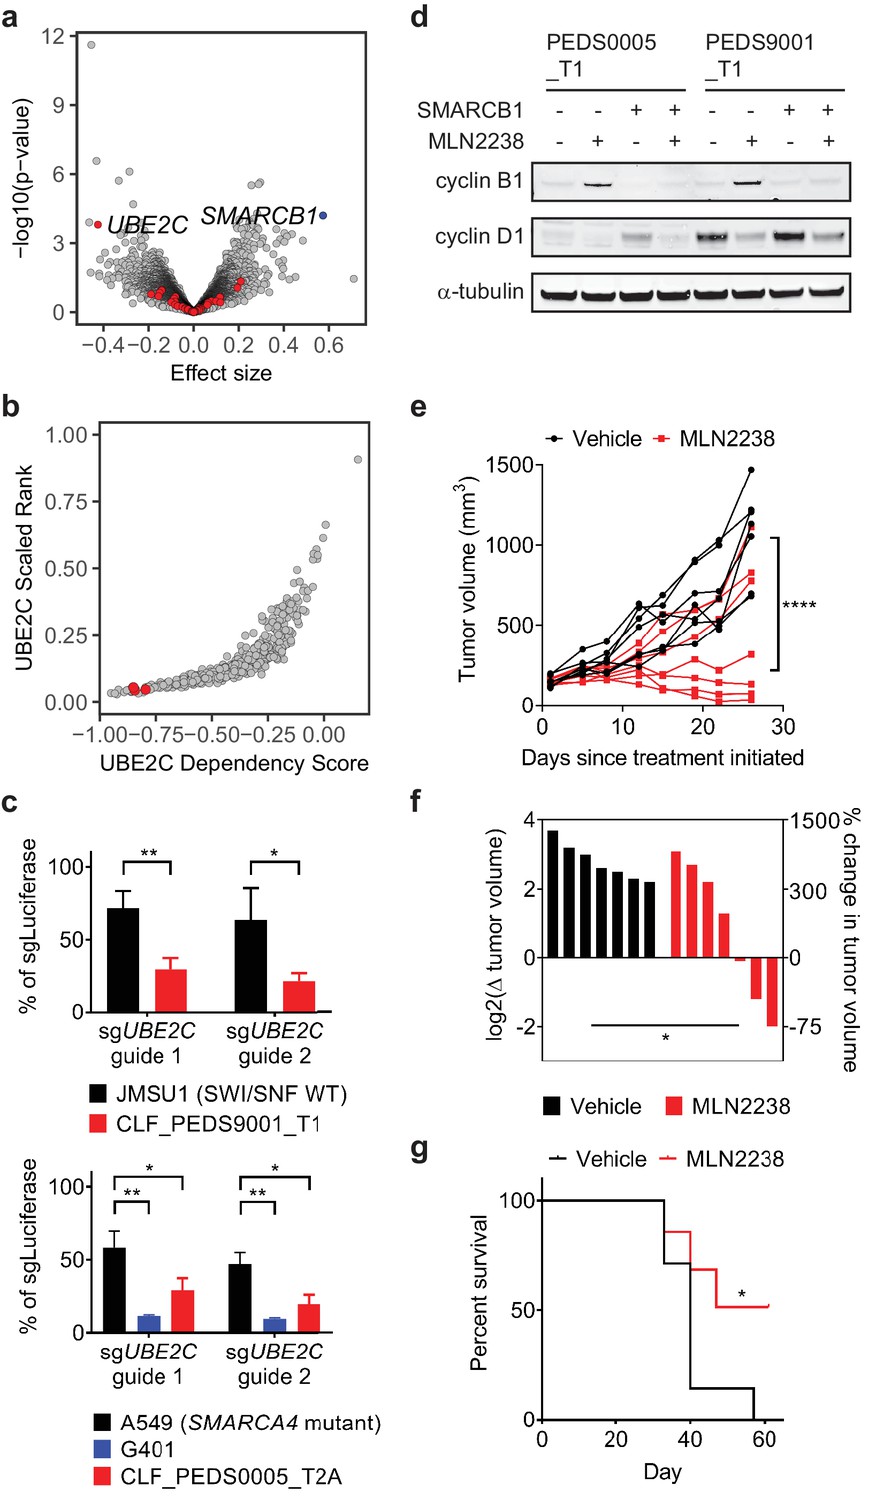
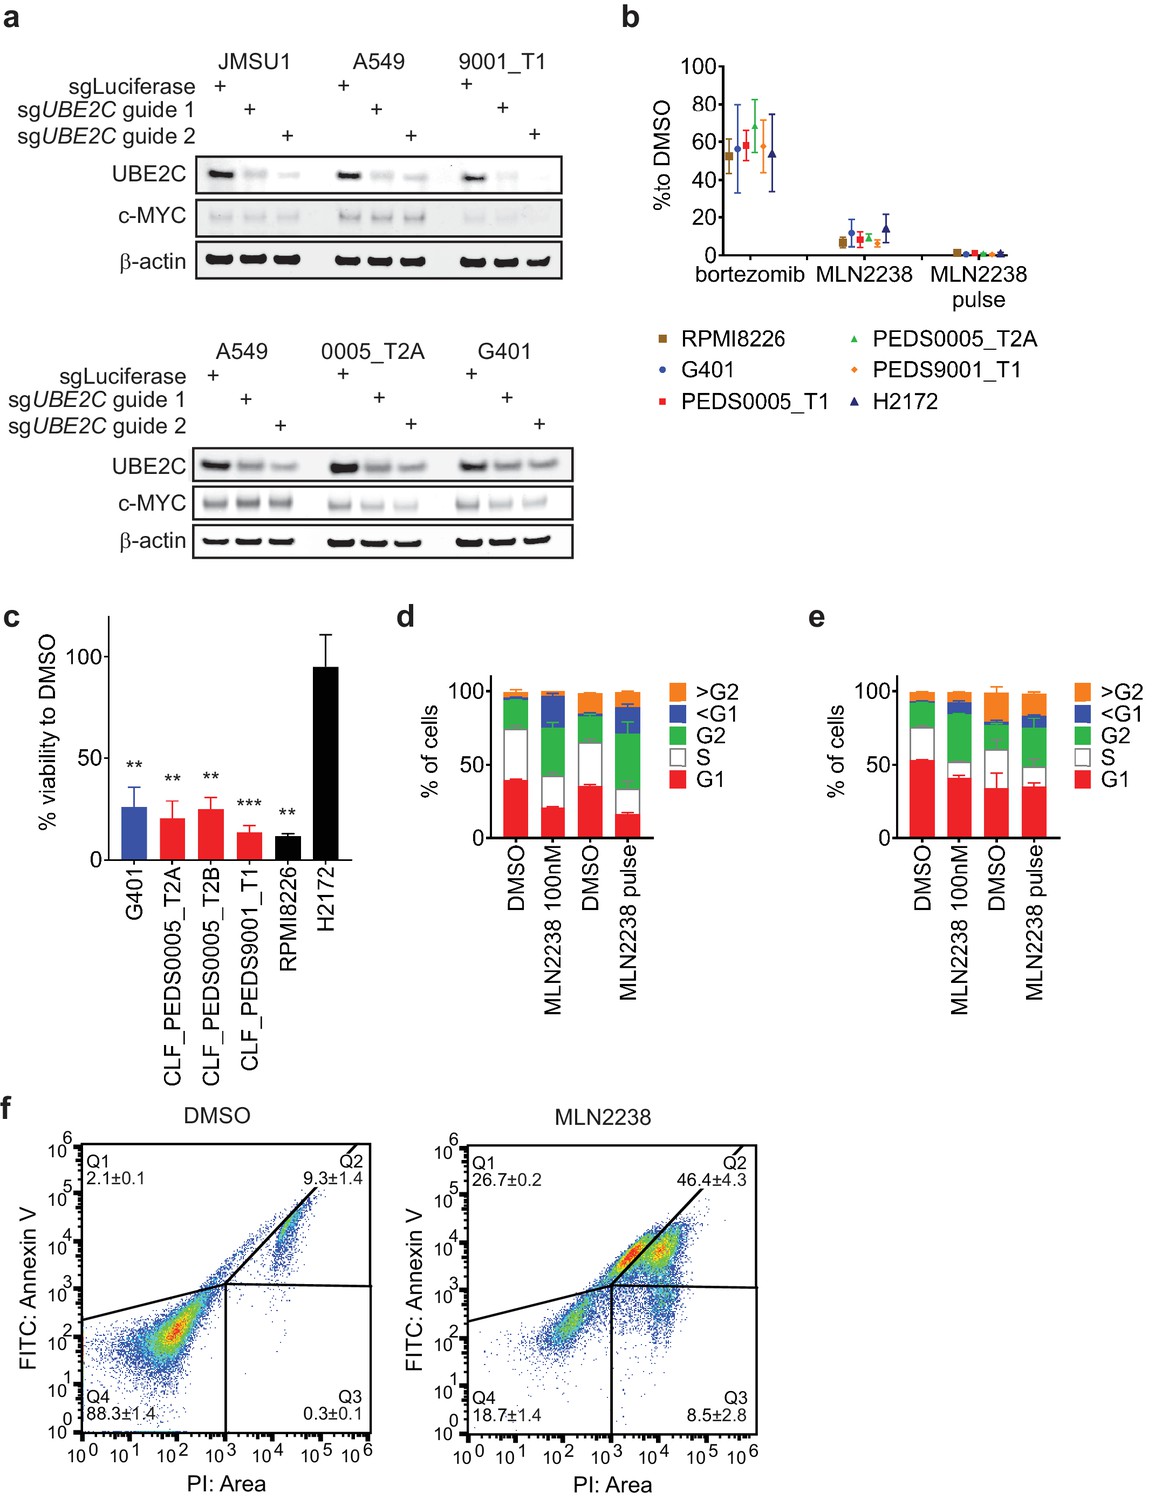
Cell cycle arrest secondary to proteasome inhibition acts via UBE2C/cyclin B1 dysregulation and proteasome inhibition with MLN2238 is effective in vivo.
(a) Volcano plot identifying genes that are required for survival in SMARCB1 deficient cancers. 204 genes were significantly upregulated when comparing the log2 fold change between SMARCB1 deficient cells and SMARCB1 re-expressed cells (Supplementary file 6). We assessed how loss of these genes affected viability in 3 cell lines with loss of SMARCB1 as compared to the rest of the 482 cell lines in Project Achilles DepMap 18Q3, a genome-wide loss of function screen using CRISPR-Cas9 and calculating an effect size (e.g. differential of the 3 cell lines to 482 cell lines). A negative effect size identifies genes when deleted are required for cells for survival and the 204 genes are identified in red. Deletion of UBE2C was significantly depleted. Deletion of SMARCB1 serves as a positive control in these SMARCB1 deficient cancers as these cell lines have loss of SMARCB1. (b) SMARCB1 deficient lines are in the top 5% of cell lines ranked by how dependent they are on UBE2C based on Project Achilles DepMap 18Q3 dataset. Three ATRT cancer cell lines (red dots; CHLA266, CHLA06, COGAR359) were compared to 482 cell lines profiled in Project Achilles (CERES dataset 18Q3). (c) Gene deletion of UBE2C by CRISPR-Cas9 leads to significant viability defects in RMC and MRT cell lines as compared to either SWI/SNF wt cell line, JMSU1 (day 10), or SMARCA4 mutant cell line, A549 (day 6). Error bars shown are standard deviations from two biological replicates. * indicates a two-tailed t-test p-value<0.05 and **<0.005. (d) Treatment with proteasome inhibitor, MLN2238 at 200 nM, leads to upregulation of cyclin B1 and this phenotype is rescued upon SMARCB1 re-expression in both CLF_PEDS0005_T1 and CLF_PEDS9001_T1. Cyclin D1 is included as a control to ensure that the effects of proteasome inhibition are specific to cyclin B1. Blots are representative of two biological replicates. (e) G401 xenograft tumor growth over time by individual mouse shows that treatment effects from MLN2238 can be seen as early as 8 days from treatment initiation as compared to vehicle control. Over 26 days, tumor volumes were significantly decreased in MLN2238 treated mice. **** indicates two-way ANOVA test with p-value<0.0001. (f) Waterfall plot of each tumor by log2 change in tumor volume on the left y-axis and correlative percent change in tumor volume on the right y-axis following 26 days of treatment with either vehicle (black) or MLN2238 (red). * indicates a two-tailed t-test p-value<0.05. (g) Kaplan-Meier curves from mice with G401 xenograft tumors treated with either vehicle or MLN2238 over 61 days. * indicates a p-value of 0.0489 by log-rank (Mantel-Cox) test.
-
Figure 5—source data 1
Source data for Figure 5a.
- https://doi.org/10.7554/eLife.44161.019
Figure 5—figure supplement 1
Pulse dosing of proteasome inhibitors leads to suppression of the proteasome, arrests cells in G2/M and leads to programmed cell death.
(a) Suppression of UBE2C protein by immunoblot when utilizing CRISPR-Cas9 guide RNAs targeting UBE2C. c-MYC levels modestly decreased upon UBE2C deletion in SMARCB1 deficient cell lines. Blots representative of at least two biological repeats. (b) Proteasome inhibitors suppress proteasome activity following one hour of treatment by assessing the cell’s ability to cleave Suc-LLVY-aminoluciferin following a one-hour treatment with a proteasome inhibitor as indicated in the figure (Materials and methods). Bortezomib was at 15 nM, MLN2238 was at 100 nM and MLN2238 pulse was at 2.5 μM. Error bars represent standard deviation from at least three biological replicates. (c) Pulse treatment with MLN2238 at 2.5 μM leads to significant viability defects in SMARCB1 deficient cell lines similar to multiple myeloma cell line, RPMI8226, and contrasts to lung non-small cell lung cancer cell line, H2172. Error bars are standard deviations from a two biological replicates. ** indicates a p-value<0.005 and *** indicates a p-value<0.0005. (d) and (e) Cell cycle analysis of G401 (d) or CLF_PEDS9001_T1 (e) treated with a continuous dose (200 nM) or a pulse dose (2.5 μM) of MLN2238 shows an increase in cells arrested in G2/M. Error bars represent standard deviation from at least two biological replicates. (f) Pulse treatment with MLN2238 (2.5 μM) in CLF_PEDS9001_T1 leads to increased populations that are Annexin V/PI and PI positive. Figures representative of 3 biological replicates.
Figure 5—figure supplement 2
Pulse treatment with MLN2238 can be rescued with SMARCB1 re-expression and in vivo studies identify MLN2238 leads to activation of cleaved caspase-3 and accumulation of cyclin B1.
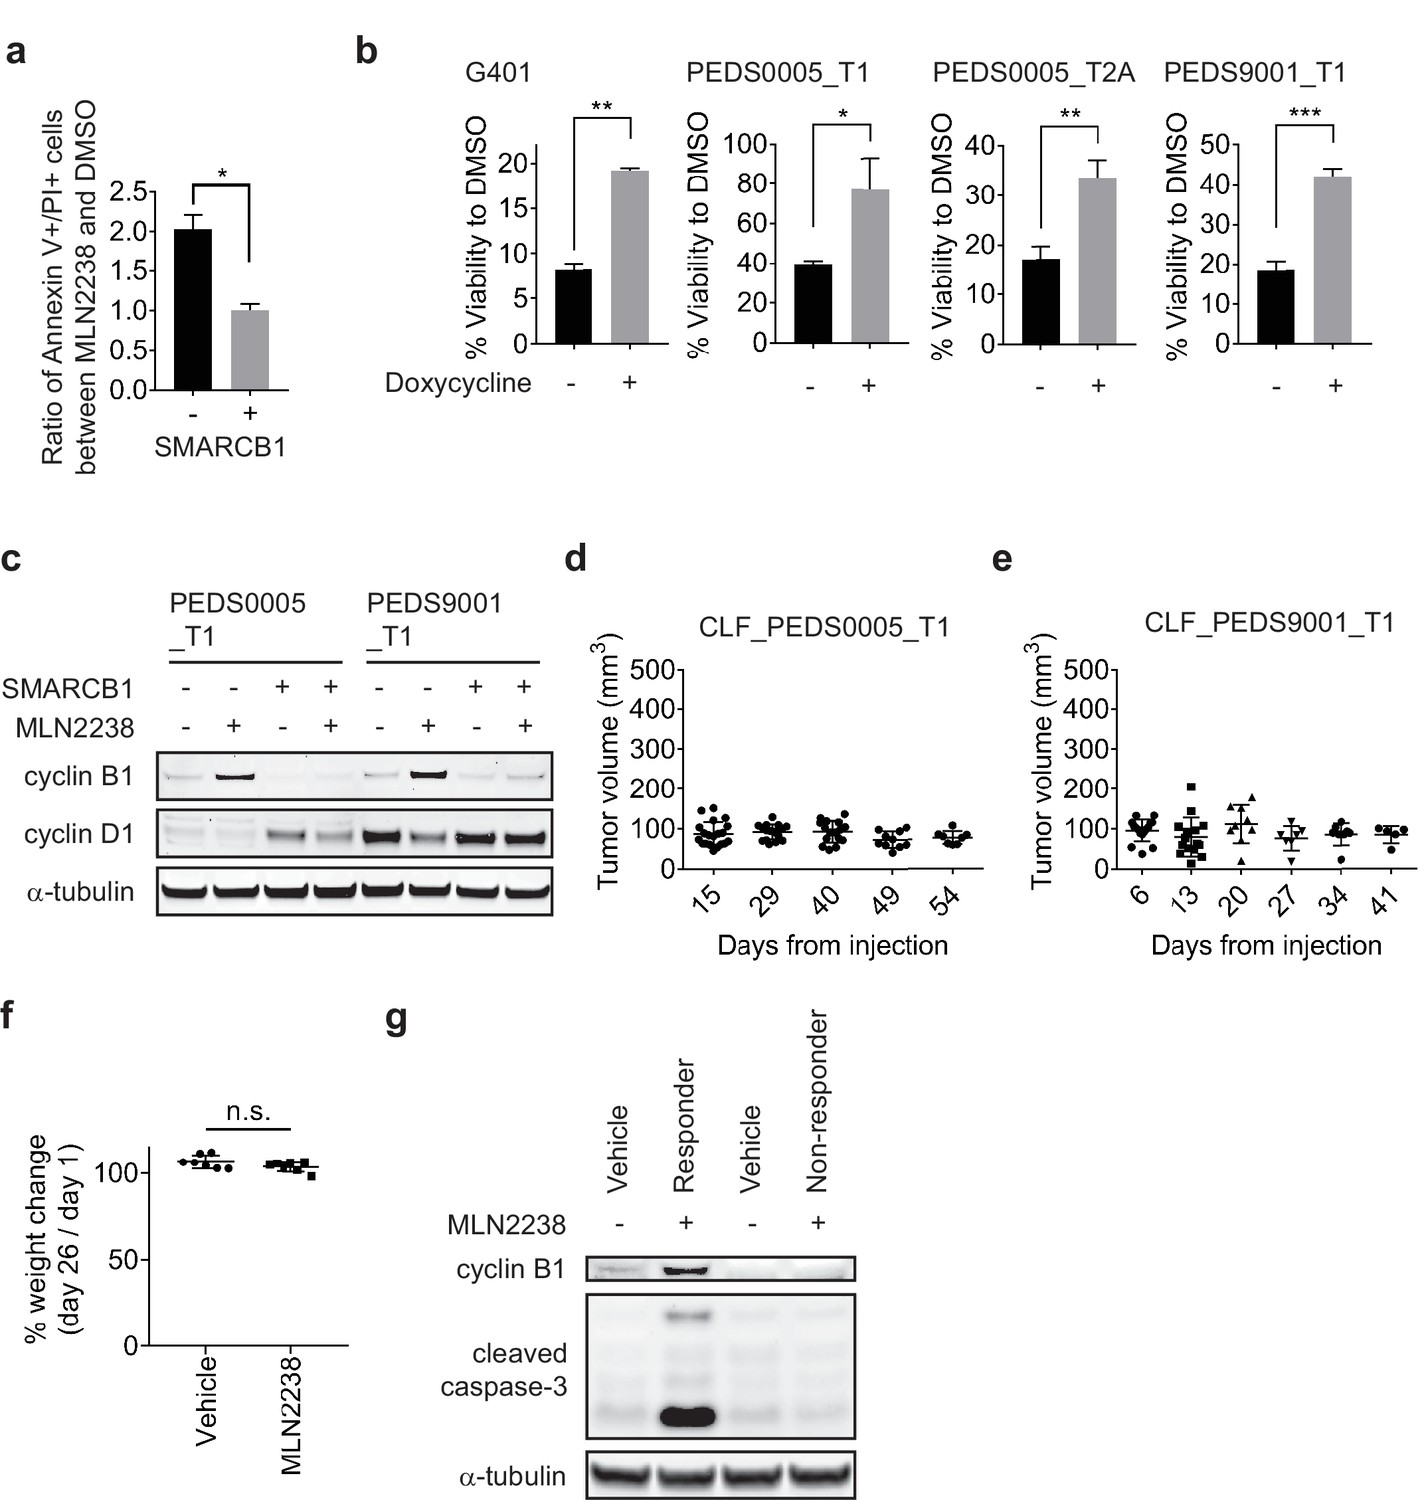
(a) Pulse treatment with MLN2238 (2.5 μM) in CLF_PEDS9001_T1 in the setting of re-expression of SMARCB1 leads to a decreased fold change in double Annexin V+/PI + cells. Error bars represent standard deviation from at least two biological replicates. * two-tailed t-test p-value<0.05. (b) Viability defects seen with pulse treatment with MLN2238 can be rescued with re-expression of SMARCB1 in SMARCB1 deficient cell lines. Error bars shown are standard deviations from two biological replicates. * indicates a two-tailed t-test p-value<0.05, **<0.005, ***<0.0005. (c) Pulse treatment with proteasome inhibitor, MLN2238, leads to upregulation of cyclin B1 and this phenotype is rescued upon SMARCB1 re-expression in both CLF_PEDS0005_T1 and CLF_PEDS9001_T1. Cyclin D1 is included as a control to ensure that the effects of the proteasome are specific to cyclin B1. Blots are representative of two biological replicates. (d) and (e) Primary tumor RMC cell lines (CLF_PEDS0005_T1 and CLF_PEDS9001_T) do not form tumors in vivo. 5 million cells were injected subcutaneously into Taconic immunodeficient mice and were monitored for tumor formation over 41 to 54 days. (f) % change in body weight of mice at day 26 as compared to day one following treatment with vehicle or with MLN2238. n.s. not significant based on a two-sided t-test p-value. (g) Immunoblot comparing pairs of vehicle and MLN2238 treated mice. One mouse tumor which responded to MLN2238 had activation of cleaved caspase-3 and increased cyclin B1 while one non-responder had no activation of these biomarkers.
Tables
Key resources table
| Reagent type (species) or resource | Designation | Source or reference | Identifiers | Additional information |
|---|---|---|---|---|
| Gene (Homo sapiens) | SMARCB1 | NA | ||
| Gene (Homo sapiens) | PSMB5 | NA | ||
| Gene (Homo sapiens) | CCNB1 | NA | ||
| Gene (Homo sapiens) | UBE2C | NA | ||
| Strain, strain background (Mus musculus) | CrTac:NCr-Foxn1nu | Taconic Biosciences | RRID:IMSR_TAC:ncrnu | |
| Genetic reagent () | Luciferase | this paper | RRID:Addgene_117072 | Backbone: pXPR_BRD003 |
| Genetic reagent (Homo sapiens) | UBE2C guide 1 | this paper | RRID:Addgene_117068 | Backbone: pXPR_BRD003 |
| Genetic reagent (Homo sapiens) | UBE2C guide 2 | this paper | RRID:Addgene_117071 | Backbone: pXPR_BRD003 |
| Genetic reagent (Homo sapiens) | PSMB5 guide 1 | this paper | RRID:Addgene_117073 | Backbone: pXPR_BRD003 |
| Genetic reagent (Homo sapiens) | PSMB5 guide 2 | this paper | RRID:Addgene_117074 | Backbone: pXPR_BRD003 |
| Genetic reagent (Homo sapiens) | pDONR223 SMARCB1 | this paper | RRID:Addgene_111181 | |
| Genetic reagent (Homo sapiens) | pLXI_401 LacZ | this paper | RRID:Addgene_111183 | Backbone: pLXI_403 |
| Genetic reagent (Homo sapiens) | pLXI_403 LacZ | this paper | RRID:Addgene_111184 | Backbone: pLXI_403 |
| Genetic reagent (Homo sapiens) | pLXI_401 SMARCB1 | this paper | RRID:Addgene_111182 | Backbone: pLXI_401 |
| Genetic reagent (Homo sapiens) | pLXI_403 SMARCB1 | this paper | RRID:Addgene_111185 | Backbone: pLXI_403 |
| Genetic reagent (Homo sapiens) | CP1050 | PMID: 27329820 | Druggable Cancer Targets v1.0 library (shRNA) | |
| Genetic reagent (Homo sapiens) | CP1074 | PMID: 27329820 | Druggable Cancer Targets v1.0 library (CRISPR-Cas9) | |
| Cell line (Homo sapiens) | CLF_PEDS0005_N | this paper | normal kidney cell line | |
| Cell line (Homo sapiens) | CLF_PEDS0005_T1 | this paper | primary RMC cell line | |
| Cell line (Homo sapiens) | CLF_PEDS0005_T2A | this paper | metastatic RMC cell line (adherent) | |
| Cell line (Homo sapiens) | CLF_PEDS0005_T2B | this paper | metastatic RMC cell line (suspension) | |
| Cell line (Homo sapiens) | CLF_PEDS9001_T1 | this paper | primary RMC cell line | |
| Cell line (Homo sapiens) | CLF_PEDS1012_T1 | this paper | Wilms tumor cell line | |
| Cell line (Homo sapiens) | G-401 | ATCC | CRL-1441 RRID:CVCL_0270 | |
| Cell line (Homo sapiens) | RPMI 8226 | ATCC | CCL-155 RRID:CVCL_0014 | |
| Cell line (Homo sapiens) | NCI-H2172 | ATCC | CRL-5930 RRID:CVCL_1537 | |
| Cell line (Homo sapiens) | A549 | ATCC | CCL-185 RRID:CVCL_0023 | |
| Cell line (Homo sapiens) | HA1E | other | Cell line maintained in W. C. Hahn lab | |
| Cell line (Homo sapiens) | JMSU1 | PMID: 30777879 | RRID:CVCL_2081 | |
| Antibody | anti-cytokeratin CAM5.2 | BD Biosciences | 349205 RRID:AB_2134314 | Immunohistochemistry |
| Antibody | anti-SMARCB1/BAF47 | BD Biosciences | 612110 RRID:AB_399481 | Immunohistochemistry |
| Antibody | anti-ARID1A (mouse monoclonal) | Santa Cruz Biotechnology | sc-373784 RRID:AB_10917727 | 1:500 |
| Antibody | antii-α-tubulin (mouse monoclonal) | Sigma-Aldrich | T9026 RRID:AB_477593 | 1:5000 |
| Antibody | anti-β-actin (C-4) (mouse monoclonal) | Santa Cruz Biotechnology | sc-47778 RRID:AB_2714189 | 1:10,000 |
| Antibody | anti-β-actin (D6A8) (rabbit monoclonal) | Cell Signaling Technology | #8457 RRID:AB_10950489 | 1:10,000 |
| Antibody | anti-BAF57/SMARCE1 (rabbit polyclonal) | Bethyl Laboratories, Inc. | A300-810A RRID:AB_577243 | 1:5000 |
| Antibody | anti-BAF60a (mouse monoclonal) | Santa Cruz Biotechnology | sc-135843 RRID:AB_2192137 | 1:500 |
| Antibody | anti-SMARCC1/BAF155 (D7F8S) (rabbit monoclonal) | Cell Signaling Technology | #11956 | 1:1000 |
| Antibody | anti-BAF170 (G-12) (mouse monoclonal) | Santa Cruz Biotechnology | sc-166237 RRID:AB_2192013 | 1:500 |
| Antibody | anti-SMARCA4 (G-7) (mouse monoclonal) | Santa Cruz Biotechnology | sc-17796 RRID:AB_626762 | 1:1000 |
| Antibody | anti-Cleaved Caspase-3 (Asp175) (5A1E) (rabbit monoclonal) | Cell Signaling Technology | #9664 RRID:AB_2070042 | 1:1000 |
| Antibody | anti-c-Myc (N-262) (rabbit polyclonal) | Santa Cruz Biotechnology | sc-764 RRID:AB_631276 | 1:200 |
| Antibody | anti-c-Myc (rabbit polyclonal) | Cell Signaling Technology | #9402 RRID:AB_2151827 | 1:1000 |
| Antibody | anti-cyclin B1 (V152) (mouse monoclonal) | Cell Signaling Technology | #4135 RRID:AB_2233956 | 1:1000 |
| Antibody | anti-cyclin B1 (rabbit polyclonal) | Cell Signaling Technology | #4138 RRID:AB_2072132 | 1:1000 |
| Antibody | anti-cyclin D1 (M-20) (rabbit polyclonal) | Santa Cruz Biotechnology | sc-718 RRID:AB_2070436 | 1:1000 |
| Antibody | anti-GAPDH (14C10) (rabbit monoclonal) | Cell Signaling Technology | #2118 RRID:AB_561053 | 1:1000 |
| Antibody | anti-GAPDH (D4C6R) (mouse monoclonal) | Cell Signaling Technology | #97166 RRID:AB_2756824 | 1:1000 |
| Antibody | anti-GRP78 (mouse monoclonal) | Rockland Immunochemicals | 200–301 F37 RRID:AB_2611159 | 1:10,000 |
| Antibody | anti-IRE1α (14C10) (rabbit monoclonal) | Cell Signaling Technology | #3294 RRID:AB_823545 | 1:2000 |
| Antibody | anti-Lamin A/C (rabbit polyclonal) | Cell Signaling Technology | #2032 RRID:AB_2136278 | 1:1000 |
| Antibody | anti-PSMB5 (rabbit polyclonal) | Abcam | ab3330 RRID:AB_303709 | 1:1000 |
| Antibody | anti-SMARCB1/SNF5 (rabbit polyclonal) | Bethyl Laboratories, Inc. | A301-087A RRID:AB_2191714 | 1:5000 |
| Antibody | anti-UBE2C (mouse monoclonal) | Proteintech | 66087–1 RRID:AB_11232220 | 1:1000 |
| Commercial assay or kit | QIAamp DNA Blood Midi Kit | Qiagen | 51183 | |
| Commercial assay or kit | QIAprep Spin Miniprep Kit | Qiagen | 27106 | |
| Commercial assay or kit | Rneasy Plus Mini Kit | Qiagen | 74134 | |
| Commercial assay or kit | Qubit RNA HS Assay Kit | Thermo Fisher Scientific | Q32852 | |
| Commercial assay or kit | KAPA Stranded mRNA-Seq Kit | Kapa Biosystems | KK8420 | |
| Commercial assay or kit | KAPA Library Quantification Kit | Kapa Biosystems | KK4835 | |
| Commercial assay or kit | High-Capacity cDNA Reverse Transcription Kit | Thermo Fisher Scientific | 4368814 | |
| Commercial assay or kit | Power SYBR Green PCR Master Mix | Thermo Fisher Scientific | 4368708 | |
| Commercial assay or kit | Senescence β-Galactosidase Staining Kit | Cell Signaling Technology | 9860S | |
| Commercial assay or kit | CellTiter-Glo Luminescent Cell Viability Assay | Promega | G7570 | |
| Commercial assay or kit | Proteasome-Glo Chymotrypsin-Like Cell-based Assay | Promega | G8660 | |
| Commercial assay or kit | Annexin V: FITC Apoptosis Detection Kit | Thermo Fisher Scientific | BD 556547 | |
| Commercial assay or kit | PI/Rnase Staining Buffer | BD Pharmingen | 550825 | |
| Commercial assay or kit | FxCycle PI/Rnase Staining Solution | Invitrogen | F10797 | |
| Chemical compound, drug | bortezomib (PS-341) | Selleck Chemicals | S1013 | in vitro studies |
| Chemical compound, drug | ixazomib (MLN2238) | Selleck Chemicals | S2180 | in vitro studies |
| Chemical compound, drug | nocodazole | Selleck Chemicals | S2775 | in vitro studies |
| Chemical compound, drug | Ro-3306 | Selleck Chemicals | S7747 | in vitro studies |
| Chemical compound, drug | MLN2238 | MedChem Express | HY-10453 | in vivo studies |
| Software, algorithm | SvABA v0.2.1 | PMID: 29535149 | ||
| Software, algorithm | FlowJo v10.0 | RRID:SCR_008520 | ||
| Software, algorithm | ComBat | RRID:SCR_010974 | ||
| Software, algorithm | GraphPad Prism v8.0 | RRID:SCR_002798 | ||
| Software, algorithm | GSEA | Broad Institute | RRID:SCR_003199 | |
| Software, algorithm | GATK v.4.0.4.0 | PMID: 20644199 | RRID:SCR_001876 | |
| Software, algorithm | TopHat v2.0.11 | PMID: 22383036 | RRID:SCR_013035 | |
| Software, algorithm | DESeq2 | PMID: 25516281 | RRID:SCR_015687 |
Additional files
-
Supplementary file 1
Significant mutations identified by MuTect2.
- https://doi.org/10.7554/eLife.44161.020
-
Supplementary file 2
SMARCB1 Fluorescence In Situ Hybridization results.
- https://doi.org/10.7554/eLife.44161.021
-
Supplementary file 3
Structural changes identified by SvABA in CLF_PEDS0005_T.
- https://doi.org/10.7554/eLife.44161.022
-
Supplementary file 4
Structural changes identified by SvABA in CLF_PEDS9001_T.
- https://doi.org/10.7554/eLife.44161.023
-
Supplementary file 5
Fusion sequences identified by PCR-Free Whole Genome Sequencing.
- https://doi.org/10.7554/eLife.44161.024
-
Supplementary file 6
Average differential expression across inducible SMARCB1 RMC and MRT cell lines following SMARCB1 re-expression along with comparison to TARGET.
- https://doi.org/10.7554/eLife.44161.025
-
Supplementary file 7
Overlap between RNAi, CRISPR-Cas9 and small-molecule screens.
- https://doi.org/10.7554/eLife.44161.026
-
Supplementary file 8
Gene Ontology Gene Set Enrichment Analysis from SMARCB1 re-expression studies.
- https://doi.org/10.7554/eLife.44161.027
-
Supplementary file 9
Average differential expression across SMARCB1 RMC and MRT cell lines following DMSO or MLN2238 treatment.
- https://doi.org/10.7554/eLife.44161.028
-
Supplementary file 10
Gene Ontology Gene Set Enrichment Analysis from cells treated with MLN2238.
- https://doi.org/10.7554/eLife.44161.029
-
Supplementary file 11
SMARCB1 exon-exon junction qRT-PCR primers.
- https://doi.org/10.7554/eLife.44161.030
-
Supplementary file 12
sgRNAs used in the CRISPR-Cas9 validation studies.
- https://doi.org/10.7554/eLife.44161.031
-
Transparent reporting form
- https://doi.org/10.7554/eLife.44161.032
Download links
A two-part list of links to download the article, or parts of the article, in various formats.
Downloads (link to download the article as PDF)
Open citations (links to open the citations from this article in various online reference manager services)
Cite this article (links to download the citations from this article in formats compatible with various reference manager tools)
Renal medullary carcinomas depend upon SMARCB1 loss and are sensitive to proteasome inhibition
eLife 8:e44161.
https://doi.org/10.7554/eLife.44161


