The structure of the Ctf19c/CCAN from budding yeast
- Harvard Medical School, Howard Hughes Medical Institute, United States
Figures
Figure 1 with 2 supplements
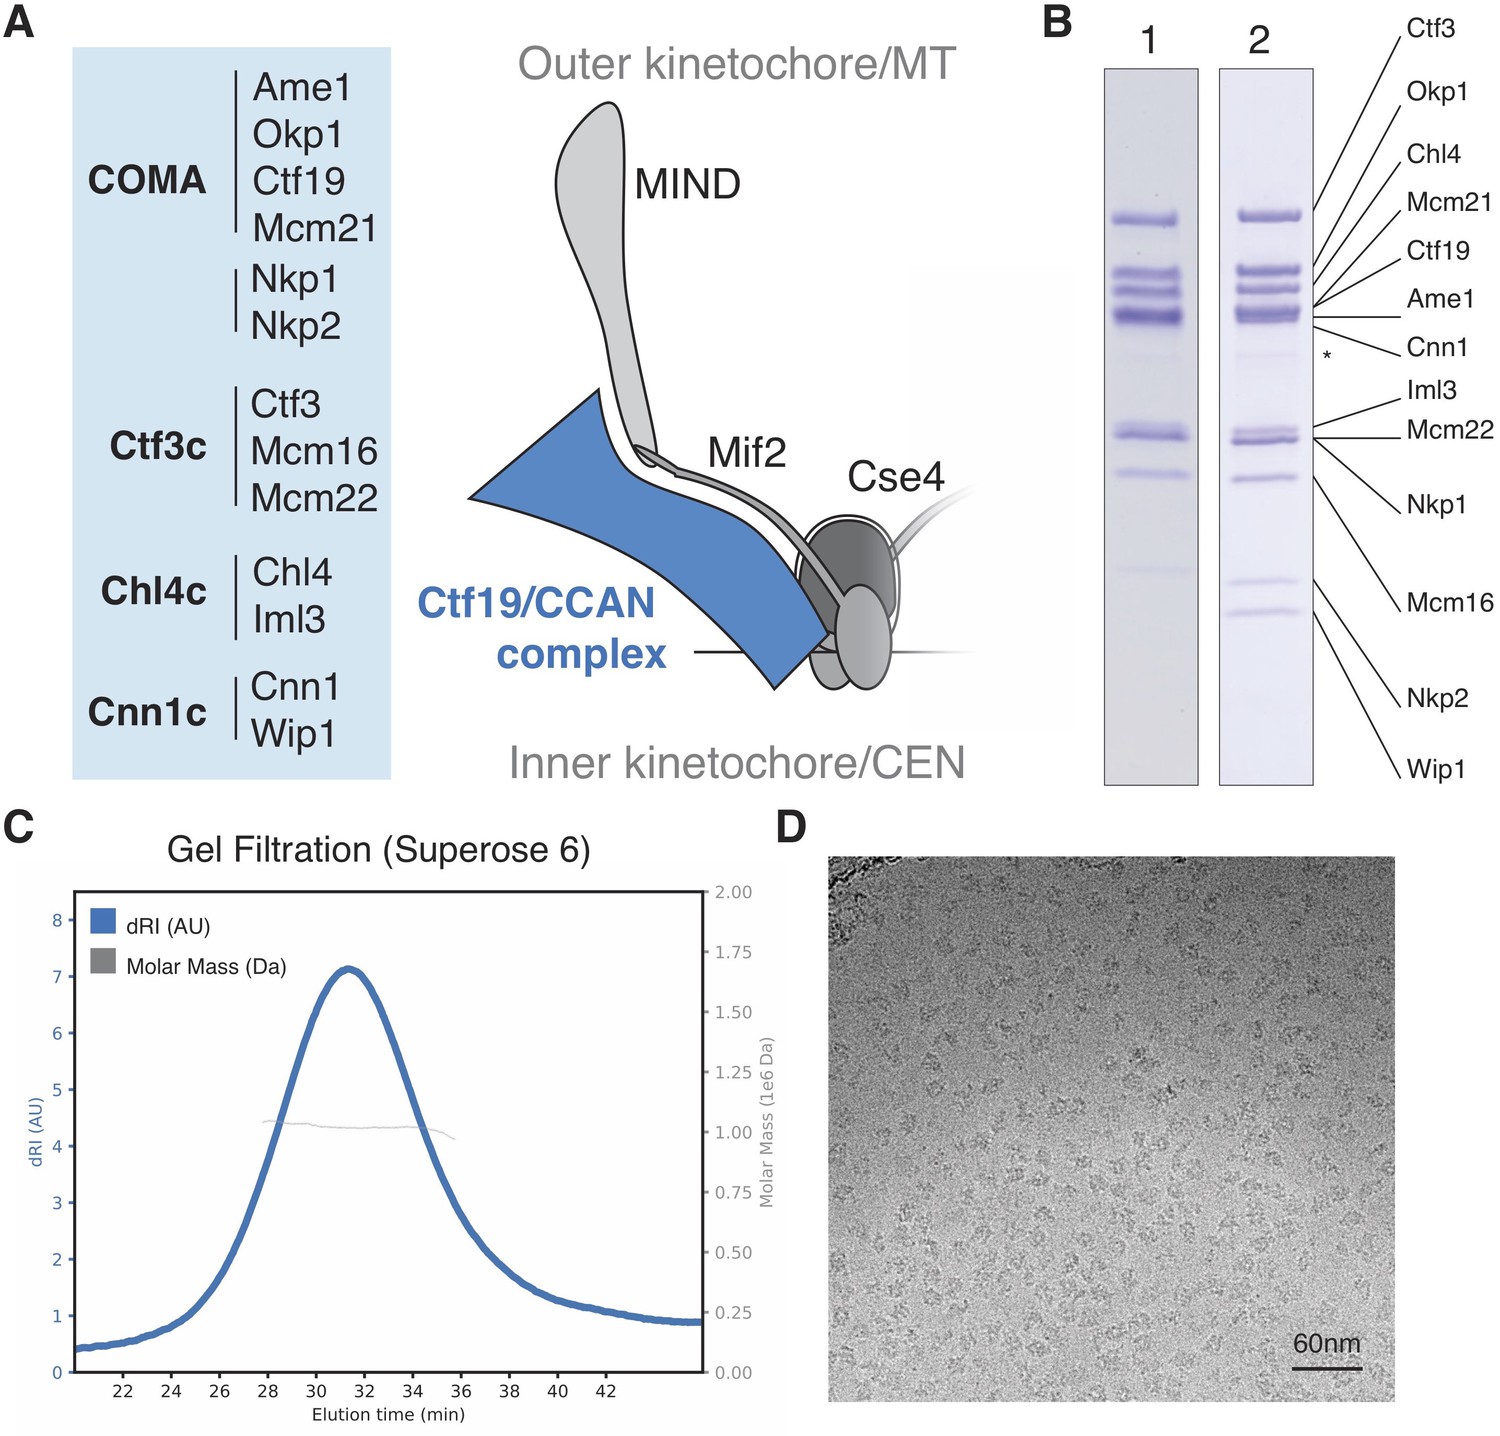
Reconstitution of the S.cerevisiae Ctf19c.
(A) List of Ctf19c proteins grouped according to subcomplex and schematic of the yeast inner kinetochore (MT – microtubule; CEN – centromere). (B) SDS-PAGE analysis of reconstituted Ctf19c samples (1 – without Cnn1-Wip1; 2 – with Cnn1-Wip1; * – Cnn1 degradation product). (C) Mass determination by multi-angle light scattering for the reconstituted Ctf19c used for cryo-EM (dRI – differential refractive index; Mw1.02 × 106 Da±2.16%). (D) Representative micrograph showing Ctf19c particles embedded in vitreous ice.
Figure 1—figure supplement 1
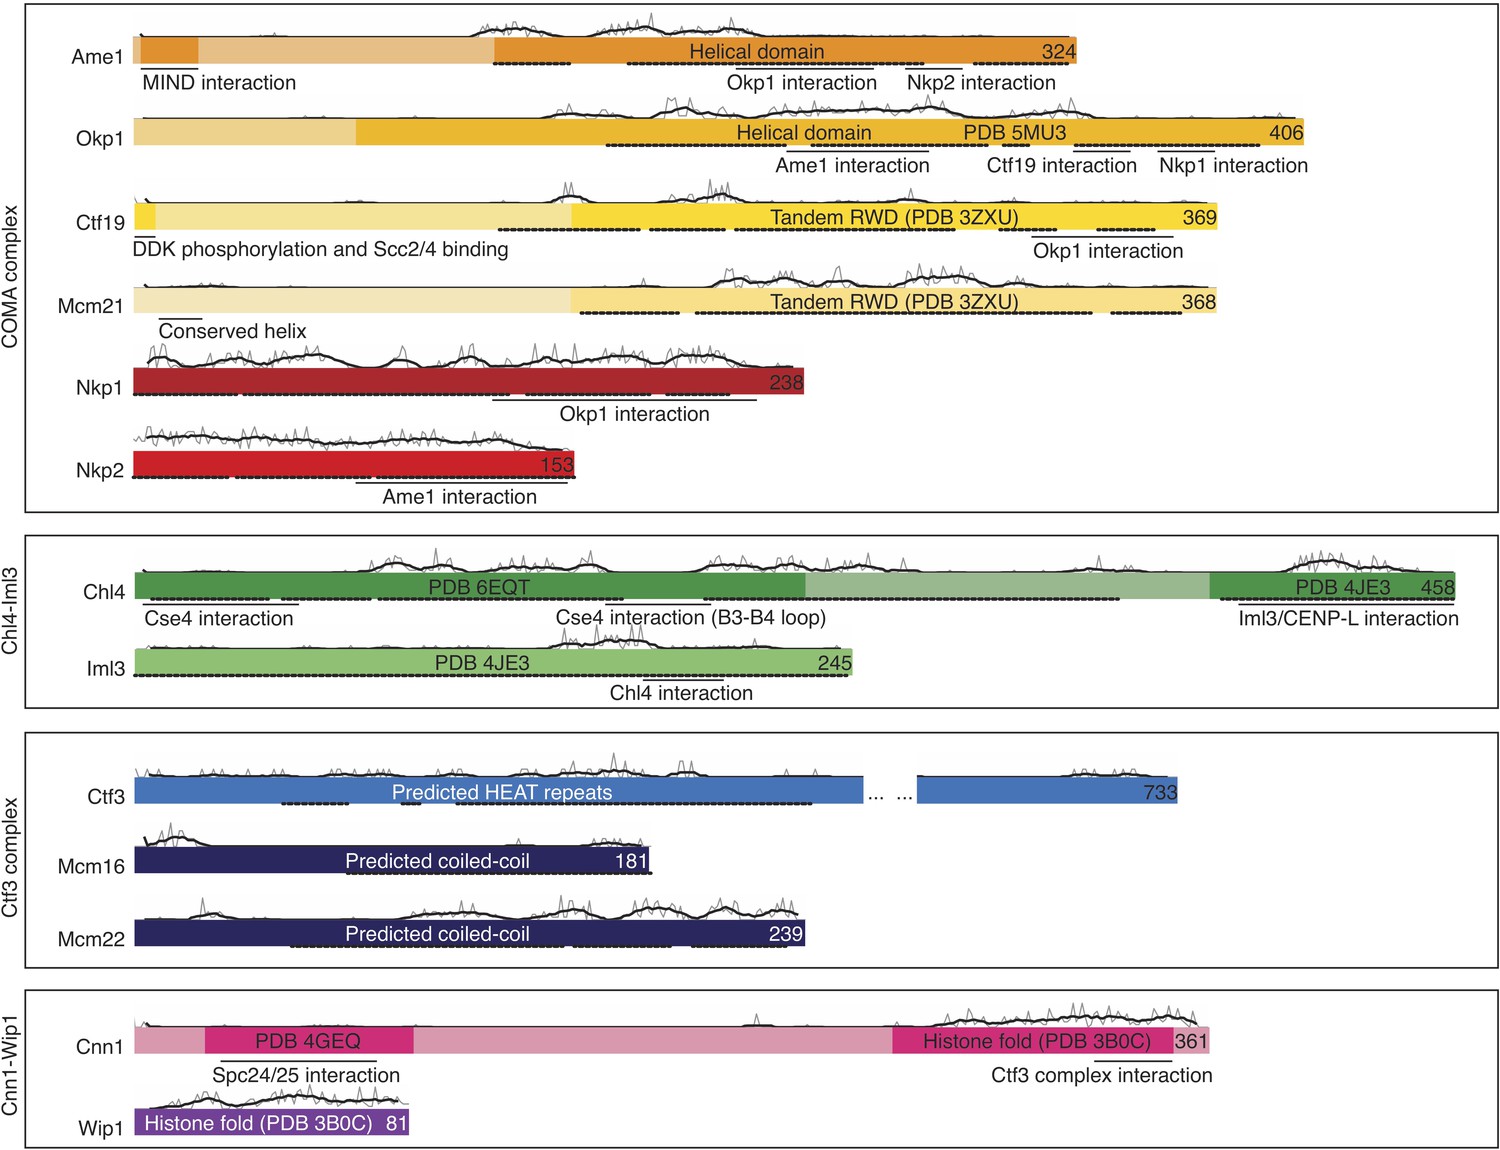
Schematic showing Ctf19c subunits organized by subcomplex membership Members are colored as in Figure 2C.
Regions that lack clearly-predicted secondary structure motifs are pale (Kelley et al., 2015). Solid lines beneath colored bars show known interactions. Dotted lines show fragments included in the refined model. Gray lines above the colored bars show primary sequence conservation (scaled separately for each subunit) according to alignments that include a representative panel of species (Katoh et al., 2017; van Hooff et al., 2017). Alignments for Nkp1 and Nkp2 included only yeasts, as no known vertebrate homologs exist. Superimposed black lines show smoothened conservation scores over a sliding window. A summary of models used for building is presented in Supplementary file 2.
Figure 1—figure supplement 2
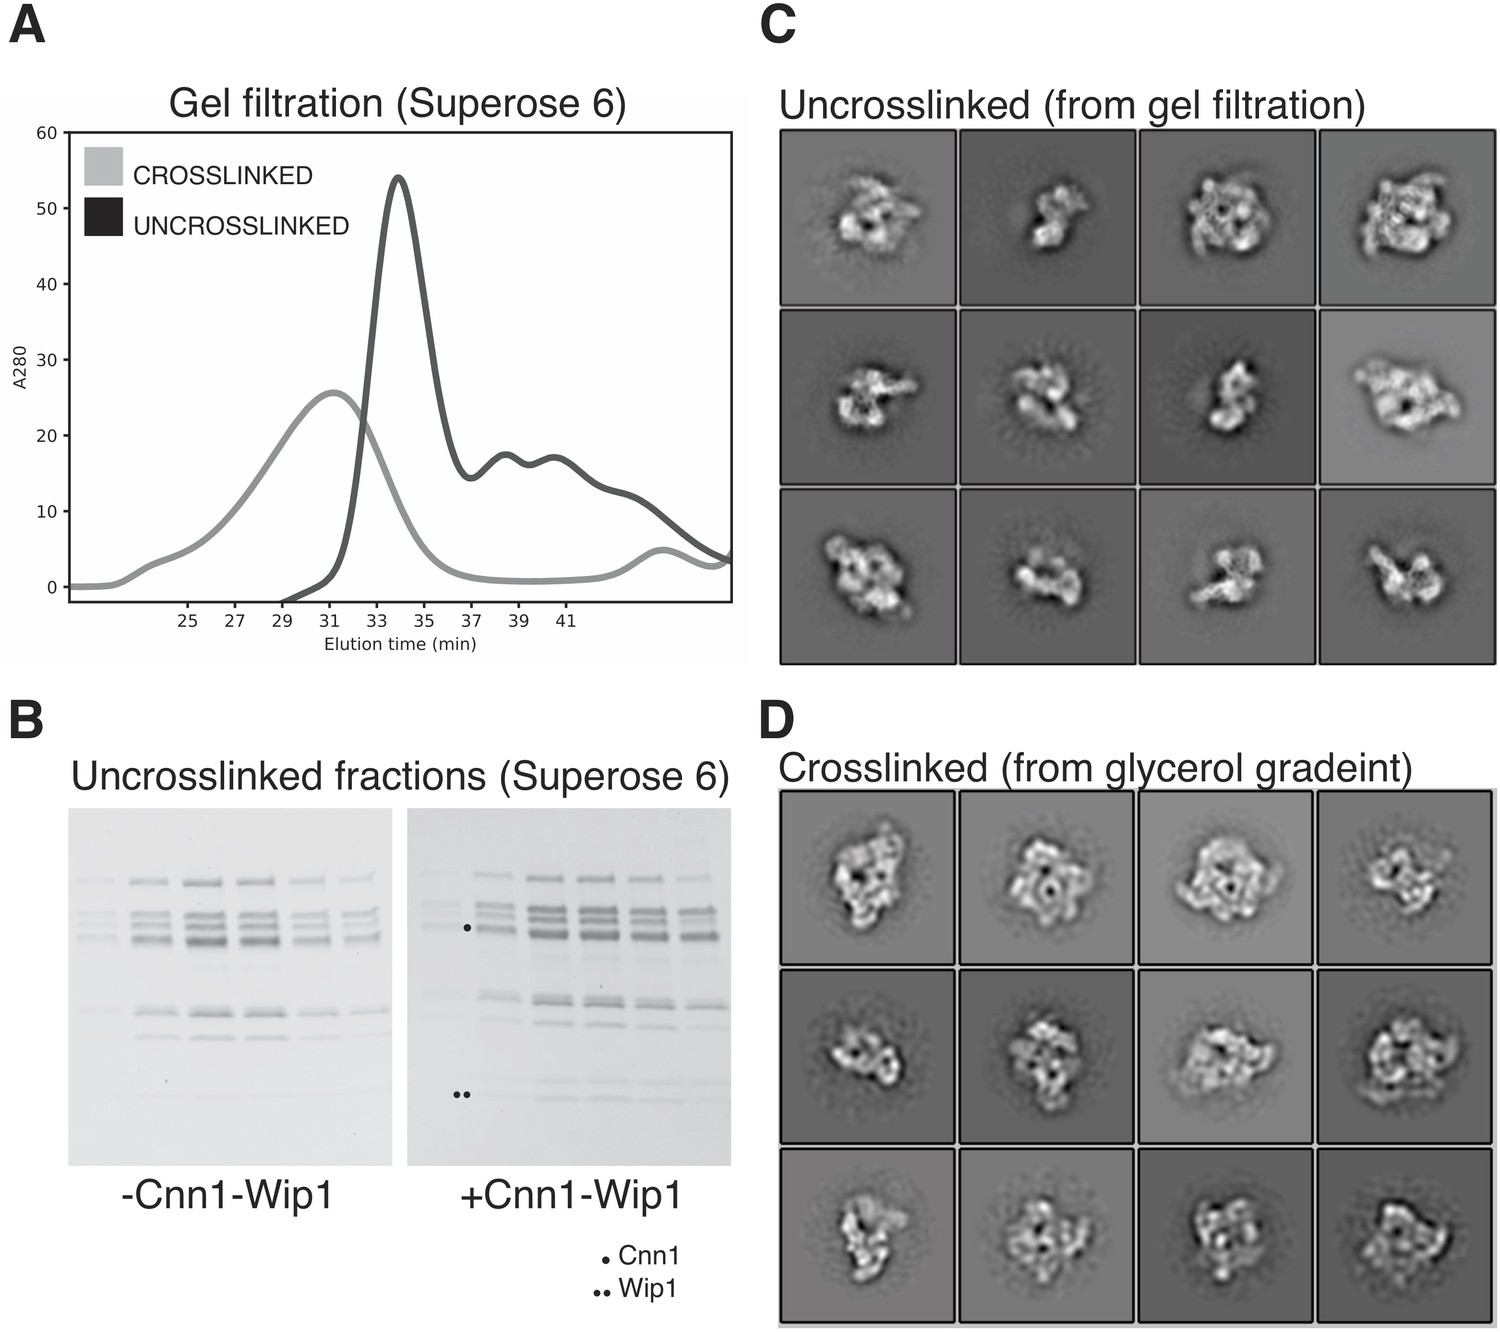
Ctf19c preparation and crosslinking procedure.
(A) Size exclusion chromatography for comparison of uncrosslinked and crosslinked Ctf19c samples. (B) SDS-PAGE analysis of uncrosslinked Ctf19c preparations after size exclusion chromatography. Equivalent fractions are shown for samples with and without Cnn1-Wip1. (C) Two-dimensional class averages of uncrosslinked Ctf19c particles after purification by size exclusion chromatography. (D) Two-dimensional class averages of Ctf19c particles after purification by crosslinking gradient sedimentation.
Figure 2 with 3 supplements
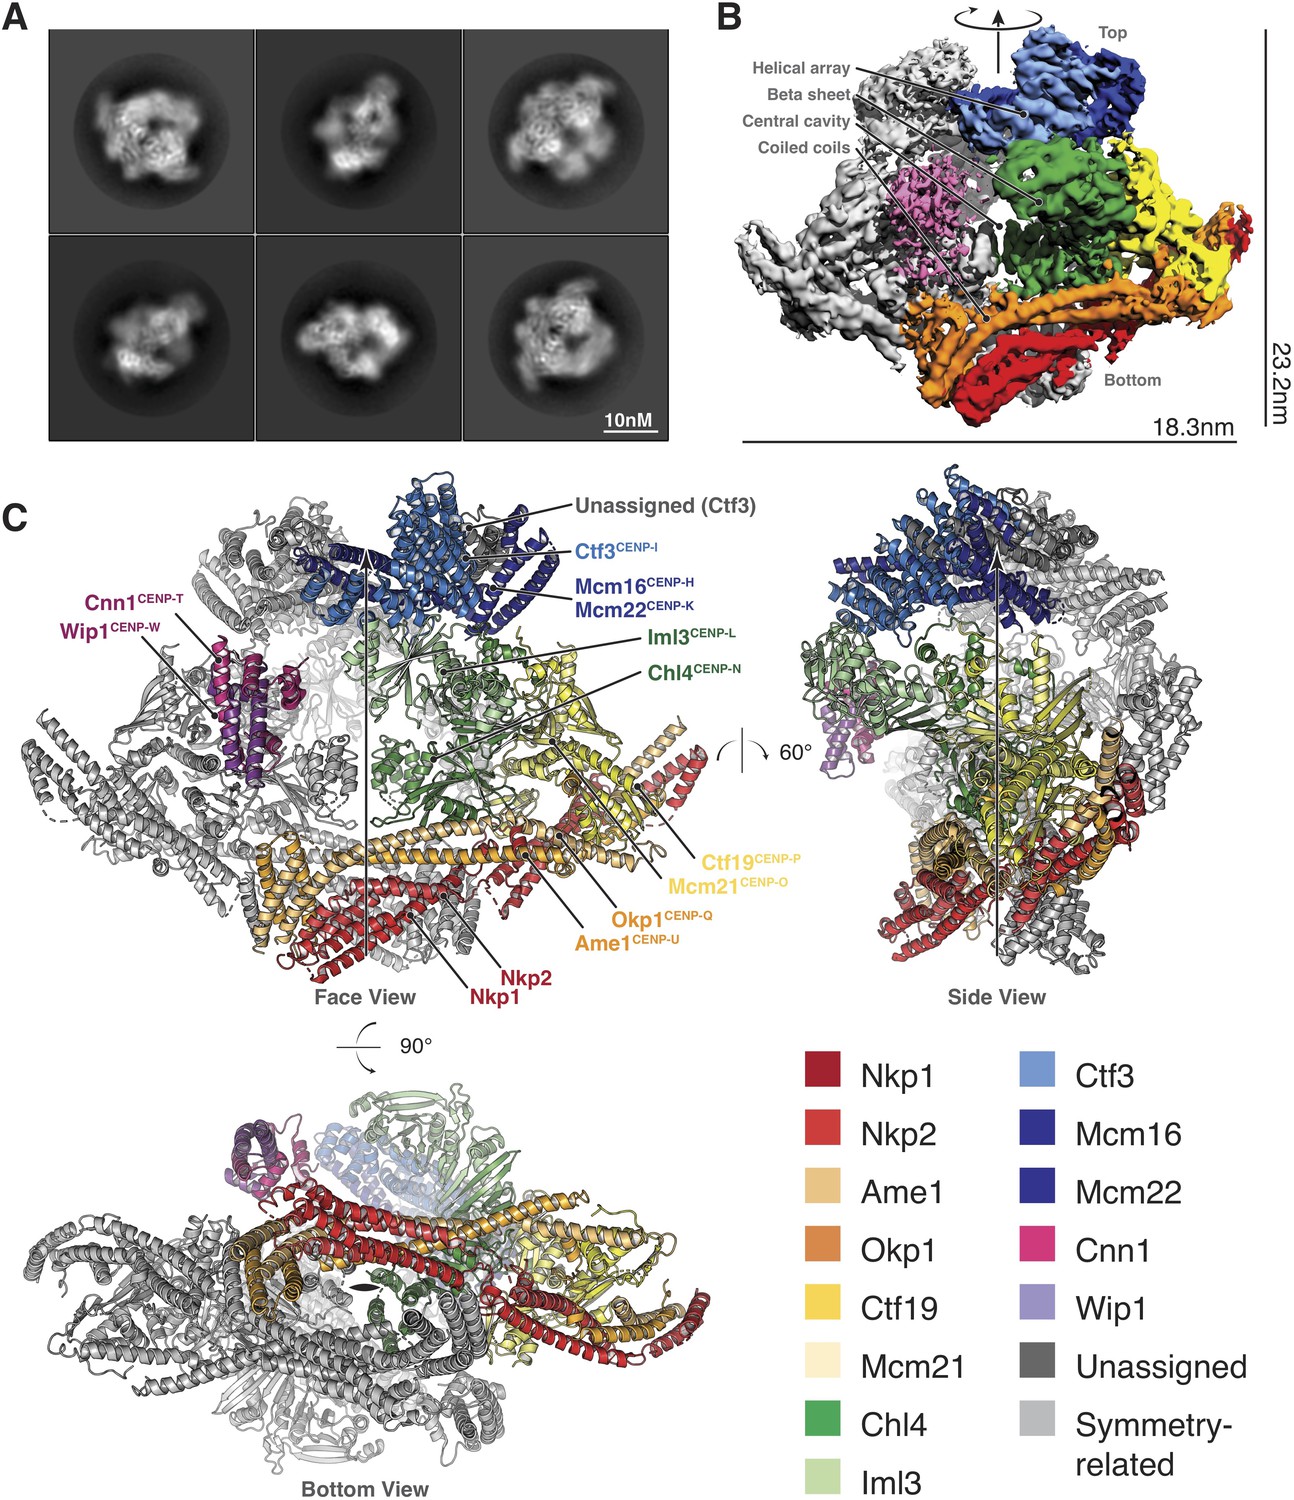
Structure determination and model of the Ctf19c.
(A) Two-dimensional class averages showing various Ctf19c projections. (B) Initial Ctf19c density map with twofold symmetry applied. (C) Molecular model of the Ctf19c. The twofold symmetry axis is marked by an arrow. Subunits from one monomeric assembly are colored according to their identities. Those related by twofold symmetry are colored gray. The face view corresponds to the orientation shown in panel B.
Figure 2—figure supplement 1
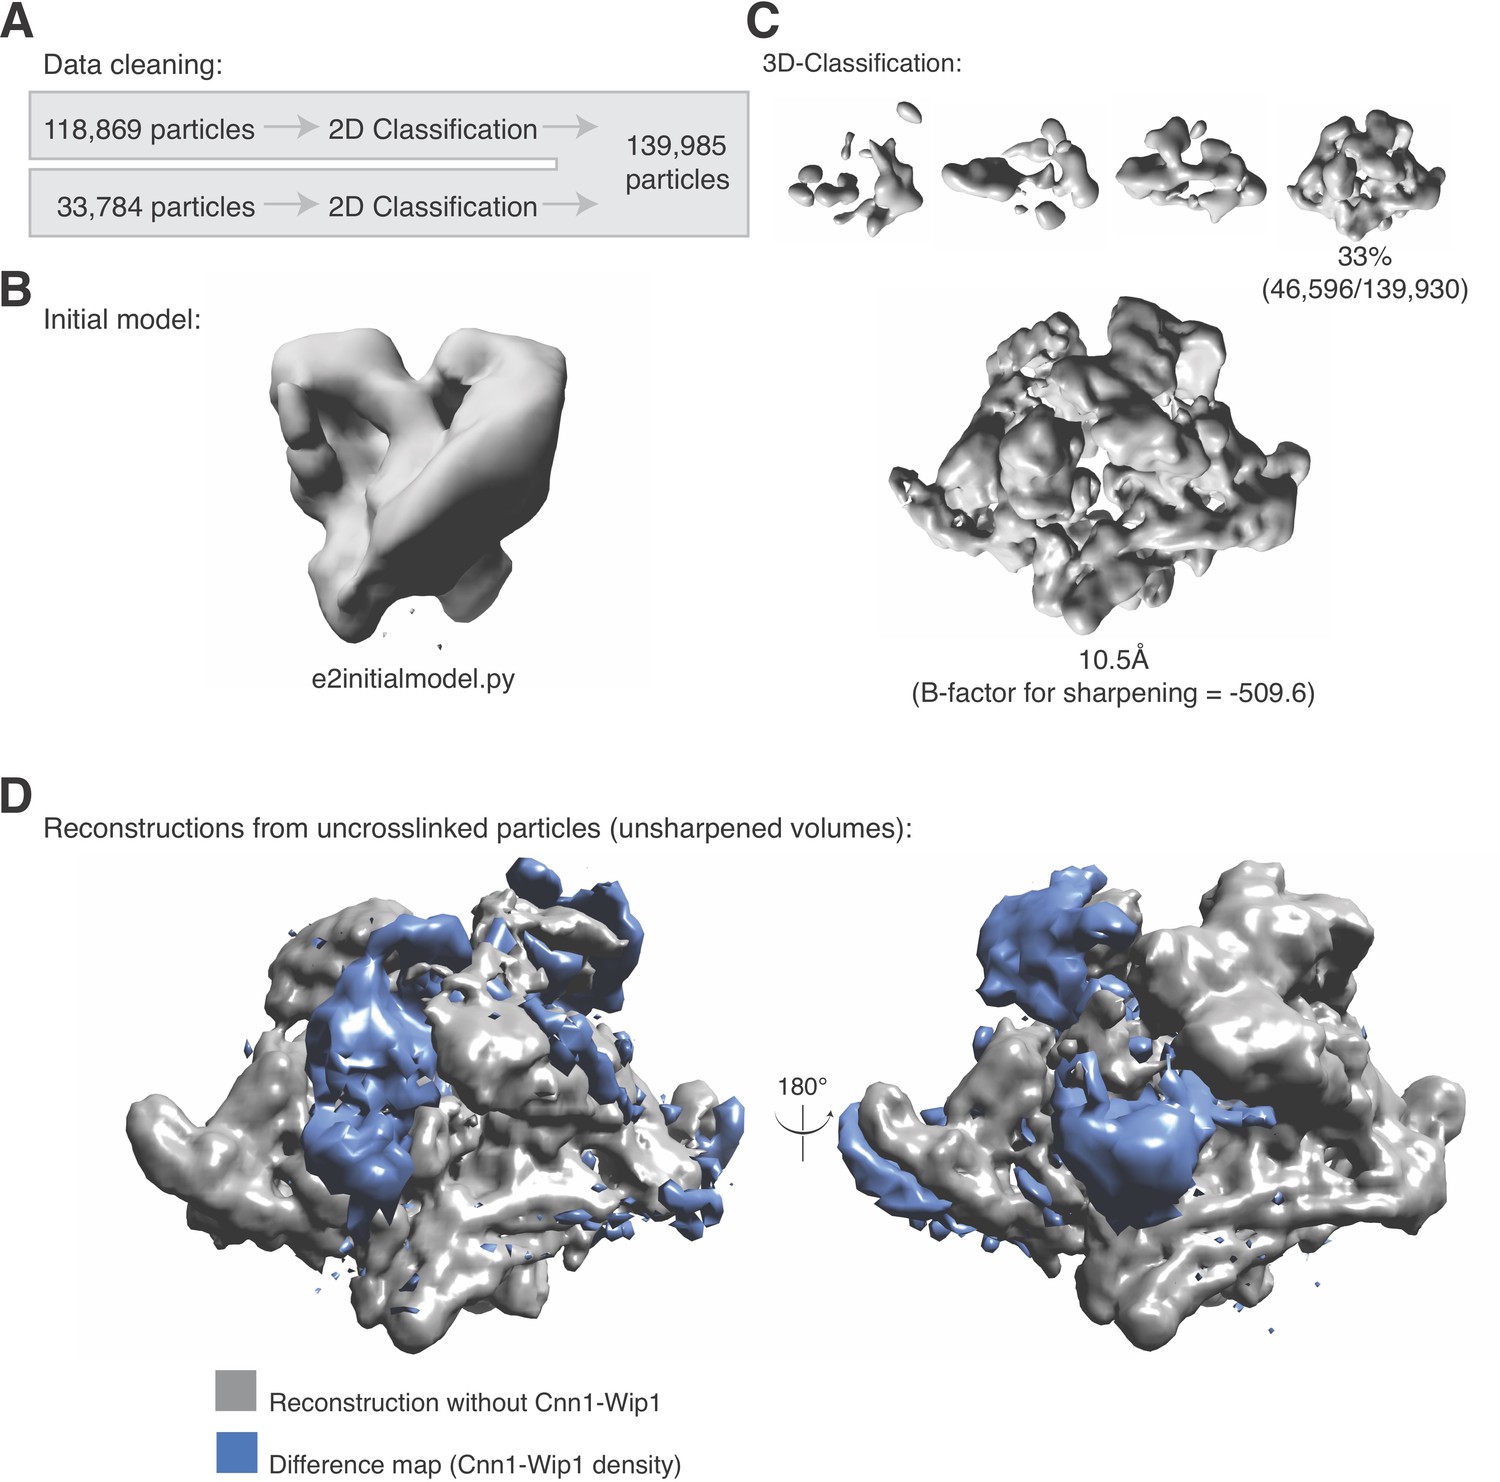
Initial three-dimensional cryo-EM reconstructions of the Ctf19c.
(A) Data collection summary for the reconstruction show in in panel C. Images of crosslinked Ctf19c particles were collected manually at 200 kV. (B) Initial model used as a reference for three-dimensional classifications. The model was calculated from a small number of two-dimensional class averages using the program e2initialmodel.py (Tang et al., 2007). (C) Three-dimensional classification results for particles selected from images described in panel A. (D) Comparison of three-dimensional volumes calculated from uncrosslinked Ctf19c samples with or without Cnn1-Wip. With the exception of the missing density corresponding to Cnn1-Wip1, the two volumes showed nearly identical organization and features.
Figure 2—figure supplement 2

Data processing summary for Ctf19c structure determination.
(A) Summary of data cleaning and pooling to generate an initial set of particles used for three-dimensional refinements in panel B. Three datasets were collected at 300 kV. The first two (left) were pooled immediately and the third (right) was added after initial three-dimensional classification. Images from the third dataset (right) contained mild crystalline ice contamination, and strict filtering substantially lowered the yield of useable particles relative to the total number. (B) Good particles were subjected to three-dimensional refinement and classification. Resolutions correspond to gold-standard FSC estimations (Scheres and Chen, 2012) and are provided as indicators of relative map quality. The central map at the bottom of the panel, which displays high-quality density throughout the particle volume, was used for molecular modeling and coordinate refinement. Ctf3c organization was determined with the help of the map shown to its left. The map at the right side of the panel shows high-resolution features that aided model building for the COMA complex.
Figure 2—figure supplement 3
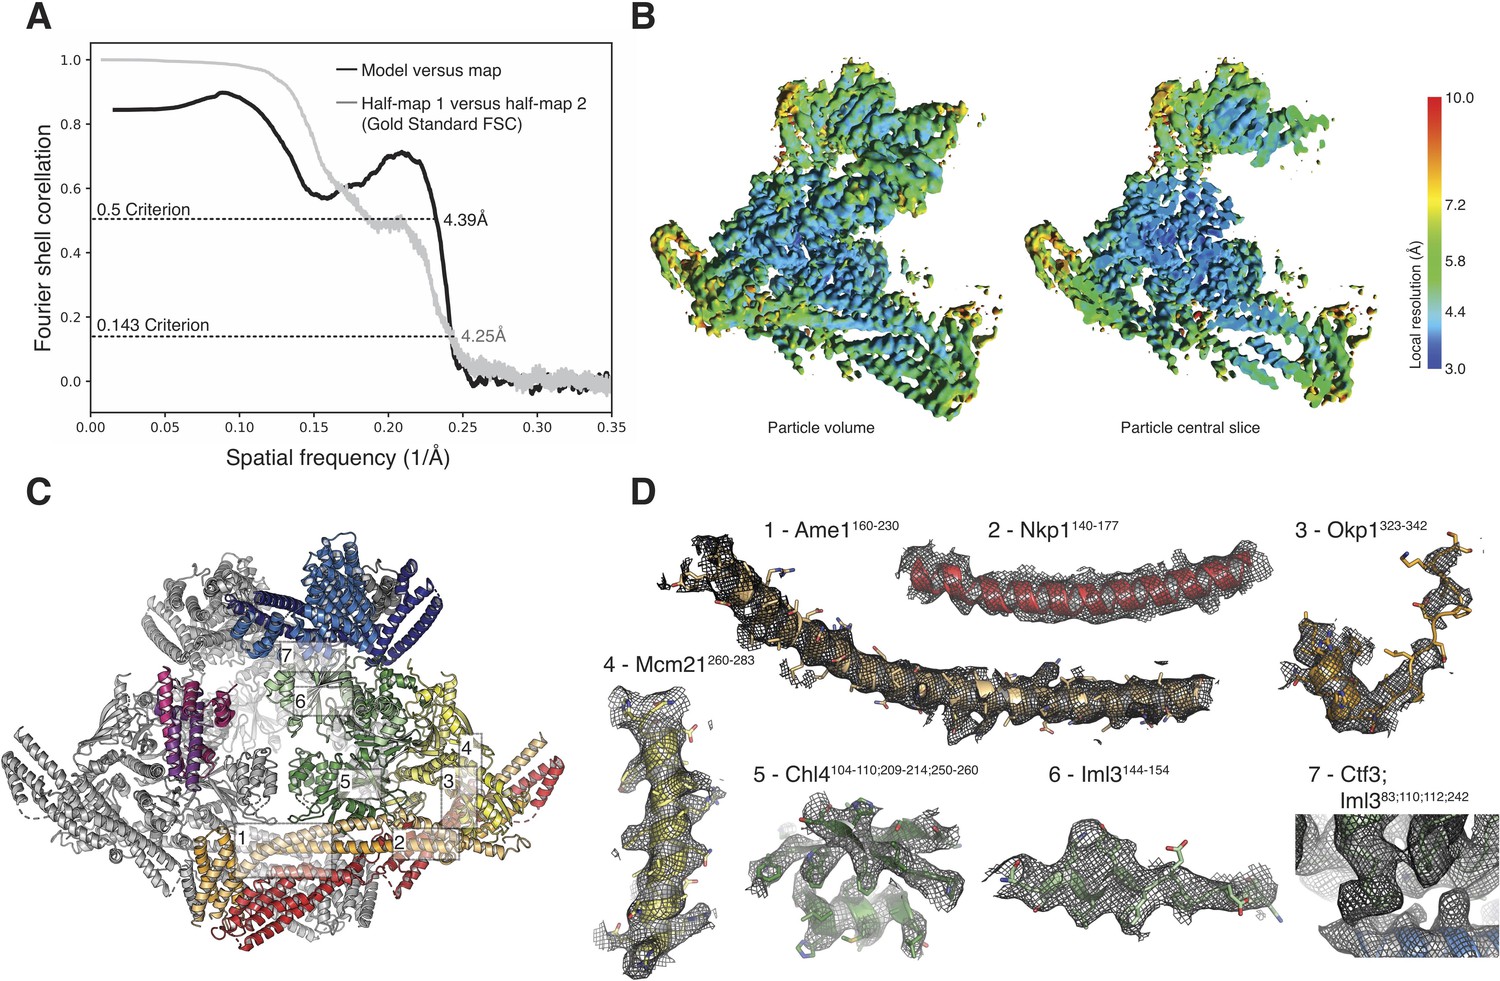
Model summary and examples of map quality.
(A) Fourier shell correlation (FSC) plots for half-maps (independent reconstructions, gold standard FSC; Scheres and Chen, 2012) and for the final Ctf19c model versus the final reconstruction. (B) Local resolution shown for the entire volume (left) and for a central slice through the volume (right) used for modeling. (C) An overview of the full Ctf19c structure with areas of interest labeled. (D) Examples of the density map with the corresponding Ctf19c model shown. Numbers correspond to those shown in panel C, and model colors correspond to those used in Figure 2C.
Figure 3 with 3 supplements
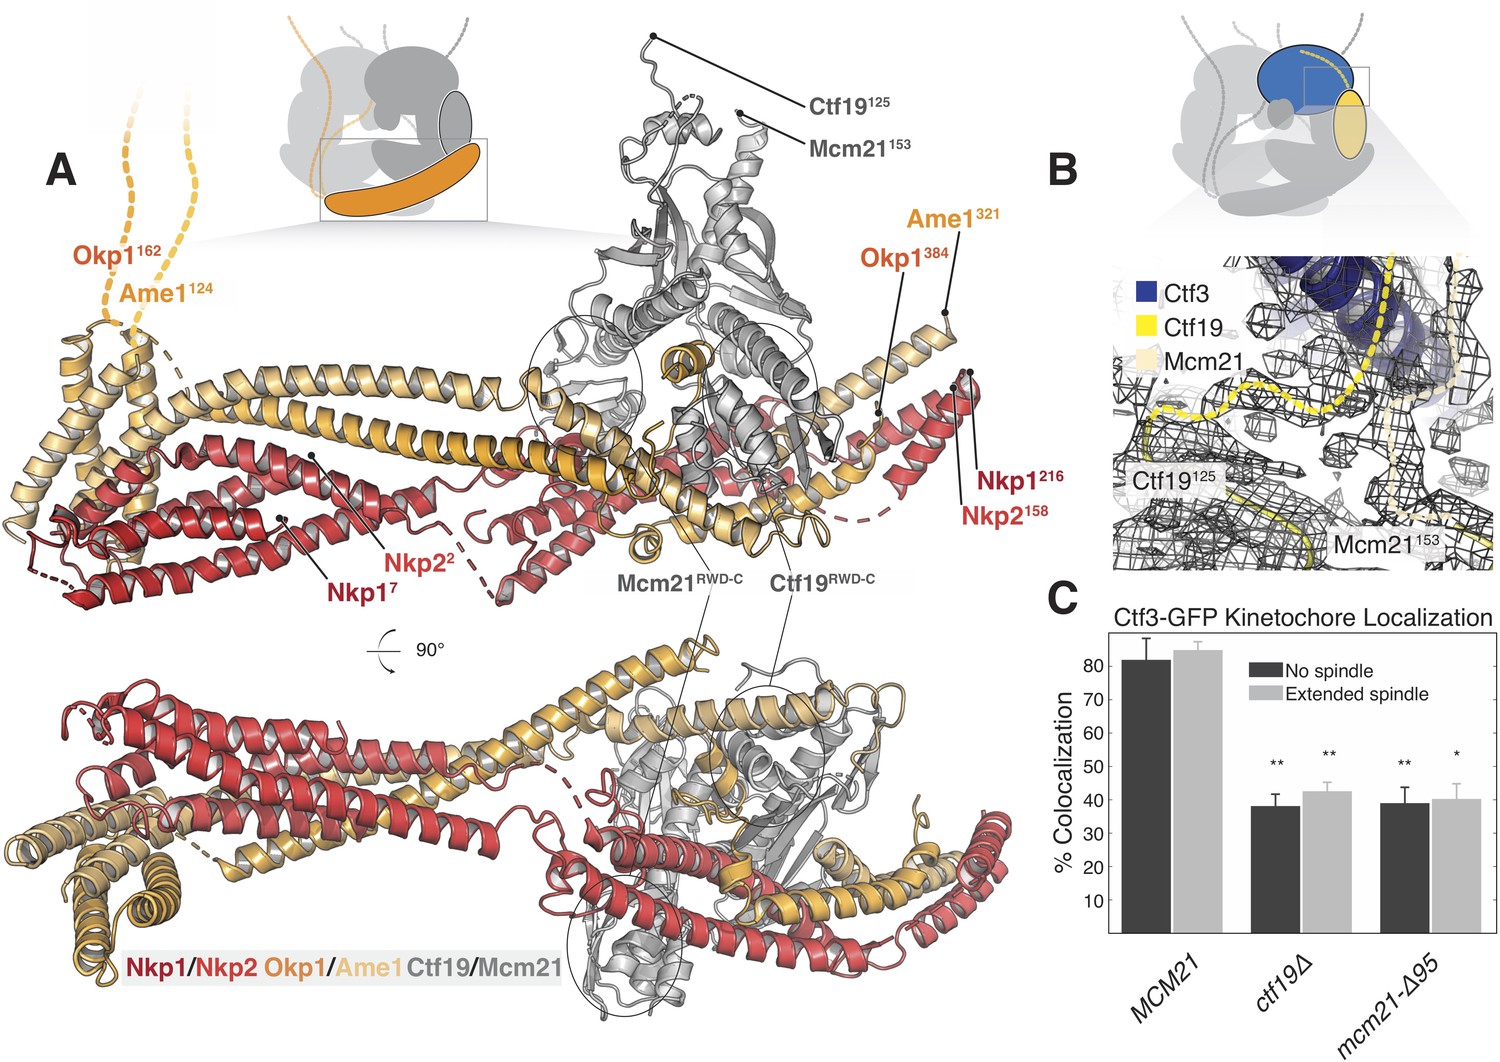
Structure of the COMA complex and implications for regulation and Ctf3 recruitment.
(A) Two views of the COMA complex. The Nkp1/2 complex is colored red, Ame1-Okp1 is orange, and Ctf19-Mcm22 is gray. (B) Density for the N-terminal extensions of Mcm21 and Ctf19. (C) The Mcm21 N-terminal extension is required for Ctf3 localization. Cells from the indicated strain backgrounds expressing Ctf3-GFP and Mtw1-mCherry were imaged during asynchronous growth, and Mtw1-mCherry foci were scored for colocalized Ctf3-GFP foci (* – p<.005, ** – p<0.001, Student’s t-test versus MCM21, two tails, unequal variance).
-
Figure 3—source data 1
This directory contains tracking data for Ctf3-GFP imaging experiments.
These data are plotted in Figure 3C and Figure 3—figure supplement 2B. A description of the files is contained within the directory.
- https://cdn.elifesciences.org/articles/44239/elife-44239-fig3-data1-v3.zip
Figure 3—figure supplement 1
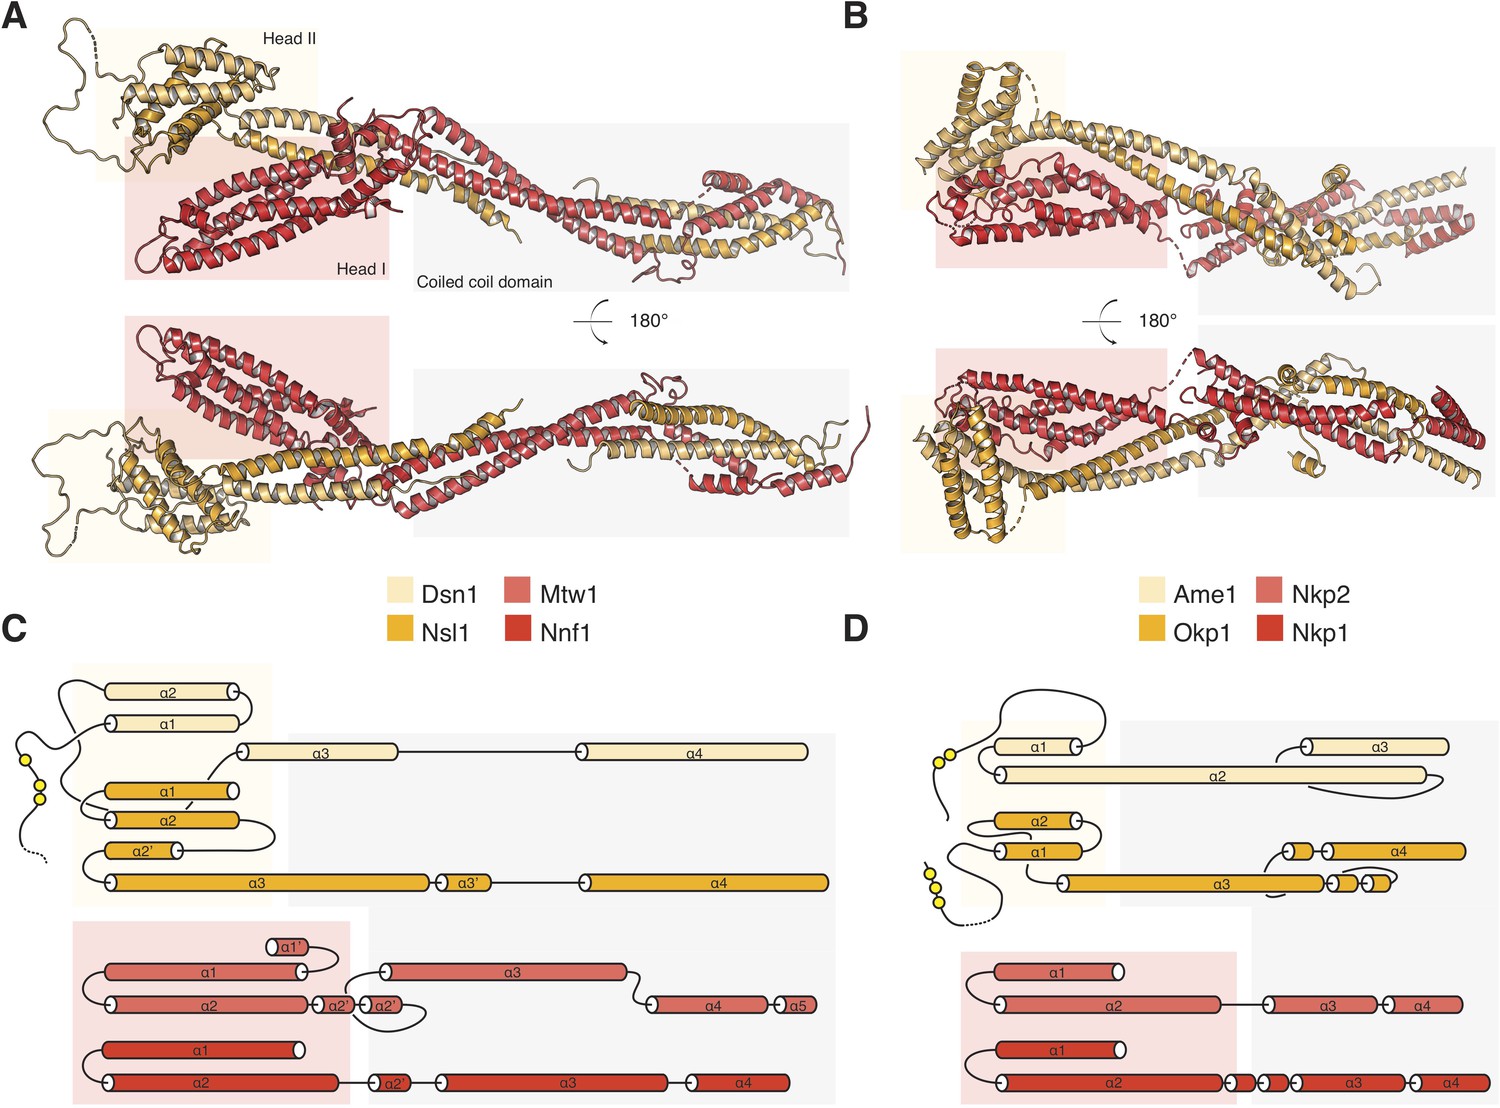
Comparison of MIND and COMA structures.
(A) Ribbon diagram of the MIND complex from K.lactis (PDB 5T58) in two orientations. Structural modules are shaded according to published definitions (Dimitrova et al., 2016). (B) Ribbon diagram of the S. cerevisiae COMA complex determined by cryo-EM. (C) Secondary structure diagram for the K. lactis mind complex. (D) Secondary structure diagram for the S. cerevisiae COMA complex.
Figure 3—figure supplement 2
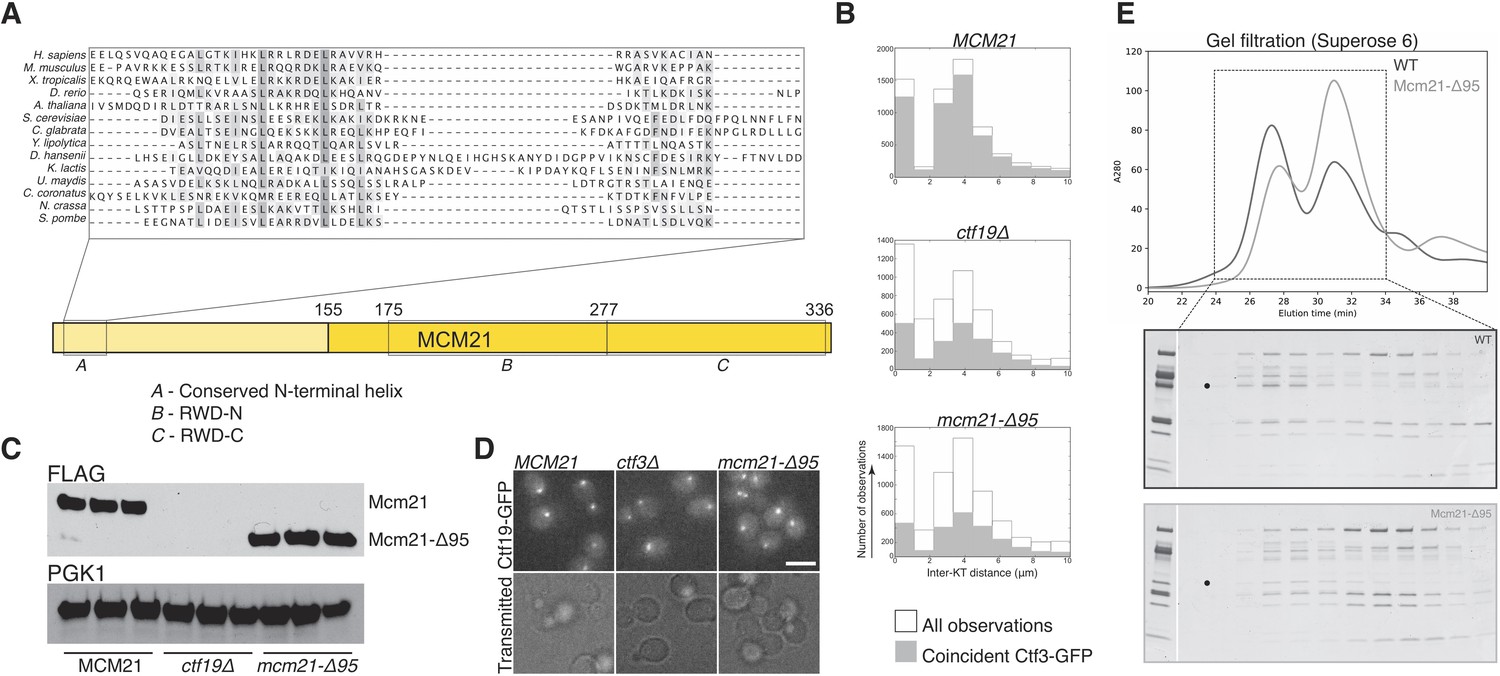
Analysis of Mcm21 and Okp1 N-terminal extensions.
(A) Diagram of Mcm21 and multiple sequence alignment showing conservation of its N-terminal region. S. cerevisiae amino acid residues 10–65 are shown and colored according to conservation score. (B) A single replicate from the Ctf3-GFP localization experiments shown in Figure 3C shows that Ctf3-GFP localization is perturbed throughout the cell cycle in the ctf19Δ and mcm21-Δ95 backgrounds. (C) Mcm21 and Mcm21-Δ95 expression levels are similar. Western blot analysis of Mcm21-3FLAG expression in three asynchronous cultures from the indicated strain backgrounds is shown. The strains were used for the imaging experiments in Figure 3C and panel B of this figure. (D) mcm21-Δ95 supports normal Ctf19-GFP localization. Cells from the indicated strain backgrounds were imaged during asynchronous cell division. (E) The N-terminal region of Mcm21 is required for efficient formation of the full Ctf19c. Gel filtration analysis of recombinant Ctf19c assemblies shows complex formation is less efficient with Mcm21-Δ95 in lieu of Mcm21-WT. Equivalent gel filtration fractions are shown. Mcm21 (WT or Δ95) is marked with a dot. Input is shown to the left of each gel image. For the Mcm21-Δ95 sample, less full Ctf19c survives separation, the assembled complex elutes later, and the majority of the Ctf3 protein (top band) is in the later peak (unassembled subcomplexes). Mcm21-Δ95 maintains its association with the fully assembled Ctf19c.
Figure 3—figure supplement 3
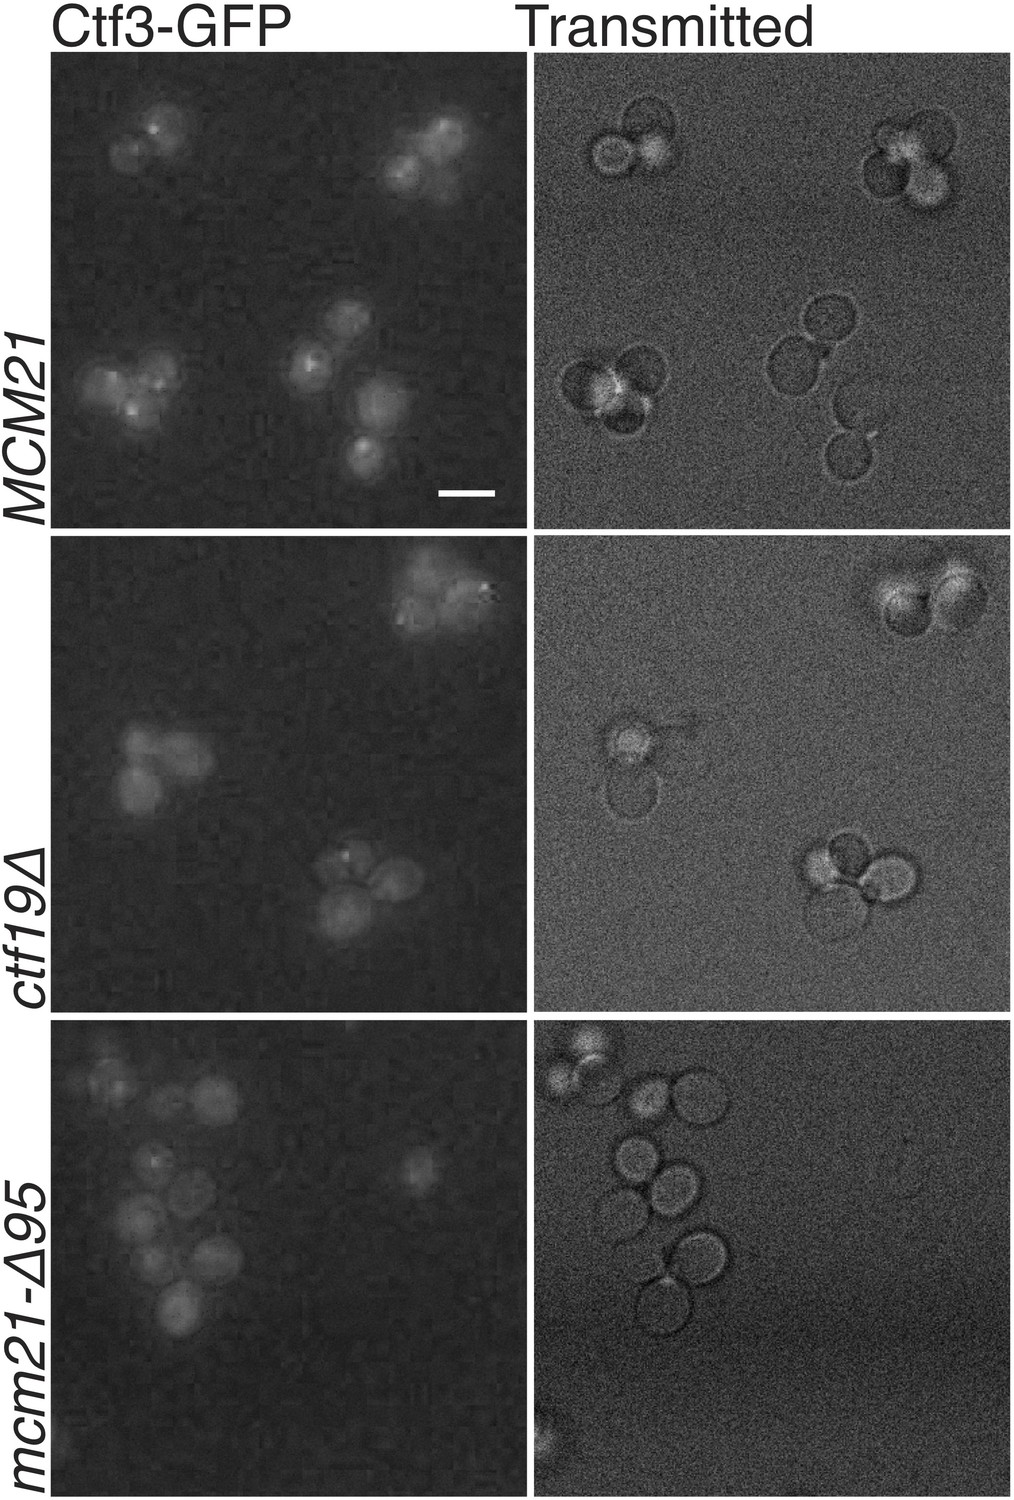
Fluorescence microscopy images of Ctf3-GFP-expressing cells.
Cells expressing Ctf3-GFP, Mtw1-mCherry, and indicated MCM21 or CTF19 allele were imaged during asynchronous growth. Representative z-projections for transmitted light and GFP fluorescence images are shown for each strain.
Figure 4
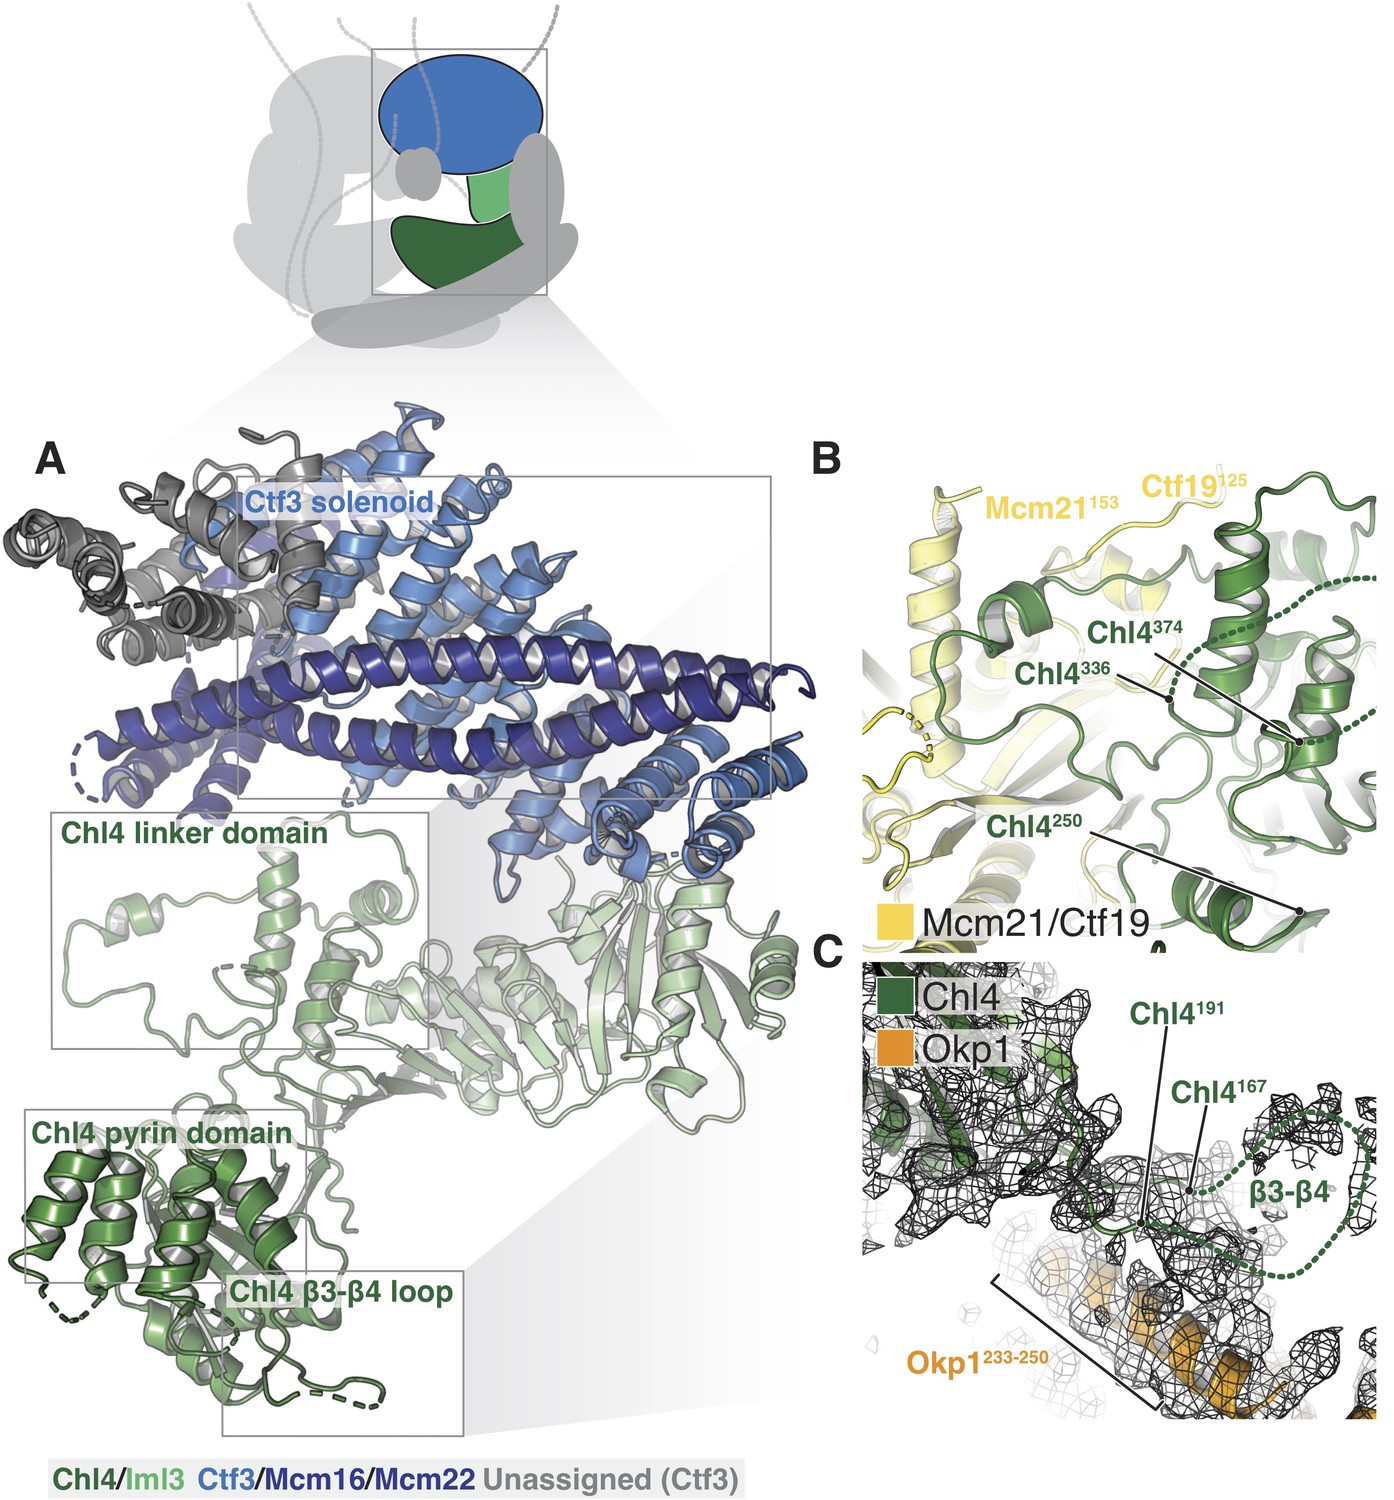
Structure of Chl4-Iml3 and the Ctf3c.
(A) Overview of the Chl4-Iml3 and Ctf3-Mcm16-Mcm22 complexes. Individual domains are indicated. The Chl4 pyrin domain resembles the human CENP-N pyrin domain (PDB 6EQT, Pentakota et al., 2017). (B) Close-up view of the interaction between the Chl4 linker domain and Ctf19-Mcm21. (C) Close-up view of the Chl4 β3-β4 loop with the corresponding map region shown.
Figure 5 with 1 supplement
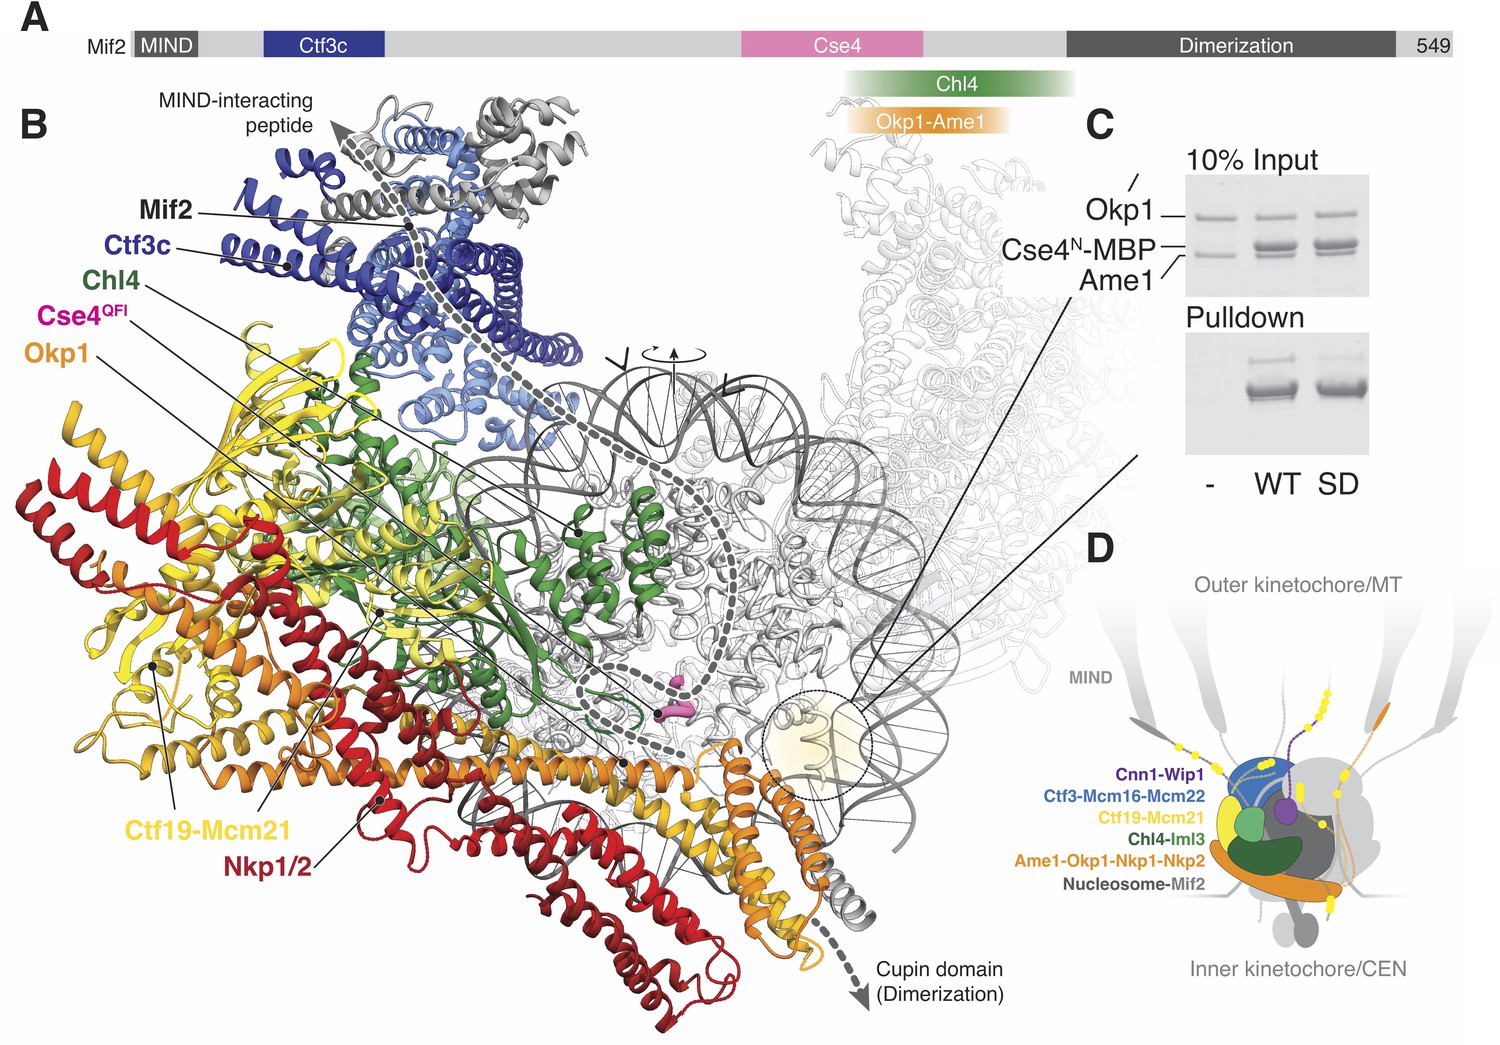
Implications for regulated Cse4 nucleosome recognition by the Ctf19c.
(A) Schematic of the Mif2 protein with segments that interact with other kinetochore proteins labeled and colored according to the model in panel B. (B) Model for a monomeric Ctf19c engaging the Cse4/CENP-A nucleosome (PDB 6C0W). The Ctf19c subunits are colored as indicated in Figure 2C. A second Ctf19c, in a position related by the twofold symmetry axis of the nucleosome, is shown with transparent ribbons. Mif2 is modeled as a dashed line that satisfies the interactions shown in panel A. Arrowheads above the modeled DNA indicate the approximate boundaries of CDEII according to the phasing of CEN3 DNA on a reconstituted Cse4 nucleosome particle (Xiao et al., 2017). (C) Ame1-Okp1 binds the Cse4 N-terminal extension. Cse41-50-MBP was incubated with Ame1-Okp1 before MBP pulldown with amylose resin (WT – Cse4WT; SD – Cse4S22D, S33D, S40D). (D) Model of the Ctf19c-Mif2-Cse4 nucleosome complex. Ctf19c proteins are colored as in Figure 2C. Approximate positions of phosphorylation sites are marked by yellow circles.
Figure 5—figure supplement 1
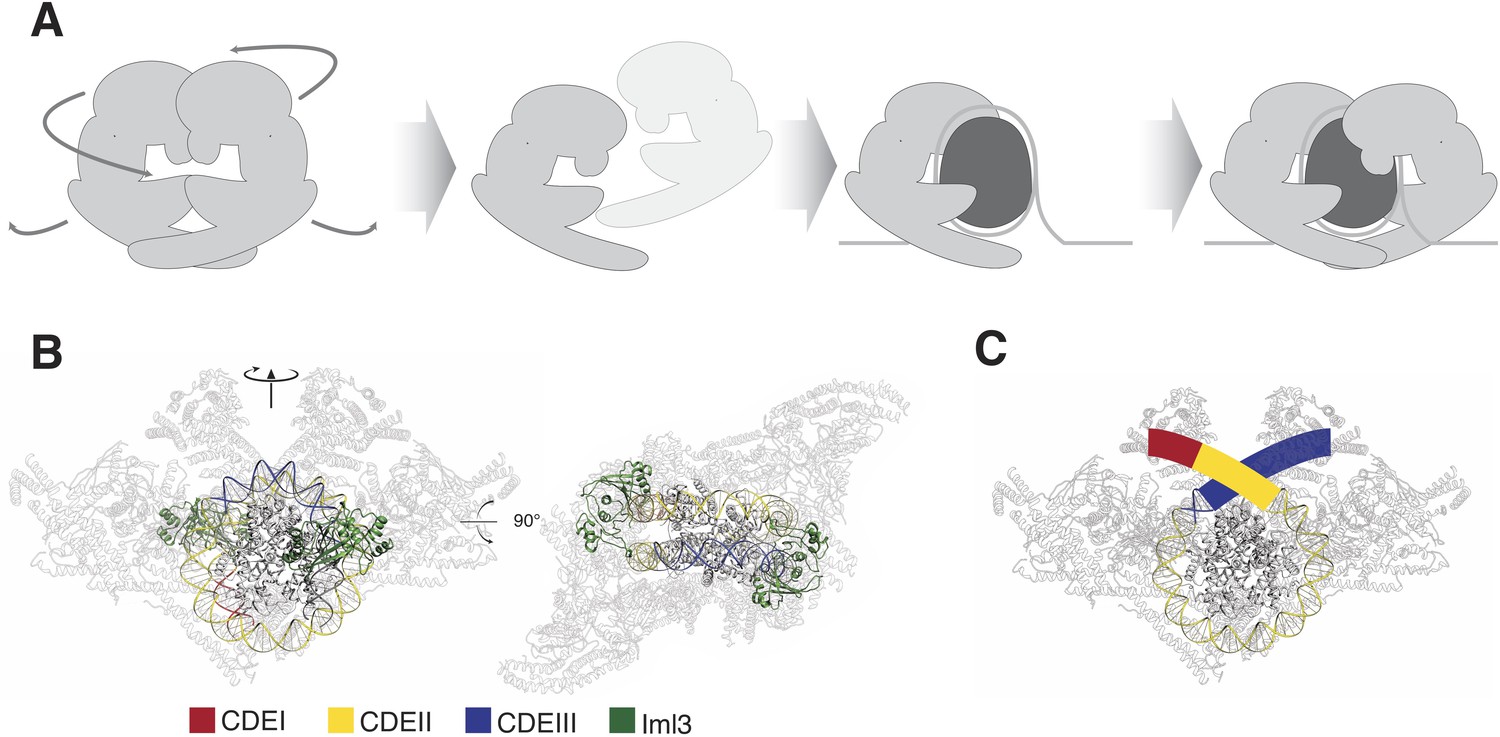
Schematic depicting rearrangements required for Ctf19c-nucleosome assembly.
(A) Procedure for assembling Ctf19c protomers on the Cse4/CENP-A nucleosome particle. The schematic shows the steps required for assembling the docked complex shown in Figure 5B. The cartoon shows a nearly canonical nucleosome particle and omits Mif2/CENP-C for clarity. (B) View of the Ctf19c-Cse4/CENP-A nucleosome complex with positions of CDEI, CDEII, and CDEIII colored according to published footprinting experiments (Xiao et al., 2017). Iml3, which clashes with centromeric DNA as it exits the nucleosome in this model, is colored green. Other Ctf19c proteins are transparent. (C) Schematic showing Ctf19c recognition of a partially unwrapped nucleosome particle. As in panel B, Ctf19c proteins are transparent.
Tables
Table 1
Ctf19c/CCAN proteins.
| Complex | H. sapiens | S. cerevisiae | S. pombe |
|---|---|---|---|
| Nucleosome | CENP-A | Cse4 | cnp1 |
| CENP-C | Mif2 | cnp3 | |
| CENP-N/Chl4 | CENP-N | Chl4 | mis15 |
| CENP-L | Iml3 | fta1 | |
| CENP-I/Ctf3 | CENP-I | Ctf3 | mis6 |
| CENP-H | Mcm16 | fta3 | |
| CENP-K | Mcm22 | sim4 | |
| CENP-M | |||
| COMA | CENP-O | Mcm21 | mal2 |
| CENP-P | Ctf19 | fta2 | |
| CENP-Q | Okp1 | fta7 | |
| CENP-U | Ame1 | mis17 | |
| CENP-R | |||
| CENP-T/Cnn1 | CENP-T | Cnn1 | cnp20 |
| CENP-W | Wip1 | wip1 | |
| Nkp1/2 | Nkp1 | fta4 | |
| Nkp2 | cnl2 |
Key resources table
| Reagent type (species) or resource | Designation | Source or reference | Identifiers | Additional information |
|---|---|---|---|---|
| Gene (S. cerevisiae) | See Supplementary file 3 | |||
| Strain, strain background (S. cerevisiae) | S288c | |||
| Genetic reagent (S. cerevisiae) | See Supplementary file 3 | |||
| Antibody | anti-FLAG-HRP (mouse monoclonal) | Sigma | A8592 | (1:1000) |
| Antibody | anti-PGK1 (mouse monoclonal) | Invitrogen | 459250 | (1:5000) |
| Antibody | goat anti-mouse-IgG-HRP (rabbit polyclonal) | Abcam | Ab97046 | (1:10000) |
| Recombinant DNA reagent | See Supplementary file 4 | |||
| Cell line (T. ni) | High Five cells; Trichoplusia ni | ThermoFisher | B85502 | Harrison lab stock |
| Cell line (E. coli) | Rosetta 2(DE3)pLysS; E. coli | EMD Millipore | 71403 | Harrison lab stock |
| Chemical compound, drug | Glutaraldehyde | Sigma | G4004 | |
| Software, algorithm | UCSF Image4 | Li et al., 2015 | ||
| Software, algorithm | SerialEM | Mastronarde, 2005 | ||
| Software, algorithm | MotionCor2 (v1.1.0) | Zheng et al., 2017 | ||
| Software, algorithm | CTFFIND4 (v4.1.8) | Rohou and Grigorieff, 2015 | ||
| Software, algorithm | Relion (v2.1) | Kimanius et al., 2016 | ||
| Software, algorithm | Eman2 (v2.22); e2initialmodel.py | Tang et al., 2007 | ||
| Software, algorithm | ResMap (v1.1.4) | Kucukelbir et al., 2014 | ||
| Software, algorithm | PyMol (v2.1.0) | Schrödinger, LLC | ||
| oftware, algorithm | Chimera (v1.11.2) | Pettersen et al., 2004 | ||
| Software, algorithm | Coot (v0.8.8) | Emsley et al., 2010 | ||
| Software, algorithm | Phenix (v1.13) | Afonine et al., 2018 | ||
| Software, algorithm | TrackMate (v3.0.0) | Tinevez et al., 2017 | ||
| Software, algorithm | MAFFT | Katoh et al., 2017 | ||
| Software, algorithm | JalView | Waterhouse et al., 2009 | ||
| Software, algorithm | Phyre2 | Kelley et al., 2015 | ||
| Software, algorithm | Fiji | Schindelin et al., 2012 | ||
| Software, algorithm | python 2.7.2 | www.python.org | ||
| Other | C-flat | Electron Microscopy Sciences | CF-1.2/1.3–3C | holey carbon grids |
Additional files
-
Supplementary file 1
Data and model statistics.
Tables describing cryo-EM data collection and molecular modeling.
- https://cdn.elifesciences.org/articles/44239/elife-44239-supp1-v3.docx
-
Supplementary file 2
Summary of the refined model.
Table describing the Ctf19c model. Each subunit is listed along with the number and identities of amino acid residues modeled.
- https://cdn.elifesciences.org/articles/44239/elife-44239-supp2-v3.docx
-
Supplementary file 3
Yeast strains used in this study (all strains built in the S288C background).
Genotypes and names of yeast strains used in this study.
- https://cdn.elifesciences.org/articles/44239/elife-44239-supp3-v3.docx
-
Supplementary file 4
Protein expression constructs used in this study.
Protein expression constructs for Ctf19c subunits are listed.
- https://cdn.elifesciences.org/articles/44239/elife-44239-supp4-v3.docx
-
Transparent reporting form
- https://cdn.elifesciences.org/articles/44239/elife-44239-transrepform-v3.docx
Download links
A two-part list of links to download the article, or parts of the article, in various formats.
Downloads (link to download the article as PDF)
Open citations (links to open the citations from this article in various online reference manager services)
Cite this article (links to download the citations from this article in formats compatible with various reference manager tools)
The structure of the Ctf19c/CCAN from budding yeast
eLife 8:e44239.
https://doi.org/10.7554/eLife.44239


