The C-terminal helix 9 motif in rat cannabinoid receptor type 1 regulates axonal trafficking and surface expression
- University of Bristol, United Kingdom
Figures
Figure 1
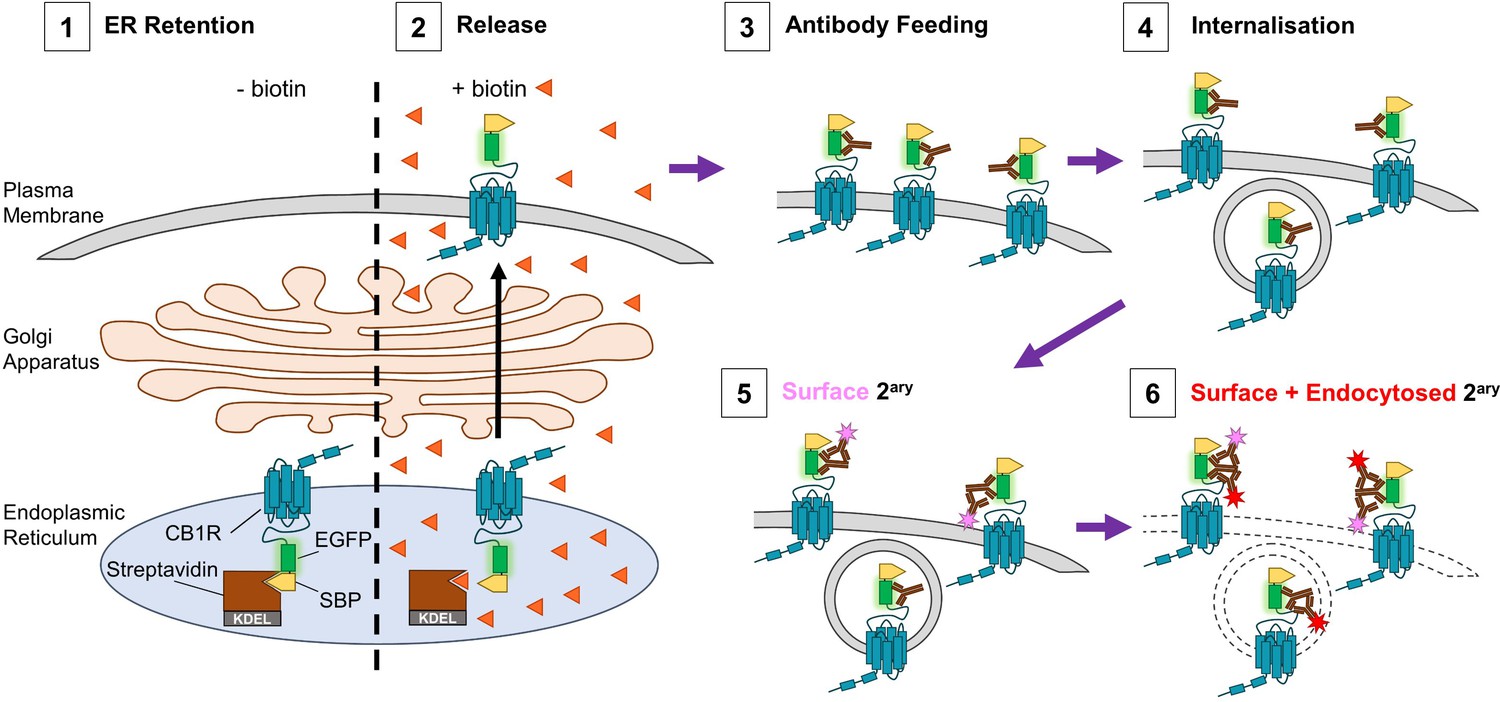
Schematic of RUSH assay and antibody feeding protocol.
(1) Before the addition of biotin, SBP-EGFP-CB1R is retained in the ER by a streptavidin-KDEL hook (0 min). (2) Addition of biotin (orange triangles) releases the receptor and it begins to accumulate at the surface. (3) Antibody feeding with anti-GFP antibodies during biotin-mediated release labels newly delivered, surface expressed SBP-EGFP-CB1R. (4) A proportion of receptors internalise, still bound to primary antibody. (5) Cells are cooled to 4°C to prevent further internalisation. Live secondary antibody incubation labels retained surface receptors (indicated by magenta star). (6) After fixation and permeabilization, incubation with a different secondary antibody labels all receptors delivered to the surface during the time course of the experiment (red star = surface + endocytosed).
Figure 2
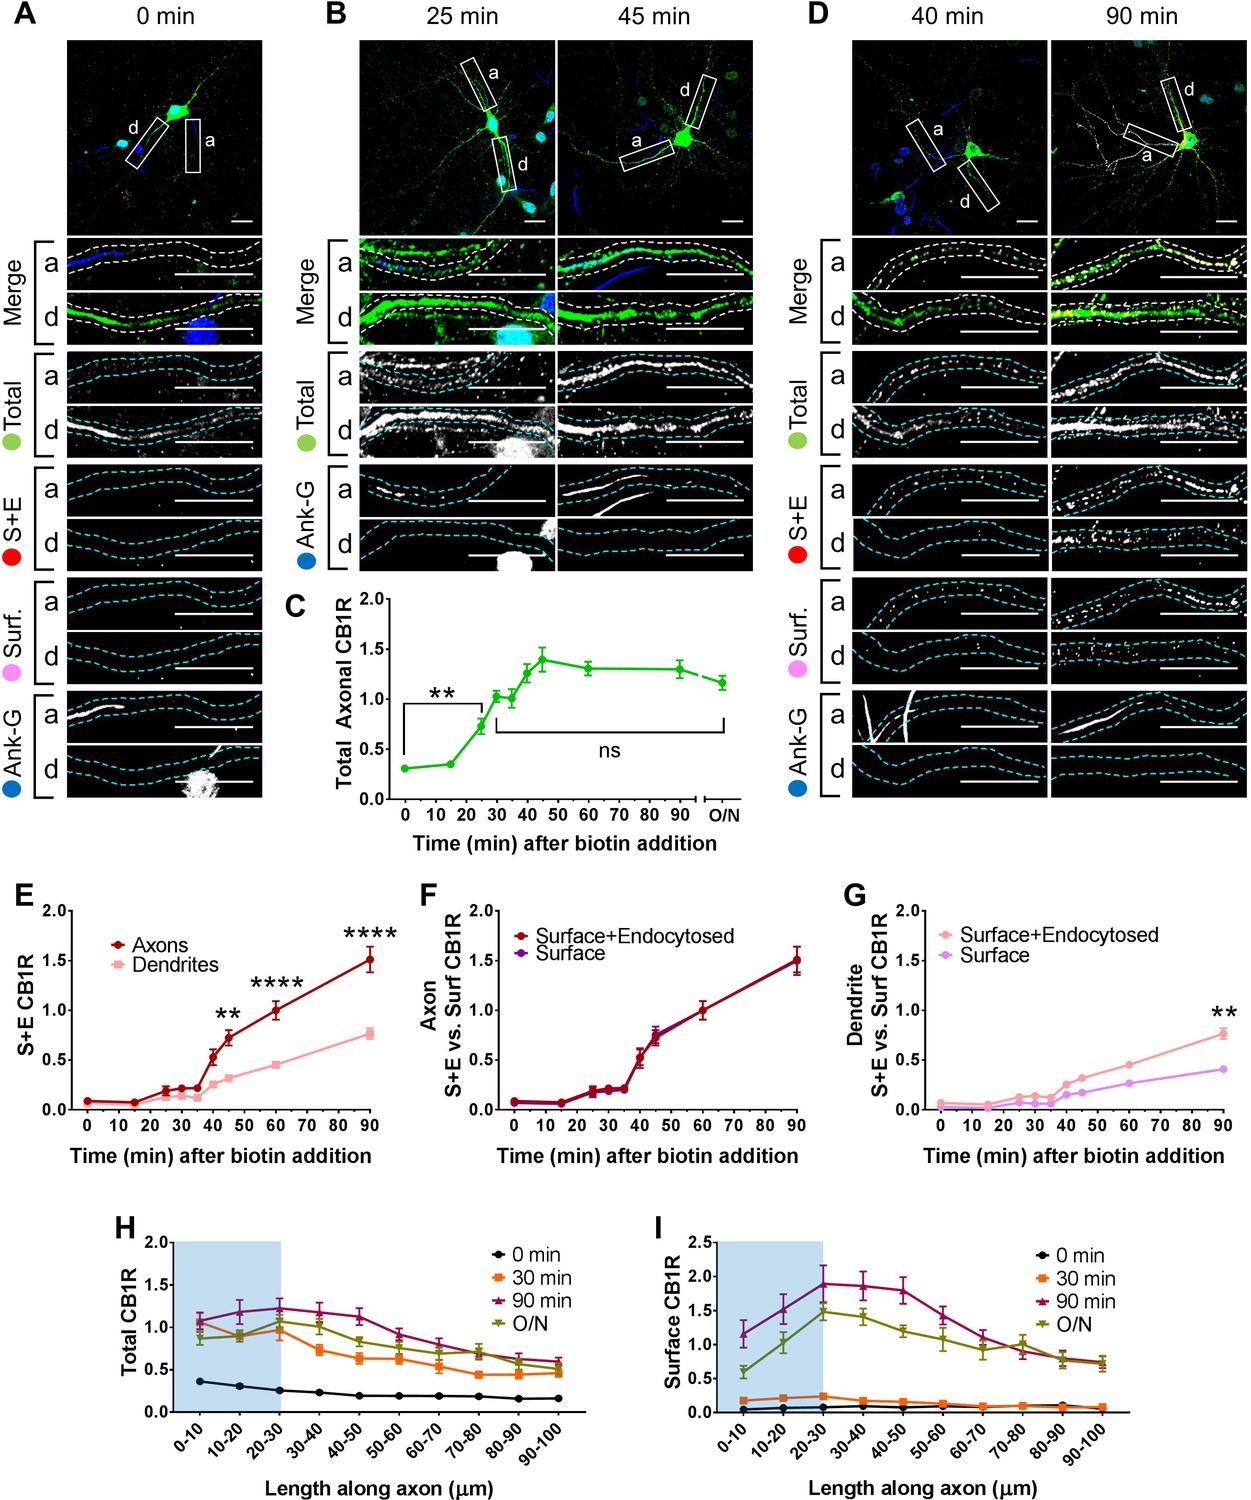
Newly synthesized CB1Rs are preferentially delivered to, and retained at, the axonal membrane to establish surface polarisation.
The trafficking of SBP-EGFP-CB1R following release with biotin was monitored after 0 (no biotin), 15, 25, 30, 35, 40, 45, 60, 90 min, and overnight (O/N; non-retained control) in DIV 13 hippocampal neurons. Upper panels for each condition show whole cell field of view and lower panels are enlargements of axonal (a) and dendritic (d) ROIs. Green = total; red = surface + endocytosed; magenta = surface; blue = axon marker (Ankyrin-G). In all images the scale bar = 20 µm. (A) Representative image of a hippocampal neuron expressing the RUSH construct SBP-EGFP-CB1R without biotin (0 min). SBP-EGFP-CB1R is anchored in the ER of the somatodendritic compartment and is not detected in the proximal 50 µm of axons or on the surface of dendrites. Merge: green = total; blue = Ankyrin G; red = surface + endocytosed; magenta = surface. (B) Representative confocal images of total SBP-EGFP-CB1R expressed in DIV 13 hippocampal neurons 25 min and 45 min after biotin release from the ER showing that SBP-EGFP-CB1R has entered the proximal axonal compartment (initial 50 µm). Merge: green = total; blue = Ankyrin G. (C) Quantification of data represented in (A and B). SBP-EGFP-CB1R was initially absent from the axon but entered after 25 min and continued to accumulate until it plateaued after 45 min to a level comparable to a non-retained control (O/N). One-way ANOVA with Tukey’s post hoc test. N = three to six independent experiments, n = 19–45 neurons per condition. 0 min vs. 25 min: mean ± SEM, 0.307 ± 0.0173 vs. 0.729 ± 0.0772; N = 6, n = 45 vs. N = 3, n = 19; **p = 0.0018. 30 min vs. ON: mean ± SEM, 1.03 ± 0.0597 vs. 1.2 ± 0.0632; N = 4, n = 32 vs. N = 4, n = 24, nsp = 0.8186. (D) Representative confocal images of total and surface expressed SBP-EGFP-CB1R in DIV 13 hippocampal neurons 40 min and 90 min after biotin-mediated release showing that SBP-EGFP-CB1R is preferentially delivered to, and retained at, the axonal surface. Merge: surface to total seen as white; endocytosed to total seen as yellow. (E) Quantification of data represented in (D). SBP-EGFP-CB1R reached the proximal surface of the axon 40 min after release and the surface of dendrites 60 min after release. Furthermore, significantly more SBP-EGFP-CB1R reached the axonal versus dendritic surface at 45, 60, and 90 min. 45 min, Axons vs. Dendrites: mean ± SEM, 0.723 ± 0.077 vs. 0.319 ± 0.035; N = 3, n = 20 vs. N = 3, n = 20; **p = 0.0054. 60 min, Axons vs. Dendrites: mean ± SEM, 1.00 ± 0.093 vs. 0.452 ± 0.023; N = 6, n = 46 vs. N = 6, n = 46; ****p < 0.0001. 90 min, Axons vs. Dendrites: mean ± SEM, 1.511 ± 0.129 vs. 0.566 ± 0.054; N = 4, n = 26 vs. N = 4, n = 26; ****p < 0.0001. (F) Quantification of data represented in (D). Comparison between surface + endocytosed (red; see E) and surface (magenta) curves show that SBP-EGFP-CB1R was retained on the surface of axons. (For all p > 0.9999). (G) Quantification of data represented in (D). Comparison between surface + endocytosed (pale red; see (E) and surface (pale magenta) curves show that SBP-EGFP-CB1R was internalised from the surface of dendrites. 90 min, SE vs. S: mean ± SEM, 0.766 ± 0.054 vs. 0.408 ± 0.038; N = 4, n = 26 vs. N = 4, n = 26; **p = 0.0046. Statistical analyses in (E-G); Two-way ANOVA with Tukey’s post hoc test (all analysed and corrected for multiple comparisons together). Three to six independent experiments, n = 19–45 neurons per condition. (H) Distribution of total CB1R along the first 100 µm of the axon indicates that CB1R is trafficked within the axon. By 30 min after release from the ER, and before CB1R reaches the surface, CB1R is present at least 100 µm away from the soma at levels comparable to an unretained control (O/N). The blue shaded portion indicates the location of the AIS (defined by Ankyrin-G immunostaining). Two-way ANOVA with Sidak’s post hoc test. Four to six independent experiments, n = 12–18. 90–100 µm, 0 vs. 30 min: mean ± SEM, 0.163 ± 0.014 vs. 0.452 ± 0.045; N = 6, n = 12 vs. N = 4, n = 18; *p = 0.0243. 90–100 µm, 30 min vs. O/N: mean ± SEM, 0.452 ± 0.045 vs. 0.511 ± 0.066; N = 4, n = 18 vs. N = 4, n = 15; nsp = 0.905. (I) Distribution of surface expressed CB1R along the first 100 µm of the axon shows an accumulation of CB1R at the distal region of the AIS 90 min after release from the ER. This accumulation in the AIS is reduced in the O/N unretained control consistent with lateral diffusion within the membrane. Two-way ANOVA with Sidak’s post hoc test. Four to six independent experiments, n = 12–18. 0–50 µm, 90 min vs. O/N: All points p ≤ 0.0285. 50–100 µm, 90 min vs. O/N: All points p ≥ 0.0878.
Figure 3
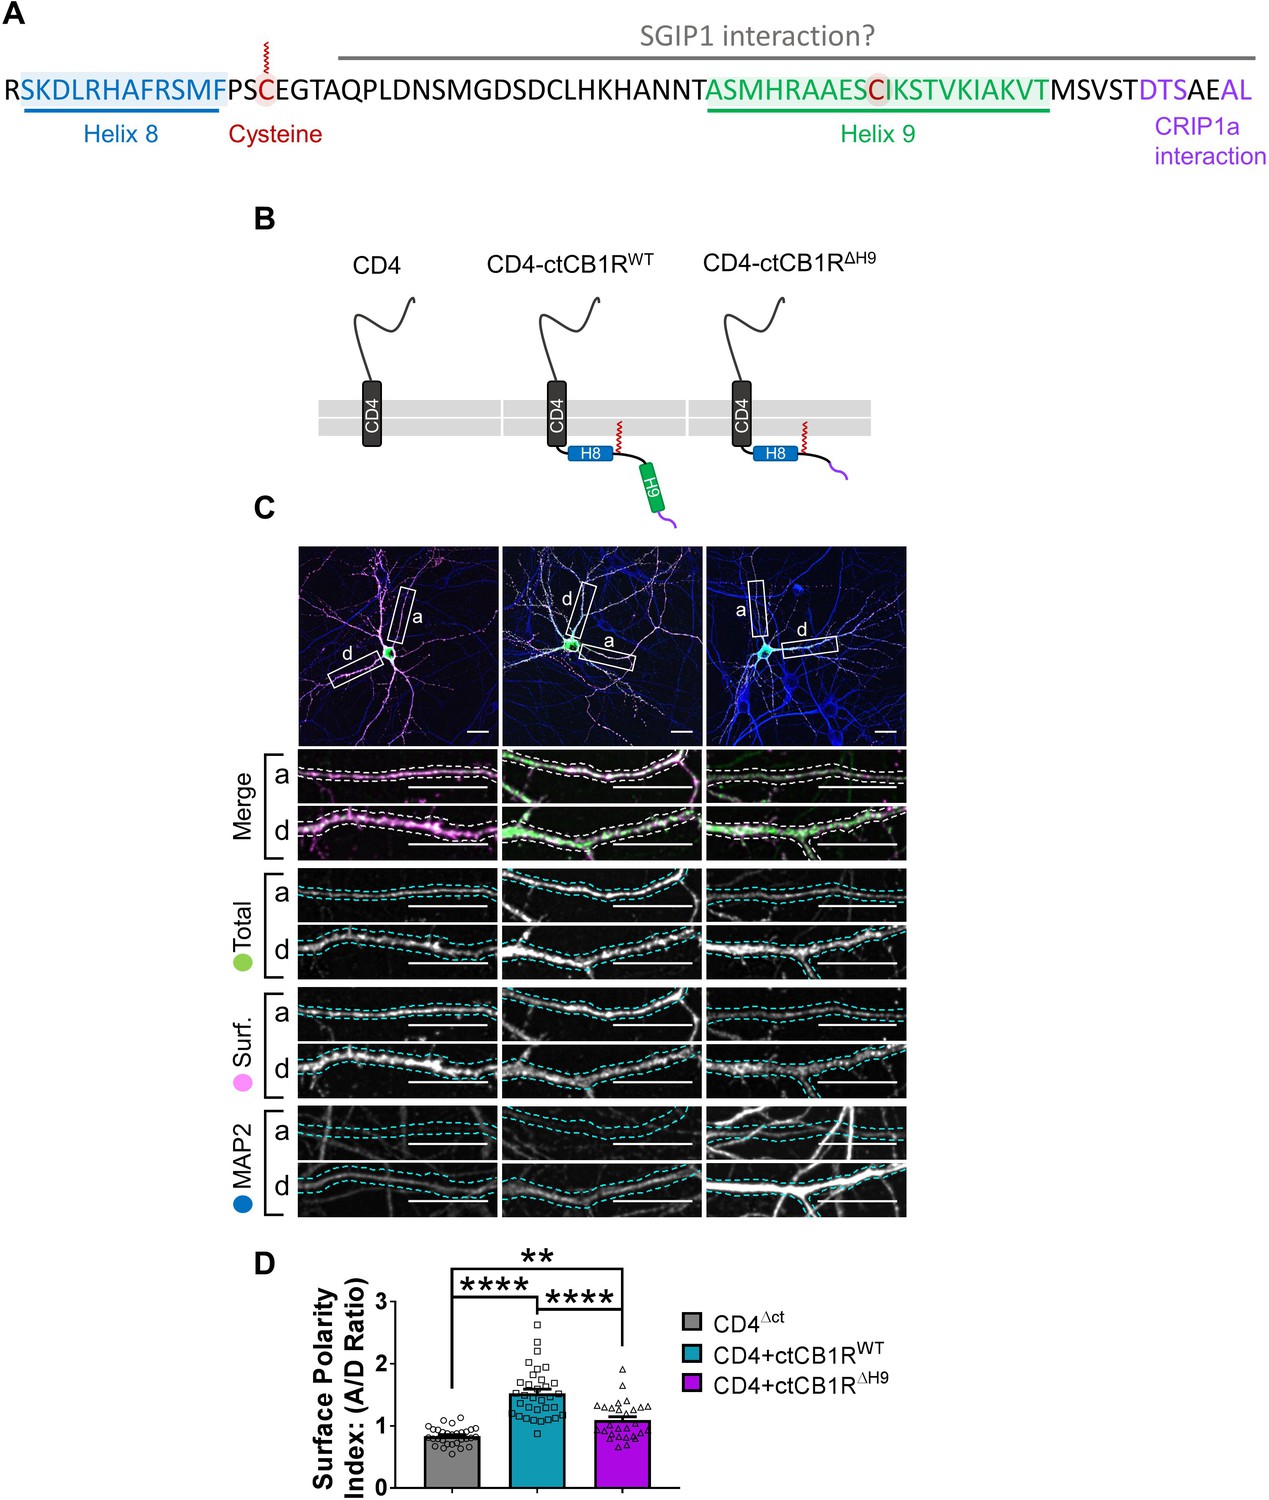
The C-terminal domain of CB1R, especially the Helix 9 motif, plays a role in axonal surface polarisation.
(A) Amino acid sequence of the C-terminus of rat CB1R highlighting helical motifs (Helix 8 and Helix 9) predicted from NMR spectroscopy and computational modelling. The proposed interaction domains of CRIP1a and SGIP1, and the palmitoylated cysteine residue involved in membrane association and G-protein coupling, are also indicated. A potentially post-translationally modified cysteine in H9 is highlighted. (B) Schematic of the CD4-ctCB1R chimeric proteins used. (C) Representative confocal images of hippocampal neurons showing the distribution of expressed CD4 (left), CD4-ctCB1RWT (middle), or CD4-ctCB1RΔH9 (right). Upper panels for each condition show a whole cell field of view and lower panels are enlargements of axonal (a) and dendritic (d) ROIs. Green = total; magenta = surface; blue = dendrite marker (MAP2). Merge: surface to total seen as white. Scale bar = 20 µm. (D) Quantification of data represented in (C) presented as the surface polarity index (A/D ratio). CD4-ctCB1RWT strongly favoured the axonal compartment compared to CD4 alone. CD4-ctCB1RΔH9 favoured the axonal compartment significantly less than CD4-ctCB1RWT. One-way ANOVA with Tukey’s post hoc test. N = three independent experiments; n = 28–33 neurons per condition. CD4 vs. WT: mean ± SEM, 0.834 ± 0.0255 vs. 1.52 ± 0.0696; N = 3, n = 30 vs. N = 3, n = 33; ****p < 0.0001. CD4 vs. ΔH9: mean ± SEM, 0.834 ± 0.0255 vs. 1.09 ± 0.0562; N = 3, n = 30 vs. N = 3, n = 28; **p = 0.0050. WT vs. ΔH9: mean ± SEM, 1.52 ± 0.0696 vs. 1.09 ± 0.0562; N = 3, n = 33 vs. N = 3, n = 28; ****p < 0.0001.
Figure 4

The C-terminal domain of CB1R plays a role in internalisation in dendrites independent of H9.
(A) Representative confocal images of DIV 14 primary hippocampal neurons expressing CD4ΔCT (left), CD4-ctCB1RWT (middle), or CD4-ctCB1RΔH9 (right). Neurons were subjected to 2 hr of antibody feeding followed by stripping of surface antibody to reveal the endocytosed pool of receptors. Upper panels for each condition show a whole cell field of view and lower panels are enlargements of axonal (a) and dendritic (d) ROIs. Green = total; red = endocytosed; blue = dendritic marker (MAP2). Merge: endocytosed to total seen as yellow. Scale bar = 20 µm. (B) Quantification of data presented in (A). Both CD4-ctCB1RWT and CD4-ctCB1RΔH9 were significantly more internalised in dendrites, but not in axons, than CD4 alone. Three independent experiments; n = 24–26 neurons per condition. Two way ANOVA with Sidak’s post hoc test. Axons, CD4 vs. WT vs. ΔH9: mean ± SEM, 1.00 ± 0.040 vs. 1.065 ± 0.039 vs. 1.148 ± 0.048; N = 3, n = 24 vs. N = 3, n = 26 vs. N = 3, n = 24; nsp ≥ 0.3514. Dendrites, CD4 vs. WT: mean ± SEM, 1.042 ± 0.038 vs. 1.250 ± 0.051; N = 3, n = 24 vs. N = 3, n = 26; *p = 0.0279. Dendrites, CD4 vs. ΔH9: mean ± SEM, 1.042 ± 0.038 vs. 1.355 ± 0.060; N = 3, n = 24 vs. N = 3, n = 24; *p < 0.0001. Dendrites, WT vs. ΔH9: mean ± SEM, 1.250 ± 0.051 vs. 1.355 ± 0.060; N = 3, n = 26 vs. N = 3, n = 24; nsp = 0.8275.
Figure 5
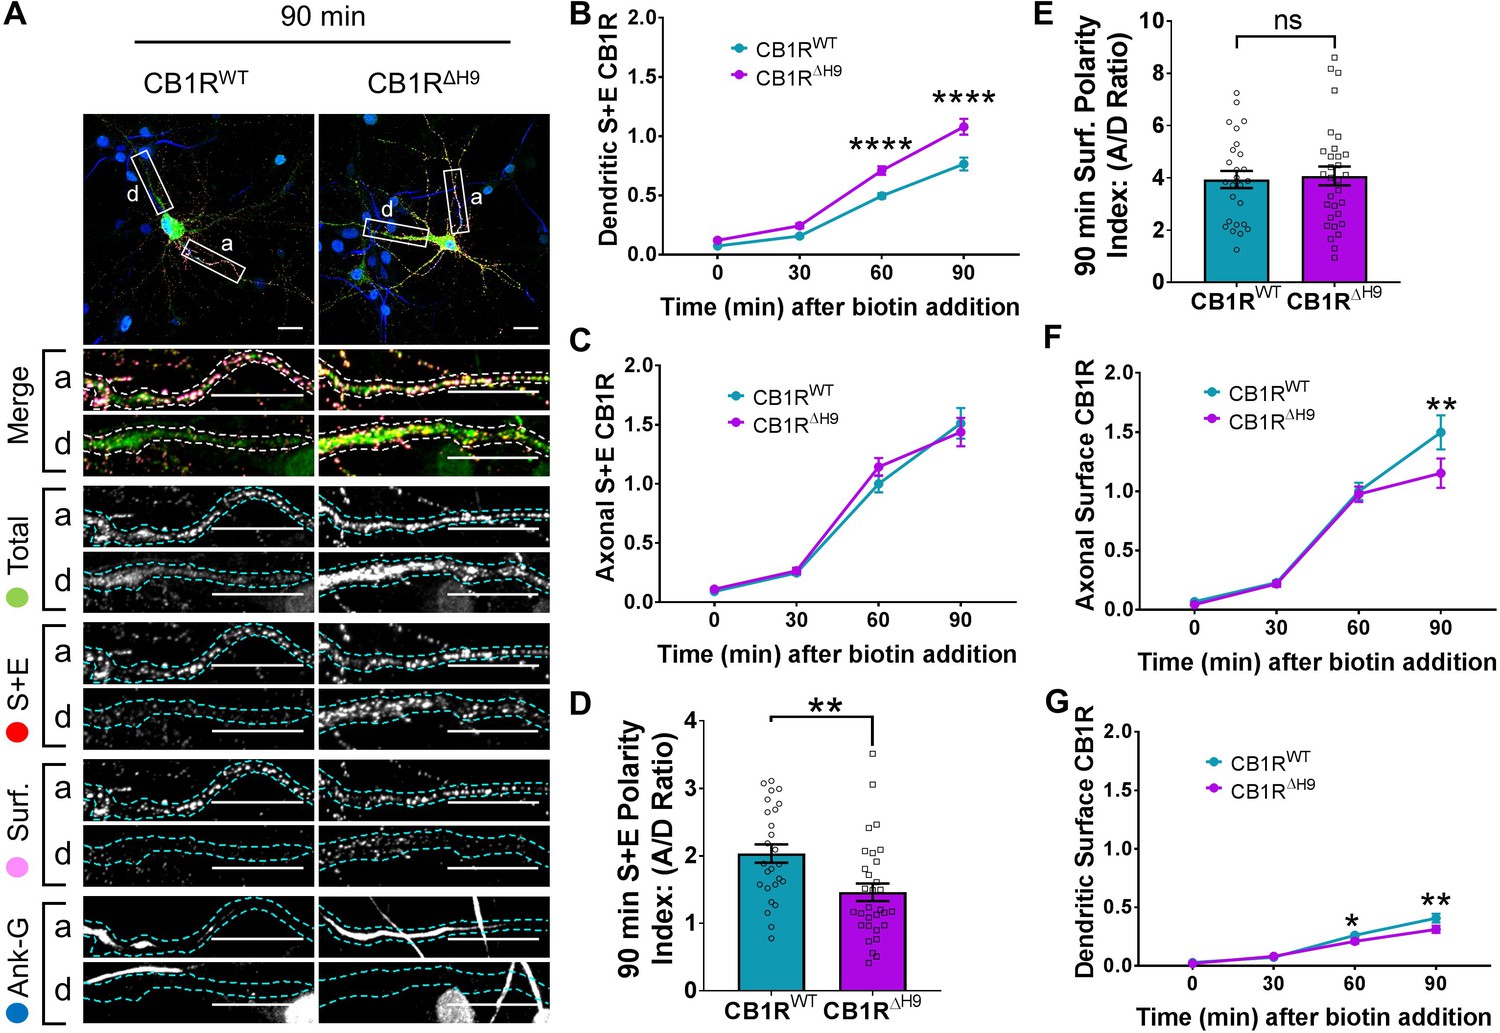
H9 both restricts delivery of CB1R to the dendritic membrane and plays a role in surface retention of CB1R.
The trafficking of RUSH SBP-EGFP-CB1R following release with biotin was monitored after 0 (no biotin), 30, 60, and 90 min in DIV 13 hippocampal neurons. (A) Representative confocal images of hippocampal neurons expressing SBP-EGFP-CB1RWT or SBP-EGFP-CB1RΔH9 90 min after release with biotin. Upper panels for each condition show whole cell field of view and lower panels are enlargements of axonal (a) and dendritic (d) ROIs. Green = total; red = surface + endocytosed; magenta = surface; blue = axon marker (Ankyrin-G). Merge: surface to total seen as white; endocytosed to total seen as yellow. Scale bar = 20 µm. (B) Quantification of data represented in (A). Time-resolved analysis of surface + endocytosed receptors shows significantly more SBP-EGFP-CB1RΔH9 reaches the surface of dendrites than SBP-EGFP-CB1RWT, indicating that H9 may play a role in restricting delivery to the dendritic surface. Two-way ANOVA with Sidak’s post hoc test. Three to seven independent experiments, n = 26–63 neurons per condition. 60 min, WT vs. ΔH9: mean ± SEM, 0.497 ± 0.022 vs. 0.711 ± 0.036; N = 8, n = 63 vs. N = 8, n = 48; ****p < 0.0001. 90 min, WT vs. ΔH9: mean ± SEM, 0.766 ± 0.054 vs. 1.08 ± 0.066; N = 4, n = 26 vs. N = 4, n = 31; ****p < 0.0001. C) Quantification of data represented in (A). Time-resolved analysis of surface + endocytosed receptors shows no difference between SBP-EGFP-CB1RWT and SBP-EGFP-CB1ΔH9 in reaching the surface of the axon. Two-way ANOVA with Sidak’s post hoc test. N = three to seven independent experiments, n = 26–63 neurons per condition. 0, 30, 60, 90 min, WT vs. ΔH9: p > 0.2459. (D) Quantification of data represented in (A). Analysis of surface + endocytosed polarity demonstrates a defect in polarised delivery of SBP-EGFP-CB1RΔH9 compared to SBP-EGFP-CB1RWT. Unpaired t-test. N = four independent experiments, n = 26–31 neurons per condition. WT vs. ΔH9: mean ± SEM, 2.03 ± 0.136 vs. 1.46 ± 0.13; N = 4, n = 26 vs. N = 4, n = 31; **p = 0.0038. (E) Quantification of data represented in (A). Analysis of surface polarity revealed no difference between SBP-EGFP-CB1RWT and SBP-EGFP-CB1ΔH9. Unpaired t-test. N = four independent experiments, n = 26–31 neurons per condition. WT vs. ΔH9: mean ± SEM, 3.935 ± 0.329 vs. 4.075 ± 0.361; N = 4, n = 26 vs. N = 4, n = 31; nsp = 0.7797. (F) Quantification of data represented in (A). Time-resolved analysis of surface receptors shows significantly less SBP-EGFP-CB1ΔH9 than SBP-EGFP-CB1RWT on the surface of axons 90 min after release, most likely due to increased endocytosis of the ΔH9 mutant. Two-way ANOVA with Sidak’s post hoc test. N = three to eight independent experiments, n = 26–63 neurons per condition. 90, WT vs. ΔH9: mean ± SEM, 1.498 ± 0.144 vs. 1.154 ± 0.123; N = 4, n = 26 vs. N = 4, n = 31; **p = 0.0066. (G) Quantification of data represented in (A). Time-resolved analysis of surface receptors shows significantly less SBP-EGFP-CB1ΔH9 than SBP-EGFP-CB1RWT on the surface of dendrites 60 and 90 min after release, most likely due to increased endocytosis. Two-way ANOVA with Sidak’s post hoc test. N = three to eight independent experiments, n = 26–63 neurons per condition. 60, WT vs. ΔH9: mean ± SEM, 0.262 ± 0.013 vs. 0.21 ± 0.018; N = 8, n = 63 vs. N = 8, n = 48; *p = 0.0232. 90, WT vs. ΔH9: mean ± SEM, 0.408 ± 0.038 vs. 0.312 ± 0.030; N = 4, n = 26 vs. N = 4, n = 31; **p = 0.0011.
Figure 6
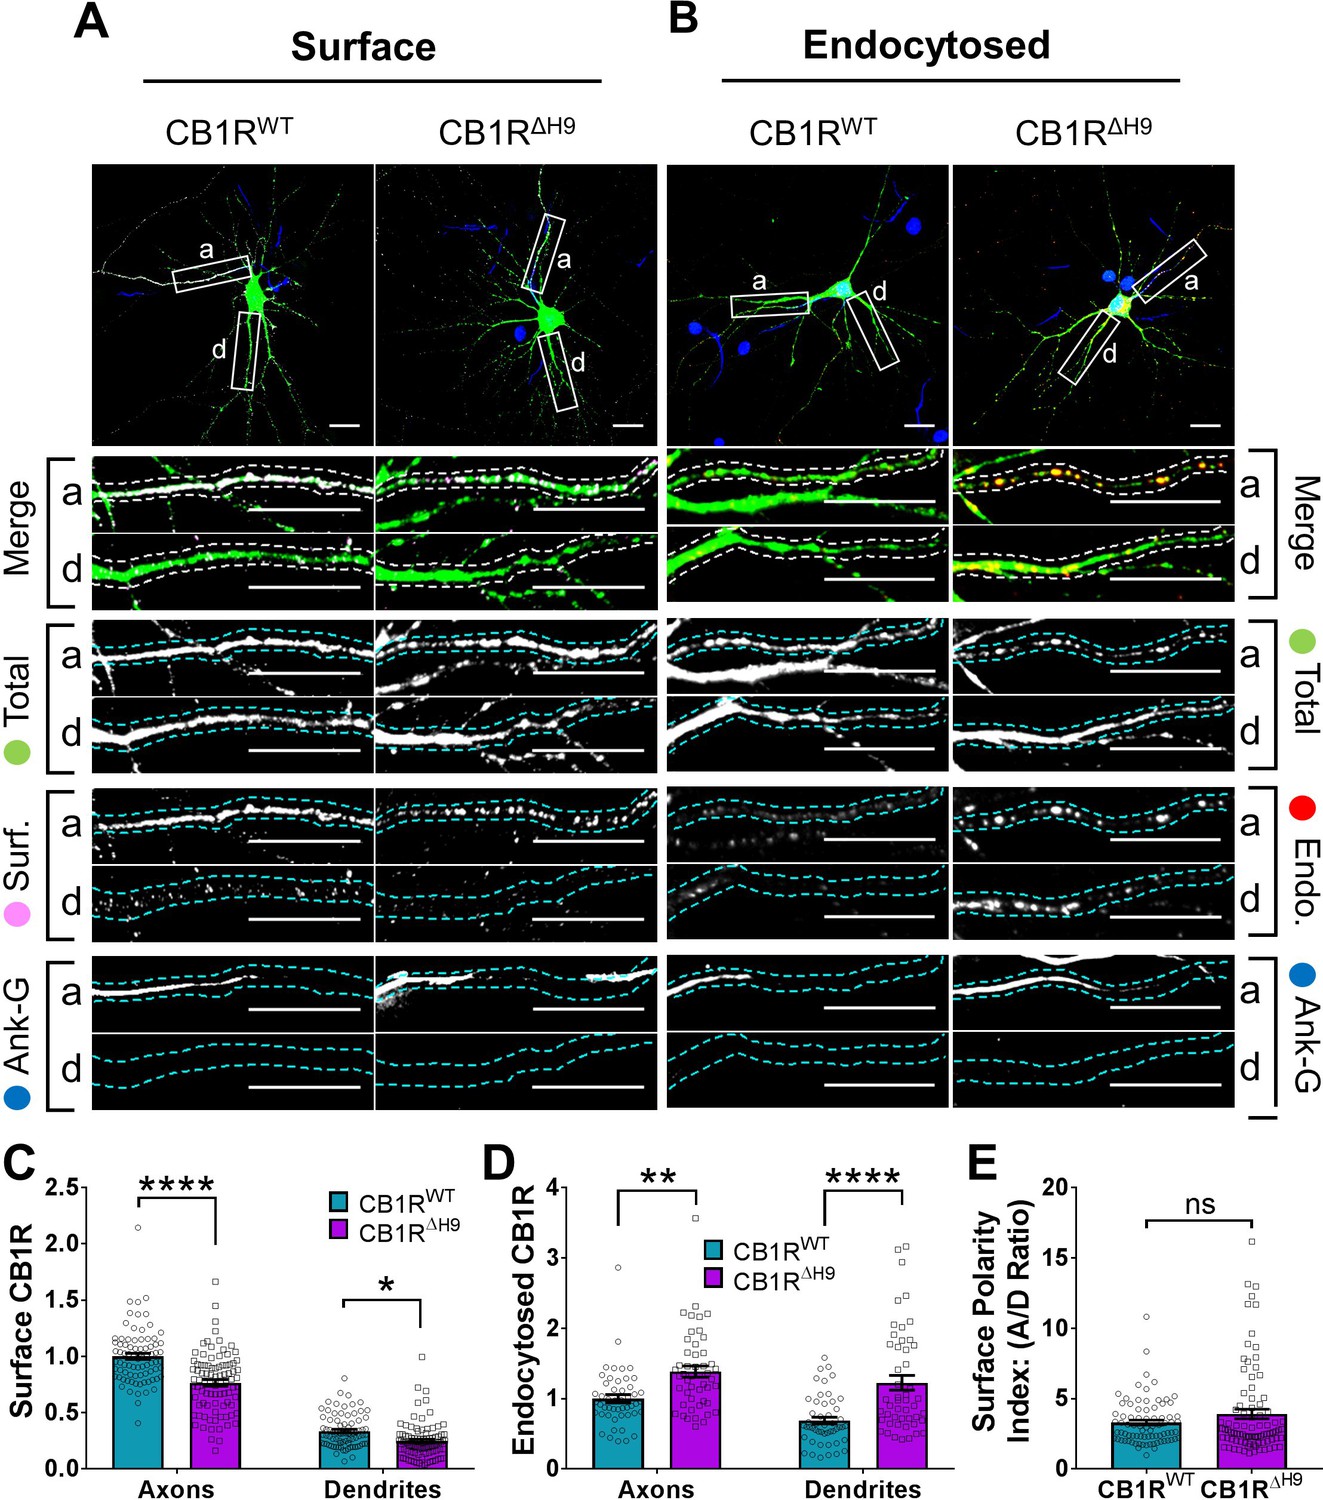
H9 stabilises CB1R at the axonal surface.
(A) Representative confocal images of surface stained DIV 14 hippocampal neurons expressing EGFP-CB1RWT or EGFP-CB1RΔH9. Green = total; magenta = surface; blue = axon marker (Ankyrin-G). Merge: surface to total seen as white. (B) Representative confocal images of DIV 14 primary hippocampal neurons expressing EGFP-CB1RWT or EGFP-CB1RΔH9. Neurons were subjected to 2 hr of antibody feeding followed by stripping off of surface antibody to reveal the endocytosed pool of receptors. Green = total; red = endocytosed; blue = axon marker (Ankyrin-G). Merge: endocytosed to total seen as yellow. (C) Quantification of data shown in (A). Surface expression of EGFP-CB1RΔH9 in both axons and dendrites was significantly reduced compared to EGFP-CB1RWT. Two-way ANOVA with Tukey’s post hoc test. N = ten independent experiments; n = 80–88 neurons per condition. Axons, WT vs. ΔH9: mean ± SEM, 1 ± 0.028 vs. 0.765 ± 0.029; N = 10, n = 80 vs. N = 10, n = 88; ****p < 0.0001. Dendrites, WT vs. ΔH9: mean ± SEM, 0.335 ± 0.016 vs. 0.247 ± 0.017; N = 10, n = 80 vs. N = 10, n = 88; *p = 0.0392. (D) Quantification of data shown in (B). Endocytosis of EGFP-CB1RΔH9 is significantly increased compared to EGFP-CB1RWT in both axons and dendrites. One-way ANOVA with Tukey’s post hoc test. N = seven independent experiments; n = 49 neurons per condition. Axons, WT vs. ΔH9: mean ± SEM, 1.00 ± 0.058 vs. 1.38 ± 0.08; **p = 0.0026. Dendrites, WT vs. ΔH9: mean ± SEM, 0.689 ± 0.05 vs. 1.225 ± 0.105; ****p < 0.0001. (E) Quantification of data shown in (A) presented as the surface polarity index. There was no difference in surface polarity between EGFP-CB1RWT or EGFP-CB1RΔH9. Mann-Whitney test. N = ten independent experiments; n = 80–88 neurons per condition. WT vs. ΔH9: mean ± SEM, 3.298 ± 0.1812 vs. 3.915 ± 0.3367; N = 10, n = 80 vs. N = 10, n = 88; p = 0.6886.
Figure 7
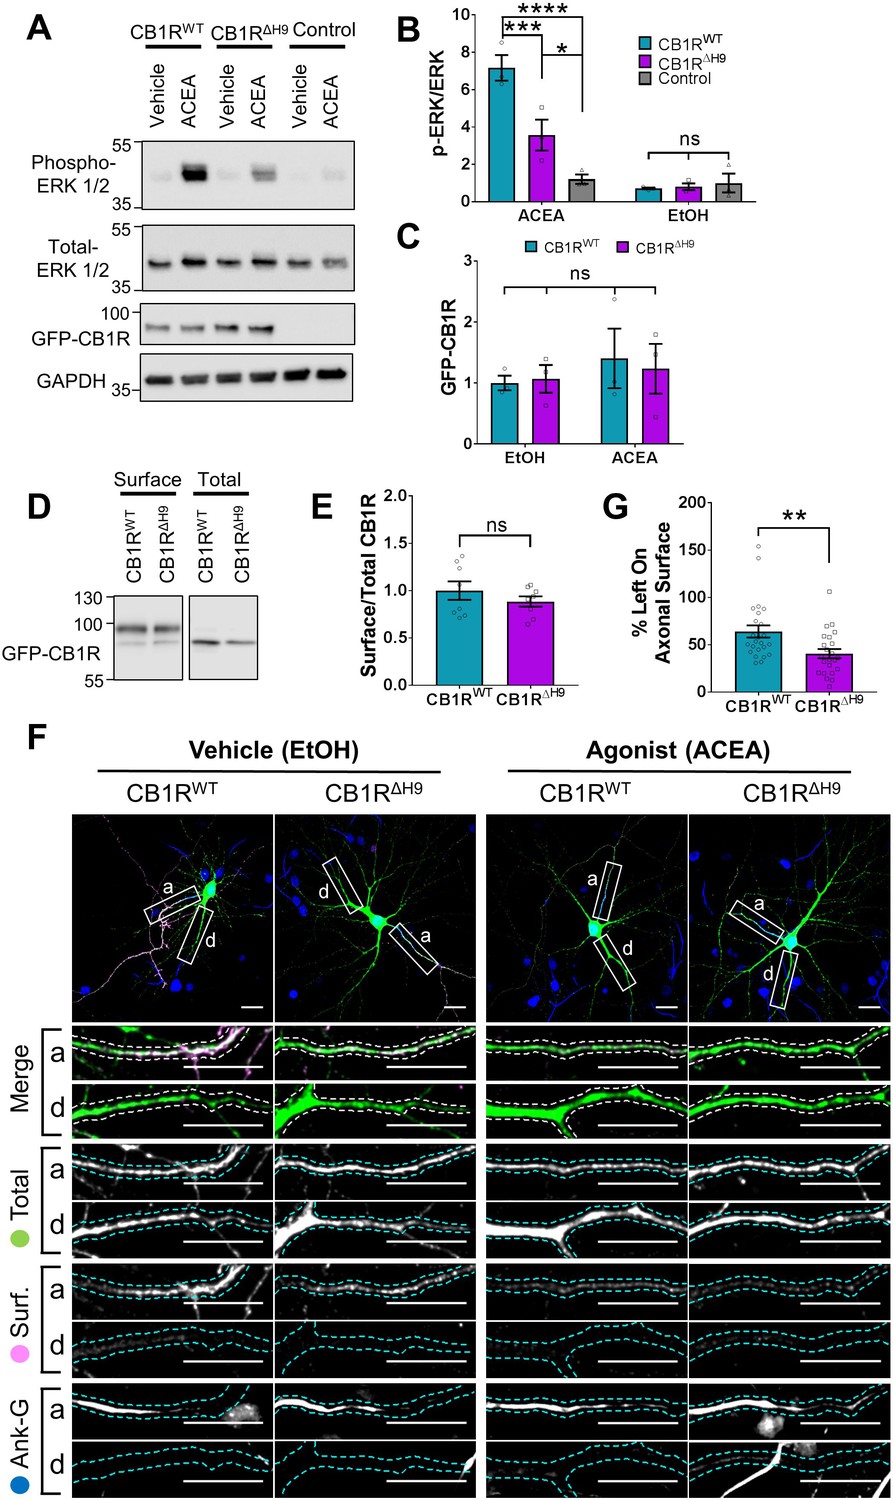
Role of H9 in CB1R signalling and in resisting agonist-induced endocytosis.
(A) Representative blots showing ERK1/2 phosphorylation in HEK293T cells expressing EGFP-CB1RWT or EGFP-CB1RΔH9 following vehicle (0.1% EtOH) or ACEA (1 μM) treatment for 5 min. (B) Quantification of data shown in (A). Following treatment with ACEA, ERK1/2 was significantly more phosphorylated in EGFP-CB1RWT- and EGFP-CB1RΔH9-transfected cells compared to untransfected cells. However, ERK1/2 activation was significantly reduced in EGFP-CB1RΔH9-expressing cells compared to EGFP-CB1RWT-expressing cells. There was no significant difference in ERK1/2 phosphorylation in vehicle-treated cells. Two-way ANOVA with Tukey’s post hoc test. N = three independent experiments. ACEA, WT vs. Control: mean ± SEM, 7.17 ± 0.684 vs. 1.21 ± 0.252; ****p < 0.0001. ΔH9 vs. Control: mean ± SEM, 3.57 ± 0.825 vs. 1.21 ± 0.252; *p = 0.0150. WT vs. ΔH9: mean ± SEM, 7.17 ± 0.684 vs. 3.57 ± 0.825; ***p = 0.0007. EtOH, WT vs. ΔH9 vs. Control: nsp ≥ 0.9125. (C) Quantification of data shown in (A). EGFP-CB1RWT and EGFP-CB1RΔH9 expressed equally in HEK293T cells. Two-way ANOVA with Sidak’s post hoc test. Three independent experiments. (nsp ≥ 0.9654). (D) Representative immunoblots from surface biotinylation experiments showing surface and total fractions of EGFP-CB1RWT and EGFP-CB1RΔH9 in HEK293T cells. (E) Quantification of data shown in (D). EGFP-CB1RWT and EGFP-CB1RΔH9 are surface expressed at equivalent levels in HEK293T cells. Unpaired t-test. Eight independent experiments. WT vs. ΔH9: mean ± SEM, 1.00 ± 0.0974 vs. 0.885 ± 0.0549; nsp = 0.3212. (F) Representative confocal images of DIV 12 hippocampal neurons expressing EGFP-CB1RWT or EGFP-CB1RΔH9 and treated with vehicle (0.1% EtOH) or CB1R agonist (5 μM ACEA) for 3 hr. Upper panels for each condition show whole cell field of view and lower panels are enlargements of axonal (a) and dendritic (d) ROIs. Green = total; magenta = surface; blue = axon marker (Ankyrin-G). Merge: surface to total seen as white. (G) Quantification of data represented in (F). Significantly less EGFP-CB1RΔH9 than EGFP-CB1RWT remained on the surface of axons after agonist application, indicating greater sensitivity to agonist-induced internalisation. The surface mean fluorescence was first normalised to the total mean fluorescence for each ROI, then to the average axonal EtOH value within a condition (set to 100%). Unpaired t-test. N = three independent experiments; n = 23–24 neurons per condition. WT vs. ΔH9: mean ± SEM, 64 ± 6.42 vs. 40.6 ± 4.87; N = 3, n = 24 vs. N = 3, n = 23; **p = 0.0059.
Figure 8
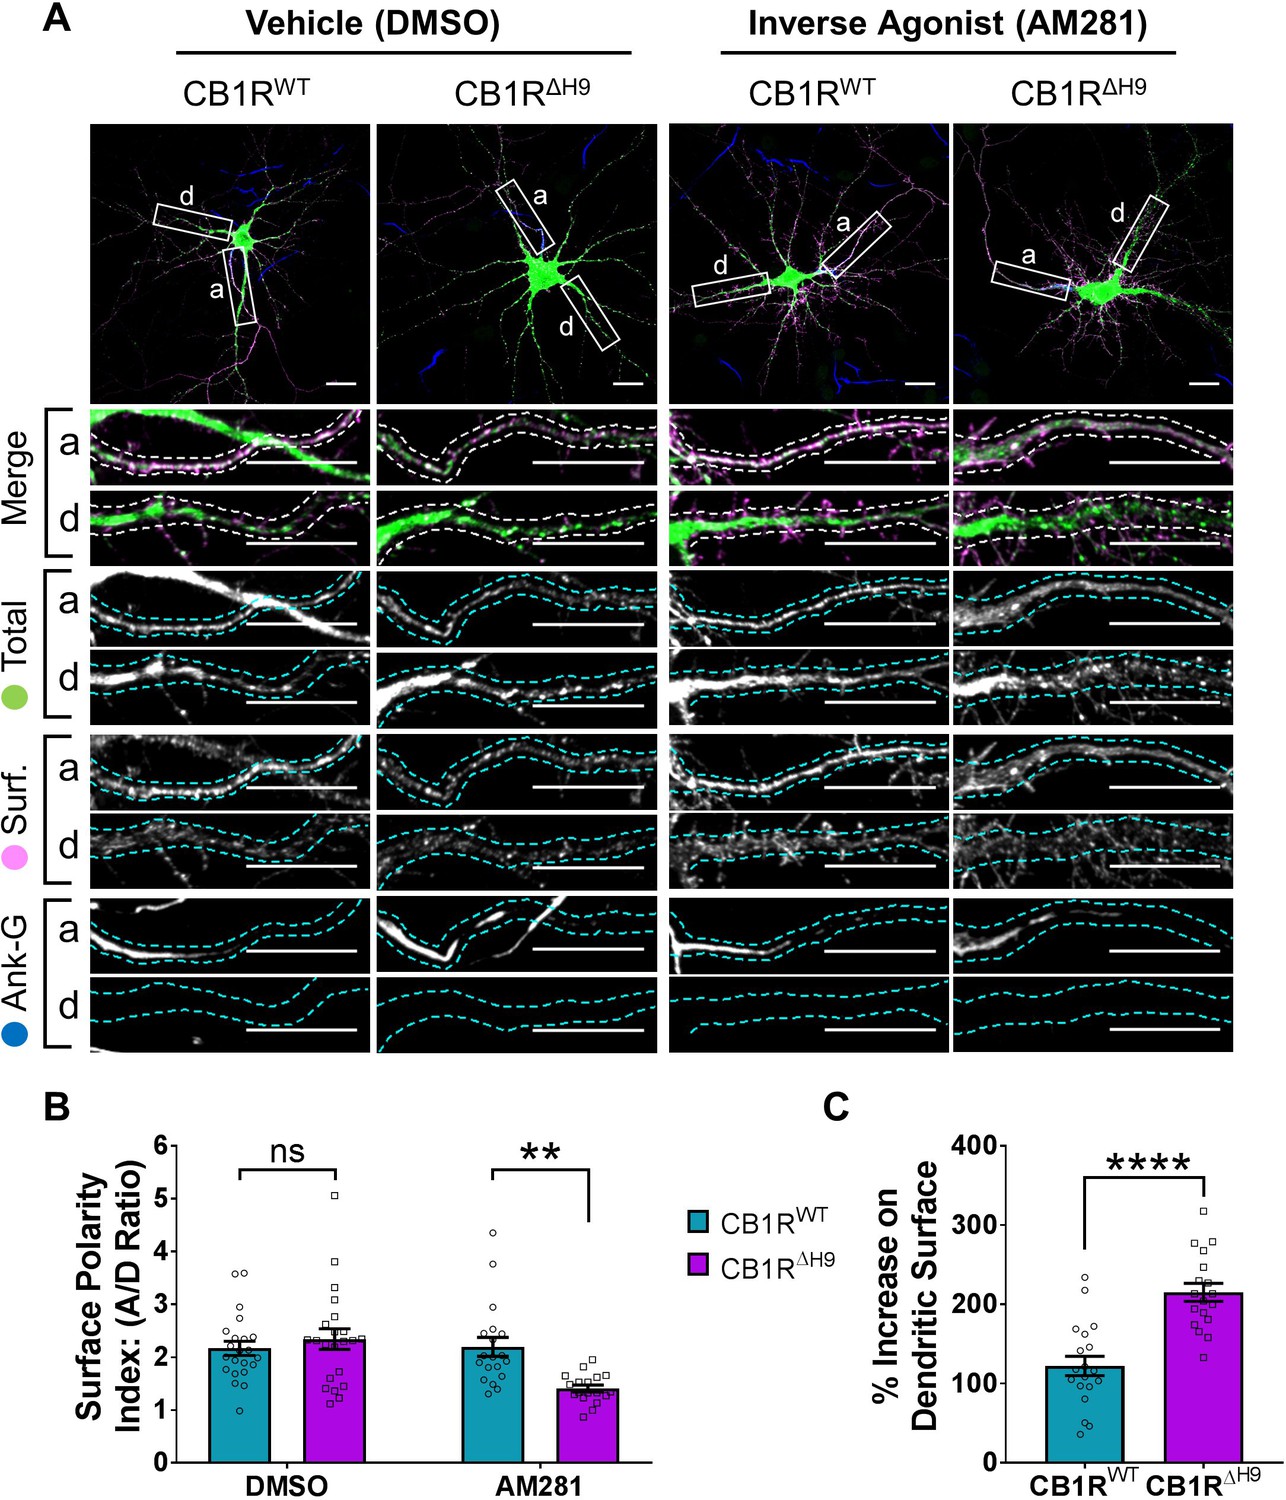
The role of H9 in polarity is revealed in the presence of inverse agonist.
(A) Representative confocal images of DIV 14 hippocampal neurons expressing EGFP-CB1RWT or EGFP-CB1RΔH9 and treated with vehicle (0.2% DMSO) or CB1R inverse agonist (10 µM AM281) for 3 hr. Upper panels for each condition show whole cell field of view and lower panels are enlargements of axonal (a) and dendritic (d) ROIs. Green = total; magenta = surface; blue = axon marker (Ankyrin-G). Merge: surface to total seen as white. (B) Quantification of data shown in (A) presented as the surface polarity index (A/D ratio). In the presence of inverse agonist, but not vehicle, EGFP-CB1RΔH9 was significantly less axonally polarised than EGFP-CB1RWT. Two-way ANOVA with Sidak’s post hoc test. N = three independent experiments; n = 18–22 neurons per condition. DMSO, WT vs. ΔH9: mean ± SEM, 2.17 ± 0.135 vs. 2.34 ± 0.196; N = 3, n = 22 vs. N = 3, n = 22; nsp = 0.9605. AM281, WT vs. ΔH9: mean ± SEM, 2.2 ± 0.18 vs. 1.41 ± 0.0649; N = 3, n = 19 vs. N = 3, n = 18; **p = 0.0067. (C) Quantification of data represented in (A). Significantly more EGFP-CB1RΔH9 than EGFP-CB1RWT relocated to the surface of dendrites after inverse agonist application. The surface mean fluorescence was first normalised to the total mean fluorescence for each ROI, then to the average DMSO value within a condition (set to 100%). Unpaired t-test. N = three independent experiments; n = 18–19 neurons per condition. WT vs. ΔH9: mean ± SEM, 122 ± 12.2 vs. 215 ± 11.3; N = 3, n = 19 vs. N = 3, n = 18; ****p < 0.0001.
Figure 9
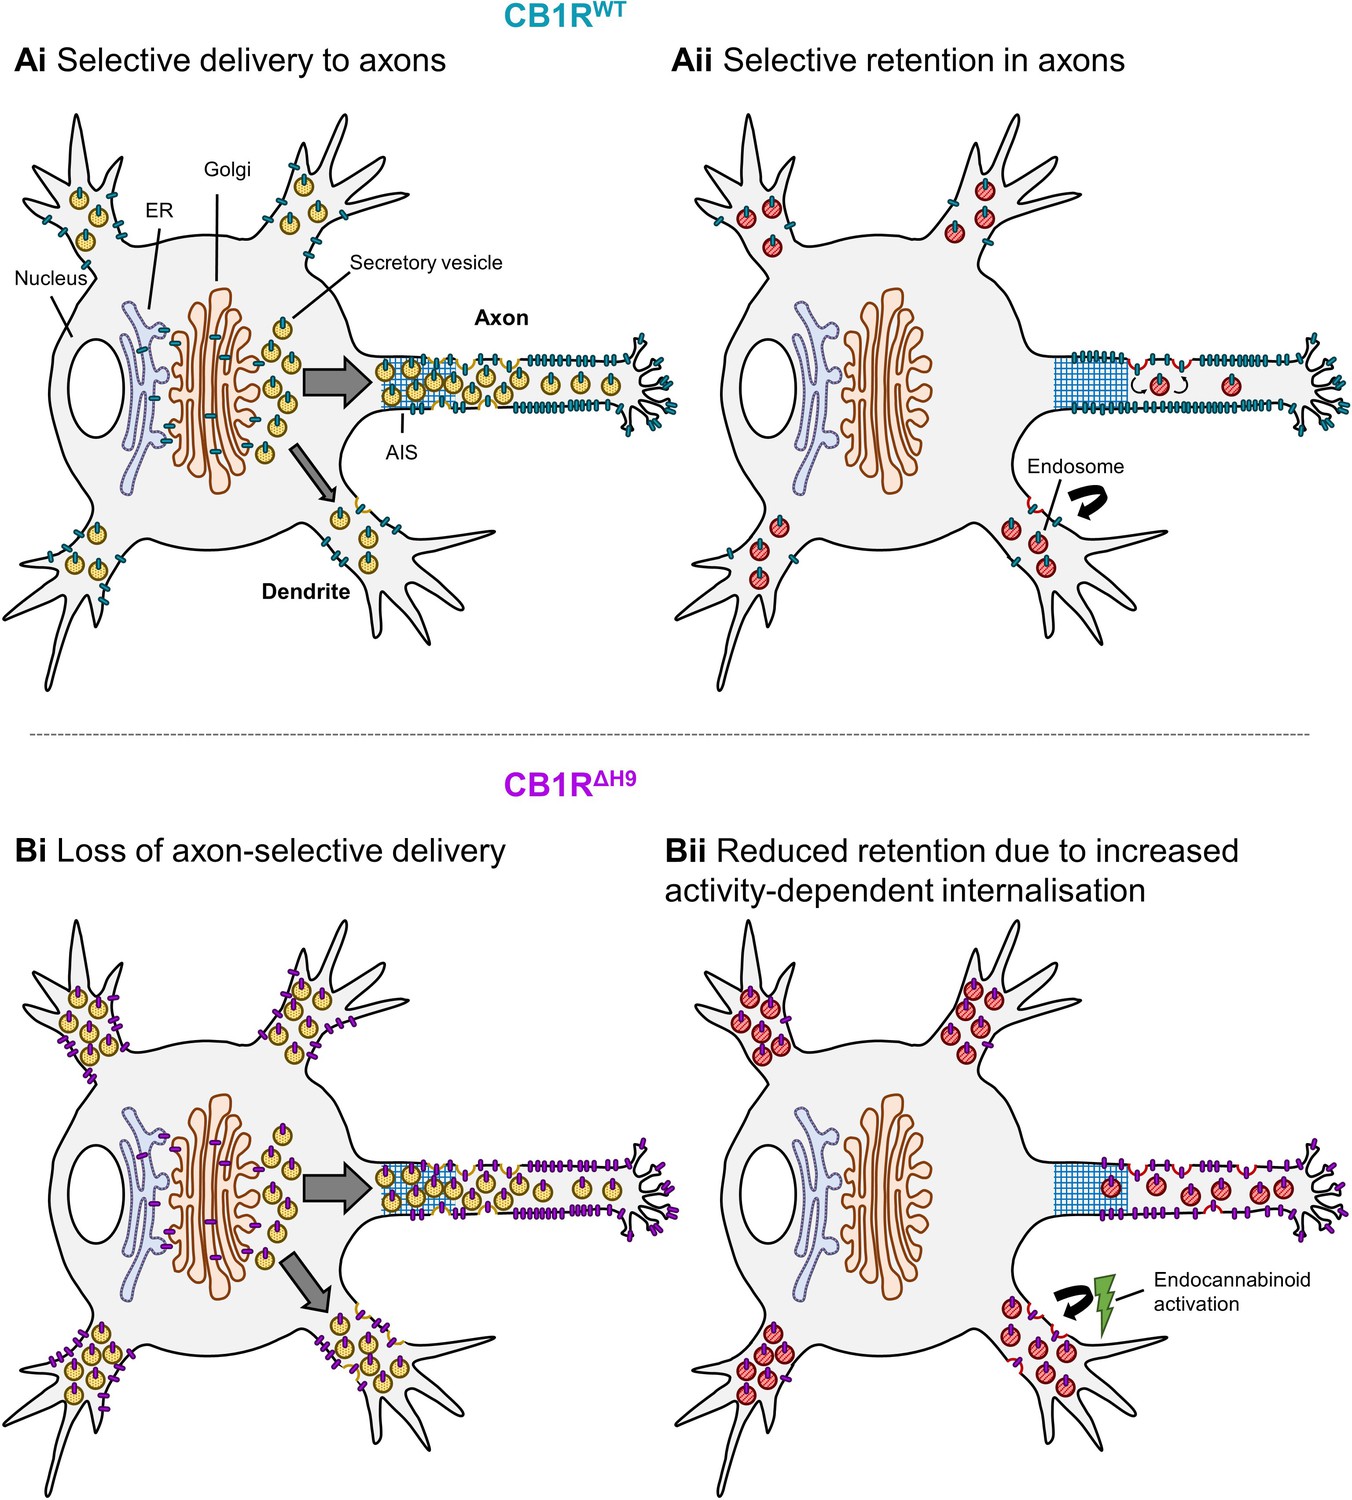
Schematic summarising main findings.
Polarised surface distribution of CB1R is established and maintained by two complementary mechanisms: (Ai) selective delivery of newly synthesized CB1R to the axon (or restricted delivery to dendrites) and (Aii) selective retention in axons and retrieval from dendrites. The C-terminal motif Helix 9 plays a role in both of these mechanisms because deletion of H9 leads to: (Bi) a loss of axon-selective delivery and (Bii) reduced retention in both axons and dendrites that can be reversed in dendrites by inverse agonist application, suggesting that CB1RΔH9 is more susceptible to activity-driven internalisation.
Author response image 1
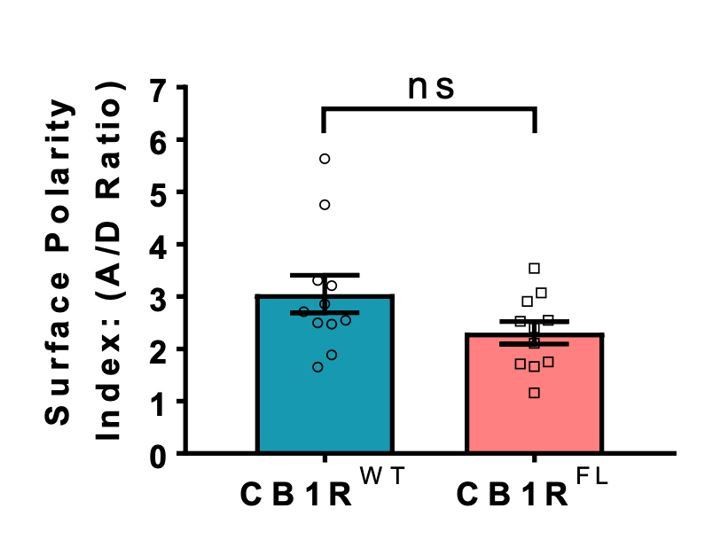
Indistinguishable axonal surface polarisation of full-length CB1R and CB1R lacking the first 25 N-terminal residues.
Tables
Key resources table
| Reagent type (species) or resource | Designation | Source or reference | Identifiers | Additional information |
|---|---|---|---|---|
| Antibody | anti-GFP (chicken polyclonal) | Abcam | Abcam:ab13970; RRID:AB_300798 | ICC (1:1,000) |
| Antibody | anti-GFP (rat monoclonal; clone 3H9) | Chromotek | Chromotek:3h9-100; RRID:AB_10773374 | WB (1:2,000-1:5,000) |
| Antibody | anti-Ankyrin-G (mouse monoclonal; purified; clone N106/36) | NeuroMab | NeuroMab:75–146; RRID:AB_10673030 | ICC (1:500) |
| Antibody | anti-CD4 (mouse monoclonal; purified; clone OKT4) | BioLegend | BioLegend:317402; RRID:AB_571963 | ICC (1:400) |
| Antibody | anti-MAP2 (rabbit polyclonal) | Synaptic Systems | SySy:188 003; RRID:AB_2281442 | ICC (1:500) |
| Antibody | anti-MAP Kinase, Activated/monophosphorylated, Phosphothreonine ERK-1 and 2 (mouse monoconal; clone ERK-PT115) | Merck (Sigma-Aldrich) | Sigma-Aldrich:M7802; RRID:AB_260658 | WB (1:1,000) |
| Antibody | anti-MAP Kinase, Non-Phosphorylated ERK (mouse monoclonal; clone ERK-NP2) | Merck (Sigma-Aldrich) | Sigma-Aldrich:M3807; RRID:AB_260501 | WB (1:250) |
| Antibody | anti-GAPDH (mouse monoclonal; clone 6C5) | Abcam | Abcam:ab8245; RRID:AB_2107448 | WB (1:20,000) |
| Antibody (secondary) | Peroxidase anti-mouse IgG (goat) | Merck (Sigma-Aldrich) | Sigma-Aldrich:A3682 | WB (1:10,000) |
| Antibody (secondary) | Peroxidase anti-rat IgG (rabbit) | Merck (Sigma-Aldrich) | Sigma-Aldrich:A5795 | WB (1:10,000) |
| Antibody (secondary) | Cy2 anti-chicken IgY (donkey) | Jackson Immuno Research (Stratech) | JIR:703-225-155; RRID:AB_2340370 | ICC (1:400) |
| Antibody (secondary) | Alexa Fluor 647 anti-chicken IgY (donkey) | Jackson Immuno Research (Stratech) | JIR:703-606-155; RRID:AB_2340380 | ICC (1:400) |
| Antibody (secondary) | Cy3 anti-chicken IgY (donkey) | Jackson Immuno Research (Stratech) | JIR:703-165-155; RRID:AB_2340363 | ICC (1:400) |
| Antibody (secondary) | Cy5 anti-mouse IgG (donkey) | Jackson Immuno Research (Stratech) | JIR:715-175-150; RRID:AB_2340819 | ICC (1:400) |
| Antibody (secondary) | Cy3 anti-mouse IgG (donkey) | Jackson Immuno Research (Stratech) | JIR:715-165-150; RRID:AB_2340813 | ICC (1:400) |
| Antibody (secondary) | DyLight 405 anti-mouse IgG (goat) | Jackson Immuno Research (Stratech) | JIR:115-475-003; RRID:AB_2338786 | ICC (1:400) |
| Antibody (secondary) | Alexa Fluor 488 anti-rabbit IgG (donkey) | Jackson Immuno Research (Stratech) | JIR:711-545-152; RRID:AB_2313584 | ICC (1:400) |
| Chemical compound, drug | Arachidonyl-2'-chloroethylamide (ACEA) | Bio-Techne (Tocris) | Tocris:1319 | |
| Chemical compound, drug | AM 281 | Bio-Techne (Tocris) | Tocris:1115 | Dissolved in DMSO |
| Cell line (H. sapiens) | HEK293T | ECACC (Sigma-Aldrich) | ECACC:12022001; RRID:CVCL_0063 | |
| Cell line (R. norvegicus) | primary hippocampal neurons | University of Bristol Animal Services Unit | E18 Wistar Han rats | |
| Recombinant DNA reagent | pIRESneo3_Str- KDEL_IRES-SPIl-2-SBP-mCherry-Ecadherin (plasmid) | PMID:22406856 | Addgene:65287 | |
| Recombinant DNA reagent | pcDNA1-SPHgH-SEP-CB1RWT (plasmid) | PMID:17467290 | ||
| Recombinant DNA reagent | pcDNA1-SPHgH-SEP-CB1RΔH9 (plasmid) | This paper | PCR mutagenesis template: pcDNA1-SPHgH-SEP-CB1RWT | |
| Recombinant DNA reagent | pIRESneo3_Str-KDEL_IRES-SPIl-2-SBP-EGFP-CB1RWT (plasmid) | This paper | PCR template: pcDNA1-SPHgH-SEP-CB1R Vector: pIRESneo3_Str-KDEL_IRES-SPIl-2-SBP-mCherry- Ecadherin | |
| Recombinant DNA reagent | pIRESneo3_Str-KDEL_IRES-SPIl-2-SBP-EGFP-CB1RΔH9 (plasmid) | This paper | PCR template: pcDNA1-SPHgH-SEP-CB1RΔH9 Vector: pIRESneo3_Str-KDEL_IRES-SPIl-2-SBP-mCherry-Ecadherin | |
| Recombinant DNA reagent | pcDNA3.1-SPIl-2-SBP-EGFP-CB1RWT (plasmid) | This paper | PCR template: pIRESneo3_Str-KDEL_IRES-SPIl-2-SBP-EGFP-CB1RWT Vector: pcDNA3.1(+) | |
| Recombinant DNA reagent | pcDNA3.1-SPIl-2-SBP-EGFP-CB1RΔH9 (plasmid) | This paper | PCR template: pIRESneo3_Str-KDEL_IRES-SPIl-2-SBP-EGFP-CB1RΔH9 Vector: pcDNA3.1(+) | |
| Recombinant DNA reagent | pcDNA3.1-SPIl-2-EGFP-CB1RWT (plasmid) | This paper | PCR mutagenesis template: pcDNA3.1-SPIl-2-SBP-EGFP-CB1RWT | |
| Recombinant DNA reagent | pcDNA3.1-SPIl-2-EGFP-CB1RΔH9 (plasmid) | This paper | PCR mutagenesis template: pcDNA3.1-SPIl-2-SBP-EGFP-CB1RΔH9 | |
| Recombinant DNA reagent | pCB6-CD4ΔCt (plasmid) | PMID:11689435 | ||
| Recombinant DNA reagent | pCB6-CD4-ctCB1RWT (plasmid) | This paper | Overlap extension PCR template: pcDNA1-SPHgH- SEP-CB1RWT Vector: pCB6-CD4ΔCt | |
| Recombinant DNA reagent | pCB6-CD4-ctCB1RΔH9 (plasmid) | This paper | Overlap extension PCR template: pcDNA1-SPHgH-SEP-CB1RΔH9 Vector: pCB6-CD4ΔCt | |
| Chemical compound, drug | Neurobasal | Thermo Fisher Scientific (Gibco) | TFS:21103049 | |
| Chemical compound, drug | Horse Serum | Merck (Sigma-Aldrich) | Sigma-Aldrich:H1270 | |
| Chemical compound, drug | B27 | Thermo Fisher Scientific (Gibco) | TFS:A3582801 | |
| Chemical compound, drug | GS21 | MTI GlobalStem | GS:3100 | |
| Chemical compound, drug | GlutaMAX | Thermo Fisher Scientific (Gibco) | TFS:35050038 | |
| Chemical compound, drug | DMEM | Lonza | Lonza:12–614F | |
| Chemical compound, drug | L-Glutamine | Merck (Sigma-Aldrich) | Sigma-Aldrich:G7513 | |
| Chemical compound, drug | FBS | Merck (Sigma-Aldrich) | Sigma-Aldrich:F7524 | |
| Chemical compound, drug | Lipofectamine 2000 | Thermo Fisher Scientific | TFS:11668019 | |
| Chemical compound, drug | D-Biotin | Merck (Sigma-Aldrich) | Sigma-Aldrich:B4501 | |
| Chemical compound, drug | EZ-Link Sulfo-NHS-SS-Biotin | Thermo Fisher Scientific | TFS:21331 | |
| Chemical compound, drug | Streptavidin− Agarose | Merck (Millipore) | Merck:S1638 | |
| Chemical compound, drug | Bovine Serum Albumin | Thermo Fisher Scientific | TFS:BP9704 | |
| Chemical compound, drug | Fluoromount-G | Thermo Fisher Scientific | TFS:00-4958-02 | |
| Chemical compound, drug | cOmplete Protease Inhibitor Cocktail | Merck (Sigma-Aldrich) | Sigma-Aldrich: 11697498001 | |
| Chemical compound, drug | Pierce Phosphatase Inhibitor | Thermo Fisher Scientific | TFS:A32957 | |
| Chemical compound, drug | CHAPS Detergent | Thermo Fisher Scientific | TFS:28300 | |
| Software, algorithm | GraphPad Prism | GraphPad Prism (https://graphpad.com) | RRID:SCR_002798 | Version 7 |
| Software, algorithm | Fiji | Fiji (https://fiji.sc/) | RRID:SCR_002285 |
Additional files
-
Transparent reporting form
- https://doi.org/10.7554/eLife.44252.012
Download links
A two-part list of links to download the article, or parts of the article, in various formats.
Downloads (link to download the article as PDF)
Open citations (links to open the citations from this article in various online reference manager services)
Cite this article (links to download the citations from this article in formats compatible with various reference manager tools)
The C-terminal helix 9 motif in rat cannabinoid receptor type 1 regulates axonal trafficking and surface expression
eLife 8:e44252.
https://doi.org/10.7554/eLife.44252


