A four-DNA methylation biomarker is a superior predictor of survival of patients with cutaneous melanoma
- Nanjing University, China
- Shanghai University, China
Figures
Figure 1 with 3 supplements
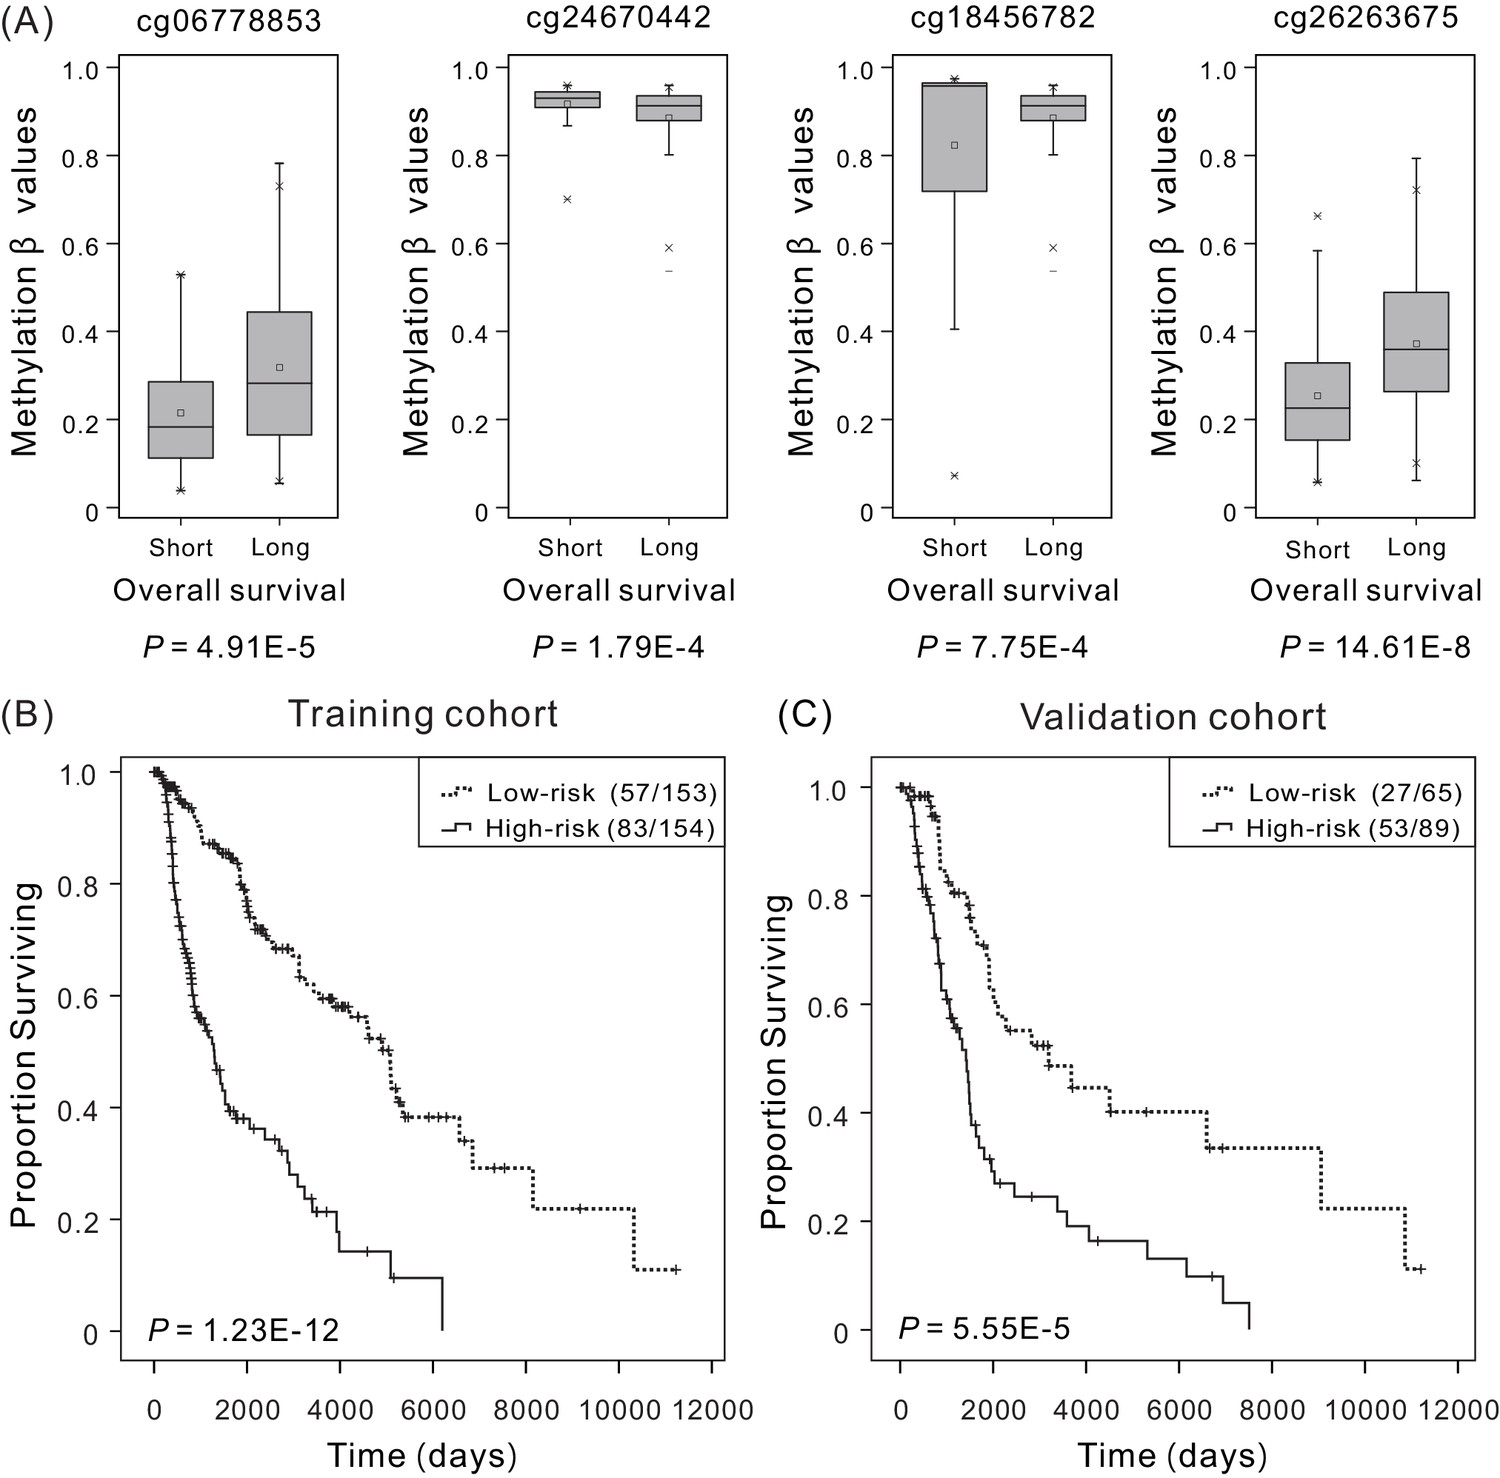
Overall survival (OS) and methylation levels of patient cohorts.
(A) Methylation β values of samples from patients with short survival (OS <5 years) and long survival (OS >5 years) in the training cohort. Within each methylation site, the thick line represents the median value, the bottom and top of the boxes are the 25th and 75th percentiles (interquartile range). The whiskers encompass 1.5 times the interquartile range. The difference between short and long survival groups was compared through the Mann–Whitney U test, and P values are shown below the plots. The Kaplan–Meier curves along with the Wilcoxon test were used to visualize and compare the OS of the low-risk versus high-risk groups in the training cohort (N = 307) (B) and the validation cohort (N = 154) (C). Here ‘low-risk (57/153)’ refers to that a total of 153 patients in the low-risk group, in which 57 with last clinical status ‘death’, and ‘low-risk (83/154)’ refers to that a total of 154 patients in the high-risk group, in which 83 with last clinical status ‘death’. It can be concluded that higher risk scores are significantly associated with worse OS (p<0.001).
-
Figure 1—source data 1
The distribution of overall survival (OS) and methylation levels for patient in the training cohort.
- https://doi.org/10.7554/eLife.44310.007
-
Figure 1—source data 2
The OS of patients in the low-risk versus high-risk groups for the training cohort (N = 307).
- https://doi.org/10.7554/eLife.44310.008
-
Figure 1—source data 3
The OS of patients in the low-risk versus high-risk groups for the validation cohort (N = 154).
- https://doi.org/10.7554/eLife.44310.009
Figure 1—figure supplement 1
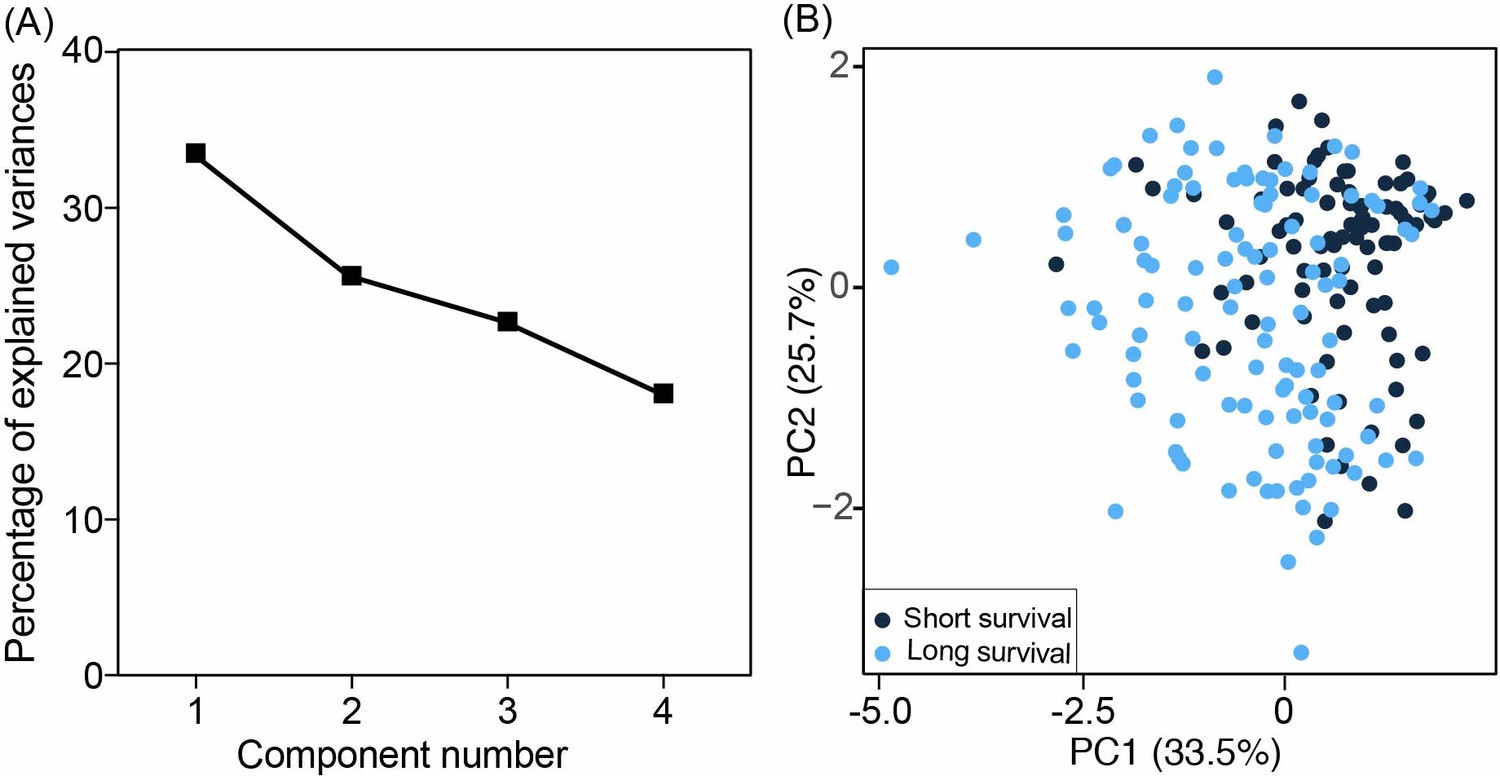
The principal component analysis (PCA) models were constructed using four methylation values at selected biomarkers.
(A) The contribution of each component is ranked based on the magnitude of its corresponding percentage of explained variances. The difference of PC1 and PC4 is 15.42%, indicating the continuous capturing of information. (B) The differences between short survival (OS <5 years) and long survival (OS >5 years) in the training cohort.
Figure 1—figure supplement 2
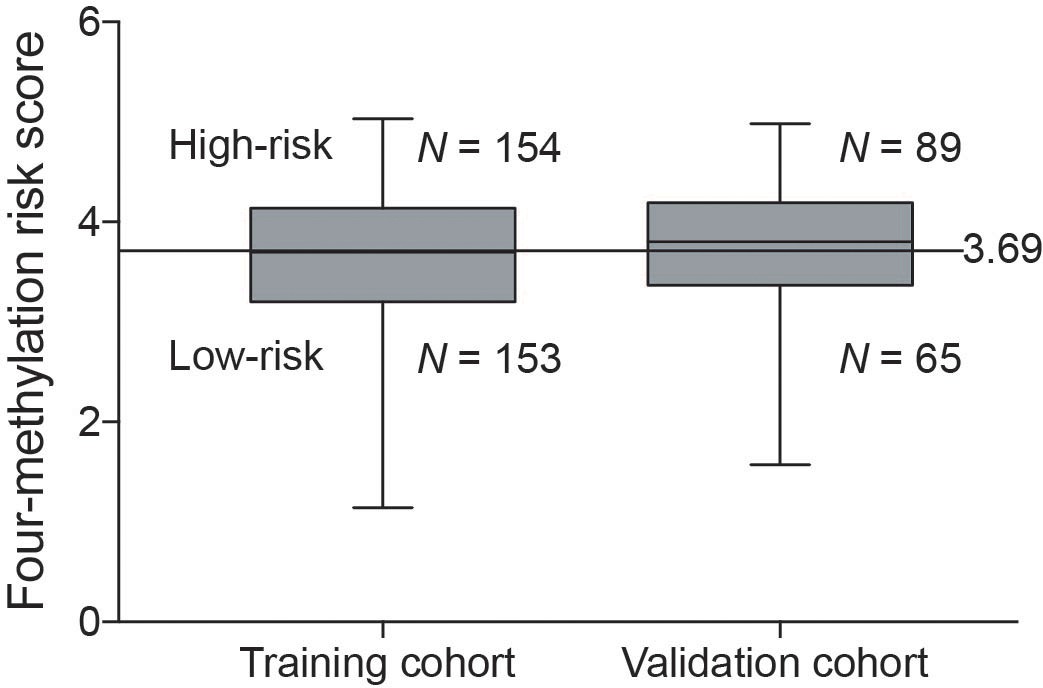
Distribution of the four-methylation risk predictor score values in the training cohort and the validation cohort.
The horizontal lines in the boxes indicated the median, and the top and bottom of the boxes the second and third quartiles. The whiskers represent the minimum and maximum values.
Figure 1—figure supplement 3

Correlation between the expression of the genes and their methylation levels was evaluated for each gene through the Pearson’s correlation test.
Reported P values are two sided. Level of gene expression is reported as log2-transformed Fragments Per Kilobase of transcript per Million mapped reads (FPKM), and methylation β-values defined by the Infinium HumanMethylation 450 BeadChip.
Figure 2 with 3 supplements
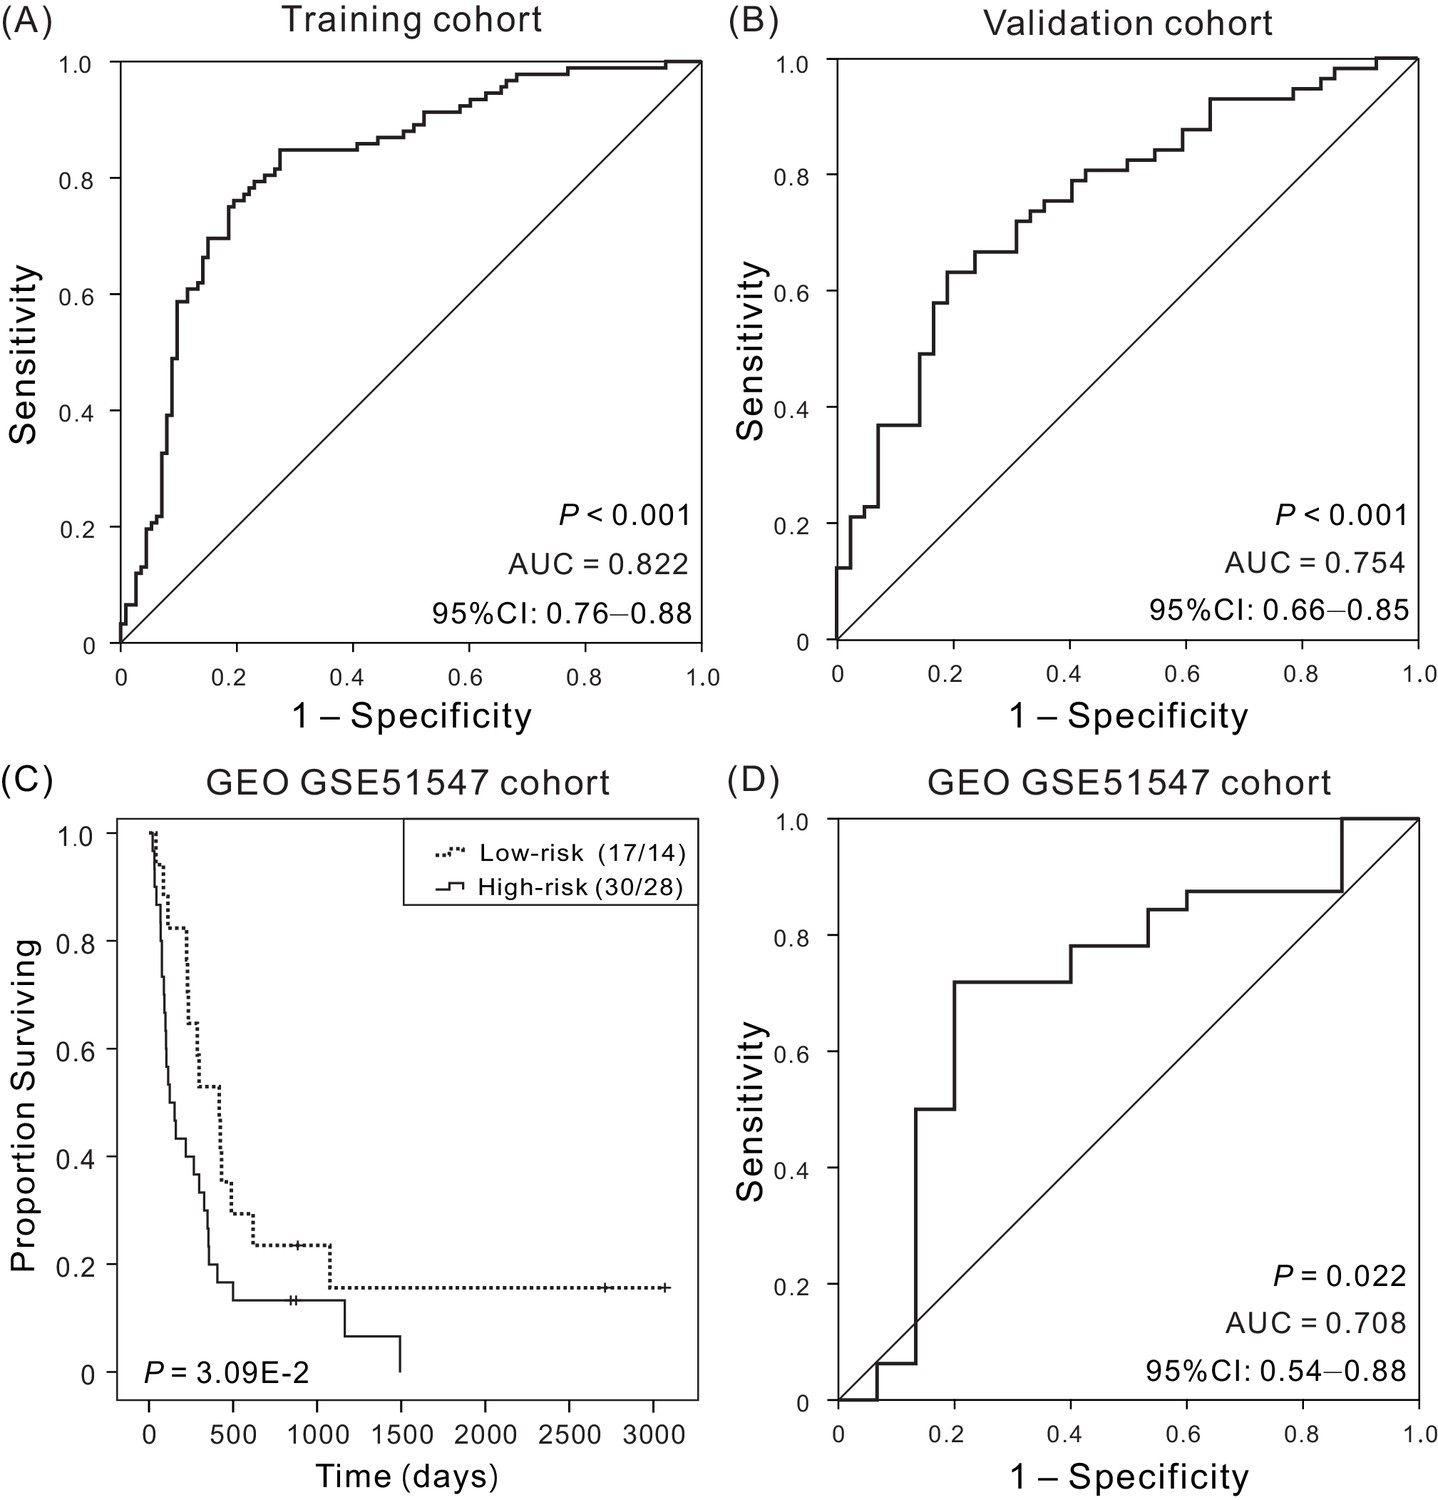
Kaplan–Meier and ROC analyzes of the four-DNA methylation signature in predicting the OS of patients.
(A) ROC analysis of sensitivity and specificity of the four-DNA methylation signature in predicting the OS of patients in training cohort, with an AUC of 0.822 (B) ROC analysis in validation cohort, with an AUC of 0.754. (C) Kaplan–Meier survival curves demonstrating the correlation between the four-DNA methylation signature and poorer OS of patients in an independent cohort (GSE51547). (D) ROC curves show the sensitivity and specificity of the signature in predicting the patient’ OS, AUC = 0.708.
-
Figure 2—source data 1
The OS and four-DNA methylation risk scores of patients in training cohort.
- https://doi.org/10.7554/eLife.44310.014
-
Figure 2—source data 2
The OS and four-DNA methylation risk scores of patients in validation cohort.
- https://doi.org/10.7554/eLife.44310.015
-
Figure 2—source data 3
The OS of patients in the low-risk versus high-risk groups for an independent cohort (GSE51547).
- https://doi.org/10.7554/eLife.44310.016
-
Figure 2—source data 4
The OS and four-DNA methylation risk scores of patients in an independent cohort (GSE51547).
- https://doi.org/10.7554/eLife.44310.017
Figure 2—figure supplement 1

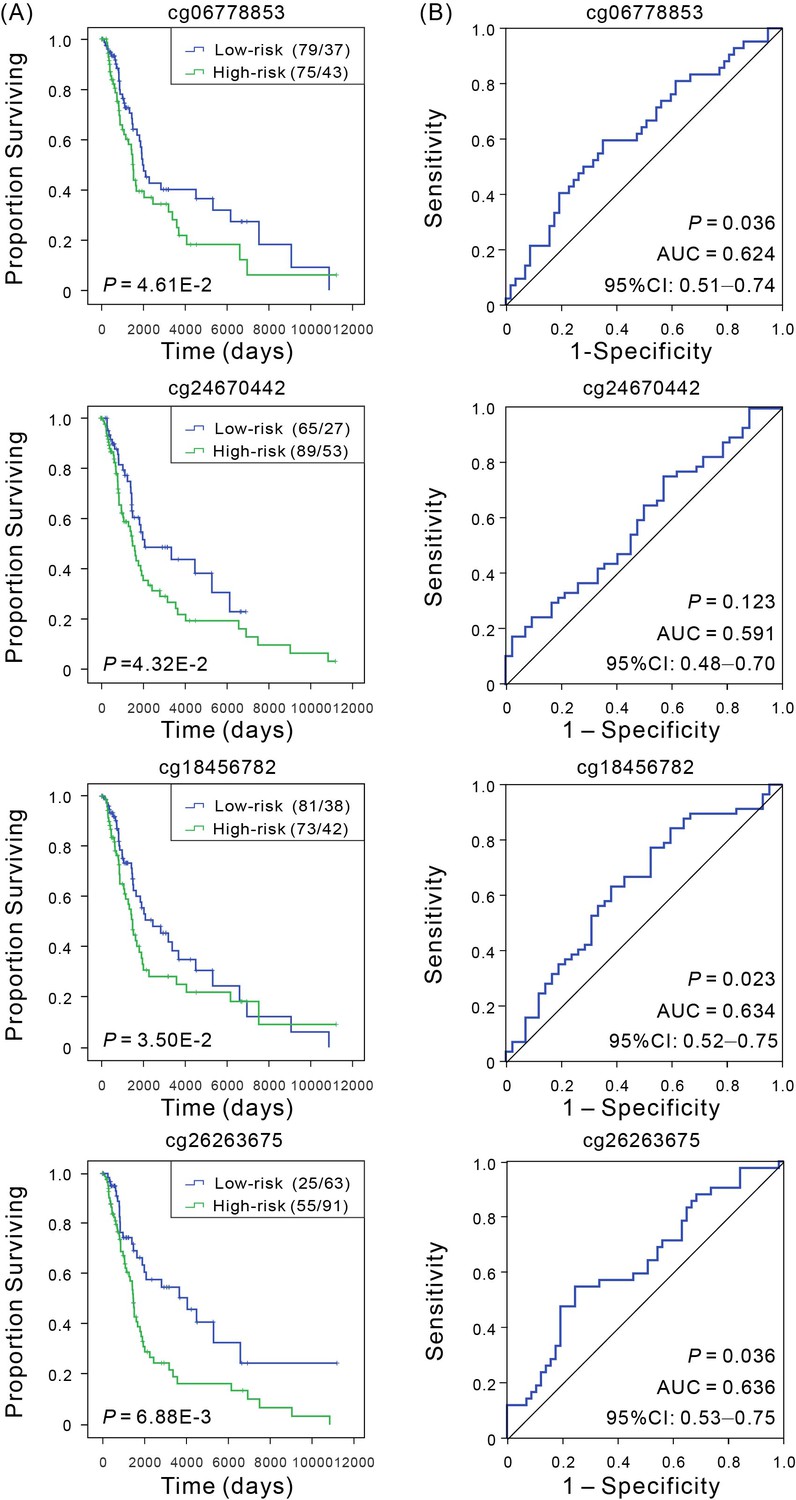
Kaplan–Meier and ROC analyses of individual DNA methylation in the TCGA validation cohort.
(A) Kaplan–Meier analysis with Wilcoxon test was performed to estimate the differences in OS between the low- and high-risk patients. (B) ROC curves of the individual methylation signature were used to demonstrate the sensitivity and specificity in predicting the OS of patients.
Figure 2—figure supplement 2
Kaplan–Meier and ROC analyses of patients with CM in both training cohort and validation cohort.
(A) Kaplan–Meier survival curves with show correlation between expression of four-mRNA signature and OS of patients. Wilcoxon test was performed to estimate the differences between the low-risk and high-risk patients. (B) ROC curves of the four-mRNA signature were used to demonstrate the sensitivity and specificity in predicting the OS of patients.
Figure 2—figure supplement 3
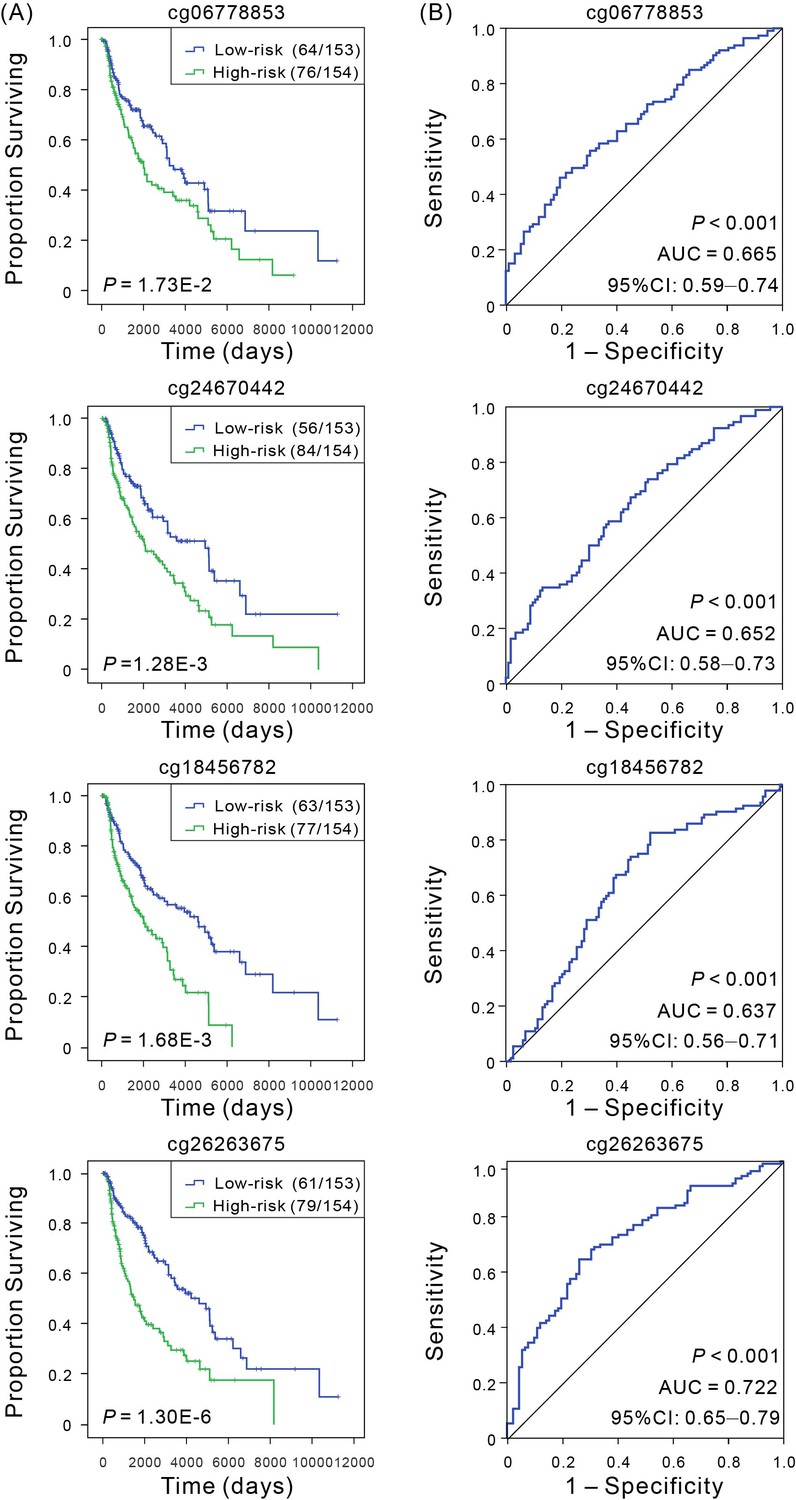
Kaplan–Meier and ROC analyses of individual DNA methylation in the training cohort.
(A) Kaplan–Meier analysis with Wilcoxon test was performed to estimate the differences in OS between the low- and high-risk patients. (B) ROC curves of the individual methylation signature were used to demonstrate the sensitivity and specificity in predicting the OS of patients.
Figure 3 with 7 supplements
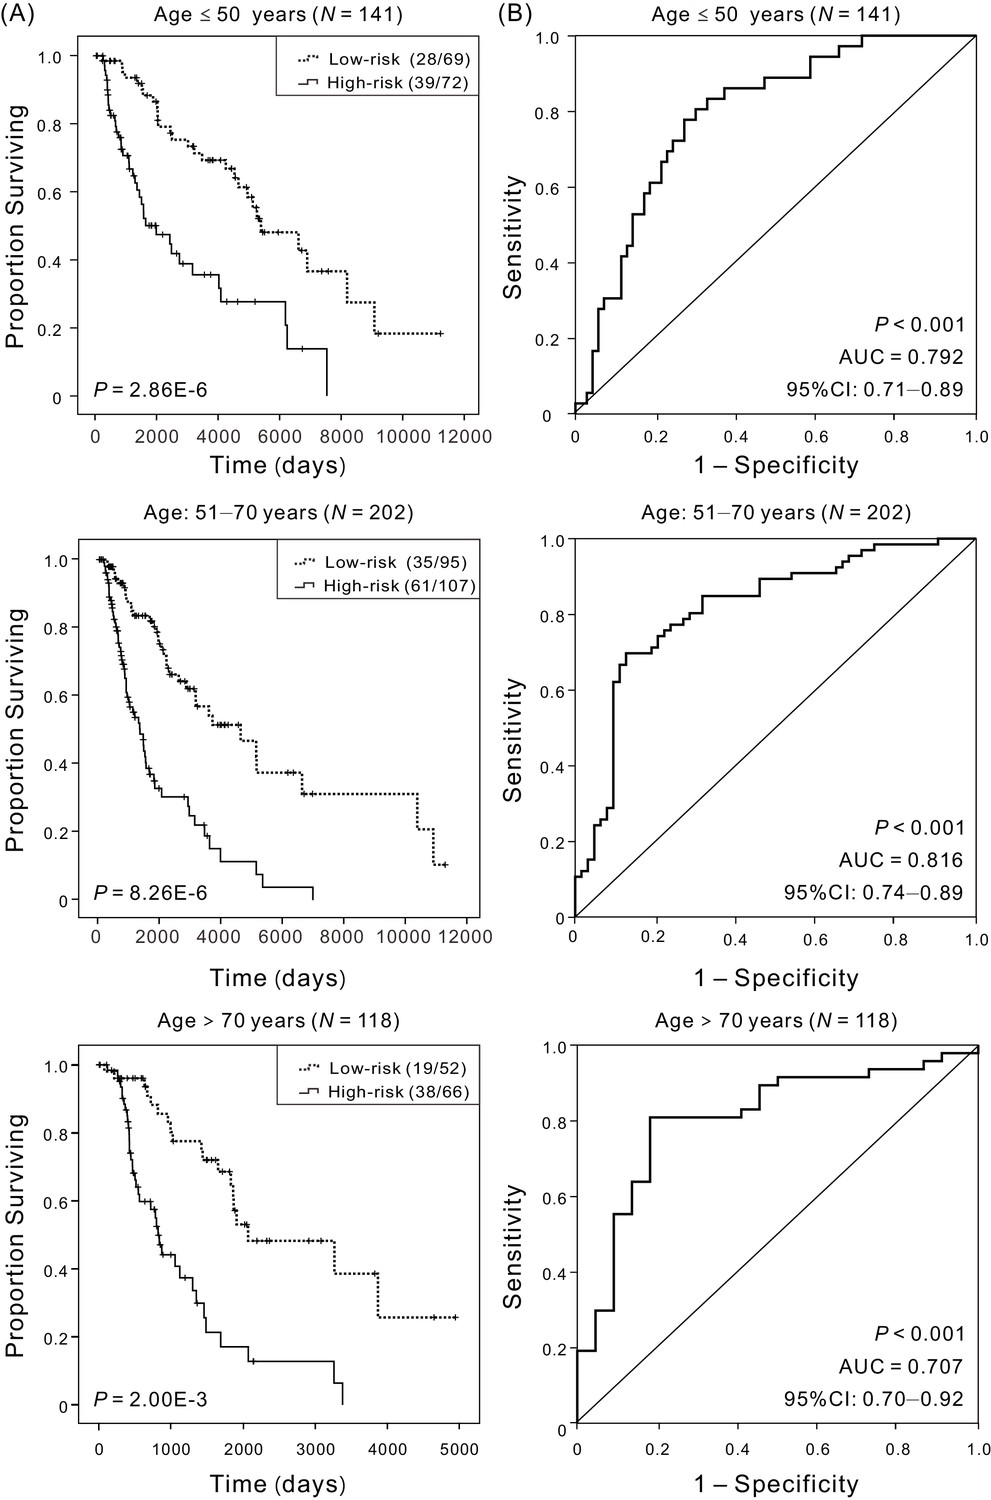
Kaplan–Meier and ROC analyses of patients with CM in different age cohorts, grouping based on their ages at initial diagnosis:≤50 (N = 141, 30.58%), 51–70 (N = 202, 43.82%),>70 (N = 118, 25.60%), respectively.
(A) Kaplan–Meier analysis with Wilcoxon test was performed to estimate the differences in OS between the low-risk and high-risk patients. (B) ROC curves of the four-DNA methylation signature were used to demonstrate the sensitivity and specificity in predicting the OS of patients.
-
Figure 3—source data 1
The OS of patients in the low-risk versus high-risk groups for patients with different age at initial diagnosis.
- https://doi.org/10.7554/eLife.44310.026
-
Figure 3—source data 2
The OS and four-DNA methylation risk scores of patients with different age at initial diagnosis.
- https://doi.org/10.7554/eLife.44310.027
Figure 3—figure supplement 1
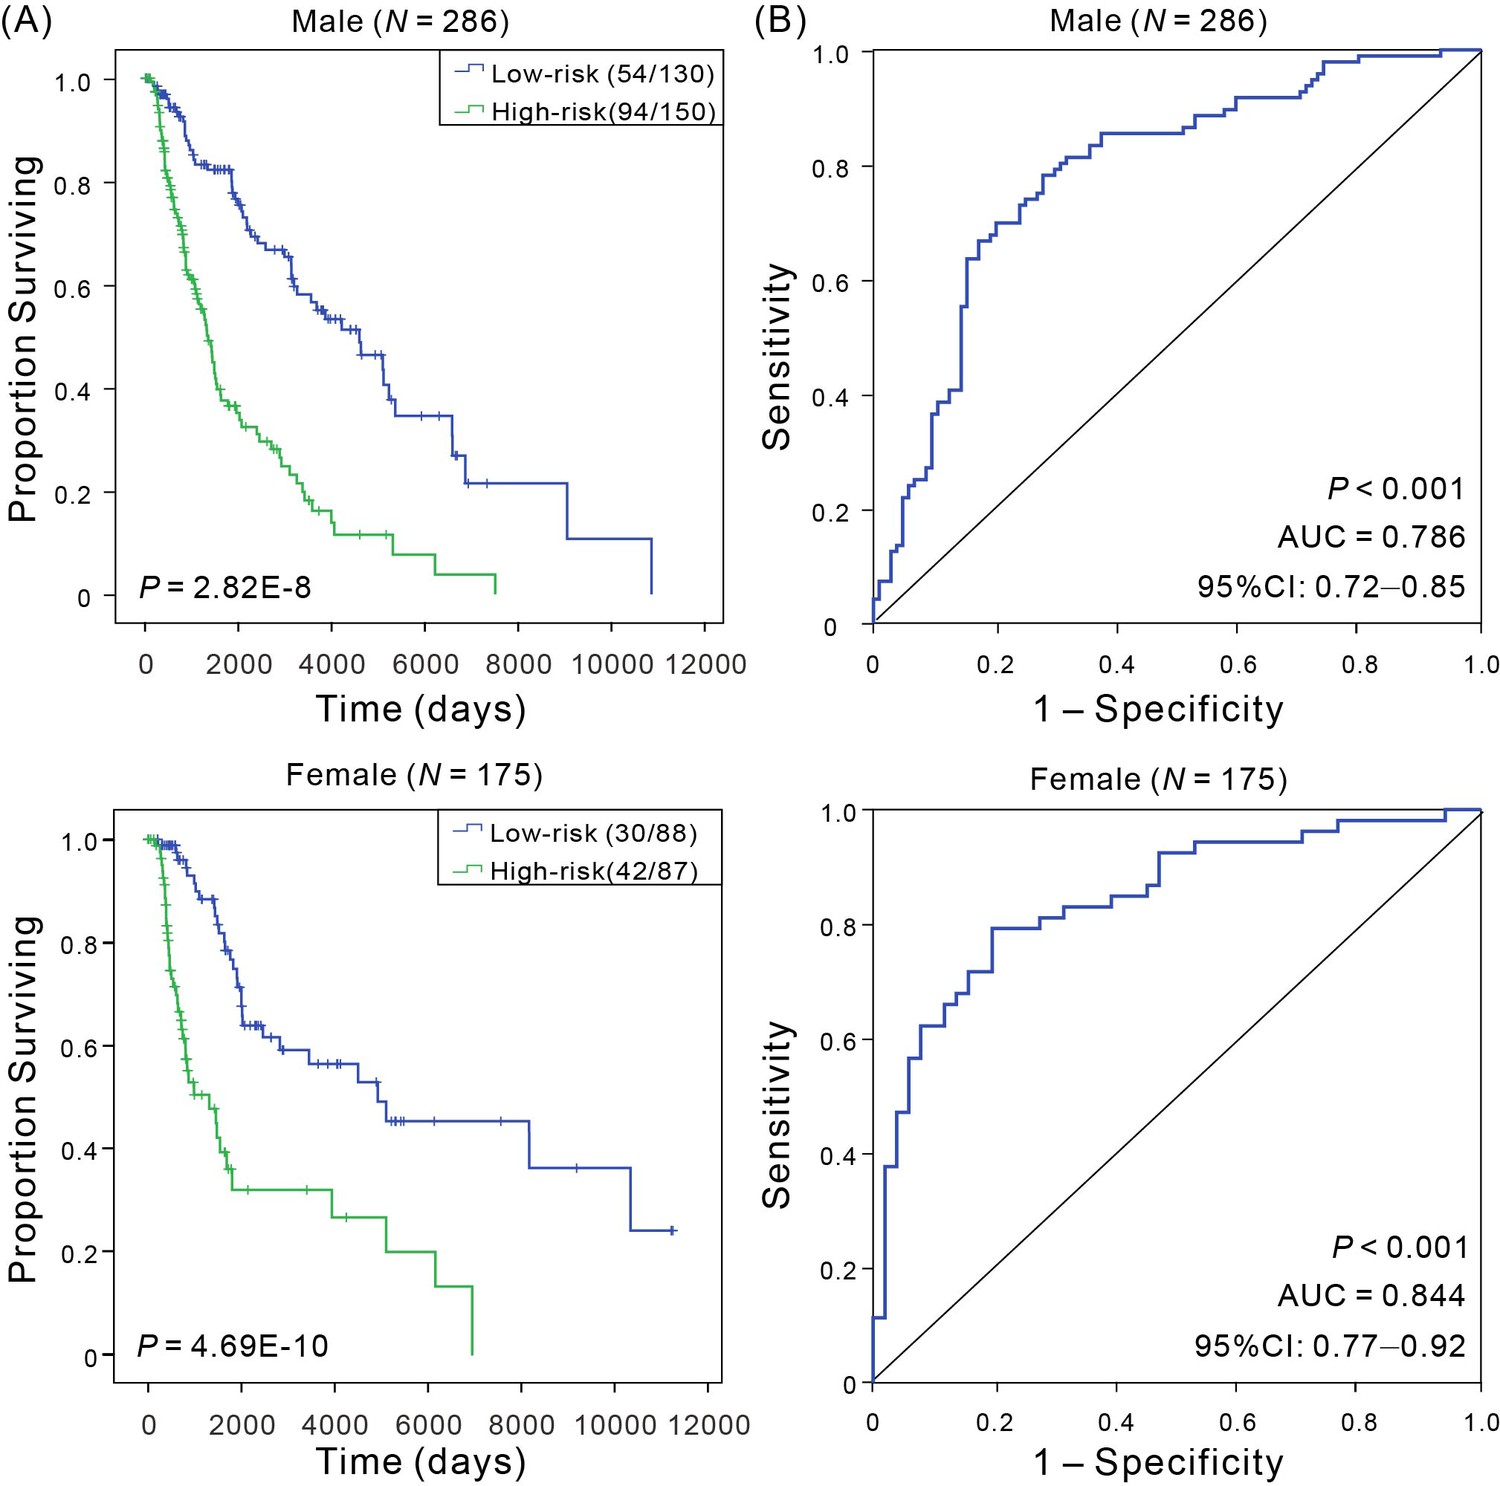
Kaplan–Meier and ROC analyses of CM patients in different sex groups.
(A) Kaplan–Meier estimates of the patients’ OS for low- and high-risk patient, and the OS differences between two groups were determined by Wilcoxon test; (B) ROC curves show the sensitivity and specificity of the signature in predicting the OS of patients.
Figure 3—figure supplement 2

Kaplan–Meier and ROC analyses of CM patients with tumor from different tissue sites.
(A) Kaplan–Meier analysis with Wilcoxon test was performed to estimate the differences in OS between the low- and high-risk patients. (B) ROC curves of the signature were used to demonstrate the sensitivity and specificity in predicting the OS of patients.
Figure 3—figure supplement 3
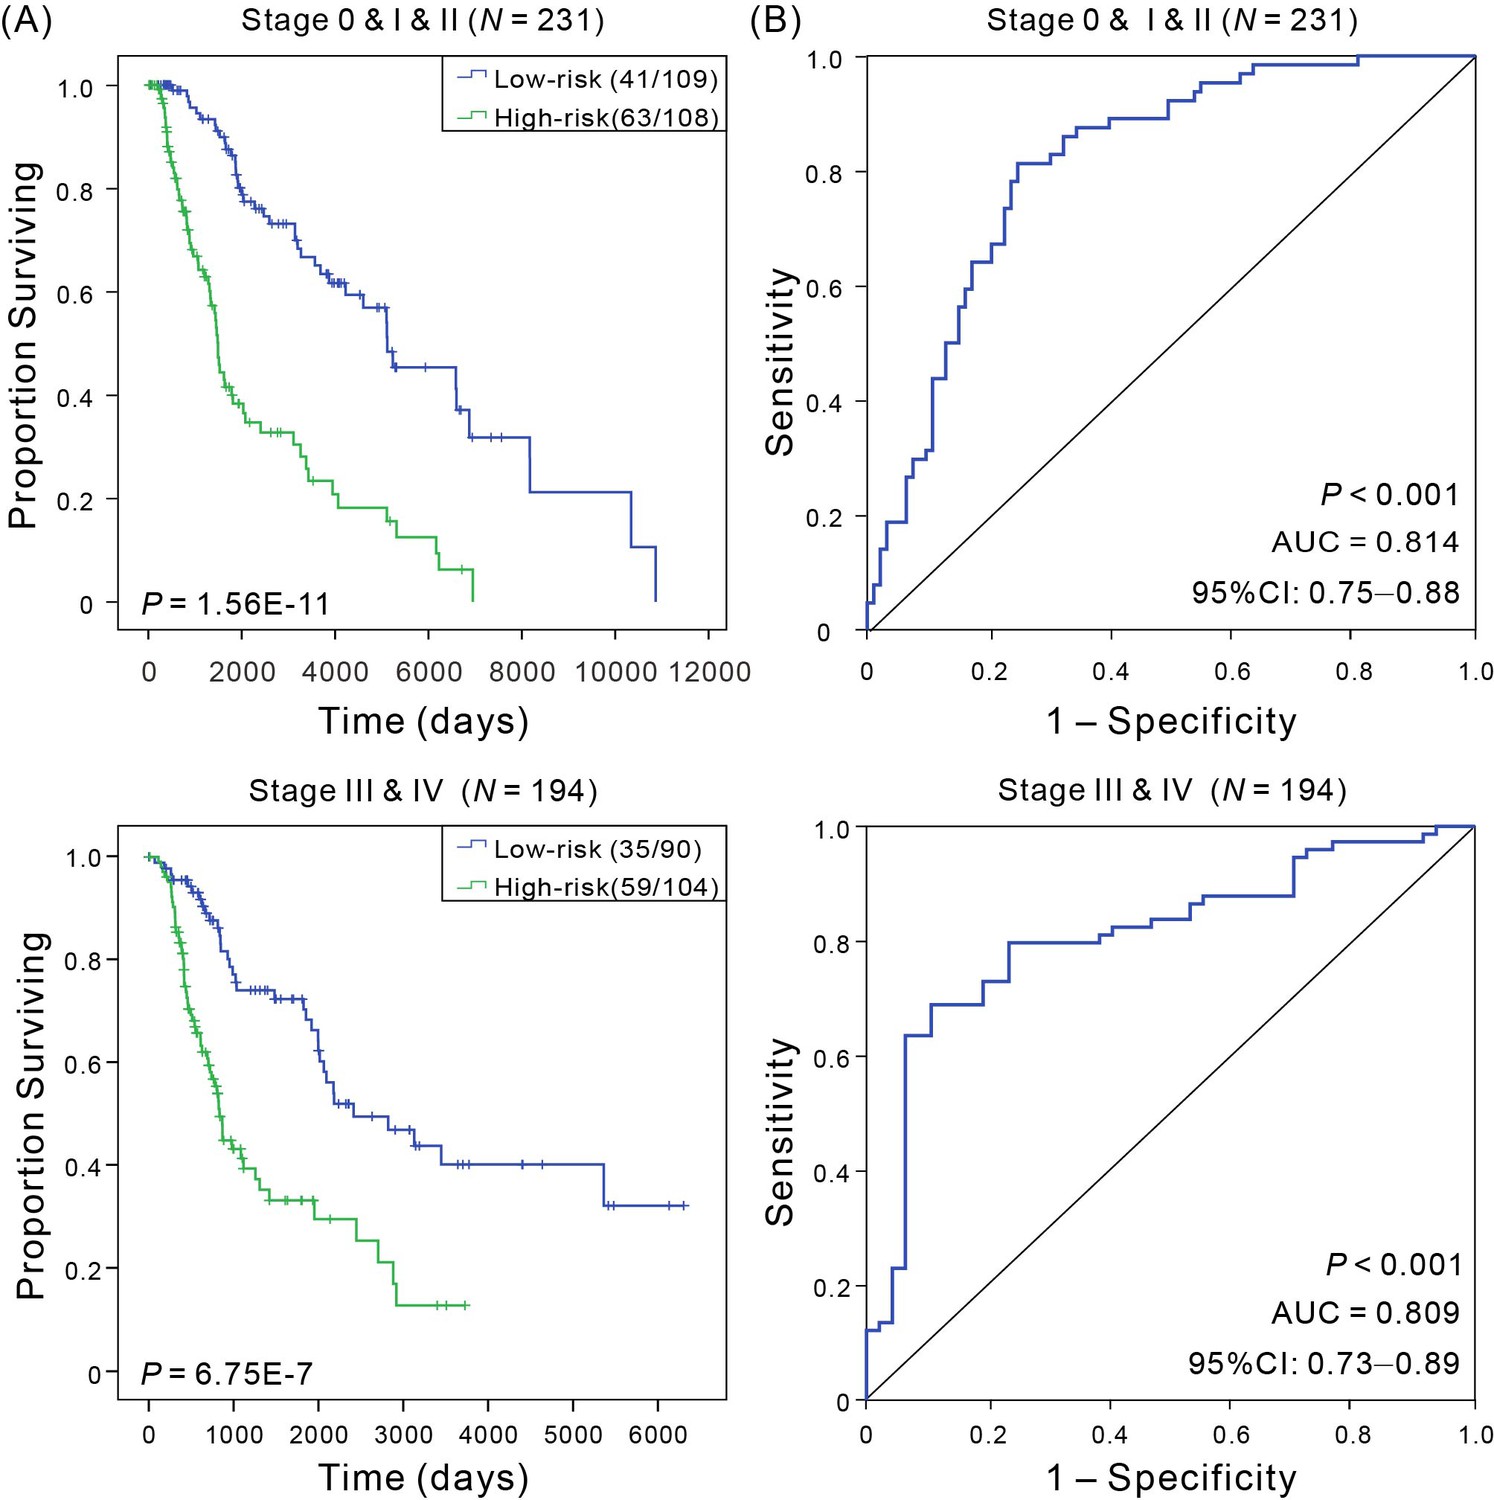
Kaplan–Meier and ROC analyses of CM patients in early stage cohorts (stage 0 and I and II, N = 231) and advanced stage (stage III and IV, N = 194).
(A) Kaplan–Meier estimates of the patients’ OS for low- and high-risk patient in different stage cohorts, and the OS differences between two groups were determined by Wilcoxon test; (B) ROC curves show the sensitivity and specificity of the signature in predicting the OS of patients.
Figure 3—figure supplement 4
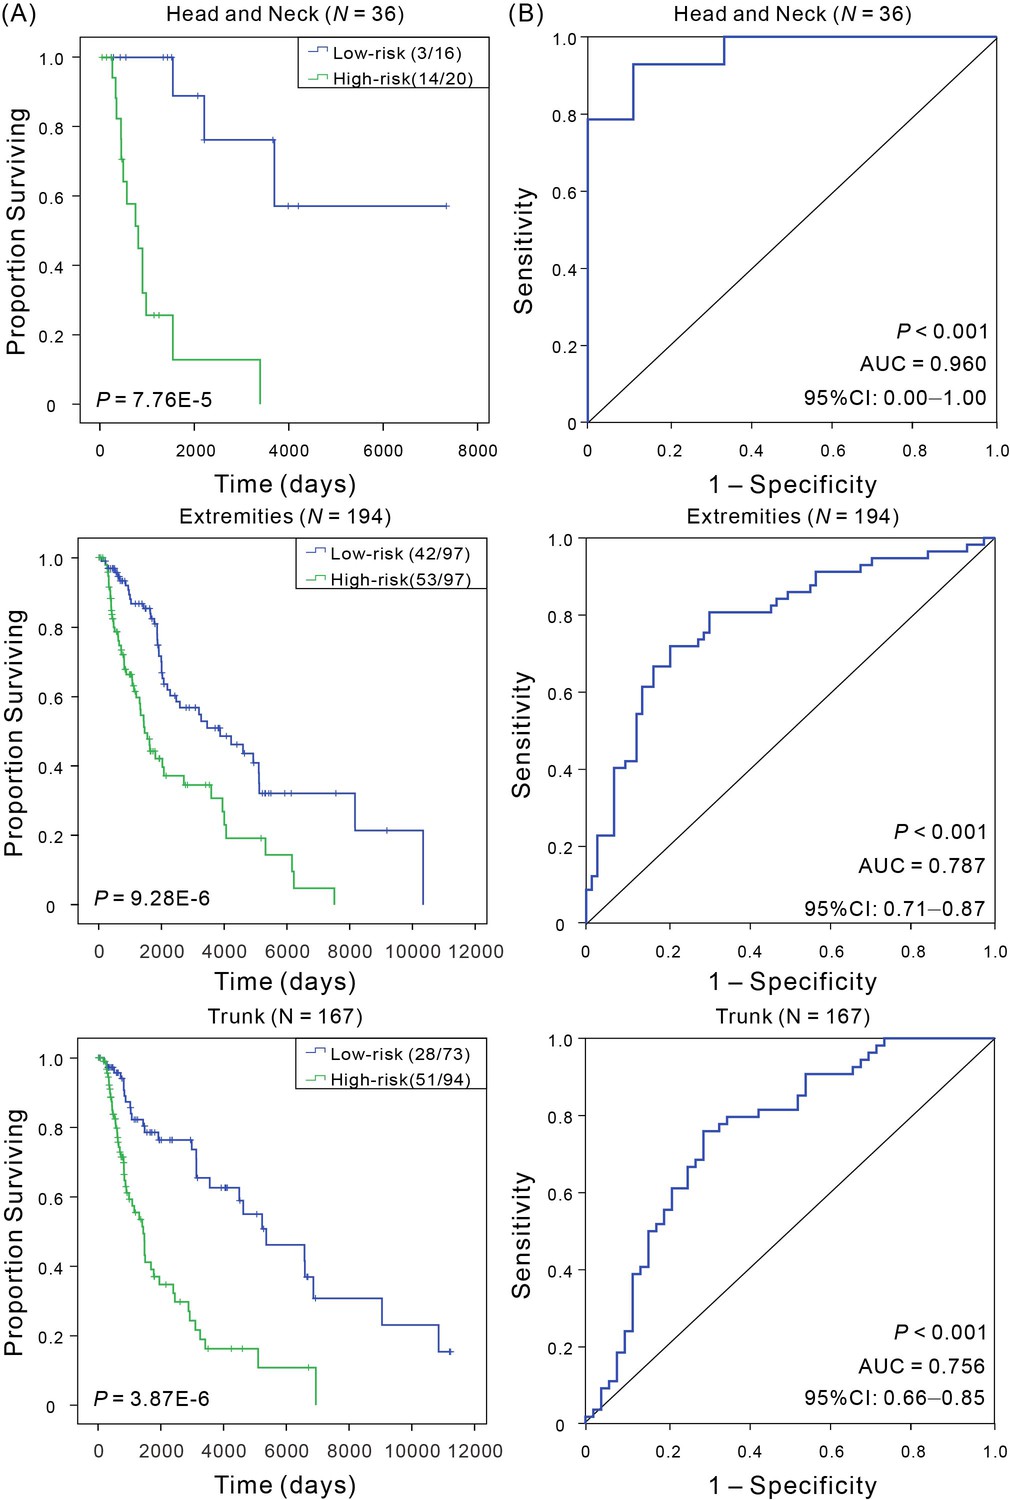
Kaplan–Meier and ROC analyses of CM patients with tumor from different anatomic sites.
(A) Kaplan–Meier analysis with Wilcoxon test was performed to estimate the differences in OS between the low- and high-risk patients. (B) ROC curves of the signature were used to demonstrate the sensitivity and specificity in predicting the OS of patients.
Figure 3—figure supplement 5

Kaplan–Meier and ROC analyses of CM patients with Breslow thickness, including <2 mm, 2–5 mm, and >5 mm.
(A) Kaplan–Meier analysis with Wilcoxon test was performed to estimate the differences in OS between the low- and high-risk patients. (B) ROC curves of the signature were used to demonstrate the sensitivity and specificity in predicting the OS of patients.
Figure 3—figure supplement 6
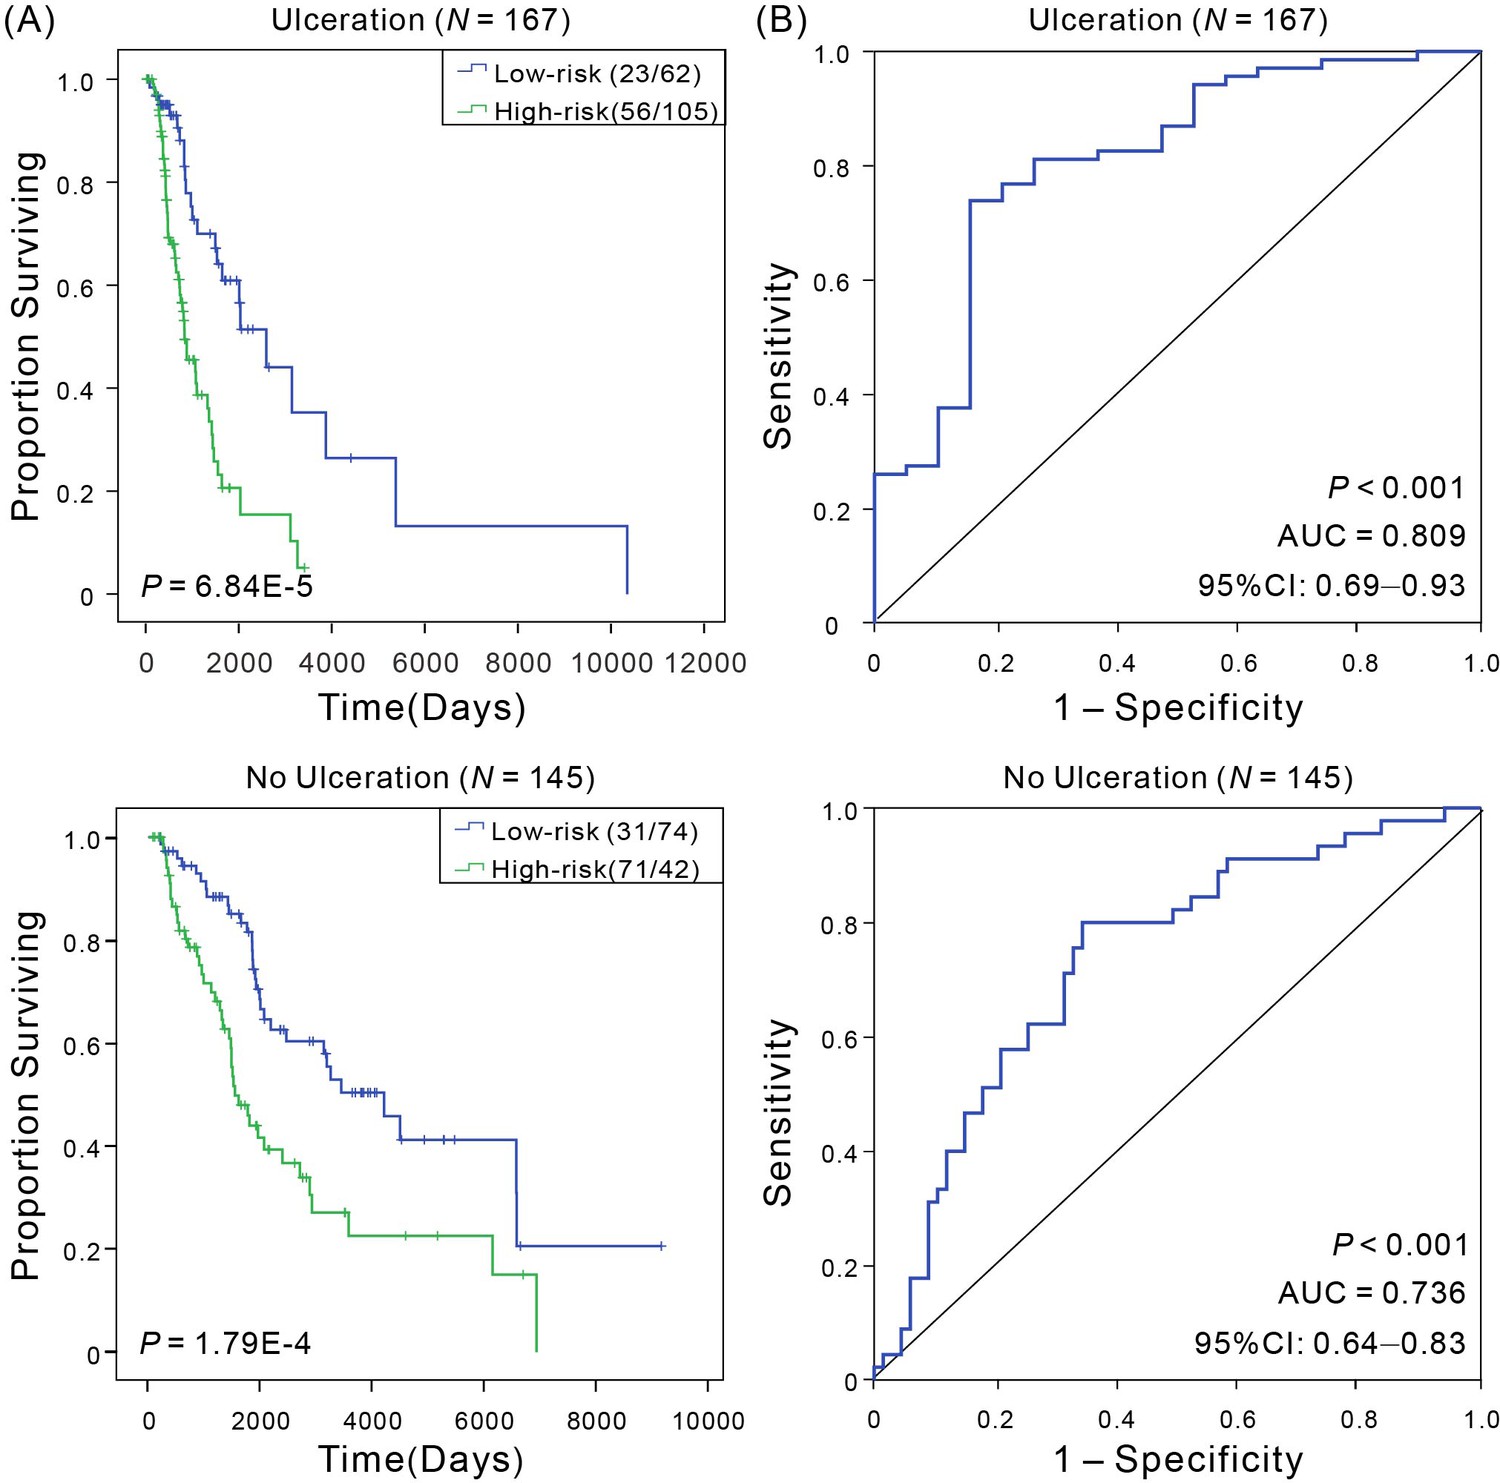
Kaplan–Meier and ROC analyses of CM patients with ulceration or no ulceration, respectively.
(A) Kaplan–Meier analysis with Wilcoxon test was performed to estimate the differences in OS between the low- and high-risk patients. (B) ROC curves of the signature were used to demonstrate the sensitivity and specificity in predicting the OS of patients.
Figure 3—figure supplement 7
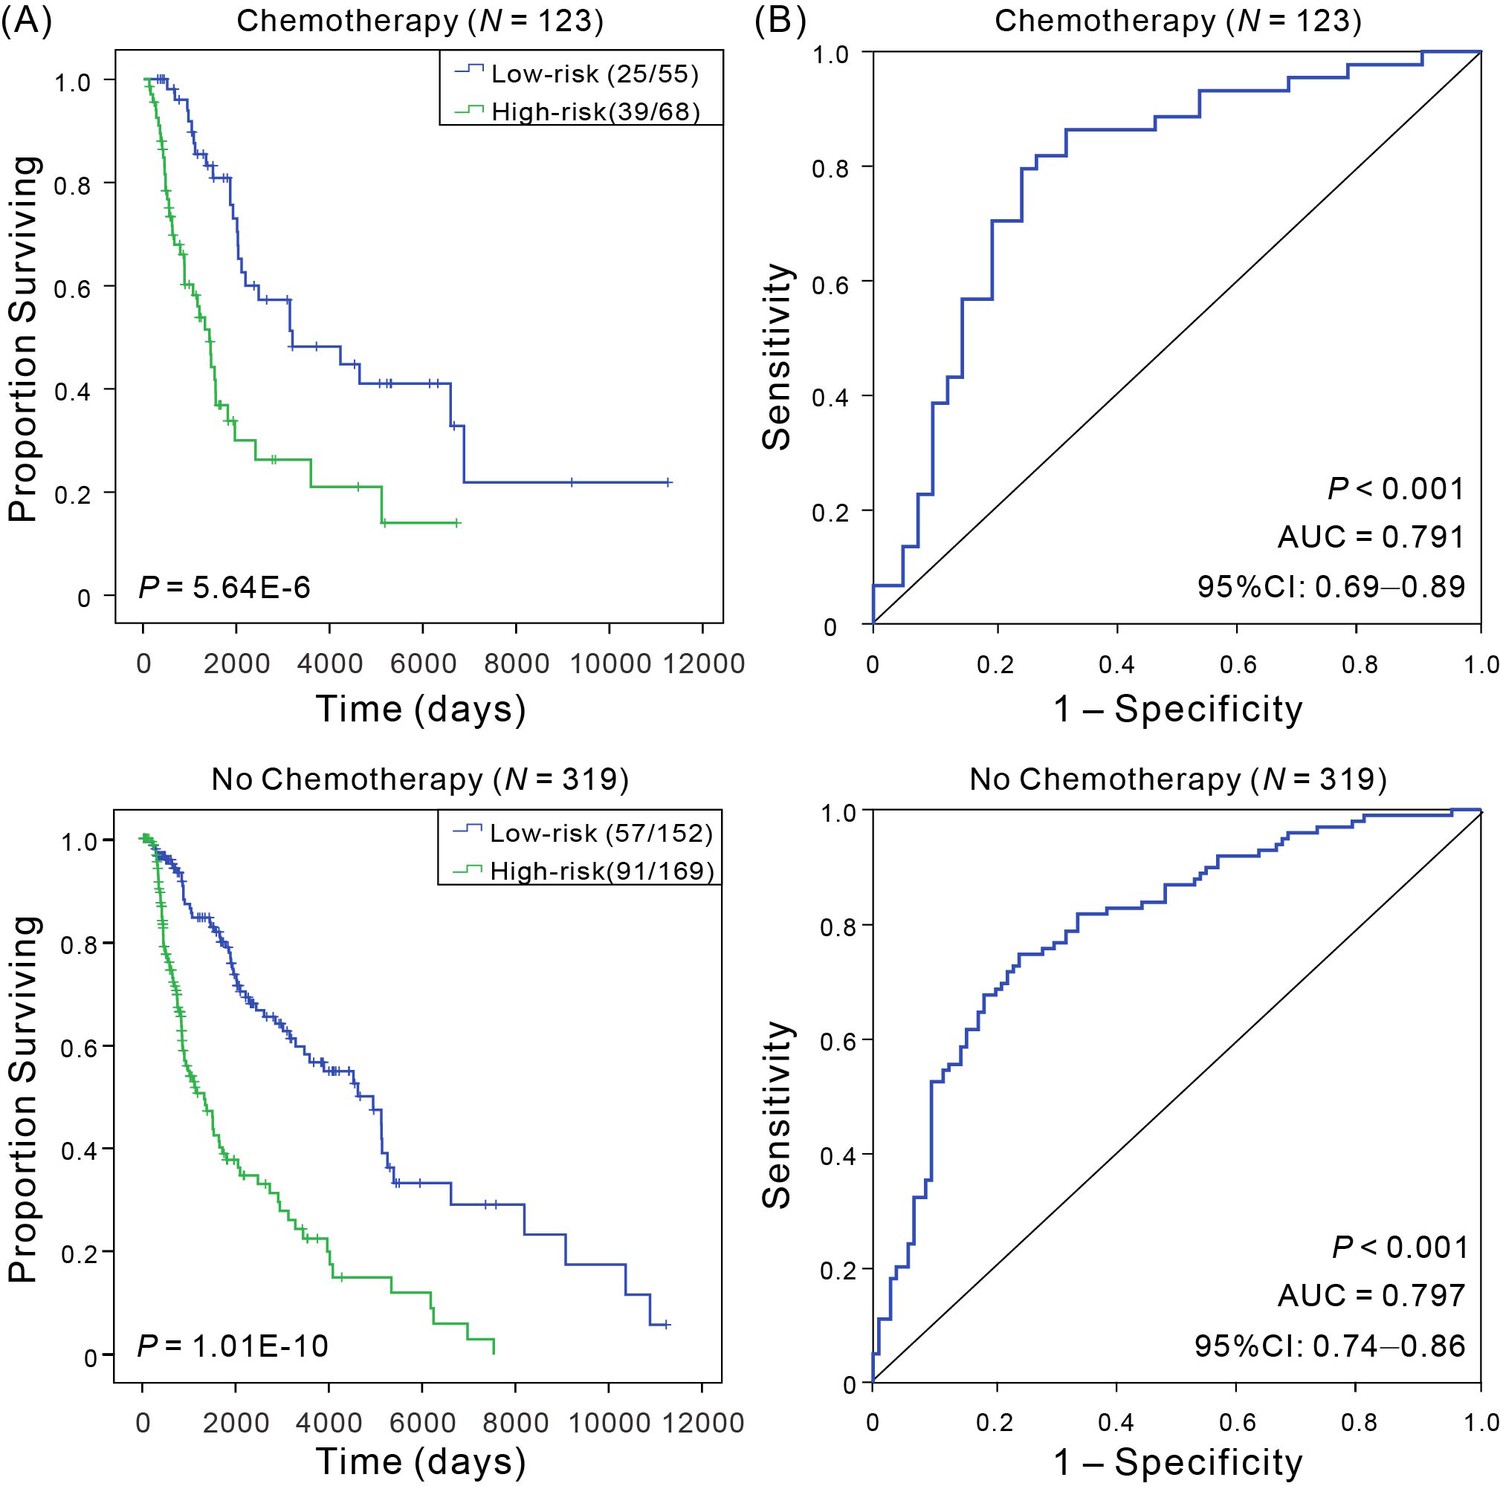
Kaplan–Meier and ROC analyses of CM patients received adjuvant chemotherapy or not, respectively.
(A) Kaplan–Meier analysis with Wilcoxon test was performed to estimate the differences in OS between the low- and high-risk patients. (B) ROC curves of the signature were used to demonstrate the sensitivity and specificity in predicting the OS of patients.
Figure 4
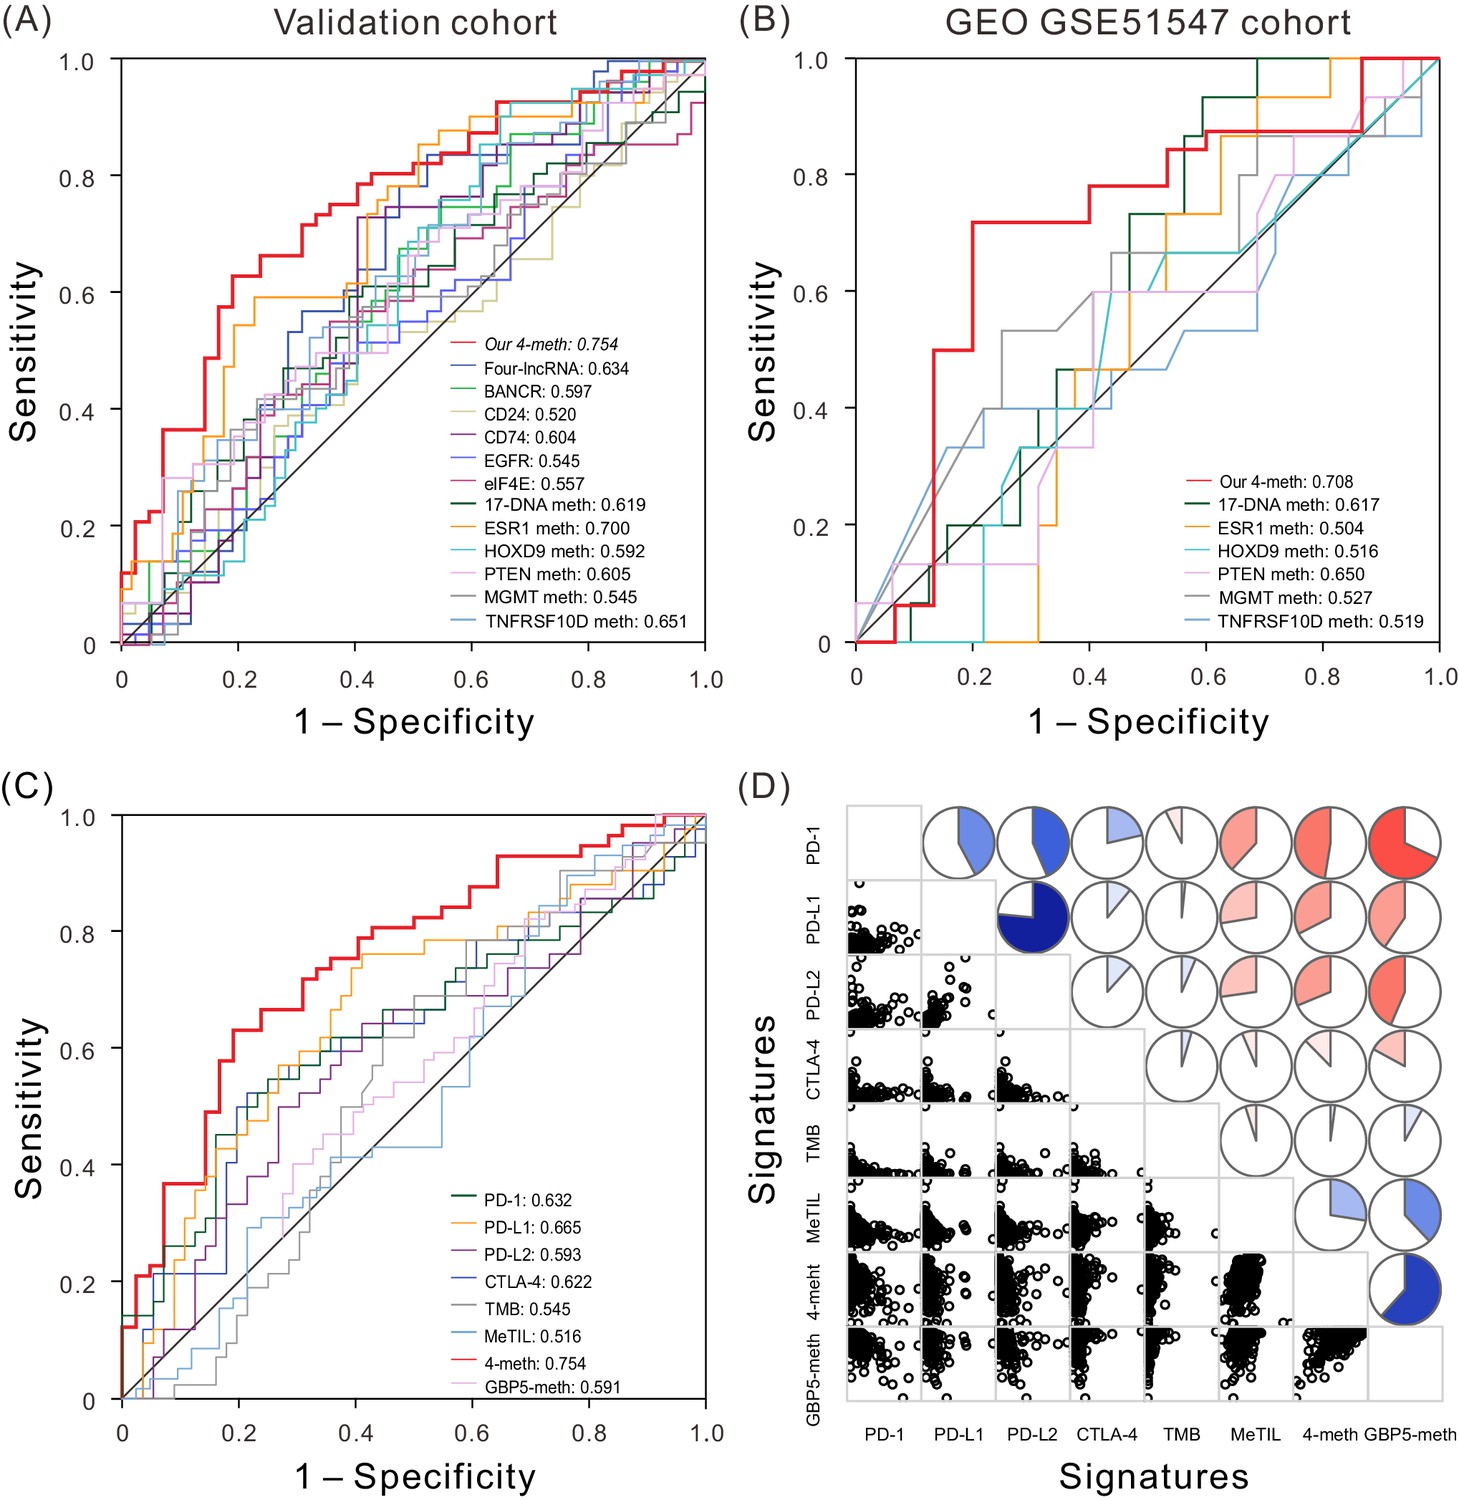
ROC and correlation analyses of different prognostic biomarkers.
(A) ROC curves show the sensitivity and specificity of our four-DNA methylation signature and other known biomarkers in predicting the OS of patients from TCGA validation dataset. (B) ROC curves of our four-DNA methylation signature and other known biomarkers in predicting the OS of patients from another independent cohort. (C) ROC curves of our four-DNA methylation signature, GBP5-meth, and known immune checkpoint genes, TMB and MeTIL in predicting the OS of patients from TCGA validation dataset. (D) Correlation analyses between known immune checkpoint genes, TMB and MeTIL, our four-DNA methylation signature, as well as GBP5-meth, one of our four DNA methylation sites. Lower triangle: scatter plots showing the correlation between two signatures. Upper triangle: circle symbols represent the one-to-one correlation coefficient; each correlation coefficient is shown by fill area and intensity of shading, which increases uniformly as the correlation value moves away from 0; blue for positive correlation, red for negative correlation.
-
Figure 4—source data 1
The OS and expression level or methylation level of the four-methylation signature and other known biomarkers in validation cohort.
- https://doi.org/10.7554/eLife.44310.030
-
Figure 4—source data 2
The OS and methylation level of the four-methylation signature and other known biomarkers in an independent cohort (GSE51547).
- https://doi.org/10.7554/eLife.44310.031
-
Figure 4—source data 3
The OS, our four-DNA methylation signature, GBP5-meth, and known immune checkpoint genes, TMB and MeTIL for patients for patients from TCGA validation dataset.
- https://doi.org/10.7554/eLife.44310.032
-
Figure 4—source data 4
The four-DNA methylation signature, GBP5-meth, and known immune checkpoint genes, TMB and MeTIL for patients from TCGA dataset.
- https://doi.org/10.7554/eLife.44310.033
Tables
Table 1
Clinicopathological characteristics of CM patients from TCGA database.
https://doi.org/10.7554/eLife.44310.002| Characteristics | Groups | Patients | |||||
|---|---|---|---|---|---|---|---|
| Total (N = 461) | Training cohort (N = 307) | Validation cohort (N = 154) | |||||
| No | % | No | % | No | % | ||
| Sex | Male | 286 | 62.04 | 195 | 63.52 | 89 | 57.79 |
| Female | 175 | 37.96 | 112 | 36.48 | 65 | 42.21 | |
| Age at diagnosis | Median | 58 | 58 | 58 | |||
| Range | 15–90 | 15–90 | 19–90 | ||||
| ≤58 | 234 | 50.76 | 154 | 50.16 | 80 | 51.95 | |
| >58 | 227 | 49.24 | 153 | 49.84 | 74 | 48.05 | |
| Tumor tissue site | Primary tumor | 104 | 22.56 | 76 | 24.76 | 28 | 18.18 |
| Regional cutaneous or subcutaneous tissue | 73 | 15.84 | 51 | 16.61 | 22 | 14.29 | |
| Regional lymph node metastasis | 216 | 46.85 | 154 | 50.16 | 62 | 40.26 | |
| Distant metastasis | 65 | 14.10 | 23 | 7.49 | 42 | 27.27 | |
| Unknown | 3 | 0.65 | 3 | 0.98 | 0 | 0.00 | |
| Pathologic stage | 0 | 6 | 1.30 | 5 | 1.63 | 1 | 0.65 |
| I | 75 | 16.27 | 53 | 17.26 | 22 | 14.29 | |
| II | 139 | 30.15 | 92 | 29.97 | 47 | 30.52 | |
| III | 171 | 37.09 | 117 | 38.11 | 54 | 35.06 | |
| IV | 23 | 4.99 | 13 | 4.23 | 10 | 6.49 | |
| Unknown | 47 | 10.20 | 27 | 8.79 | 20 | 12.99 | |
| Anatomic site | Head and neck | 36 | 7.81 | 21 | 6.84 | 15 | 9.74 |
| Extremity | 194 | 42.08 | 129 | 42.02 | 65 | 42.21 | |
| Trunk | 167 | 36.23 | 117 | 38.11 | 50 | 32.47 | |
| Others/Unknown | 64 | 13.88 | 40 | 13.03 | 24 | 15.58 | |
| Breslow thickness (mm) | <2 | 126 | 27.33 | 85 | 27.69 | 41 | 26.62 |
| 2–5 | 124 | 26.90 | 79 | 25.73 | 45 | 29.22 | |
| >5 | 106 | 22.99 | 78 | 25.41 | 28 | 18.18 | |
| Unknown | 105 | 22.78 | 65 | 21.17 | 40 | 25.97 | |
| Ulceration | Present | 167 | 36.23 | 120 | 39.09 | 47 | 30.52 |
| Absent | 145 | 31.45 | 100 | 32.57 | 45 | 29.22 | |
| NA/Unknown | 149 | 32.32 | 87 | 28.34 | 62 | 40.26 | |
| Chemotherapy | Yes | 123 | 26.68 | 70 | 22.80 | 53 | 34.42 |
| NO | 319 | 69.20 | 227 | 73.94 | 92 | 59.74 | |
| Unknown | 19 | 4.12 | 10 | 3.26 | 9 | 5.84 | |
| Vital Status | Alive | 241 | 52.28 | 167 | 54.40 | 74 | 48.05 |
| Dead | 220 | 47.72 | 140 | 45.60 | 80 | 51.95 | |
Table 2
Results of Kaplan–Meier and ROC analyses based on various regrouping methods.
https://doi.org/10.7554/eLife.44310.028| Regrouping factors | Group | Sample size | Kaplan–Meier P-value | AUC | 95% CI of AUC |
|---|---|---|---|---|---|
| Sex | Male | 286 | 4.69E-10 | 0.786 | 0.72–0.85 |
| Female | 175 | 2.82E-08 | 0.844 | 0.77–0.92 | |
| Age at diagnosis | ≤50 | 141 | 3.46E-06 | 0.792 | 0.71–0.88 |
| 51–70 | 202 | 1.14E-07 | 0.816 | 0.74–0.89 | |
| >70 | 118 | 1.75E-05 | 0.807 | 0.70–0.92 | |
| Tumor metastasis site | Distant metastasis | 65 | 2.63E-03 | 0.836 | 0.73–0.94 |
| Regional cutaneous or subcutaneous tissue | 73 | 1.79E-09 | 0.859 | 0.76–0.96 | |
| Regional lymph node metastasis | 216 | 2.01E-07 | 0.749 | 0.67–0.83 | |
| Pathologic stage | 0 and I and II | 231 | 1.56E-11 | 0.814 | 0.75–0.88 |
| III and IV | 194 | 6.75E-07 | 0.809 | 0.73–0.89 | |
| Anatomic site | Head and neck | 36 | 7.76E-05 | 0.960 | 0.00–1.00 |
| Extremity | 194 | 9.28E-06 | 0.787 | 0.71–0.87 | |
| Trunk | 167 | 3.87E-06 | 0.756 | 0.66–0.85 | |
| Breslow thickness (mm) | <2 | 126 | 1.83E-06 | 0.830 | 0.74–0.92 |
| 2–5 | 124 | 1.79E-04 | 0.742 | 0.64–0.85 | |
| >5 | 106 | 1.31E-02 | 0.808 | 0.65–0.96 | |
| Ulceration | Present | 167 | 6.84E-05 | 0.809 | 0.69–0.93 |
| Absent | 145 | 1.79E-04 | 0.736 | 0.64–0.83 | |
| Chemotherapy | Yes | 123 | 5.46E-06 | 0.791 | 0.69–0.79 |
| NO | 319 | 1.10E-10 | 0.797 | 0.74–0.86 |
Additional files
-
Source code 1
Univariate Cox proportional hazard analysis source code.
- https://doi.org/10.7554/eLife.44310.034
-
Source code 2
Multivariate Cox proportional hazard analysis source code.
- https://doi.org/10.7554/eLife.44310.035
-
Supplementary file 1
Four significantly survival-related methylation sites in training dataset.
- https://doi.org/10.7554/eLife.44310.036
-
Supplementary file 2
The ROC results of four-DNA methylation signature and other known biomarkers.
- https://doi.org/10.7554/eLife.44310.037
-
Supplementary file 3
The correlation raw P values and adjusted P values with the Bonferroni correction between our 4-meth signature and other known signatures.
- https://doi.org/10.7554/eLife.44310.038
-
Transparent reporting form
- https://doi.org/10.7554/eLife.44310.039
Download links
A two-part list of links to download the article, or parts of the article, in various formats.
Downloads (link to download the article as PDF)
Open citations (links to open the citations from this article in various online reference manager services)
Cite this article (links to download the citations from this article in formats compatible with various reference manager tools)
A four-DNA methylation biomarker is a superior predictor of survival of patients with cutaneous melanoma
eLife 8:e44310.
https://doi.org/10.7554/eLife.44310


